Abstract
Wireless networks connect various devices through radio waves in which the network connection may have different structures. Moreover, the network structure is determined based on the placement areas of the network elements, which can be affected by the building and their locations. However, the numerical characteristic which describe the features of the real environment and allow them to be related to the properties of the model are still a challenge that has not been well addressed. To this end, in this paper, we analyze the modeling problems related to the structure of user placement in the access network. Our proposed solution is based on a description of the user environment structure in which cities in the form of buildings and constructions are considered as a typical environment. We propose a new model for addressing the wireless network structure in an efficient manner in which the features of the environment are considered, which are numerically expressed in the form of the Hurst parameter or fractal dimension. In addition, the fractal dimension, geometric fractals, and the characteristics of the user’s distribution territory and urban development are efficiently utilized. Then, we analyze the influence of the fractal properties of the environment on the structure of promising communication networks; in particular, on the structure of the Internet of Things network. Finally, simulation results proved that the proposed model is considered as a beneficial solution for modeling mobile communication and wireless access networks, including fifth-generation networks.
1. Introduction
5G is considered the next generation of wireless network technology that has a significant effect on the development of communication networks. In addition, a large proportion of users can access the communication networks through wireless technologies that lie on the 5G networks and networks of a more distant future [1,2]. Furthermore, due to the ongoing advancement of the wireless communication technologies, it makes them more suitable and appropriate to implement a wide variety of services, including tactile Internet, virtual and augmented reality services. In addition, it connects a large number of users, whose growth is dictated by the development of the Internet of Things [3,4]. Moreover, the advancement of communication technologies at the level of subscriber access is a core factor that defines the capacity of the communication network as a whole. Most often, bottleneck is the access section of the subscriber, which limits the possibilities in terms of data transfer rate, and number of served users [5].
The evolution of communication networks has demonstrated that the development of the subscriber access level technology can be characterized by the main two points, which are development of new frequency ranges, and access point (base station) approach to the user. This is becoming achievable due to the advancement of technology for the installation of communication equipment and antenna systems, which, on the one hand, are becoming more functional and, on the other hand, less expensive, making it easier to rationalize the distribution of equipment within the communication network [6].
The development of new millimeter bands through 5G networks enables the bandwidth of the transmitted signals to be expanded, and the throughput of the access channels to be significantly increased [7,8]. However, when constructing networks, it is also necessary to consider the nature of the transmission of millimeter waves and to use technical solutions to reduce the negative impact of specific properties [9,10,11]. In particular, when building access networks use millimeter waves, some issues should be addressed which are: attention should be given to their considerably higher attenuation in the propagation medium, the probability of creating a narrow antenna radiation pattern, and blocking the propagation of even comparatively small obstacles. These issues are extensively discussed in the literature [12], where a set of proposals are made in terms of effective organization and management of the access network, taking into account the above considerations.
Naturally, the conditions under which these networks are established are of paramount importance in organizing a subscriber access network. These conditions are determined by two key components, which are users and the environment. In addition, each of the quiet components may have many characteristics that describe their state and behavior. However, for virtually all wireless communication networks, the characteristics of the spatial distribution of these elements are mandatory. Undoubtedly, the distribution of users across the serviced area is the most significant factor in the choice of access point locations. The distribution across the territories of infrastructure and other facilities that have an impact on the propagation of radio signals is the same aspect. These characteristics are of particular importance when using millimeter waves, because any object, including the user himself, may cause the signal to be blocked. In this case, ensuring communication stability is accomplished through the use of multiple access points, adaptive antenna pattern control [10], and probably other approaches. Further, ensuring that the signal is within reach of the receiver with an acceptable level of attenuation and interference. In this case, the primary role is required to plan and manage the network as well as make it possible to increase its efficiency by rationally positioning fixed and mobile base stations.
Consequently, the solution to these presets is directly related to the analysis of the distribution of users and the environment. In addition, users in an access network or nodes in a wireless sensor network are modeled by point processes, such as a Poisson field or fields with other properties. However, the numerical characteristic that describe the features of the real environment and allow them to be related to the properties of the model are not addressed. Therefore, adequate models are required to solve these problems, taking into account the characteristics of users and the environment. Motivated by such considerations, in this paper, we propose a new model for addressing the wireless network structure in an efficient manner. More specifically, the paper considers a general approach to modeling an access network, taking into account the features of the environment, which are numerically expressed through the fractal dimension. This approach is applicable to a wide variety of situations, such as the external urban structure (buildings, streets, structures), the territory inside buildings (rooms, corridors, halls, interior walls), and open suburban area (hills, forest plantations, mountains, hills, individual buildings) …. As an example, the paper provides a model of an external network for an urban structure.
In our work, we are not talking about heterogeneous distribution, but about the uneven distribution of users, which most often occurs in real networks. It is also quite difficult to describe this unevenness since, in the known models, there is no numerical characteristic to take into account the nature of this irregularity. The Hurst parameter and fractal dimension also allow us to give its numerical description.
The main contributions of this study are summarized as follows:
- We propose a new model for addressing the wireless network structure in an efficient manner in which the fractal dimension, geometric fractals, Hurst parameter, and the characteristics of user’s distribution territory and urban development are utilized.
- We analyze the influence of the fractal properties of the environment on the structure of promising communication networks; in particular, on the structure of the Internet of Things network.
- Finally, simulation results proved that the proposed model is considered as a beneficial solution for modeling mobile communication and wireless access networks, including fifth-generation networks.
2. Related Works
Recently, the challenges of modeling the structure of a wireless network draw special attention due to their constant importance in the development of both mobile networks and other wireless networks. In addition, the choice of the network structure has a noteworthy effect on the overall performance. However, significant efforts have been made to address these challenges. In this section, a brief overview of the related works will be given below.
In particular, Vikulov et al. [13,14] proposed two models for ensuring the efficiency of a wireless broadband access networt. These models are based on the orthogonal frequency-division multiplexing (OFDM) channel, which can allow for solving the optimizing problem of channel parameters (frame length) in which the inter-channel interference is considered. In addition, it is possible to improve the efficiency of network planning by taking into account data about the existing environment and users.
Methods for ensuring the efficiency of solving problems of out-of-band clustering of devices in 5G networks are described in [15,16], in which the authors analyzed the solutions to the clustering problem based on data on the position of user terminals by two methods and compared the solutions obtained. Simultaneously, the uniform and normal distribution of users over the served territory are also considered. Whereas, the wireless network of the Internet of Things with mobile nodes from the point of view of structure stability has been analyzed in [9]. The authors proposed methods for choosing the structure of routes that increase their stability in conditions of the mobility of network nodes.
Furthermore, in [17,18], Mahmood et. al. analyzed the characteristics of a network built using D2D communications in a high density of subscribers. They considered IoT networks with high user density and assess the impact of user density on the structure of traffic routes.
More recently, a model of a 5G access network is proposed in [19,20] in which the influence of blocking of the radio signal by mobile objects (users) is considered, while the authors used a Poisson point process (uniform distribution in the service area) as a model for a group of subscribers.
It is seen from the above review of related work, users in an access network or nodes in a wireless sensor network are modeled by point processes, such as Poisson field or fields with other properties. However, the researcher does not have a numerical characteristic that would describe the features of the real environment and allow them to be related to the properties of the model. In addition, most of the works are aimed at increasing the efficiency of the access network by choosing the parameters of the channel or its structure under the conditions of a given distribution of users. Moreover, in most cases, this distribution is assumed to be uniform. Despite the usefulness of such solutions, it should be noted that in most cases, the distribution of users is uneven, and in some cases, the assumptions made can significantly differ the models from real structures. Therefore, in this paper, we propose a model for the distribution of users over the service area, taking into account the features of the environment, which are numerically expressed in the form of the Hurst parameter or fractal dimension. These properties can be estimated numerically in the target environment and also reflected numerically in its model. This allows us to approximate the properties of the model to the properties of the environment it describes.
3. Task Statement
In this section, the task statement is described, where each individual case may be unique when building a mobile communication network, and in any case, a decision about the choice of the locations of the base stations is made. However, in networking scenarios, many similarities can be found. Obviously, there is something in common for building networks inside the city, outside the city, along highways, indoors, etc. The generality of these cases is dictated by the density of users and the structure of the environment. Having a summary of the distribution of users and the characteristics of the system, it is thus possible to describe those cases and to identify their features and characteristics.
We should obviously determine where we want to create a network: outdoors or indoors. It should be noted that, in this case, the distinction between the network outside or inside the premises is important, but not essential, since it is determined based on the characteristics of the user’s environment. These features are different for an indoor or outdoor network. Therefore, without compromising generality, one of these alternatives may be chosen. We would also accept the first alternative, i.e., the outdoor network.
Let us assume that users are evenly distributed over the territory where they can be located, i.e., on the territory outside the building elements (buildings and other structures). Uniform distribution of users on the plane occurs where the coordinates along the abscissa and coordinate axes are arbitrary, independent, and distributed according to a uniform distribution. Such a distribution is also referred to as the Poisson field or Poisson point process [21]. The probability that k points (users) will fall to any region s is defined only by the area of that region and is calculated by the Poisson formula:
where is the number of users per unit area (density), S is the area of the region. However, if there are structures in the service area, which are also generally randomly distributed, this probability becomes dependent on the chosen coordinates. In general, it can be described by the conditional probability
where is the area occupied by the i-th building, n is the number of buildings.
Figure 1 shows an illustration of this distribution.
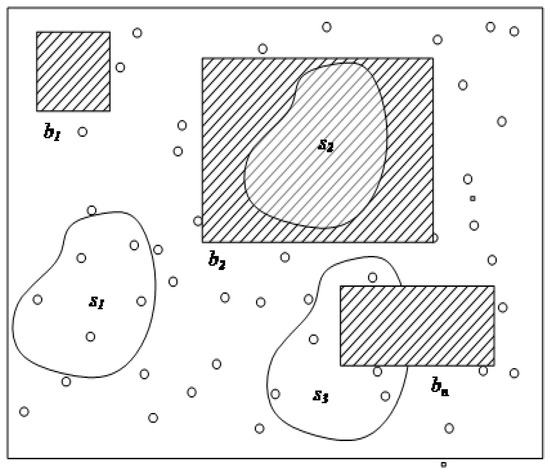
Figure 1.
Users’ distribution in the service area.
The highlighted area corresponds to the first case , the second area to the case , the third area to the case .
It can be shown that if are random and independent, then the resulting distribution of users is a Markov Modulated Poisson Process (MMPP) [22].
However, if the properties of the environment described by differ from those indicated, the resulting process will have different properties. This is quite expected, as the distribution of users across the territory under consideration, taking into account its structure, is increasingly unequal. Moreover, the properties of this distribution depend on the properties of urban development.
For any particular instance, the features of the environment are different. However, the degree of variation between one structure of the environment and another will not be important. In this context, in order to build a mobile network, it might be useful to be able to describe the environment in a certain manner, which would facilitate the comparison of different territories and the choice of typical solutions.
Therefore, in order to describe the properties of the distribution of users across the service area, it is necessary, under the assumptions made, to describe the characteristics of the distribution of buildings and structures. It is obvious that the description of certain characteristics, such as geographic coordinates and the size of buildings, makes it possible to provide a full view, but it is too difficult to compare problems and to make decisions. It is also best to use a numerical function that provides an indication of the characteristics of the environment and allows for numerical comparison of conditions for making decisions on building a network.
4. Network Model
In this section, first, we will provide the environment model for our structure. Afterward, a user distribution model is introduced.
4.1. Environment Model
Let us begin with an introduction of the environment model in which, when constructing a network model, we can start from the conditions of urban infrastructure, considering that elements such as walls of buildings and other structures are obstacles to the propagation of radio signals. These elements incorporate external attenuation, the sum of which might be significant. We will also assume that the considered elements of the access network (subscribers of the mobile communication network, the Internet of things) are located at arbitrary points and are outside these elements.
It is easy to see that the key elements of the image on the maps of settlements are a rectangle or line segments connected at right angles. It is also easy to notice that when you change the scale, i.e., enlargement of the object, a building, a quarter, a micro-district, in general, its shape is almost preserved. This allows us to conclude that these structures are self-similar, which is typical for elements of fractal geometry.
The problem of numerically describing natural and artificial forms is well known, for example, as the “coastline paradox” [23]. In particular, the issue posed is that an increase in the accuracy of measuring the length of the coastline contributes to an increase in its numerical estimation. Thus, the length does not give the object a sufficiently complete characterization, especially when it is necessary to compare the objects.
This problem has led to the emergence of such a characteristic as a fractal dimension. For example, as shown in the literature [24,25], we can talk about comparing the shape of the coastline of Norway and Great Britain. The fractal dimensions of Hausdorff are 1.52 and 1.30, respectively. Figure 2 shows fragments of the coastlines of Norway and Great Britain according to data from the Google Earth system [26].
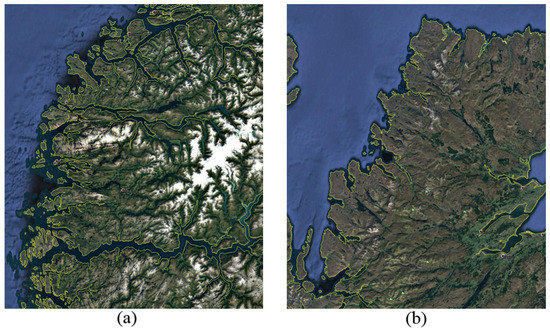
Figure 2.
Fragments of the coastline of Norway (a) and Great Britain (b).
As you can see from the above figures, these lines differ significantly. In particular, it is recognized that the coastline of Norway is the longest in Europe. This can be clearly seen from the above fragments, the shape of the coastline of Norway is varying more from a straight line than the shape of the coastline of Great Britain. Estimates of the fractal dimension describe these variations numerically.
The user distribution model in the service area should be associated with the environment model, such as buildings and other structures in the urban structure or to other natural features of the terrain (hills, mountains, water bodies, etc.). For this purpose, let us first consider a model of the user’s environment in a typical urban structure.
Similar to the case of coastline, the user environment in an urban structure is an obstacle to both user placement (walls of buildings and structures) and signal propagation. These obstacles form a kind of geometric figure whose boundary outline, like the outline of the coastline, determines the characteristics of the given environment. Considering this analogy, it is very common to extend the idea of the fractal dimension to the definition of the properties of the system.
In this work, we propose to use geometric fractals in the problem of modeling the network structure. In particular, if the elements of the described structure are mainly flat rectangular elements, structures such as the Peano curves or the Sierpinski carpet [27,28] can be considered, as shown in Figure 3.
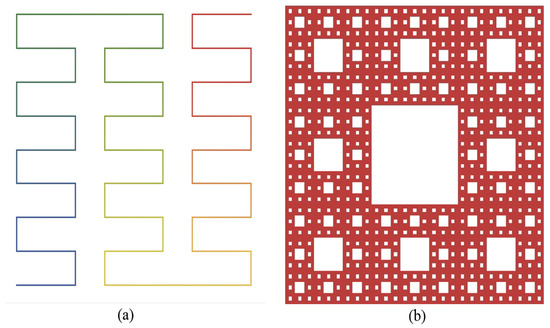
Figure 3.
Peano curve (a) and Sierpinski carpet (b).
Figure 4a depicts a fragment of a city map image (St. Petersburg, Russia), in which buildings and open areas (courtyards, sidewalks, carriageways) are highlighted. Figure 4b shows the fragment of the Hilbert curve [25].
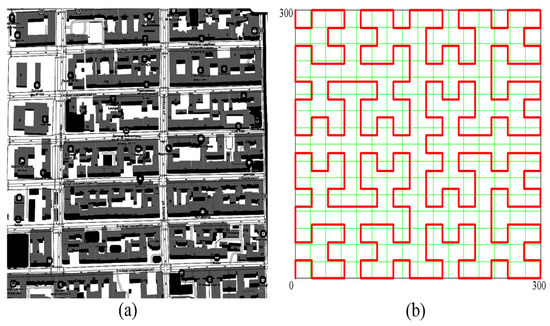
Figure 4.
Fragment of the city plan (a) and a fragment of the Hilbert curve (b).
In modeling, we will assume that the curve line simulates an obstacle. The line does not have a width. However, when selecting the location of the mesh elements, a conditional minimum distance between the mesh element and the points of the curve (minimum distance) can be entered. This gap can be used to simulate the geometric dimensions of obstacles.
Along with an empirical approach to the choice of a specific fractal geometric figure, the fractal dimension can be used as a numerical approximation of its similarity with the modeled structure. The fractal dimension allows the definition of similarities in terms of fractal properties.
For example, the calculation of the fractal dimension of Minkowski [27] as a given bounded set in the metric space is defined as:
where is the minimum number of sets of diameter d that cover a given set.
Such an assessment can be implemented quite easily by means of numerical methods for analyzing a raster monochrome image. This characteristic is not an exhaustive indicator of the similarity of structures. However, it may increase the effectiveness of empirical choice.
Of course, for the study of a specific structure, it is possible to use it for analysis. However, for the study of general properties and typical structures, it is of interest to choose a certain model by modifying the properties of which it is possible to simulate the different conditions characteristic of many applications.
In this work, a fragment of the Hilbert curve (a special case of Peano curves) was chosen for this purpose. This choice is partially empirical, based on the similarities of geometric shapes, but also on the basis of close values of the fractal dimension.
Note that the fractal dimension for the images shown in Figure 2a,b, where D ≈1.76 and D ≈1.71, respectively. The fractal properties of the model are quite close to the fractal properties of the structure selected as an example.
4.2. User Distribution Model
For a user distribution model, when placing network elements randomly and selecting a fragment of the Hilbert curve as a model, the structure similar to that can be obtained which shown in Figure 5.
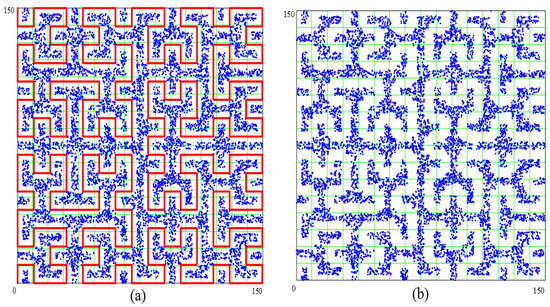
Figure 5.
Structure model based on a fragment of the (a) Hilbert curve, (b) Network elements.
Figure 5 shows the model obtained by randomly placing the network elements (10 thousand nodes) in a square flat area with a square side of 150 m. For better clarification, Figure 5a shows the Hilbert curve, whereas Figure 5b shows only the network elements (nodes). The network density is about 0.44 devices per m2 if the total service area is considered while the density is about one node per m2 if the area occupied by the obstacle model is considered.
The elements of the fractal theory are still widely used in modeling communication networks, namely when describing a random processes-traffic. For example, in [29,30,31], and many other works, the concepts of fractal theory are used to describe the properties of traffic. This application of fractal theory and the description of random series were laid in the works of Hurst [32]. The methods outlined by Hurst and his followers are applicable not only to time series but also to random series, usually [24].
While Considering the service area of the network, in which network elements (users or network nodes) are distributed in some random way (Figure 3), the number of elements found in the zone fragment will also be a random value. If the entire zone is divided into elementary fragments and the number of network elements is counted in them, then we get a random series on which the above methods are applicable. This approach forms the basis of the further construction of the model.
In this study, the Hurst parameter H will be used to describe the network structure, which can reflect the manifestation degree of self-similarity properties as well as can be associated with the fractal dimension as [24]. Let us estimate it for the structure shown in Figure 3 using the variance change method [33].
The process is the following. The service area under consideration will be divided into unit elements of the area, for example, by implementing a grid of square cells with an area of 1 m2 (cells may even have a different area). First, let’s count the number of hosts in each cell. As a result, we get a value of k:
where k is the number of grid cells.
Next, we will construct the aggregated structures generated from the original (Figure 3) by combining the cells of the original partition with q adjacent cells into one. Then, we get k cells for the aggregated structure, where . Afterward, we count the number of network elements (nodes) in the aggregated partition cells and normalize them in comparison to the original partition. An illustration of the construction of aggregated structures is shown in Figure 6.
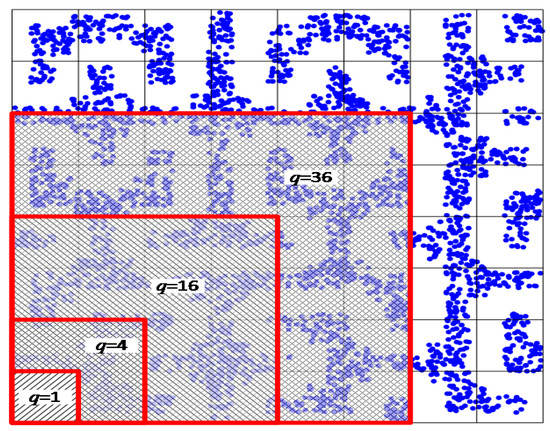
Figure 6.
Building aggregated structures.
In the general case, for each partition i, we will obtain a set of values:
where i is the number of the partition , is the size of the cell side into which the service area is divided , is the number of network elements (nodes) that fall into the j-th cell, size , w is the length of the side of the service area , n is the number of partitions.
For each value , we calculate the variance of the obtained values :
The cell size take values from the set . In this case, we will assume that , where is the length of the side of the maximum cell of the partition.
Figure 7 shows the results of aggregation for the values m2, which corresponds to the values , respectively.
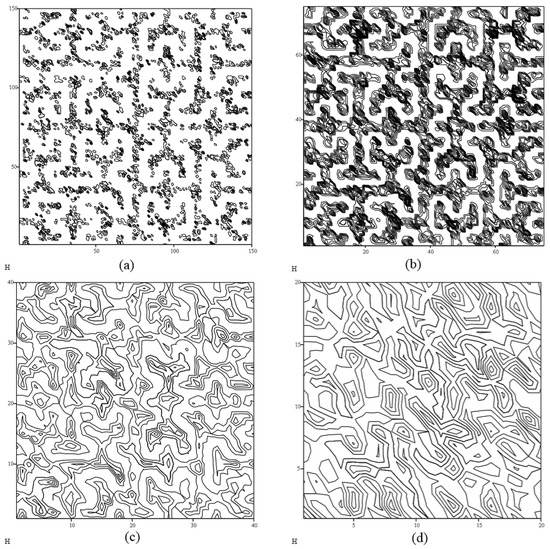
Figure 7.
Results of aggregation of the model structure at q = 1 m2 (a), 4 m2 (b), 14 m2 (c) 56 m2 (d).
To estimate the Hurst coefficient, we construct the dependence:
Let us approximate dependence (3) by a straight line
For approximation, we use the least squares method, according to which:
The resulting dependence is shown in Figure 8.
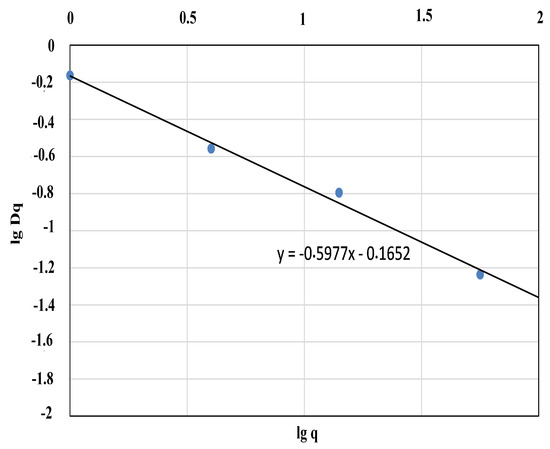
Figure 8.
Dependence of the variance of aggregated structures on the size of the aggregation square.
Approximation obtained from the dependence of straight line and the estimate of the Hurst coefficient showed that for this structure , which corresponds to the fractal dimension .
As mentioned above, the value was introduced, which determines the minimum possible distance of the network nodes from the obstacle model. If the obstacle is assumed to be a certain structure, then the Hilbert curve may be viewed as a representative model of its extension (length) L, and the mentioned value as its width (line width).
Then the total area of the simulated buildings on the simulated territory can be determined as:
The share of the area occupied by buildings can also be considered as one of the structural parameters of the model:
where is the total area of the simulated territory, and w and h are length and width, respectively.
Since and the proportion of the area occupied by the buildings (obstacles) are linearly dependent on the length L, which in this case is constant, then both would have a similar effect on the properties of the modeled structure. In the example above, the area occupied by obstacles is 30%.
To study the influence of this parameter on the properties of the structure, the dependence of the Hurst parameter on it was estimated. Figure 9 shows the dependence of the Hurst coefficient on . In this example, the range of change in values is equivalent to the changes in the proportion of the obstacles area from 0 to 50%.
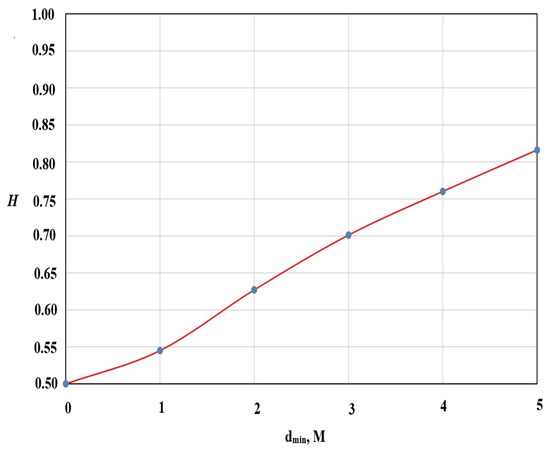
Figure 9.
Dependence of the Hurst parameter on the value of the minimum offset .
From the results obtained, it can be deduced that the Hurst parameter increases with increasing , from 0.5 at , to more than 0.8 at m (which corresponds to 50% of the area occupied by obstacles).
A value of 0.5 is very reasonable, since when , there are actually no obstacles, and the location structure of the network nodes is a Poisson field (uniform distribution of nodes throughout the territory). With an increase in , the structure of the nodes’ arrangement takes a form close to the fractal structure of the obstacle model, as can be seen from Figure 4. This structure has the properties of self-similarity, which is manifested in an increase in the Hurst parameter.
With a further increase in , the area available for the placement of network nodes decreases so much that the example becomes irrelevant. Indeed, at close to 100%, all network nodes will be concentrated in one or more “points” (areas of a small area) of the service area. In addition, at a value of 100%, under the conditions of this problem, confusion occurs. This is attributed to the impossibility of placing network nodes in general. It is worth noting that these boundary conditions are only achievable theoretically, in practice, with tending to 100%, the formulation of the problem itself needs an adjustment. Probably, in this case, it is necessary to consider the network inside the premises (buildings) and associate the obstacles with their structural elements.
Therefore, the proposed model makes it possible to simulate the structure of the Internet of Things network located on a certain flat territory, which has areas accessible and inaccessible for the placement of nodes. In addition, the configuration of which can be specified by fragments of the Hilbert curve (possibly another geometric fractal figure). The parameters of this model are: the number of nodes in the network, the length of the curve, and the proportion of the area occupied by obstacles. Changing these parameters makes it possible to bring the properties of the model closer to the properties of the simulated structure, and thereby bring the conditions for the functioning of the studied network model closer to the conditions of the real environment. The Hurst parameter is a characteristic of the network structure in terms of the distribution of nodes (terminals) and can be used for a complete description of its properties, taking into account the environment.
5. Analysis of Internet of Things’ Properties
In this section, we analyze the proprieties of the Internet of Things to validate the design of our model. It is known that, with a uniform distribution of network nodes in the coverage region of a high-density network, the signal-to-noise ratio decreases due to in-band interference induced by adjacent (surrounding) network nodes as a result of a decrease in the communication area (range)as D2D links are formed, and the average length of the route between network nodes is increased. There was also a forecast of the average route length for a high-density network, which amounted to about 42 transits in the example.
Let us analyze the average route length in the above network model (Figure 5). In this case, the high-density network has a heterogeneous structure. Estimation of the average route length was carried out using simulation modeling.
The simulation model implements the formation of the network structure (Figure 3) and the search for all the shortest paths between its nodes. In this case, the network model consisted of 10 thousand nodes, and the number of possible routes was, respectively, 100 million.
The average route length for this example was 83 m. In this case, taking into account the average length of one transit, which was about 5 m, the average number of transits in the route was about 17.
The distribution of the length of the routes is shown in Figure 10.
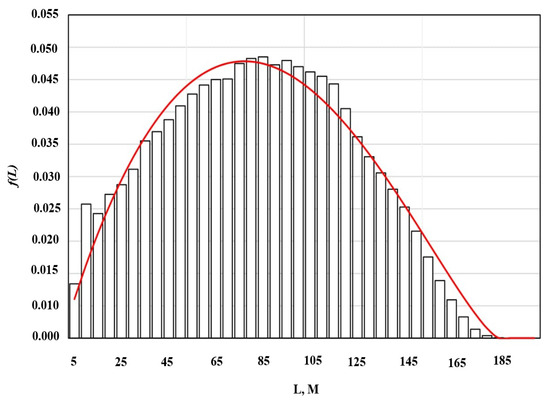
Figure 10.
Distribution of the average length of routes (red curve given by Equation (13)).
The resulting distribution has a bell-shaped shape, which is significantly different from the gamma distribution and the truncated normal distribution. The closest analytical model for its description was the -distribution, the probability density of which is determined by the following expression:
where and are parameters, X is the maximum value, and -function.
For this structure, the probability of connectivity turned out to be 0.56. Its assessment was made as an assessment of the proportion of existing routes relative to their potential number. For a given structure, this is natural. It is easy to see in Figure 1, Figure 2 and Figure 3 that there are disconnected (“isolated”) regions in the structure. This is explained by the continuity of the used fragment of the Hilbert curve chosen for modeling.
It should be noted that this limitation can be easily removed. For example, when modeling the network structure (choosing random coordinates for network nodes), you can enter the probability of “overcoming” an obstacle, i.e., installation of the node in an area inaccessible for their placement. In this case, nodes will appear in the network structure, connecting “isolated” areas of the network.
Figure 11 shows the distribution of the length of the shortest route obtained in the above way. During the simulation, 5% of the nodes were selected that are able to connect isolated areas. In this case, the network is fully connected.
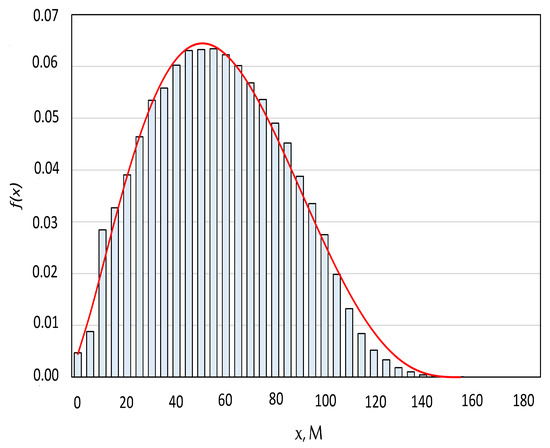
Figure 11.
Distribution of the length of the shortest route.
From the results obtained, it can be seen that the average track length was reduced to 58 m (12 transit sections).
Based on the results obtained, it can be concluded that the average route length under conditions of uneven distribution of network nodes is less than under conditions of their uniform distribution, and when the network connectivity is ensured, the route length decreases.
Thus, the proposed model of uneven distribution of network nodes makes it possible to study the basic properties of a high-density Internet of Things network.
As the results, the using this model for research have shown that the properties of the Internet of Things network in a heterogeneous environment leads to improve the properties of a high-density network, which is manifested in a decrease and in the average route length. This is due to the presence of obstacles to the propagation of the radio signal, which reduces the power of interference from network nodes by reducing the number of available nodes located in a limited area.
A feature of a high-density IoT network is that a large number of nodes are at a small distance from each other. This leads to mutual interference leading to a decrease in the signal-to-noise ratio. Therefore, this requires a reduction in the distance between neighboring nodes in the route. Exactly, this is what happens when modeling a high-density IoT network with a Poisson point process (Poisson field).
In reality, for example, in an urban structure, the situation may differ significantly from such a model. The nodes of the network are unevenly distributed due to the presence of obstacles in the form of walls, buildings, and other structures. On the one hand, such obstacles divide the entire set of network nodes into groups (clusters) that are remote from each other and reduce mutual interference between them, thereby improving the quality of channels within these clusters. On the other hand, if necessary, communication between clusters has to increase the length of the routes because of the need to bypass these obstacles.
The length of the route in such a network (in the number of transits) is random. If we characterize the network by the probability density of the route length between nodes, then for a given model and a Poisson field model, different distributions should be expected.
The proposed model can be adapted to simulate various conditions by choosing the appropriate fractal curve, its length, the proportion of the occupied area, the number of network nodes, their parameters, and the signal attenuation model.
Typically, users in an access network or nodes in a wireless sensor network are modeled by point processes, such as a Poisson field or fields with other properties. It should be noted that in this case, the researcher does not have a numerical characteristic that would describe the features of the real environment and allow them to be related to the properties of the model.
In comparison with the known models, the proposed model allows one to take into account the features of the environment, which are numerically expressed in the form of the Hurst parameter or fractal dimension. These properties can be estimated numerically in the target environment and also reflected numerically in its model. This allows you to approximate the properties of the model to the properties of the environment it describes.
6. Conclusions
The structure of the high-density Internet of Things network is largely determined by the structure of the surrounding space, i.e., areas of placement of network elements. In this paper, we proposed a new heterogeneous structure model for a high-density network which can be used both for describing networks located outside the premises in which the city plan is replaced by the building plan, and the fractal curve simulates obstacles, which are walls and other building elements. In addition, the choice of a particular fractal curve depends on the features of the modeled structure. In most cases, for modeling flat areas, fragments of Peano curves or a Sierpinski carpet can be used, which have geometric elements similar to elements of urban development. Furthermore, the network structure models using a fragment of the Hilbert curve showed that by introducing such a parameter as the conditional “width” of the curve, it is possible to simulate the area occupied by buildings. The parameters of the number of nodes, the length of the fragment of the Hilbert curve, and the proportion of the area occupied by buildings allow you to control the parameters of the modeled structure, which can be described by the Hurst parameter. Finally, simulation results of modeling the heterogeneous structure of the network proved that it differs from the previously considered homogeneous structure, which consists of the difference between the average route length and the distribution of route lengths in such a network. In addition, the length of the route can be described by the -distribution, and its average value is slightly less than for a network with a homogeneous structure.
Author Contributions
Conceptualization, A.P. and A.M.; formal analysis, A.K., O.I.A., and R.A.; investigation, E.T. and I.A.E.; methodology, A.M. and O.I.A.; software, A.P. and R.A.; supervision, A.K.; validation, A.M. and E.T.; writing—original draft, A.M. and A.P.; writing—review and editing, E.T., I.A.E., and A.K. All authors have read and agreed to the published version of the manuscript.
Funding
The publication has been prepared with the support of the “RUDN University Program 5–100”.
Conflicts of Interest
The authors declare no conflict of interest.
References
- Gupta, A.; Jha, R.K. A survey of 5G network: Architecture and emerging technologies. IEEE Access 2015, 3, 1206–1232. [Google Scholar]
- Taleb, T.; Afolabi, I.; Bagaa, M. Orchestrating 5G network slices to support industrial internet and to shape next-generation smart factories. IEEE Netw. 2019, 33, 146–154. [Google Scholar] [CrossRef]
- Khayyat, M.; Alshahrani, A.; Alharbi, S.; Elgendy, I.; Paramonov, A.; Koucheryavy, A. Multilevel Service-Provisioning-Based Autonomous Vehicle Applications. Sustainability 2020, 12, 2497. [Google Scholar] [CrossRef]
- Alshahrani, A.; Elgendy, I.A.; Muthanna, A.; Alghamdi, A.M.; Alshamrani, A. Efficient Multi-Player Computation Offloading for VR Edge-Cloud Computing Systems. Appl. Sci. 2020, 10, 5515. [Google Scholar] [CrossRef]
- Sintorn, M.; Eriksson, A.C. Method for Locating a Bottleneck in a Radio Communication Network. US Patent App. 15/760,489, 27 September 2018. [Google Scholar]
- Salinger, J.D.; Chernak, S.; Bastian, C.; Urban, D.; Saxena, V. Subscriber Access Network Architecture. US Patent 8,094,661, 10 January 2012. [Google Scholar]
- Magueta, R.; Castanheira, D.; Silva, A.; Dinis, R.; Gameiro, A. Hybrid multi-user equalizer for massive MIMO millimeter-wave dynamic subconnected architecture. IEEE Access 2019, 7, 79017–79029. [Google Scholar] [CrossRef]
- Magueta, R.; Teodoro, S.; Castanheira, D.; Silva, A.; Dinis, R.; Gameiro, A. Multiuser equalizer for hybrid massive MIMO mmWave CE-OFDM systems. Appl. Sci. 2019, 9, 3363. [Google Scholar] [CrossRef]
- Gerasimenko, M.; Moltchanov, D.; Gapeyenko, M.; Andreev, S.; Koucheryavy, Y. Capacity of multiconnectivity mmWave systems with dynamic blockage and directional antennas. IEEE Trans. Veh. Technol. 2019, 68, 3534–3549. [Google Scholar] [CrossRef]
- Kovalchukov, R.; Moltchanov, D.; Samuylov, A.; Ometov, A.; Andreev, S.; Koucheryavy, Y.; Samouylov, K. Evaluating SIR in 3D millimeter-wave deployments: Direct modeling and feasible approximations. IEEE Trans. Wirel. Commun. 2018, 18, 879–896. [Google Scholar] [CrossRef]
- Lu, X.; Sopin, E.; Petrov, V.; Galinina, O.; Moltchanov, D.; Ageev, K.; Andreev, S.; Koucheryavy, Y.; Samouylov, K.; Dohler, M. Integrated use of licensed-and unlicensed-band mmWave radio technology in 5G and beyond. IEEE Access 2019, 7, 24376–24391. [Google Scholar] [CrossRef]
- Tafintsev, N.; Moltchanov, D.; Gerasimenko, M.; Gapeyenko, M.; Zhu, J.; Yeh, S.P.; Himayat, N.; Andreev, S.; Koucheryavy, Y.; Valkama, M. Aerial Access and Backhaul in mmWave B5G Systems: Performance Dynamics and Optimization. IEEE Commun. Mag. 2020, 58, 93–99. [Google Scholar] [CrossRef]
- Vikulov, A.; Paramonov, A. A-MSDU Frame Aggregation Mechanism Efficiency for IEEE 802.11 ac Network. The Optimal Number of Frames in A-MSDU Block. In Internet of Things, Smart Spaces, and Next Generation Networks and Systems; Springer: Berlin/Heidelberg, Germany, 2018; pp. 328–339. [Google Scholar]
- Vikulov, A.; Paramonov, A. The airtime resource model of the ofdm channel in the task of the ieee 802.11 network efficiency estimation. In Proceedings of the 2018 10th International Congress on Ultra Modern Telecommunications and Control Systems and Workshops (ICUMT), Moscow, Russia, 5–9 November 2018; pp. 1–5. [Google Scholar]
- Paramonov, A.; Hussain, O.; Samouylov, K.; Koucheryavy, A.; Kirichek, R.; Koucheryavy, Y. Clustering optimization for out-of-band D2D communications. Wirel. Commun. Mob. Comput. 2017, 2017, 6747052. [Google Scholar] [CrossRef]
- Muthanna, A.; Masek, P.; Hosek, J.; Fujdiak, R.; Hussein, O.; Paramonov, A.; Koucheryavy, A. Analytical evaluation of D2D connectivity potential in 5G wireless systems. In Internet of Things, Smart Spaces, and Next Generation Networks and Systems; Springer: Berlin/Heidelberg, Germany, 2016; pp. 395–403. [Google Scholar]
- Mahmood, O.A.; Paramonov, A. Optimization of Routes in the Internet of Things. In Internet of Things, Smart Spaces, and Next Generation Networks and Systems; Springer: Berlin/Heidelberg, Germany, 2018; pp. 584–593. [Google Scholar]
- Mahmood, O.; Paramonov, A. Peculiarity of the Internet of Thing Traffic Routing, Selection of the Gateway Location. In Proceedings of the 2018 10th International Congress on Ultra Modern Telecommunications and Control Systems and Workshops (ICUMT), Moscow, Russia, 5–9 November 2018; pp. 1–5. [Google Scholar]
- Gapeyenko, M.; Samuylov, A.; Gerasimenko, M.; Moltchanov, D.; Singh, S.; Akdeniz, M.; Aryafar, E.; Andreev, S.; Himayat, N.; Koucheryavy, Y. Spatially-consistent human body blockage modeling: A state generation procedure. IEEE Trans. Mob. Comput. 2019, 19, 2221–2233. [Google Scholar] [CrossRef]
- Moltchanov, D.; Ometov, A.; Koucheryavy, Y. Analytical characterization of the blockage process in 3GPP new radio systems with trilateral mobility and multi-connectivity. Comput. Commun. 2019, 146, 110–120. [Google Scholar] [CrossRef]
- ElSawy, H.; Hossain, E. A modified hard core point process for analysis of random CSMA wireless networks in general fading environments. IEEE Trans. Commun. 2013, 61, 1520–1534. [Google Scholar] [CrossRef]
- Fischer, W.; Meier-Hellstern, K. The Markov-modulated Poisson process (MMPP) cookbook. Perform. Eval. 1993, 18, 149–171. [Google Scholar] [CrossRef]
- Weisstein, E.W. Coastline Paradox. Available online: https://mathworld.wolfram.com/CoastlineParadox.html (accessed on 1 September 2020).
- Feder, J. Fractals (Physics of Solids and Liquids); Plennum: New York, NY, USA, 1988. [Google Scholar]
- Schroeder, M. Fractals, Chaos, Power Laws: Minutes from an in Finite Paradise; W. H. Freeman and Company: New York, NY, USA, 1992. [Google Scholar] [CrossRef]
- Google. Google Earth. Available online: https://www.google.com/intl/en_uk/earth/download/gep/agree.html (accessed on 12 March 2020).
- Crownover, R.M. Introduction to Fractals and Chaos; Jones & Bartlett Pub: Burlington, MA, USA, 1995. [Google Scholar]
- Wolfram. Wolfram Demonstrations Project. Available online: https://demonstrations.wolfram.com (accessed on 1 August 2020).
- Leland, W.E.; Willinger, W.; Taqqu, M.S.; Wilson, D.V. On the self-similar nature of Ethernet traffic. ACM SIGCOMM Comput. Commun. Rev. 1995, 25, 202–213. [Google Scholar] [CrossRef]
- Park, K.; Willinger, W. Sele-Similar Network Traffic and Performance Evaluation; Wiley & Son: Hoboken, NJ, USA, 2000. [Google Scholar]
- Tao, S.; Feng, Z.; Zhang, Z. Self-similarity networks and self-similarity network group. J. Chem. Pharm. Res. 2014, 6, 186–197. [Google Scholar]
- Lloyd, E. Long-Term Storage: An Experimental Study. J. R. Stat. Soc. Ser. A (Gen.) 1966, 129, 591–593. [Google Scholar] [CrossRef]
- Beran, J. Statistics for Long-Memory Processes; CRC Press: Boca Raton, FL, USA, 1994; Volume 61. [Google Scholar]
Publisher’s Note: MDPI stays neutral with regard to jurisdictional claims in published maps and institutional affiliations. |
© 2020 by the authors. Licensee MDPI, Basel, Switzerland. This article is an open access article distributed under the terms and conditions of the Creative Commons Attribution (CC BY) license (http://creativecommons.org/licenses/by/4.0/).