1. Introduction
One of the application areas of cork–rubber-composites is vibration isolation. This type of elastomers is composed of a rubber matrix filled with granules of cork, which can be utilised as isolation pads for systems subjected to the presence of dynamic loads, such as buildings, industrial machines and floating floors [
1,
2]. Cork is a natural origin material that is mostly used in wine stoppers. The insertion of cork granules into a rubber compound contributes to its recovery improvement when submitted to compression loads [
3].
The use of numerical methods, such as finite element analysis (FEA), has proven to be an advantageous tool to predict the mechanical behaviour of many materials. The application of FEA related to elastomers and other cork composites has been utilised to access static, dynamic loading and impact behaviour [
4,
5,
6,
7,
8]. One of the first requirements for the application of isolation pads is to evaluate their capacity to support static loadings. Regarding elastomers, one of the crucial steps during FEA is the definition of material properties [
9]. Typically for large strains, elastomer’s properties are defined through the application of non-linear models. However, if a linear stress–strain relationship, at small strains, is observed, Hooke’s Law can be adopted for that strain range [
10].
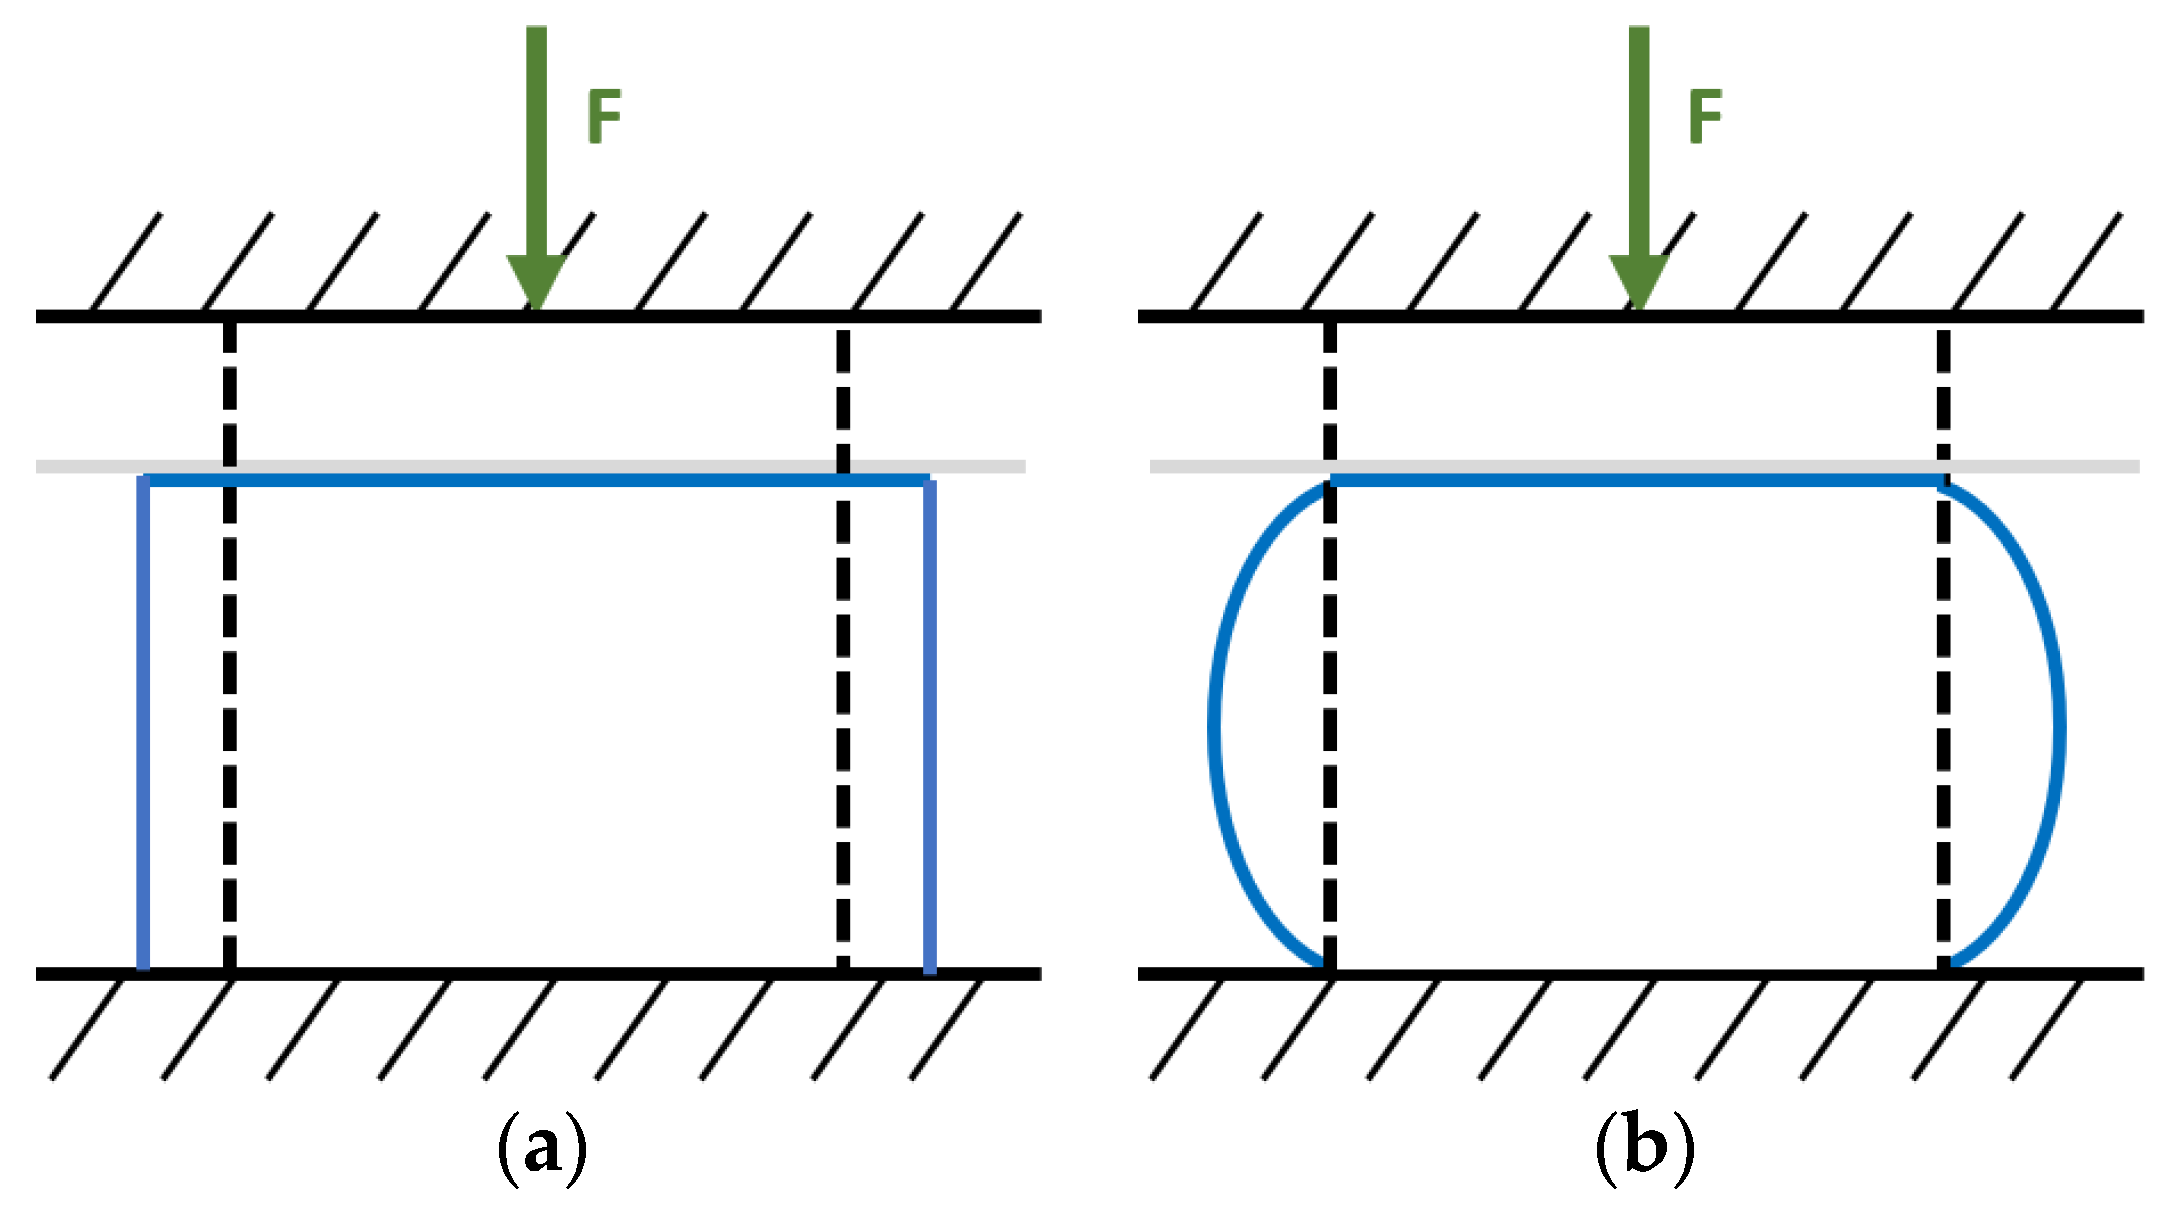
Concerning rubber materials, the compression behaviour of a specimen between bonded surfaces can be quantified using apparent compression modulus (
Ec) [
9,
11]. This parameter is associated with the rubber sample’s geometry. In the case of compression without bonded surfaces, the rubber block presents axial and uniform lateral deformation, as depicted in
Figure 1a. With a bonded condition, the lateral surfaces deform, assuming a barrel shape due to incompressibility, as presented in
Figure 1b. The compression of rubber materials, considering friction between specimen and loading instrument surfaces, will also cause a similar shape effect. However, the rubber’s stiffness will be smaller when compared to a bonded block due to some slippage of the edges [
9].
For example, considering frictional contact compression on two blocks with the same area and different thicknesses, the sample with lower thickness will present higher stiffness. This effect is related to the ratio between loaded area and total free area, also known as shape factor [
10,
12]. For disks and rectangular blocks, it can be determined by Equations (1) and (2), respectively:
with
L and
W are the length and width of a block,
T corresponds to the thickness and
D to the diameter of a cylinder.
Another aspect that has been considered by several authors is the effect of the rubber’s hardness. A softer material presents higher deformation at a certain load level compared with a material with higher hardness. To describe this effect, mathematical relationships between hardness and Young’s modulus (
E0) have been developed by several authors with applications on different types of rubbers [
13,
14,
15].
Mathematical models relating the compression behaviour with bonded contact and Young’s modulus can also be found in the literature. Several works present different types of expressions for the approximated solution of the relation between apparent compression and Young’s moduli [
12,
16,
17,
18,
19,
20,
21]. Some of these studies are described in the literature review section. However, most of the analytical models developed only focus on disk geometry and/or assume a condition of material incompressibility, restricting its application to cork–rubber materials.
The existence of a relation between moduli can be useful, for example, to estimate Young’s modulus value of a cork–rubber material and use it to evaluate the performance of an isolation pad with other dimensions, reducing the need of several experimental testing. Thus, the goal of the present study focuses on finding a relationship between compression with and without frictional surfaces. A set of different square cross-section blocks composed of cork–rubber materials, characterised by a linear region below 10% strain, was chosen to determine a relation between Young and apparent compression moduli, based on finite element analysis results. A comparison of the proposed methodology with other analytical models, relating Young and apparent compression moduli, was also conducted for validation purposes.
2. Literature Review on the Relation between Young and Apparent Compression Moduli
One of the first models was proposed by Gent and Lindley [
12]. Considering a disk sample and assuming a condition of total incompressibility, the resultant apparent compression modulus can be determined by Equation (3), considering the geometry of the specimen [
12]:
where
f is the shape factor. Other cross-section geometries and loading modes are studied in [
22]. Another aspect of the relation between moduli noticed, and accounted for in the work of Gent and Lindley [
12], was the influence of bulk modulus for blocks with large shape factors.
The study presented by Horton et al. [
19] did not follow the same assumption of a parabolic deformation of lateral surfaces considered in [
12]. Thus, another approach to the problem of compression loading was performed based on a superposition method. The expression determined by the authors also included the effect of bulk modulus (
K), as presented in Equation (4), for the case of circular cross-section blocks:
Lindley [
16] developed theoretical relations for the compression moduli of blocks with circular and cross-section for soft elastic materials, following the same assumptions used for incompressible materials in the Gent and Lindley’s study [
12]. The approach was validated by the results’ agreement with finite element analysis. For circular cross-section blocks, the resultant analytical expressions for the determination of apparent compression modulus are presented:
where
G is shear modulus,
is second Lamé constant,
w is the width of the cross-section and
h is the thickness of the block. The parameters
E3 and
w2 are calculated using Equations (7) and (8):
A simpler model to determine the relationship between apparent compression and Young’s moduli was proposed by Williams and Gamonpilas [
20] for disks. The resulting equation is only dependent on Poisson’s ratio (
ν) and aspect ratio (
S)—ratio between the radius and thickness—and is presented in Equation (9):
Discussion about the compression behaviour of elastomer materials continues as other conditions are considered to the problem solving, and mathematical models’ performance is compared against experimental testing data [
23,
24]. Other conditions studied include the influence of the boundary condition type, such as the existence of frictional contact between sample and plates [
21,
25,
26,
27,
28] and the application of non-linear models for large strains [
29], for example.
3. Materials and Methods
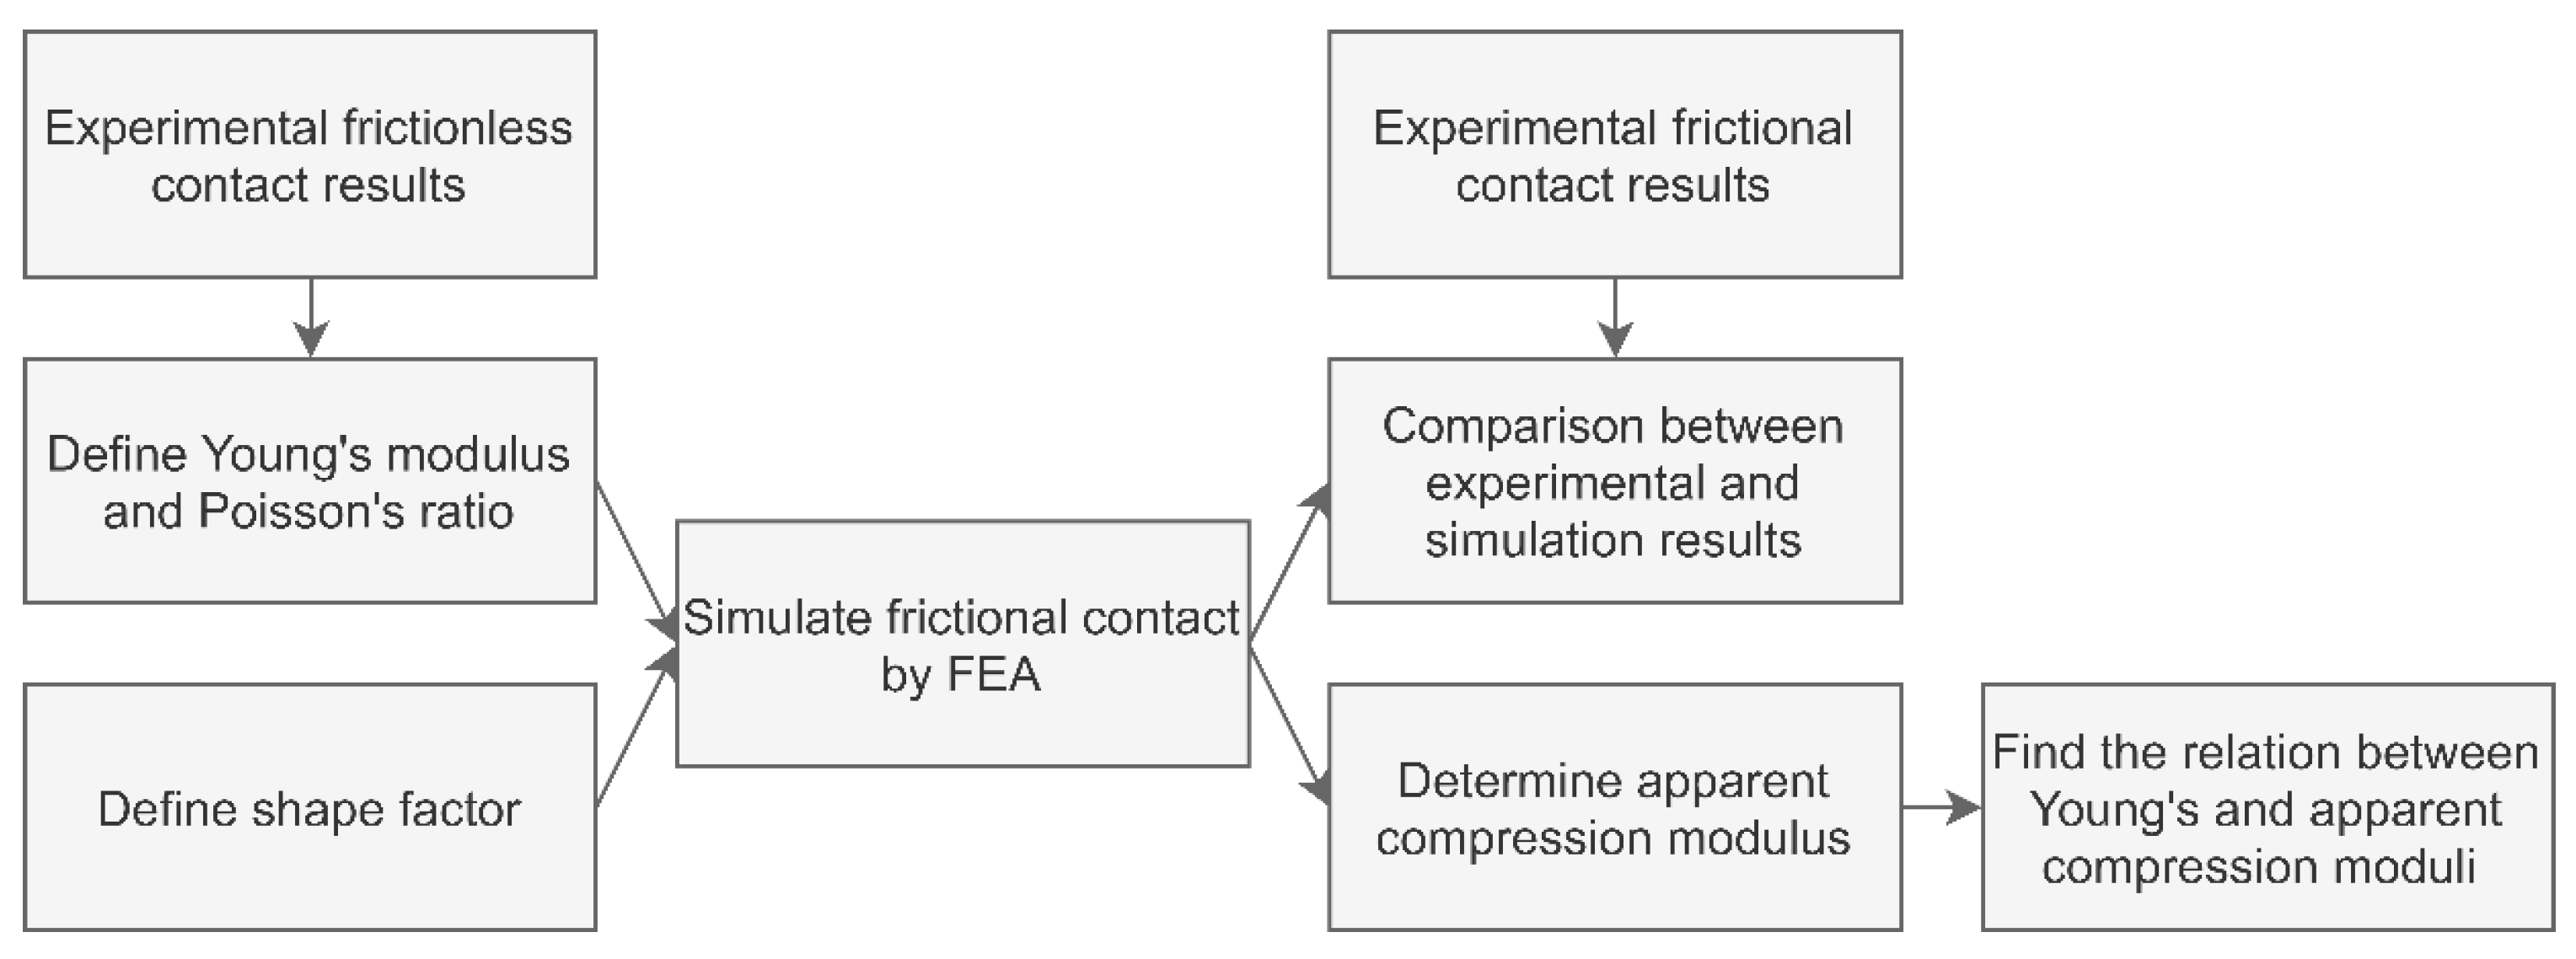
The methodology followed in this study is presented in
Figure 2. Given a certain geometry and Young’s modulus and Poisson’s ratio values obtained through an experimental compression test—without friction between sample and loading plates—a simulation of the compression behaviour considering a frictional contact can be performed through Finite Element Analysis (FEA). The results obtained from the numerical analysis can then be used for determining a relationship between the two testing configurations. A detailed description of the methodology steps is given below.
Regarding experimental methods, two compression tests were performed, considering frictionless and frictional contact between sample and loading plates. To simulate frictionless contact, lubricated plates were used. The value of Young’s modulus was calculated based on load-displacement data from that experiment. Poisson’s ratio of cork–rubber materials was also determined based on an internal experimental procedure. This value was obtained through the measurement of lateral deformation, using a probe indicator until a maximum of 20% axial strain. In this study, assuming an isotropic material behaviour, the Poisson’s ratio obtained for the cork–rubber composites had a value of 0.31. About the experimental testing with frictional contact, no lubricant or rough surface was applied between the sample and compression plates. All the samples tested have the same square cross-section, differing only in thickness.
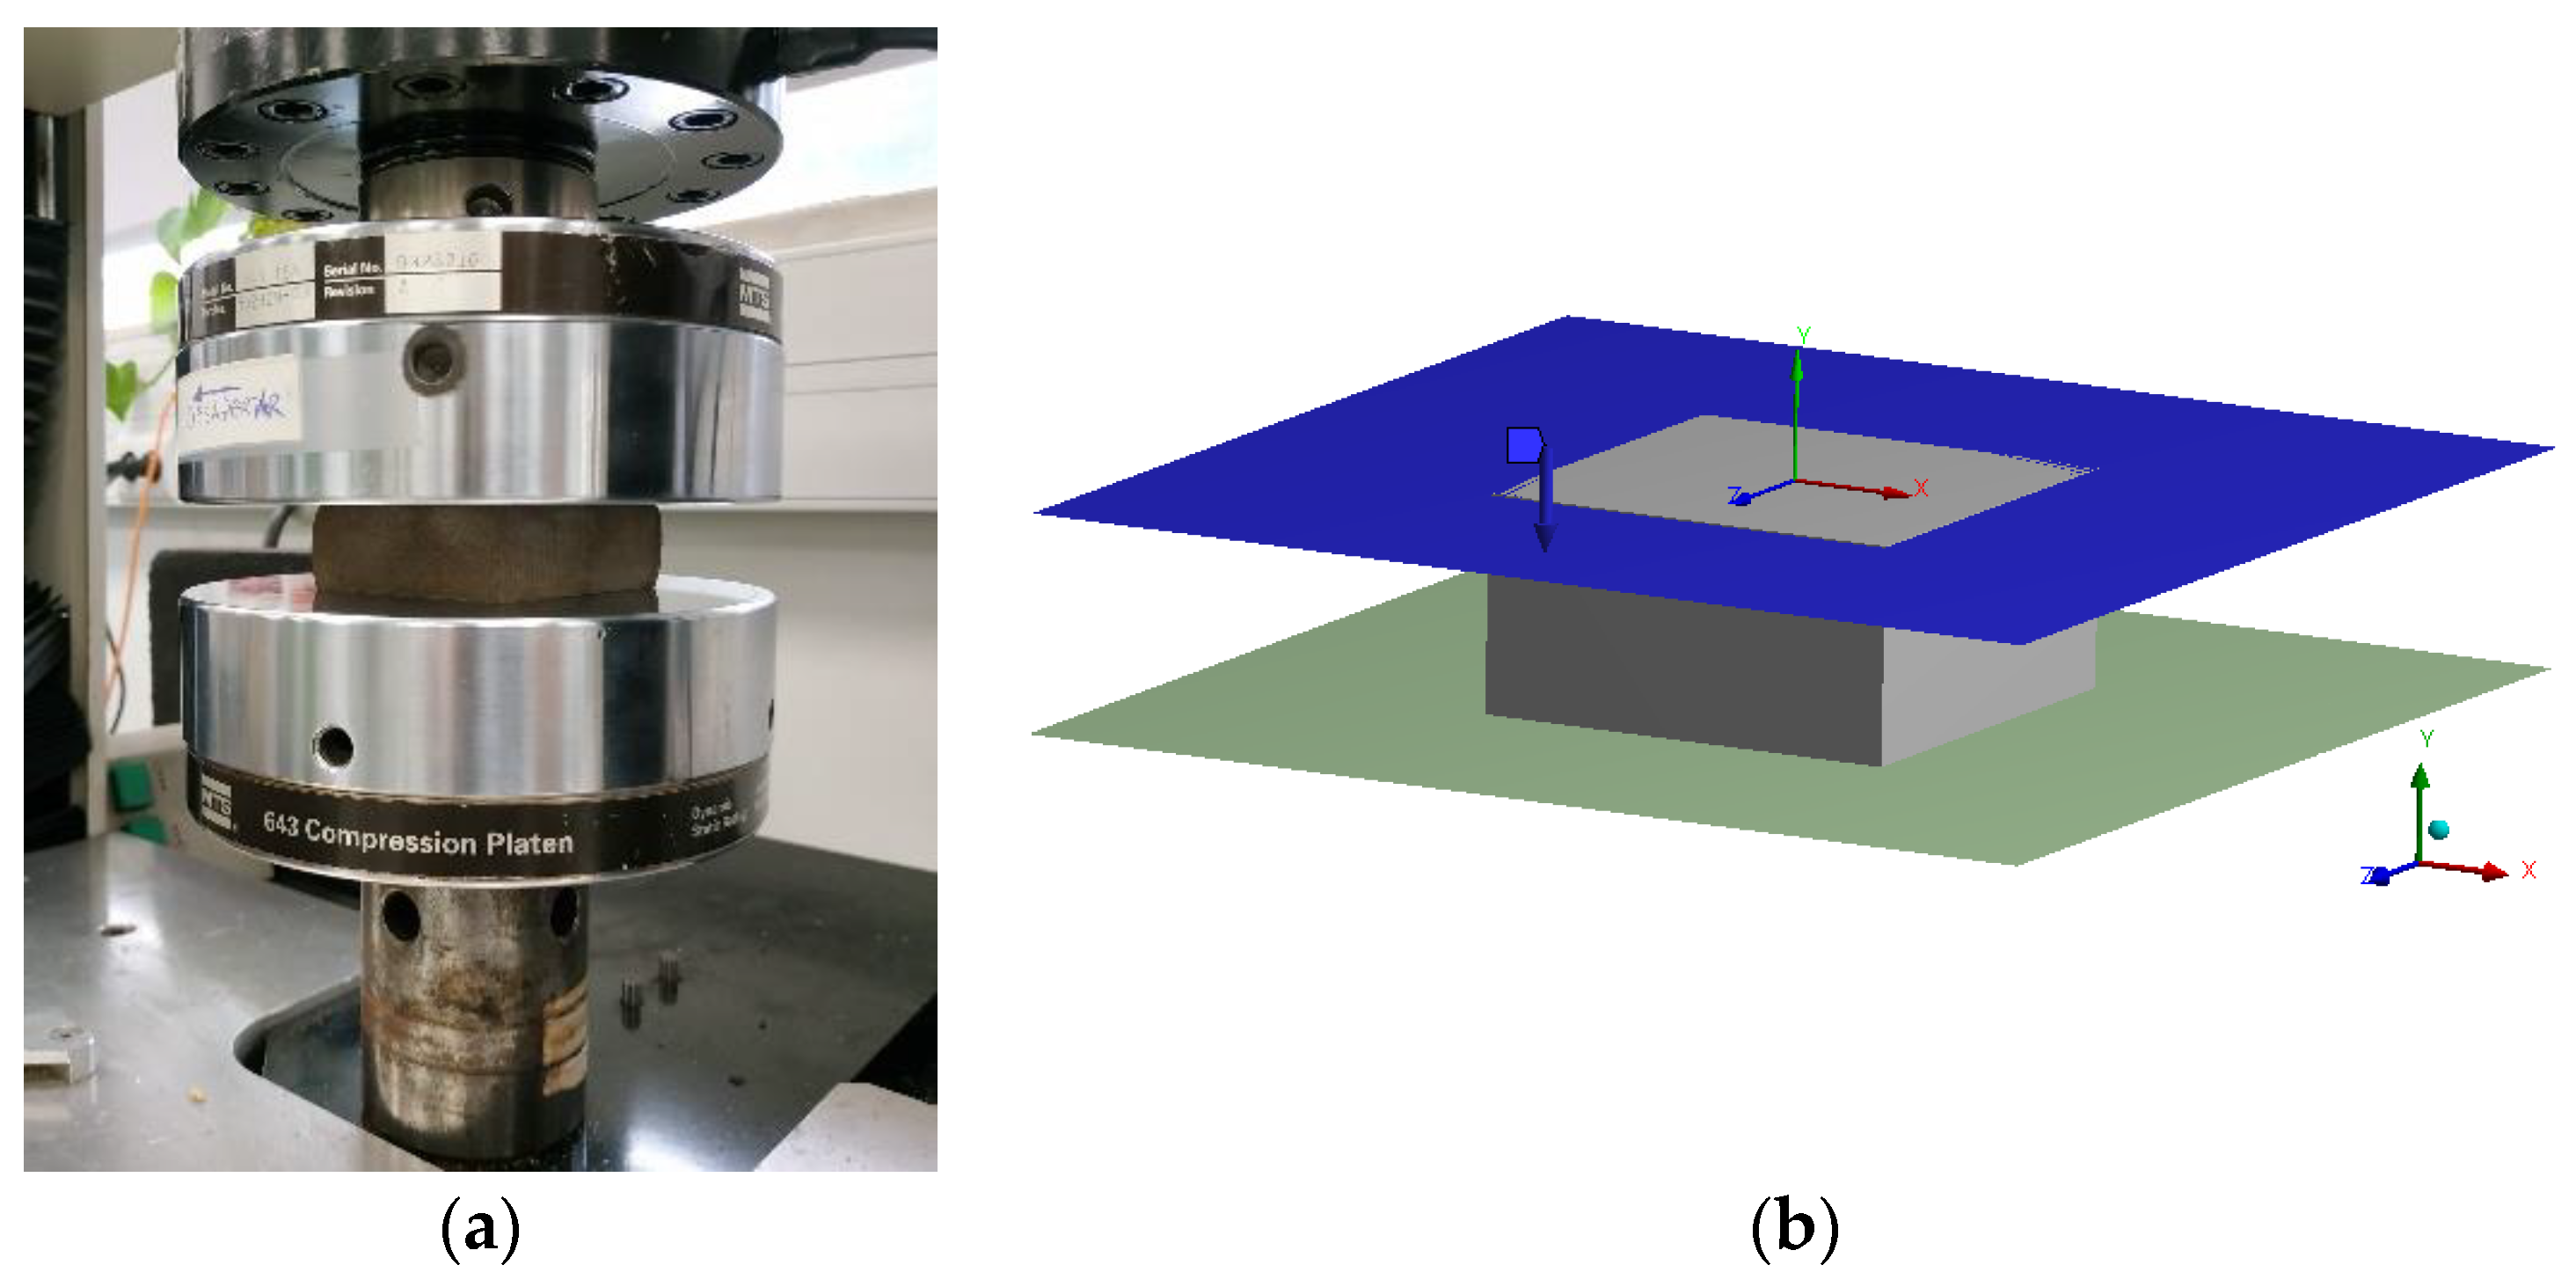
Based on the values of Young’s modulus obtained by experimental tests, the compression behaviour of different geometries of a cork–rubber compound was simulated, employing finite element analysis. Simulations were performed using ANSYS Mechanical. The experimental setup and 3-D finite element model are presented in
Figure 3. The finite element model was composed of a solid block, representing the cork–rubber specimen, placed between two surfaces. The numerical analysis consisted of simulating the compression machine displacement in contact with one of the surfaces of a cork–rubber block, recording as output the reaction force on the opposite surface. For that, rigid joints were employed on each surface: one with a fixed condition on all degrees of freedom, and another with only free translation on the load direction. Two contact options—rough and frictionless—were also employed to simulate the experimental method, according to the respective testing condition.
In this study, to model the compression behaviour of cork rubber composites, Hooke’s Law was considered, since these materials present a linear region at small strains [
22]. These values of deformation usually correspond to the application range of the cork–rubber vibration isolation pads, which simplifies the problem under study. However, at higher strains, the use of non-linear models is recommended [
4,
7,
20]. The value of Poisson’s ratio used as an input for numerical analysis was the same for all simulations performed since all tested materials presented similar results for that parameter.
With the results from the numerical analysis of frictional contact between surfaces-stress and strain data, the apparent compression modulus was calculated for different geometries, using Equation (10):
where
σ is stress and
ε is strain. Then, the apparent compression modulus was related to Young’s modulus for each shape factor.
Finally, for validation purposes, the results obtained by FEA for frictional contact were compared to samples tested experimentally. In addition, the results concerning the application of the methodology proposed in this article were compared against results obtained by the application of Lindley [
16] and Williams’ [
20] models.
4. Results
The results from experimental and simulated compression tests are described first, according to the contact type for comparison and validation of the approach developed. Then, using simulation results, the relation between Young and apparent compression moduli for each shape factor defined is presented.
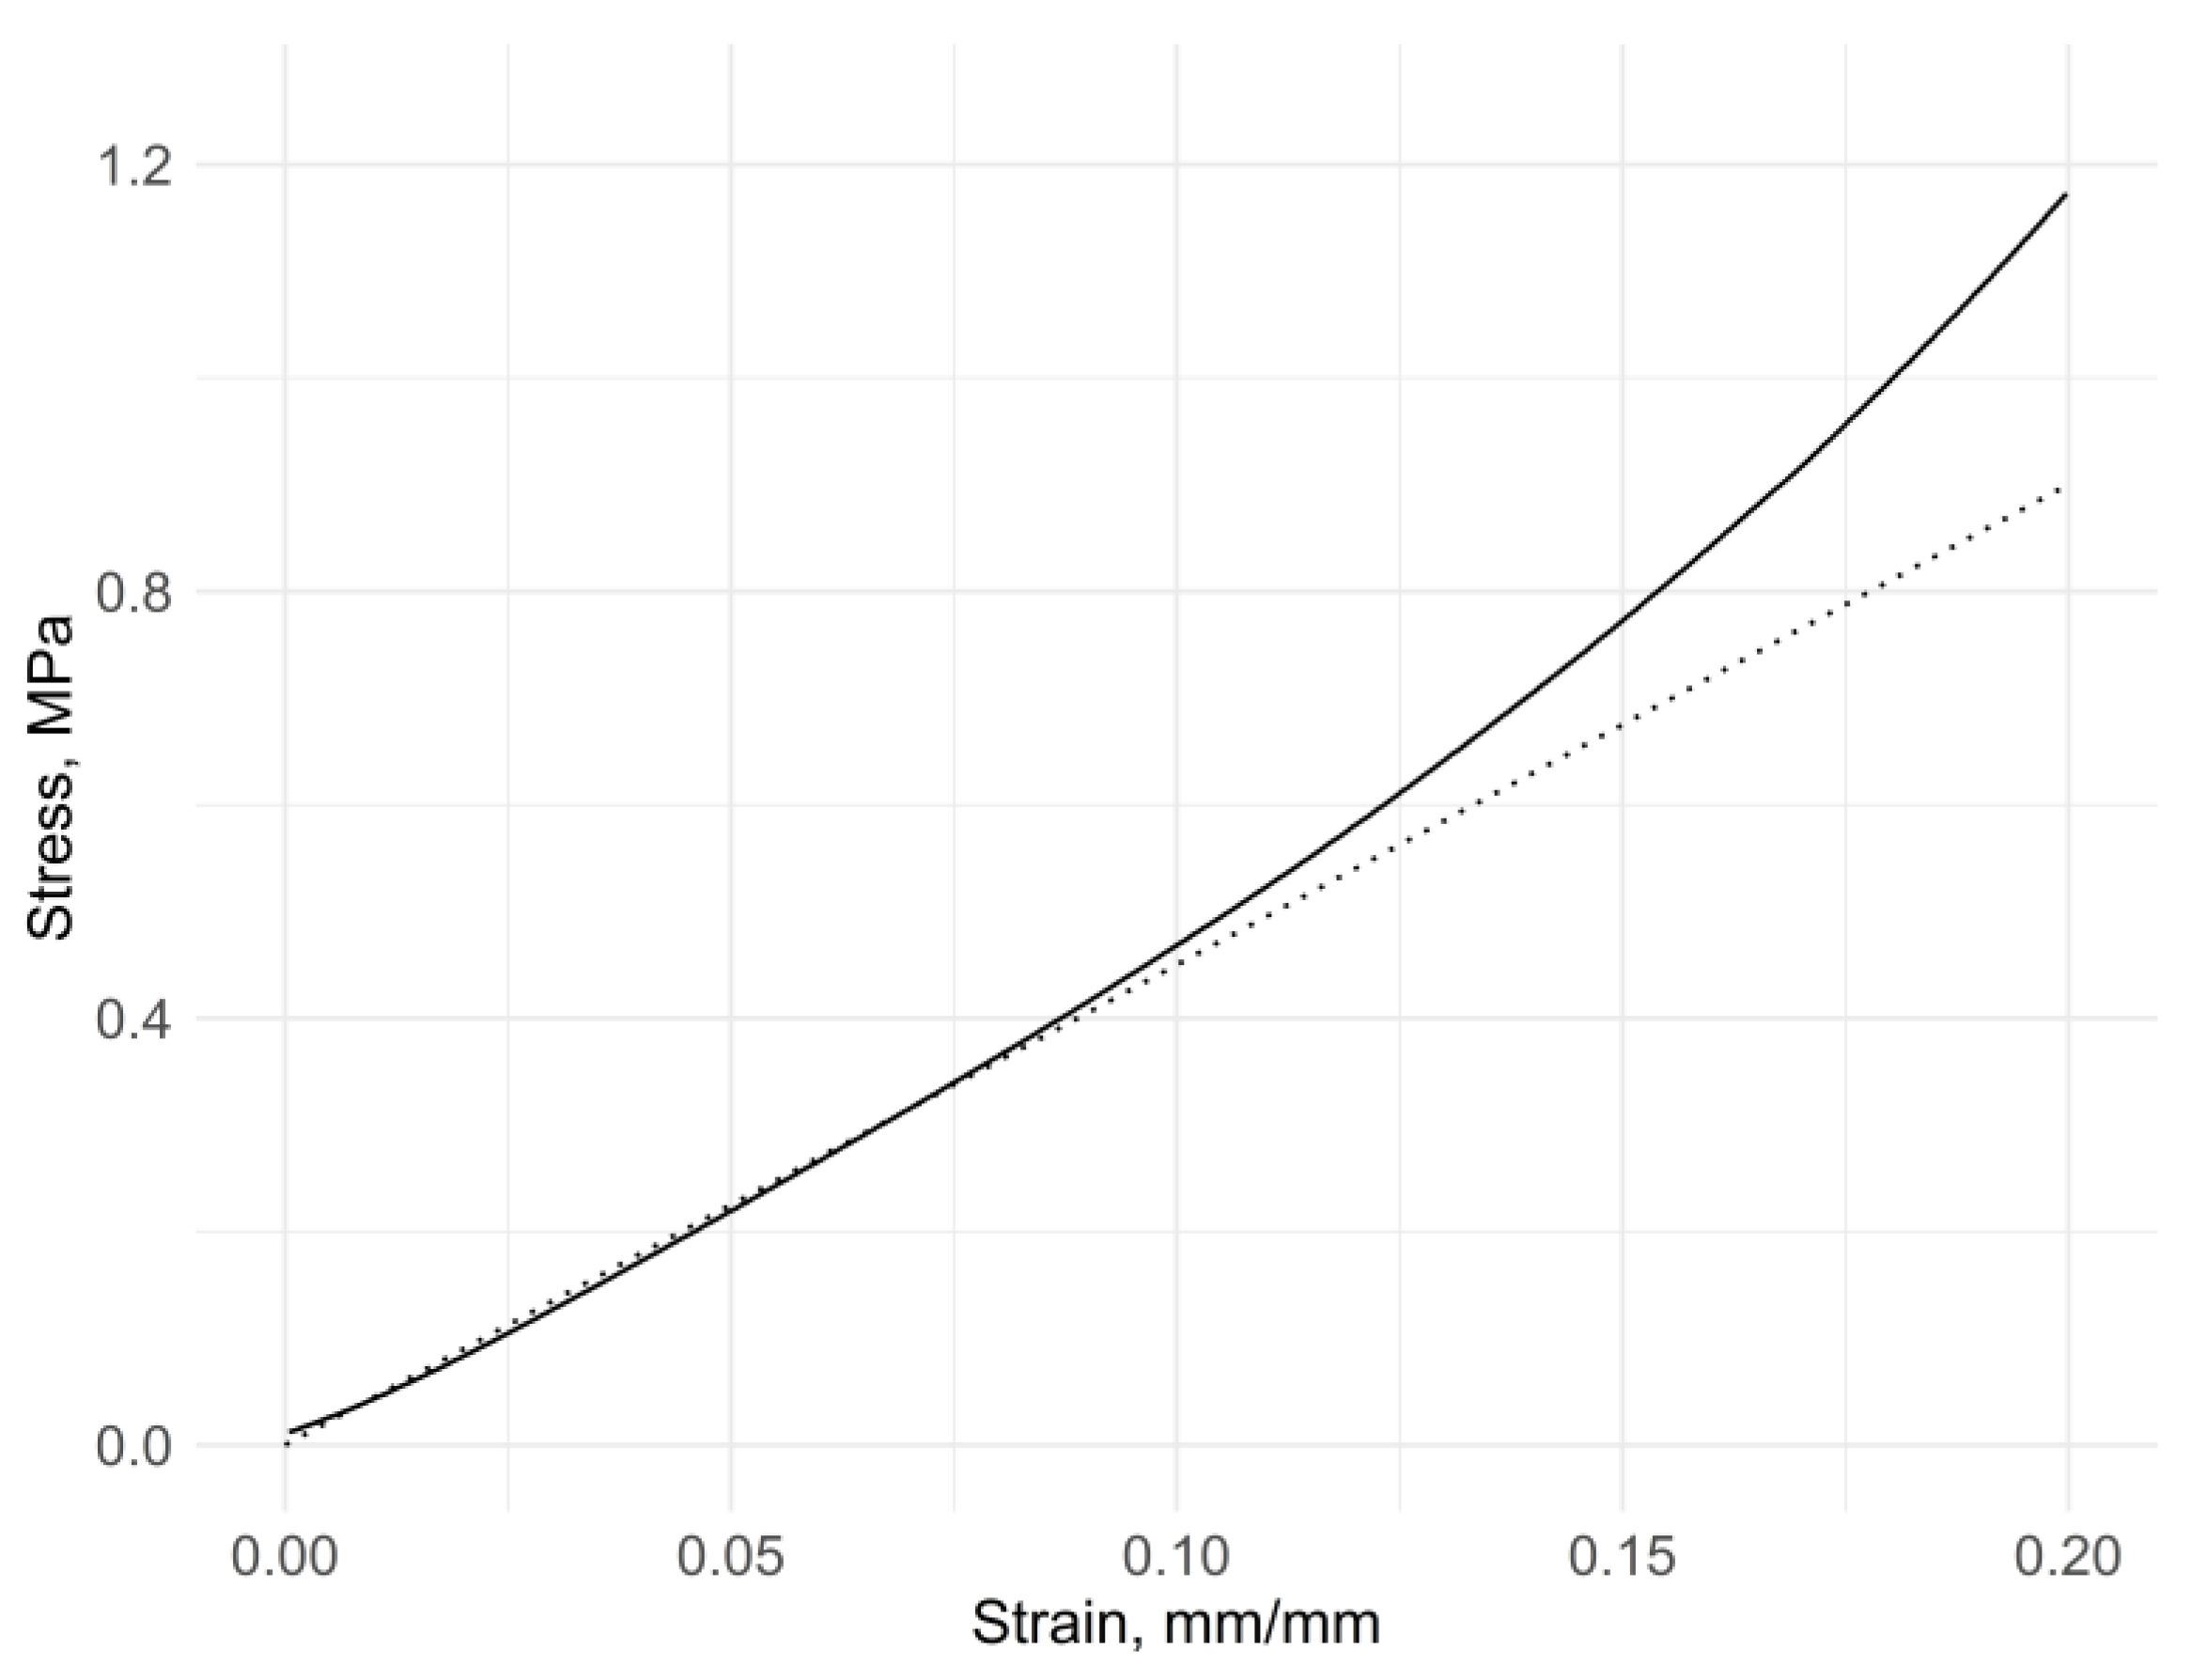
Figure 4 demonstrates a typical stress–strain plot for a cork–rubber composite, considering a frictional contact. These materials exhibit a linear behaviour of up to approximately 10% strain. Considering this, all results presented in this study correspond to a maximum strain of 10%, since all samples demonstrated a linear behaviour until this point.
4.1. Comparison between Experimental and Simulation Results: Frictionless Contact
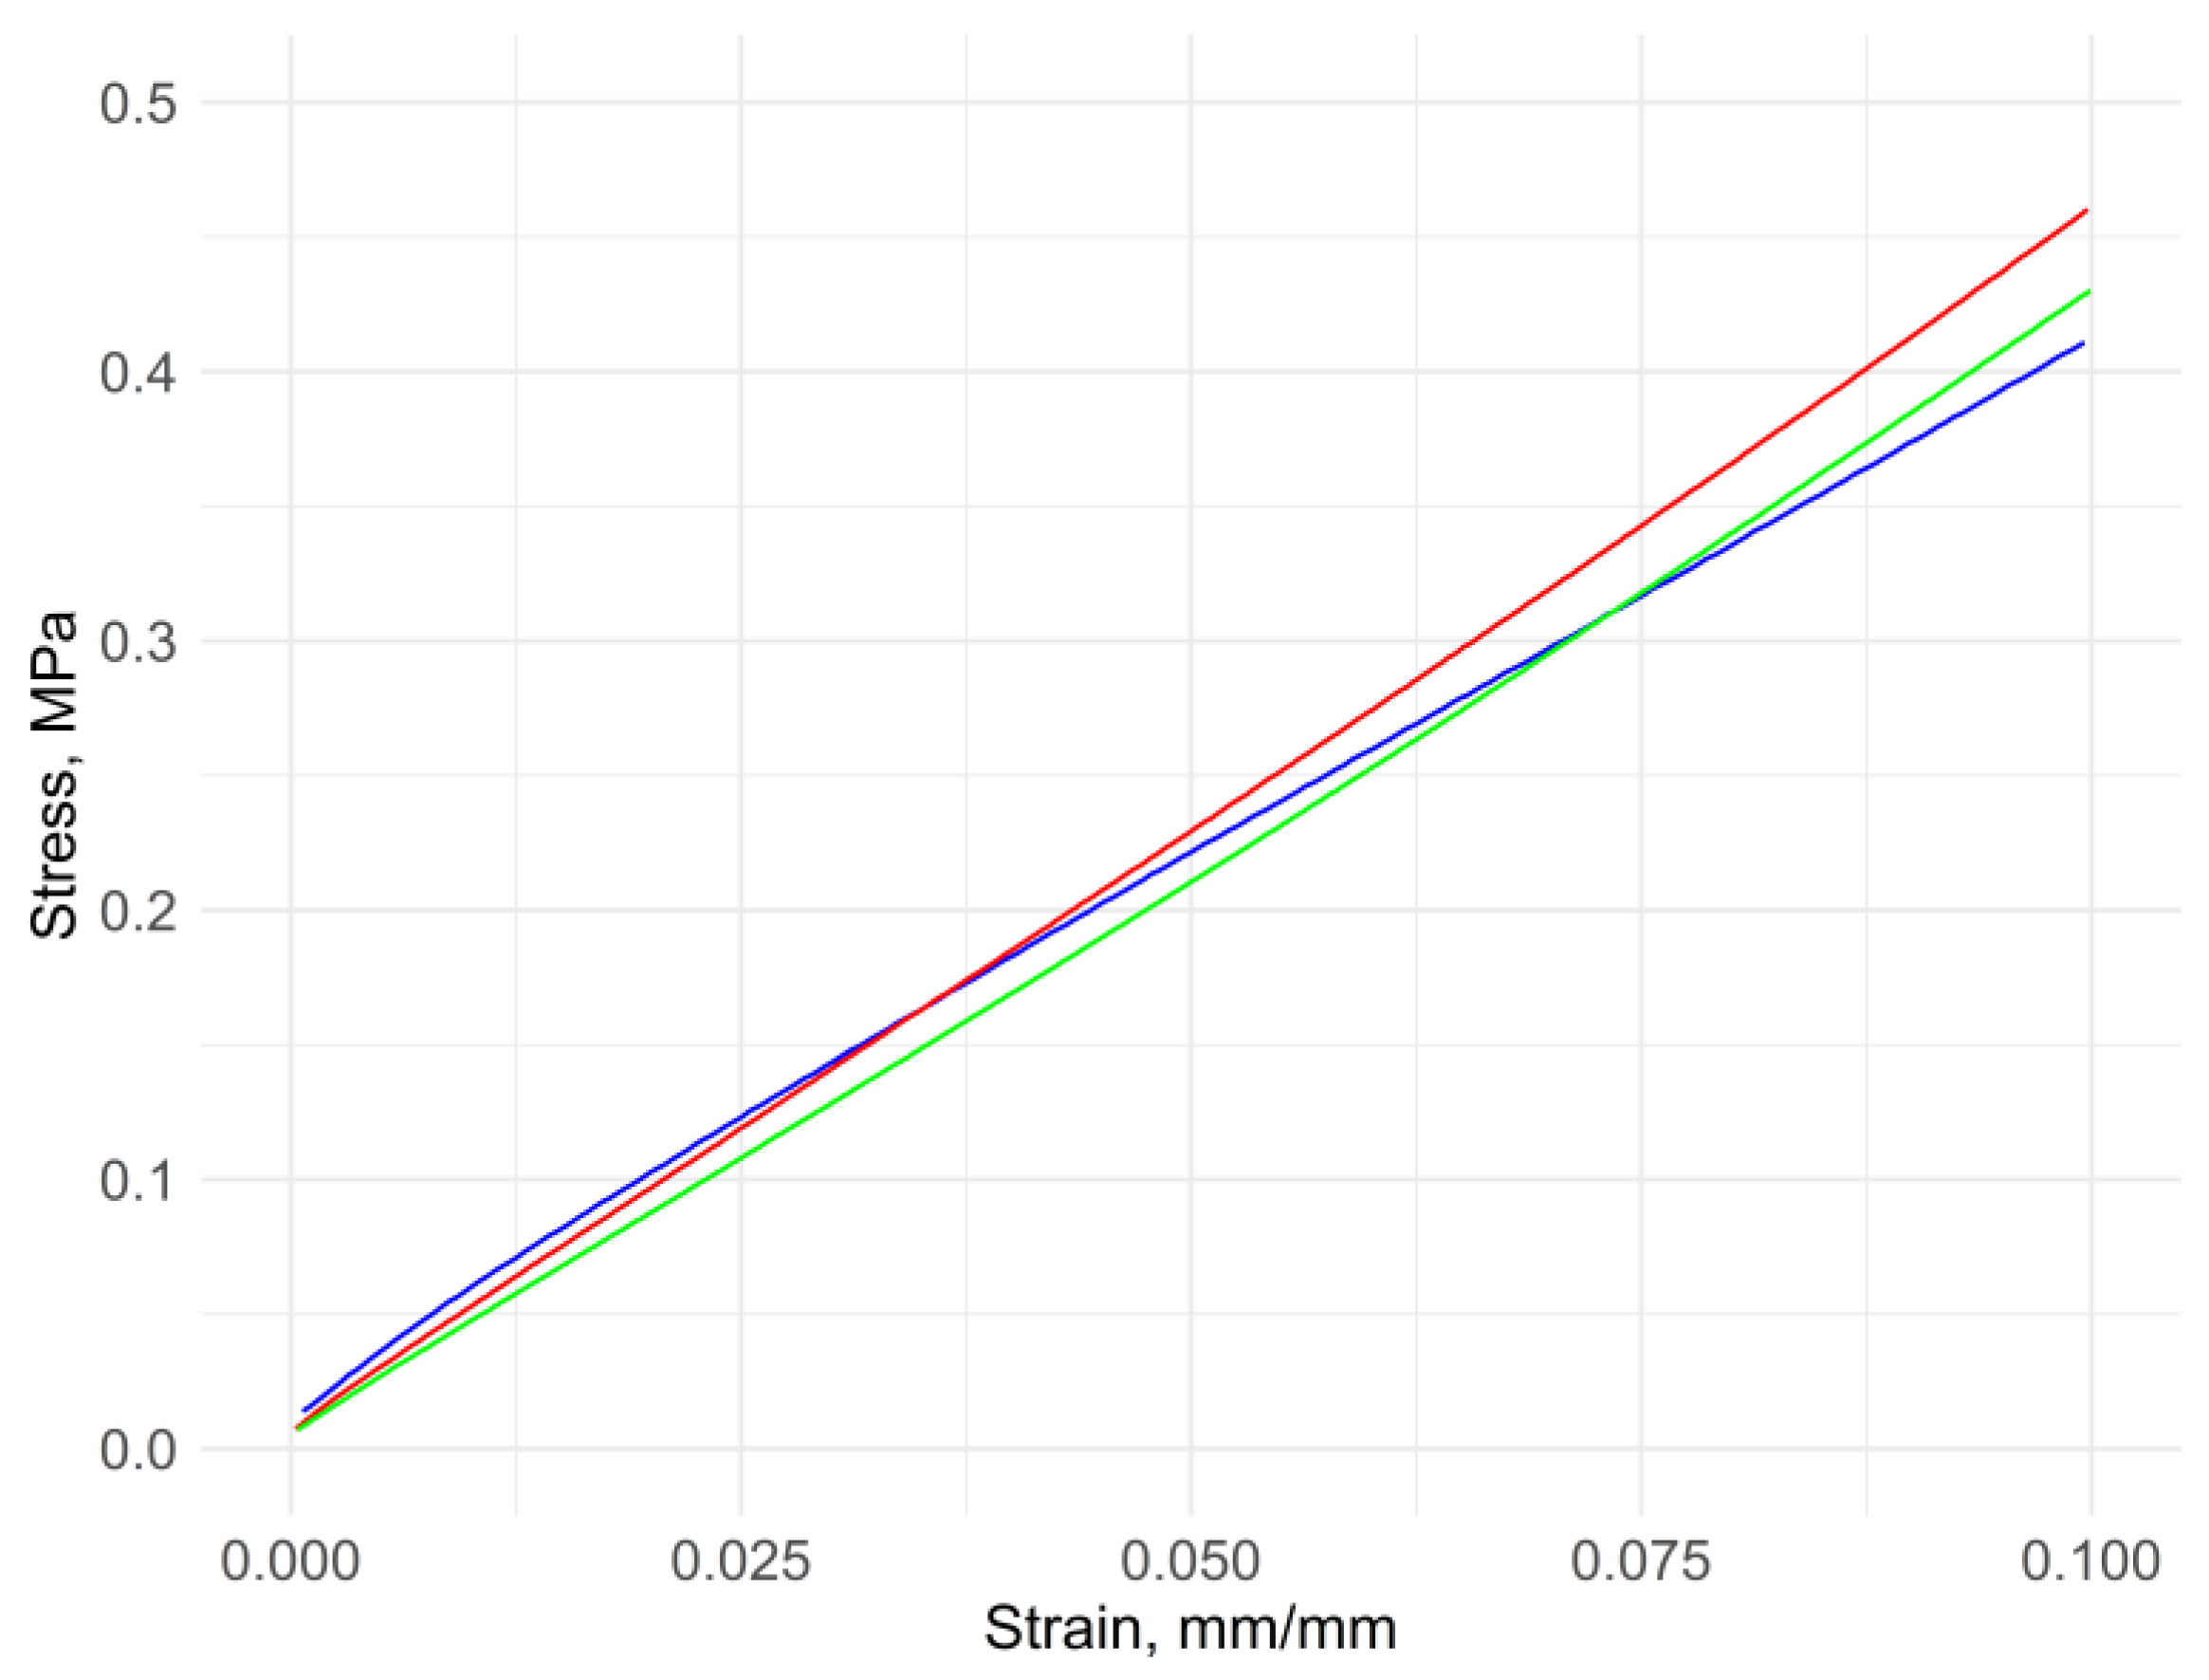
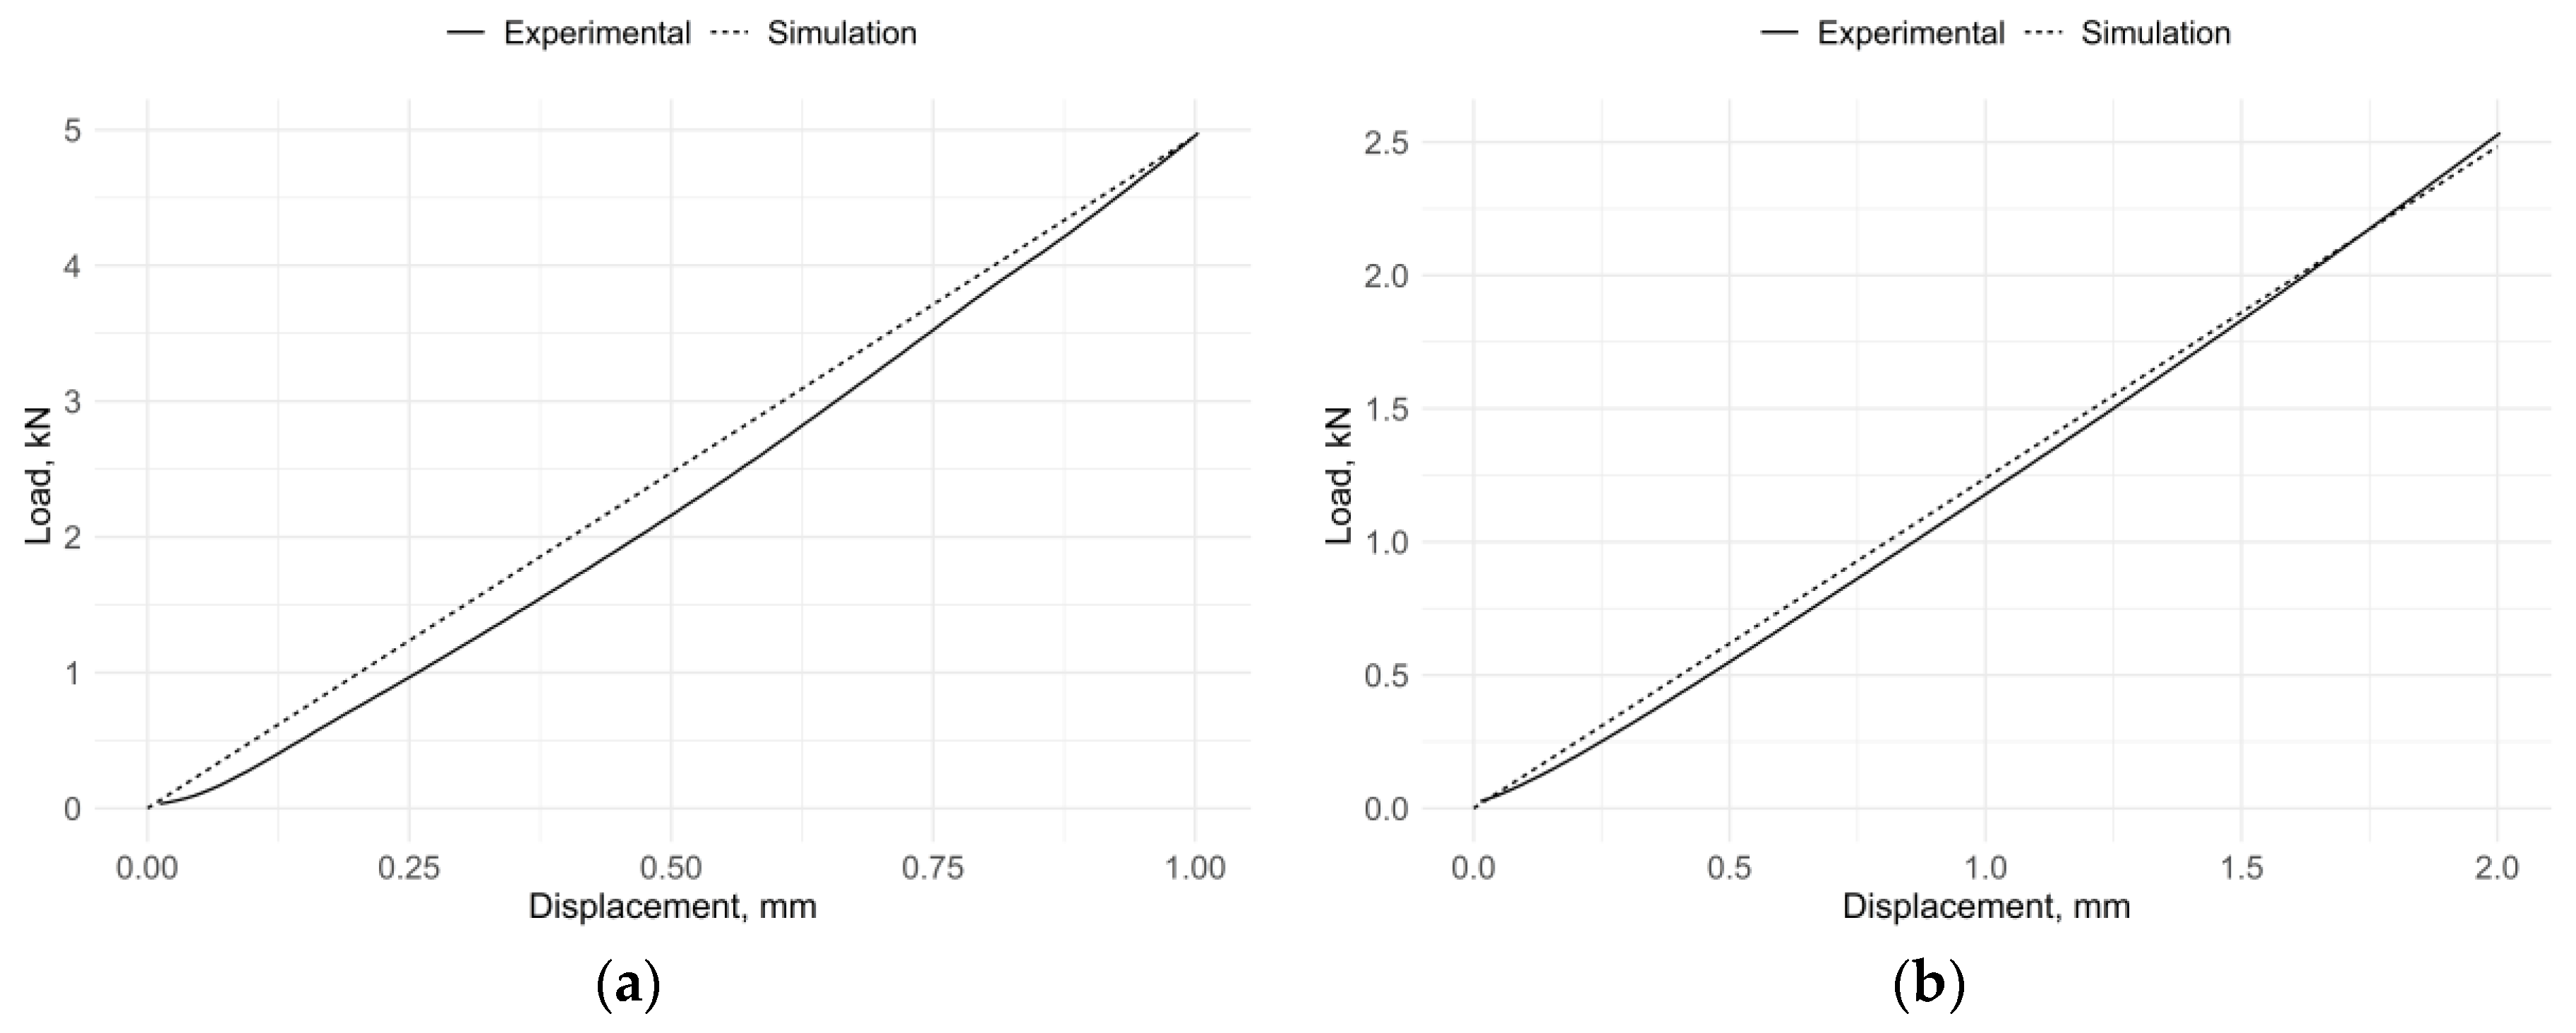
An experimental compression test using lubricated plates was conducted to validate the application of the finite element analysis for this problem. From the same cork–rubber compound, three blocks, with an equal square cross-section and different thicknesses, were tested. Based on experimental force-deflection data, Young’s modulus was estimated for small deformations, under 10% strain. The results obtained from the experiments, in terms of stress–strain curves, are presented in
Figure 5. As it was possible to verify, with a frictionless condition, the results between different samples were independent of the geometry or shape factor. Furthermore, comparing experimental with numerical results, for each sample, it was possible to observe that it had very similar results (
Figure 6).
4.2. Relation between Young and Apparent Compression Moduli
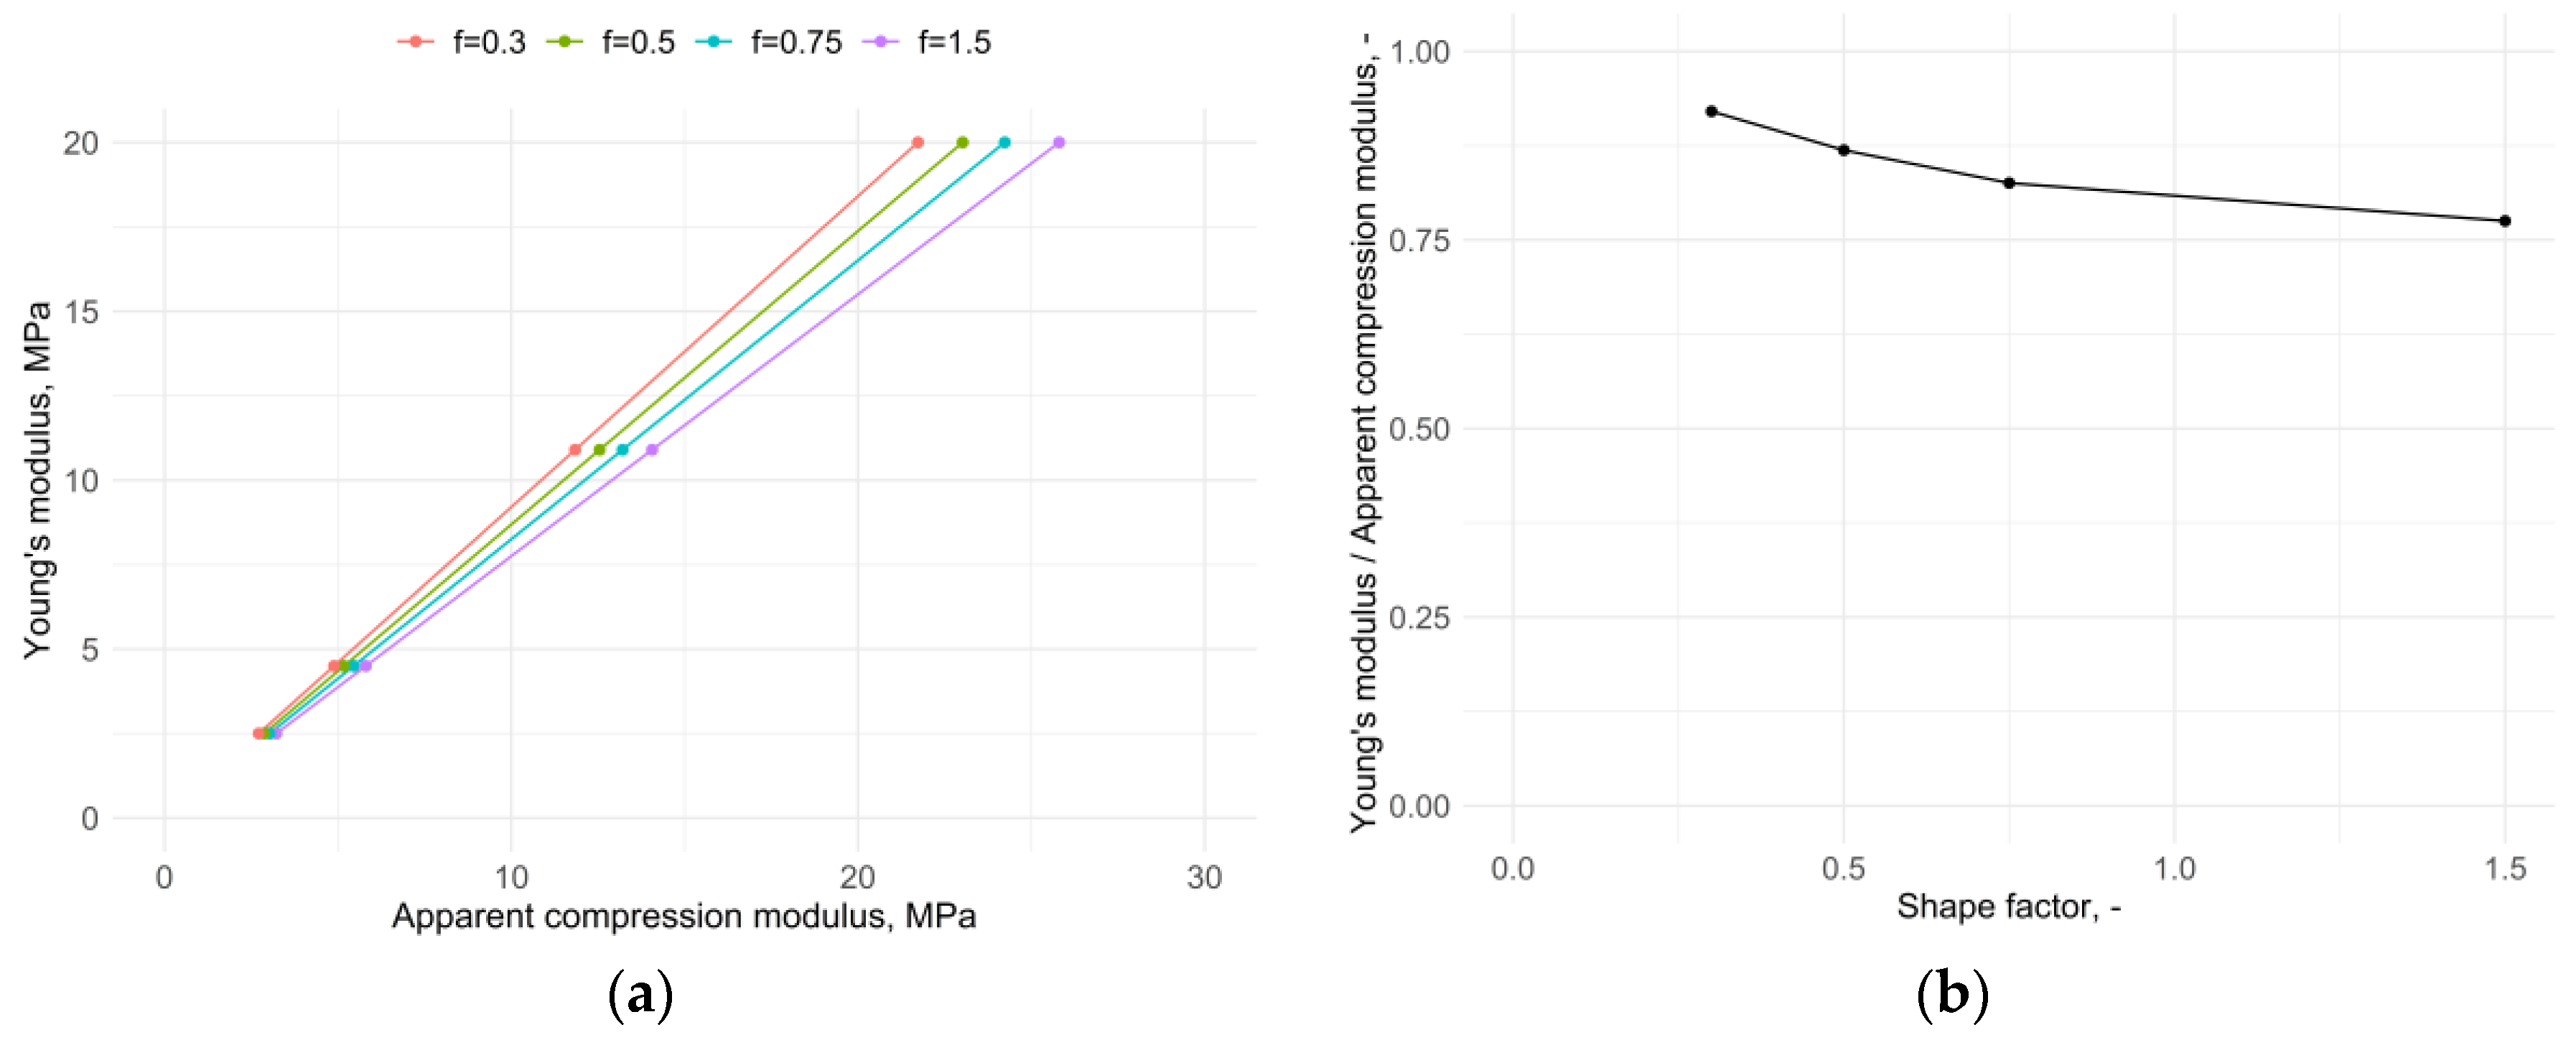
In the matter of frictional contact between sample and plates, different values of Young’s modulus and shape factors were introduced as inputs for simulating compression behaviour. The values of Young’s modulus were based on the results obtained for four different cork–rubber materials with distinct hardness. Regarding geometry, all models considered had the same square cross-section differing only in thickness. With each analysis results, the apparent compression modulus was calculated by the ratio between stress obtained for a certain strain—in this study, a 10% strain was considered.
A plot between Young and apparent compression moduli, for each shape factor, is presented in
Figure 7a. A linear relationship between the two parameters is noticeable. The ratio between Young and apparent compression moduli, for each shape factor, is presented in
Figure 7b.
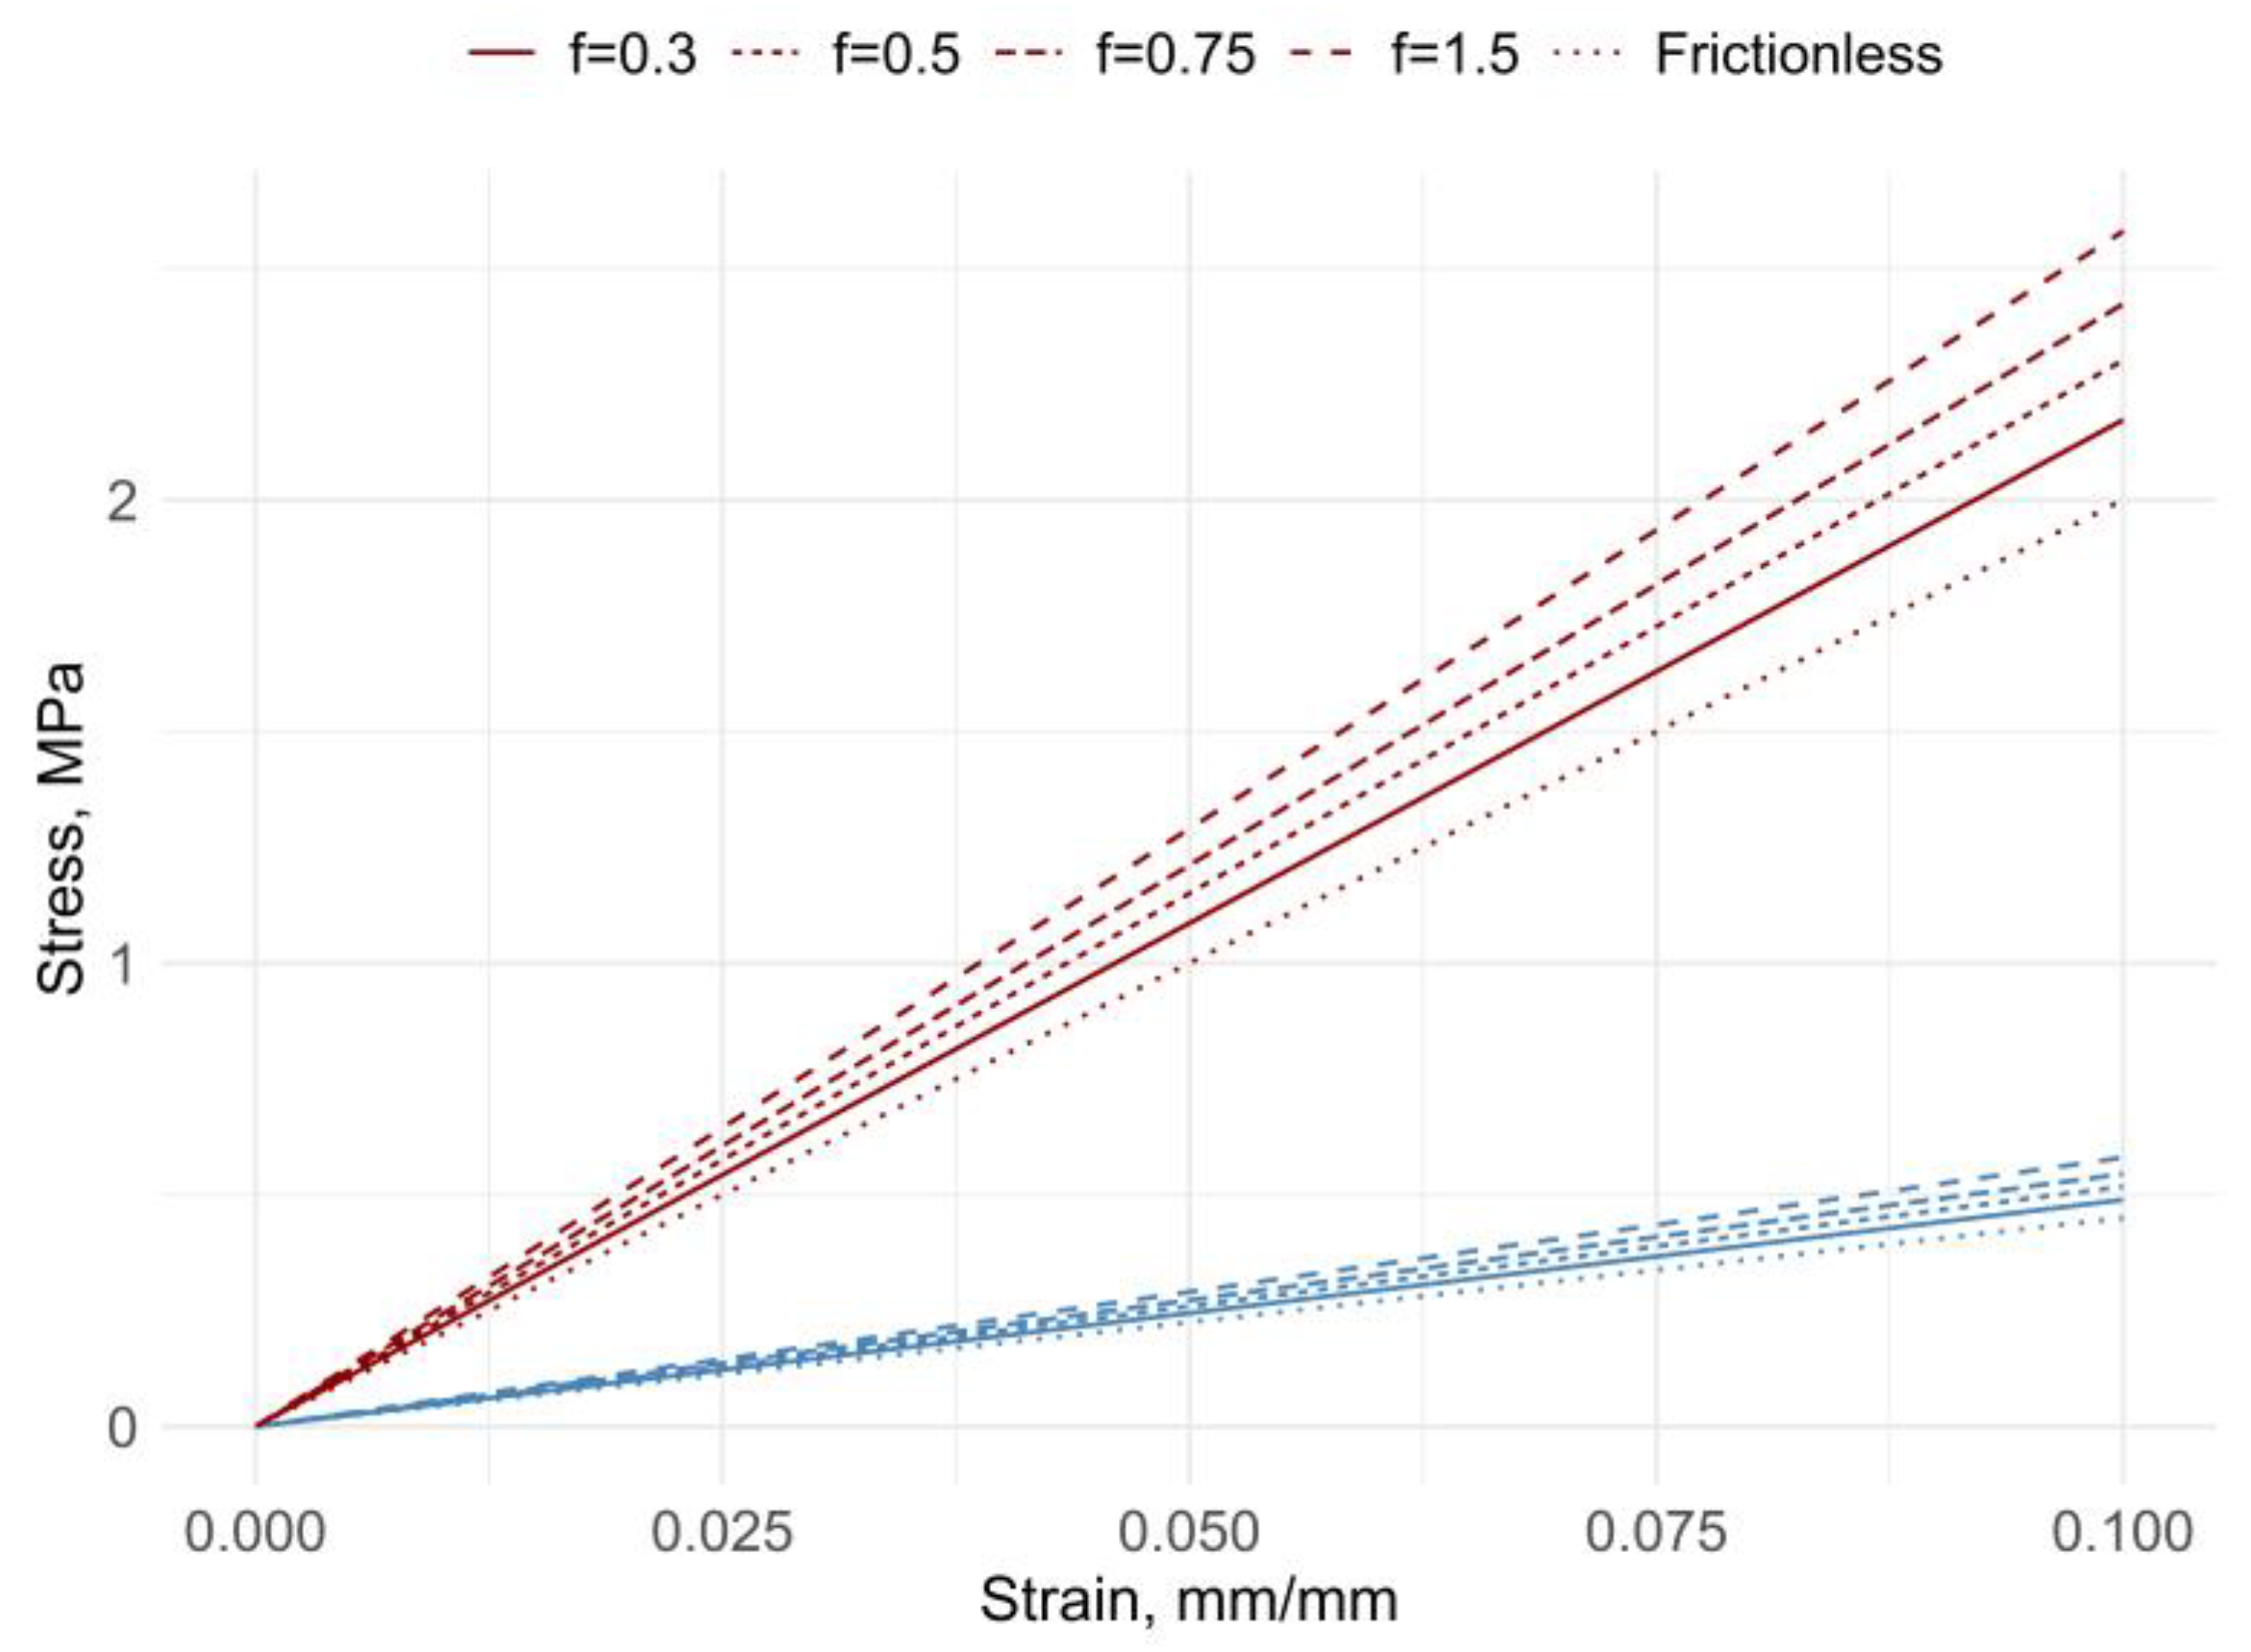
Figure 8 presents stress–strain plots for two values of Young’s modulus, for several shape factors, to highlight differences between distinct stiffness material compounds. With higher stiffness materials, there seemed to exist more significant differences between shape factors.
4.3. Comparison between Experimental and Simulation Results: Frictional Contact
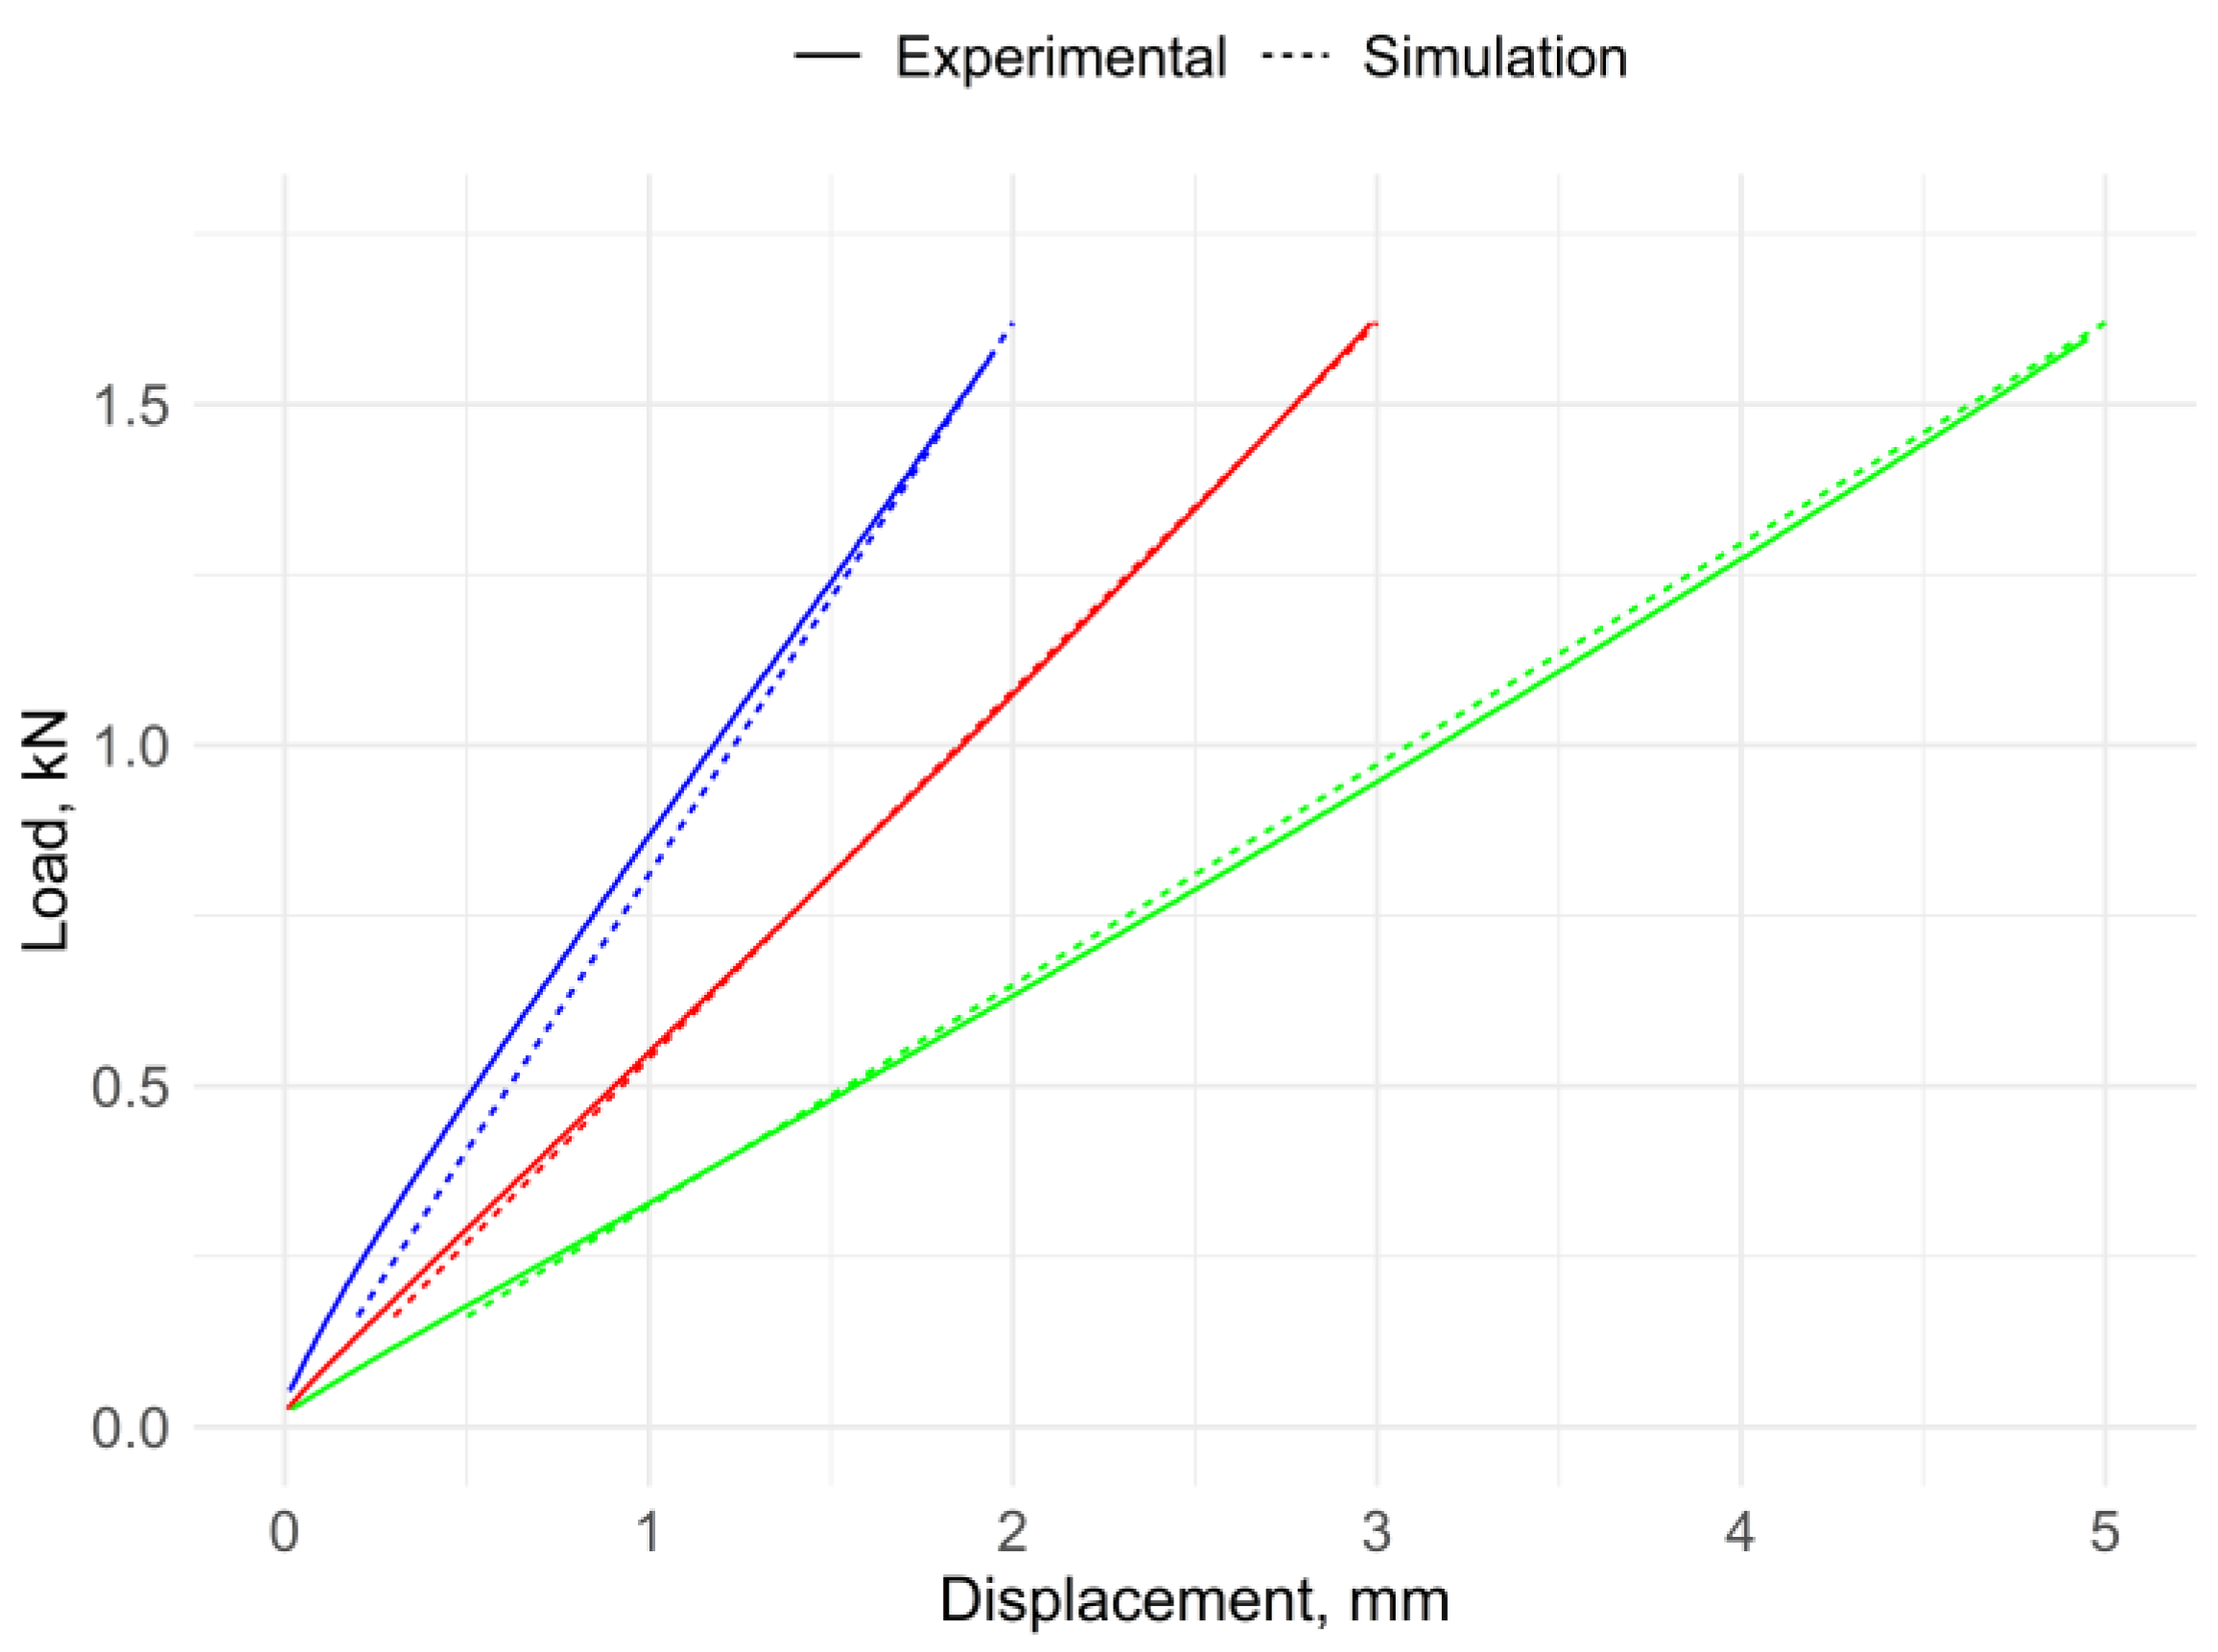
Regarding the compression without lubricant between rubber block samples and plates, a comparison between experimental and simulation results was also performed to evaluate the performance of the proposed simulation approach.
Based on the experimentally determined apparent compression modulus, Young’s modulus used as input for the FEA experiment was determined using the relation obtained according to the specimen’s shape factor, as presented in
Figure 7b. The resulting reaction forces to approximately 10% strain were compared with the results from experimental compression tests.
Figure 9 presents the results for samples with 1.5 and 0.75 shape factors values. As is it possible to observe, the results of both approaches were relatively close, although there was a better agreement regarding the lower shape factor example.
4.4. Comparison between Experimental and Simulation Results: Frictional Contact
The ratio of apparent compression modulus and Young’s modulus, obtained from the presented methodology, was compared with the results obtained by the application of models developed by Lindley [
16] and Williams’ [
20] models.
Table 1 presents the FEA results for two types of cross-section-circular and -square, and the results obtained from the application of the two theoretical models regarding a cylinder shape. There were few differences in the relation between Young (
E0) and apparent compression moduli (
Ec) between FEA data concerning the shape of the cross-section. The parameters’ values and maximum differences between analytical and numerical approaches are presented in
Table 1.
For the range of shape factors considered, it was possible to notice that differences between the application of analytical models and the finite element approach did not exceed 5%. Although the maximum error occurs when the geometry considered for the theoretical models and finite-element simulations are not identical-based on the assumption that, in this case, the same shape factor geometries had similar compression behaviour, there seemed to be a good correspondence between results. Overall, the FEA approach seemed to show a closer agreement with results from Lindley’s model, rather than Williams’, probably due to the increased complexity of the first theoretical model.
5. Conclusions
To determine the axial deformation of cork–rubber square cross-section blocks when subject to compression between two surfaces with frictional contact, a methodology for estimating the relation between Young and apparent compression moduli was presented. Although there are many analytical models available in the literature for rubber materials, the use of finite element analysis introduces the advantage of providing results according to specific cork–rubber composite properties and geometries. Based on experimental data of frictionless compression tests, the relation between Young’s modulus and apparent compression modulus was determined for some shape factors, recurring to FEA.
The results from numerical analysis indicated a linear relationship between the two moduli for the same shape factor. In addition, regarding frictional contact, the results showed an increase in stiffness for higher shape factors, as is verified and reported in other theoretical models. For the range of shape factors studied, Young’s modulus of cork–rubber composites corresponded to more than 75% of the value of apparent compression modulus. The outputs retrieved from the analysis were compared against experimental compression results with frictional contact. Although relatively close, a better agreement was achieved for the sample with the lowest shape factor. A comparison between the FEA approach and two theoretical models used to evaluate cylinder shapes, was performed. The maximum error between FEA and analytical models was below 5%. Furthermore, for the case study presented, the differences between the use of a disk or a square cross-section block were small, considering the same shape factor and thickness.
The results obtained in this study are limited to a specific type of cork–rubber materials, where the assumption of Hooke’s Law under small strain compression applies. Furthermore, only four different shape factors were analysed, and it was assumed that the behaviour of frictional contact was very similar to a bonded contact type. Future research should address the effect of higher shape factors, other cross-section shapes (rectangular and other polygons), and the friction coefficient between sample and loading surfaces. Moreover, applying this knowledge and relating it to the dynamic compression behaviour of isolation pads could be a topic of interest.


