Article

Optimal Coordination of PV Active Power Curtailment and EVs Charging among Aggregators

by
Andrés Felipe Cortés Borray
1,2,*,
Julia Merino
1,2,
Esther Torres
2 and
Javier Mazón
2
1
TECNALIA, Basque Research and Technology Alliance (BRTA), Astondo Bidea, Building 700, E-48160 Derio, Spain
2
Department of Electrical Engineering, University of the Basque Country (UPV/EHU), 48013 Bilbao, Spain
*
Author to whom correspondence should be addressed.
Appl. Sci. 2020, 10(20), 7176; https://doi.org/10.3390/app10207176
Submission received: 27 August 2020 / Revised: 1 October 2020 / Accepted: 10 October 2020 / Published: 15 October 2020

Abstract

:
With the growing adoption of electric vehicles (EVs) and residential photovoltaic (PV) systems around the world, the distribution system operators (DSOs) are facing several technical challenges on their network planning and operation, particularly on low-voltage grids. As the aggregators are intermediary actors at that system level, they are a promising figure to coordinate these devices in an aggregated manner to help to mitigate adverse effects like overloading of network assets. However, to do so, proper coordination techniques among these entities and the DSO should be developed to avoid further investments in new network assets. In this context, a centralised coordination strategy among aggregators at the DSO level is proposed. By employing a linear programming model, the optimal export limit of PV and charging profile for each aggregator is dictated by the DSO, maintaining the operational limits of the network assets. A case study on two aggregators with moderate and critical penetration levels was carried out. Results show that, by controlling the aggregated export limit of PV power and the aggregated charging rate of EVs, high penetration levels can be integrated into current networks with minor or no need for reinforcing network infrastructure.

1. Introduction

Electric vehicles and renewable sources like photovoltaic systems have dramatically increased worldwide in recent years. Electrification of the transport has enabled a sustainable energy vision for those countries that are reaching high renewable shares in their energy matrix [1]. Particularly, in residential areas, PV systems are being increasingly installed by end users to exploit the self-consumption [2,3] and the capacity to sell their excess of energy to the distribution system operator [4]. For those users with an EV, the self-consumption results in a suitable way to reduce the cost of electricity supply by as much as 36 % [5]. However, the expanding scale of the grid-connected PVs and the connection of EVs may lead to detrimental impacts on the low-voltage (LV) network operation if these devices are not properly managed, as reported in [6,7]. This means that the network would have to face two operational scenarios. First, a significant amount of generation with a low demand condition that leads to overloading the assets of the network and consequent voltage rise due to the reverse power flow. Second, a large charging demand requirement at night, which also leads to an overloading condition with a remarkable voltage drop.
Different solutions to alleviate technical problems on distribution networks with EVs and PVs have been recently proposed and studied in order to provide to the DSO a set of cost-effective tools as an alternative to traditional network reinforcement. For example, the work described in [8] proposes a hierarchical coordination scheme between the DSO and the EVs aggregators to minimise their operational cost and the peak load of the DSO under a linear programming (LP) model. As a result of the optimisation strategy, every aggregator allocates the optimal charging power dictated by the DSO to its EVs. In [9], a coordinated charging strategy based on a quadratic programming (QP) formulation for a large number of EVs is proposed. This strategy consists of three levels, i.e., from the point of view of the transmission system operator, the DSO and the charging station operator. The objective is to minimise the peak load at the transmission level, the load deviation of the DSOs and the energy purchase cost of all charging station operators while satisfying the energy and power needs of their customers. The above two works employ an energy boundary model based on the required energy level of the EVs to evaluate their charging needs. The work introduced in [10] proposes a centralised coordination strategy based on a mixed-integer linear programming formulation for EVs connected to multifamily housing. This model aims to maximise the profits of the aggregator who manages the charging ports while satisfying the power needs of its customers and the thermal capacity of the distribution transformer. In [11], the authors proposed a market framework where the aggregators of EVs interact with a transactive energy agent and the DSO to solve operational problems in the network. This was performed using a bidding model based on linear programming to minimise the total cost of the DSO for obtaining flexibility services from EVs.
On the other hand, in [12], an optimal power flow (OPF) problem based on a quadratic programming formulation is proposed to minimise the energy curtailment of medium-scale PV units by finding an optimal power limit to guarantee the network will operate without thermal or voltage problems. A similar criterion for PV power curtailment in LV networks was employed in [13]. The authors extended the OPF formulation in [12] to the unbalanced three-phase case. They also analysed different PV penetration levels and export limits based on the Monte Carlo approach. In [14], a linear programming model was formulated to define an optimal power threshold to limit the excess of PV energy injected to the LV network. Another unbalanced three-phase case is studied in [15] using a multiobjective OPF problem to minimise network losses and PV power curtailment cost, along with the improvement of voltage magnitude and balance profiles. By employing the weighted sum method, the optimisation problem is handled as a single-objective problem, which is solved by applying the sequential quadratic programming (SQP) technique. It should be clarified that the above works define the maximum PV power injection as a percentage of the inverter capacity. However, such a limit can also be expressed through a reference signal—for instance, when the actual voltage is right over the set upper voltage limit, as in [16,17].
Some research studies [7,18,19] assess these devices for small applications in commercial buildings, residential microgrids and charging stations in parking decks. A smart charging scheme to improve PV self-consumption in commercial facilities using particle swarm optimisation was proposed in [18]. In [7], the authors present a model that maximises the self-consumption of PV and reduces the peak demand of a small microgrid in the Netherlands using bidirectional charging technologies. In [19], a multi-objective optimisation model subject to several constraints imposed by the utility at the point of connection is used to maximise the profits of an EV station with PV units while minimising the capacity loss of a battery energy storage system (BESS) connected to the same facility. Further control techniques based on BESSs and EVs to increase PV generation amount on the network are widely reviewed in [20].
Most of these studies have in common that both the EVs and PVs in sizable quantities are separately analysed, and hence, their combined effect on the network is not considered, especially in LV grids. In this context, this paper proposes a centralised control strategy for managing the aggregation of both the excess of PV power injected to the LV network and the charging of EVs in multiple aggregators under a unique DSO. With this control strategy, the computational effort of the proposed optimisation problem is highly reduced, as well as the amount of data exchange between the aggregators and DSO. The loading level of the DSO’s assets, i.e., main cables and distribution transformers, is adopted as a key parameter to evaluate their performance when introducing a high penetration level of EVs and PVs. The proposed methodology was designed to be applicable for the context where the DSO manages the LV network by means of the aggregators at the LV side of the distribution transformers, i.e., each aggregator supervises and controls a particular feeder. Note that with the introduction of the advance metering infrastructure in residential housing, this coordination schema can be expanded to dynamically responding to a time-of-use price mechanism for each aggregator. Additionally, an energy boundary model to evaluate the charging requirements of the EVs controlled by each aggregator was proposed. This model differs a unique aspect from the one formulated in [8,9]; the proposed model here is based on the arrival energy level of the EVs instead of their required energy state.
This article is organised as follows: Section 2 describes the individual and aggregated mathematical model of EVs and PVs. The optimisation model of the centralised control strategy by the DSO is formulated in Section 3. In Section 4, a numerical case study is introduced, and Section 5 discusses the results and the effectiveness of the proposed coordination strategy. Finally, conclusions and hints on future works are presented in Section 6.

2. Mathematical Modelling of PVs and EVs

2.1. Model of PVs

The power generation from the PV systems under aggregator k is modelled using the formulation introduced by the authors in a previous work [14]. The aggregation of the available PV power generation ( P k P V ) at time t is defined by Equation (1) as the summation of the expected power from the individual PV unit ( p k , i P V ) connected at household i.
P k P V ( t ) = i N k P V p k , i P V ( t ) , k K , t = 0 , , N s l o t s
where N k P V is the set of households under aggregator k with a grid-connected PV system, and N s l o t s is the number of discrete-time slots by considering a time step t s and an interval length Δ t = t s / 60 for an evaluation period T, i.e., N s l o t s = T / Δ t .

2.2. Individual EV Model

The charging process of an EV j managed by an aggregator k can be modelled by its power and energy boundaries ( e k , j u p p e r / l o w e r ,   p k , j u p p e r ) , which enclose the optimal charging paths that fulfill its energy requirements. These boundaries are based on the arrival/objective energy level of each EV j, which can be calculated using Equations (2) and (3).
e k , j a r r = S O C m a x · B C k , j E C R k , j · d k , j
e k , j o b j = S O C k , j o b j · B C k , j
where B C k , j is the battery capacity of the vehicle in kWh; S O C m a x is the maximum state of charge of the vehicle’s battery, which is often limited to 95 % ; S O C k , j o b j is the objective state of charge that fulfils the owner’s driving demand, which can also be equal to S O C m a x ; E C R k , j is the energy consumption rate of the vehicle in kWh/km, and d k , j is the daily travelled distance in km, which is typically described by a log-normal distribution function [21,22].
Based on the parameters defined above, the energy limits of the jth EV under aggregator k are formulated by recursion as defined by Equation (4).
e k , j u p p e r ( t ) = e k , j l o w e r ( t ) = e k , j a r r , k K , j N k E V , t = 0 , , t k , j a r r + 1
e k , j u p p e r ( t k , j a r r + t ) = m i n { e k , j u p p e r ( t k , j a r r + t 1 ) + p c h m a x · η c h · Δ t , e k , j o b j } , k K , j N k E V , t = 1 , , N s l o t s t k , j a r r
e k , j l o w e r ( t k , j d i s + t ) = e k , j o b j , k K , j N k E V , t = t k , j d i s , , N s l o t s t k , j d i s
e k , j l o w e r ( t k , j d i s t ) = m a x { e k , j l o w e r ( t k , j d i s t + 1 ) p c h m a x · η c h · Δ t , e k , j a r r } , k K , j N k E V , t = 1 , , t k , j p + 1
Equation (4) imposes that the energy state of an EV before its arrival time ( t k , j a r r ) must be equal to its arrival energy level for both the upper and lower energy boundaries, as the energy state previous to this event is unknown for the aggregator. Equation (5) specifies that the upper energy state of the EV j at time t could be at most p c h m a x · η c h · Δ t higher than the energy level at the previous period, but it should not be larger than its objective energy, where Δ t is the time slot, p c h m a x and η c h are the nominal capacity and the efficiency of the EV charger. Equations (6) and (7) enforce that the lower energy state of the jth EV at the time when disconnected ( t k , j d i s ) must match with its objective energy level, and in previous periods ( t k , j d i s t ) could be at most p c h m a x · η c h · Δ t lower than its value at ( t k , j a r r + t 1 ) but cannot be lower than its arrival energy state. Notice that the expected disconnection time t k , j d i s is equal to t k , j a r r + t k , j p , where t k , j p is the number of discrete-time intervals of vehicle j parking at home under aggregator k.
As the maximum charging power of an EV j is limited by the rated power of its charger, its upper power boundary ( p k , j u p p e r ) in the time slot t can be defined by Equation (8). Notice that its charging power must be equal to zero for a time step out of the interval [ t k , j a r r , t k , j d i s ] . It is worth mentioning that its lower power boundary is set to zero because only the charging process is considered.
p k , j u p p e r ( t ) = p c h m a x · η c h , t = t k , j a r r , , t k , j d i s , k K , j N k E V

2.3. Aggregation of EVs

The summation of the individual energy and power boundaries of a series of EVs under aggregator k is employed to evaluate their aggregated flexibility, as given by Equations (9) and (10). When the aggregators collect this information, they send it to the DSO to centrally optimise the charging profile for each of these. As each aggregator only reveals its aggregated energy and power requirements, this avoids disclosing private information of their customers with the DSO.
E k u p p e r / l o w e r ( t ) = j N k E V e k , j u p p e r / l o w e r ( t ) , k K , t = 0 , , N s l o t s
P k u p p e r ( t ) = j N k E V p k , j u p p e r ( t ) , k K , t = 0 , , N s l o t s

3. Centralised Optimisation by the DSO for Multiple Aggregators

In this stage, the DSO seeks to coordinate for each aggregator, its maximum PV generation and the charging power of all their EVs to maximise the operational performance of the network and fulfill the energy and power needs of the end users. Since the total PV power managed by an aggregator k could overload the DSO’s assets due to the reverse power flow, it has to be limited to a certain power level, i.e., it should be applied an active power curtailment strategy (e.g., fixing a maximum point to active power [12,13,14,15] or considering a reference signal as the voltage at the connection node [16,17]) for the PV units under that aggregator. Both the export limit of PV power and the charging profile for each aggregator are centrally calculated based on a linear optimisation model which takes as inputs the requirements of each aggregator, its forecasted load profile and the thermal limits of the network’s assets. The optimisation problem to be solved at every time step is formulated as shown in Equation (11).
m a x i m i s e f = k K t N s l o t s P k , t P V · ζ k , t + k K t N s l o t s P k , t E V ω · k K t N s l o t s O L k , t γ · k K t N s l o t s Δ k , t P
The first term of the objective function seeks to maximise the aggregated PV power generation by dynamically adjusting the export limit ζ of all aggregators, which is between zero and one, in order to maintain the thermal limits of the distribution transformer and the main service cables at the LV side. The second term indicates the optimal charging power ( P k , t E V ) for the aggregator k at time t. In the third term, the overloading condition due to an unexpected massive EV charging during peak demand on the feeders from the distribution transformer at each time interval is penalised employing a large positive weight ω . Note that the overloading is represented by the penalty deviation variable O L k , t which helps to ensure the problem feasibility. The last term penalises significant variations in the charging rate ( Δ k , t P ) of each aggregator using a large positive factor γ .

Aggregators Constraints

Following the above linear objective function, constraint (12) ensures that the absolute value of the net power of all aggregators should not exceed the rated capacity of the distribution transformer j in kW, i.e., S T r a n s j r a t e d · cos ( φ ) . Nevertheless, the distribution transformer could be subjected to overload conditions in case of a considerable charging demand or reverse power flow derived from the EVs and PVs of each aggregator. Similarly, constraint (13) imposes the absolute value of the maximum power flow through the main cable of the feeder managed by the kth aggregator, which can also be subjected to temporary overloads. In order to handle these situations, those constraints are relaxed by introducing the penalty deviation variable O L k , t , as mentioned before. By adding these two nonlinear constraints (because of the absolute value function), the linear programming (LP) problem becomes a mixed-integer linear programming (MILP) model after linearising them.
Equation (14) constrains that the optimal charging power for the kth aggregator at every time step should not be larger than the maximum power allowed on the feeder’s main cable, i.e., the minimum value between the upper power boundary of the kth aggregator ( P k , t u p p e r ) , and the difference between the rated capacity of the main cable ( P L i n e k r a t e d = S L i n e k r a t e d · cos ( φ ) ) and the forecasted power demand ( P L i n e k , t f c ) on such a feeder. Notice that this limit of power can eventually be violated by a massive charging demand for a given period because of use of O L k , t . Constraint (15) imposes that the aggregated rate of charge ( Δ k , t P ) of the aggregator k should not display significant variations in power over consecutive time steps in order to limit the thermal stress in the main cable of its feeder. As the current charging level is compared to the one at the previous time step, this constraint is defined for all intervals where P k , t u p p e r is different from zero. Constraint (16) ensures that the optimal charging power of each aggregator satisfies their forecasted cumulative energy boundaries. Note that the complexity of this optimisation problem is mainly given by the number of aggregators and the length of the evaluation period ( N s l o t s ) , which makes the proposed problem easily solved. After solving this convex optimisation model, the DSO sends the optimal charging profile to each aggregator for further intelligent dispatching.
k K ( P k , t P V · ζ k , t ( P k , t E V + P L i n e k , t f c ) ) S T r a n s j r a t e d · cos ( φ ) + k K O L k , t , t , j T r a n s
P k , t P V · ζ k , t ( P k , t E V + P L i n e k , t f c ) S L i n e k r a t e d · cos ( φ ) + O L k , t , k K , t
P k , t E V m i n { P k , t u p p e r , P L i n e k r a t e d P L i n e k , t f c } + O L k , t , k K , t
P k , t 1 E V Δ k , t P P k , t E V P k , t 1 E V + Δ k , t P , k K , t if P k , t u p p e r 0
E ( k , t m i n k a r r + t ) l o w e r j N k E V e k , j a r r + τ t P ( k , t m i n k a r r + τ ) E V · Δ t E ( k , t m i n k a r r + t ) u p p e r , k K , t = 0 , , N k p i n t
In Equation (16), t m i n k a r r is the minimum arrival time of all the arrivals of the EVs managed by the kth aggregator, i.e., m i n t k , 1 a r r , t k , 2 a r r , , t k , n a r r , and N k p i n t = t m a x k d i s t m i n k a r r , the number of parking time slots of the kth aggregator. Note that all time parameters are discrete, i.e., these are divided by Δ t .
In addition, it is worth mentioning that the formulated convex problem can be extrapolated into a more extensive distribution system at the medium-voltage (MV) level. This means that the aggregators would operate at the MV side instead of the LV side of the distribution transformers. Hence, the nominal capacity and the initial load in constraints (13) and (14) should be considered per distribution transformer and not per feeder. Moreover, constraint (12) should be limited to the rated power of the main distribution transformer located at the high-voltage (HV)/MV substation.

4. Case Study

In order to demonstrate the performance of the proposed convex optimisation problem, it has been applied to two residential communities supplied by individual feeders with a rated capacity of 149 kVA, which are derived from a 350 kVA distribution transformer. Each feeder supplies power to 55 and 75 households, respectively, with a lagging power factor of 0.95 . Every feeder is managed by an aggregator ( K = 2 ) . Data of residential load and network parameters were collected from [23].
The battery of a Nissan Leaf [24] was selected for all EVs ( B C = 24 kWh and E C R = 0.1778 kWh/km). The rated capacity of each EV charger p c h m a x is 3.7 kW with a charging efficiency of 92 % . Both the daily travelled distance and the arrival time are stochastic. The first parameter follows a log-normal distribution N ( μ l n = 2.89257 ,   σ l n = 0.91779 ) [25], and the second one follows a truncated normal distribution function N ( μ = 16 : 00 ,   σ = 3 h   , t m i n = 11 : 00 ,   t m a x = 23 : 00 ) [26]. It is assumed that all EVs owners would expect and objective S O C equal to 95 % at the end of the charging period.
Considering that residential PV systems can vary in a range from 2 to 5 kW [27], the PV units size is defined with the last value, operating with a unity power factor. The yearly ambient temperature and solar irradiance data were collected from [28] to model the uncertainty of PV generation.
A moderate and critical penetration level (PL) for both the EVs and PVs in each feeder was considered, i.e., 50 % and 100 % , respectively. For example, a moderate PL in the first feeder means that 27 of the 55 households have both a PV and EV operating at certain time slots of the test period. Moreover, it is considered a time step t s = 10 min for an evaluation period of T = 30 h, i.e., N s l o t s = 180 . Both weight parameters ω and γ are adjusted to 1000 to satisfy the control choices of the DSO. The proposed optimisation model is solved via CPLEX 12.9 under its API in Python (DOcplex) [29], employing a laptop with a four cores Intel Core i7 processor and 12 GB memory. It takes less than 0.1 s to solve the proposed optimisation problem for both penetration levels.

5. Results and Discussion

This section presents and analyses the results obtained by employing the proposed coordination strategy among two aggregators considering two different penetration levels of PVs and EVs. 
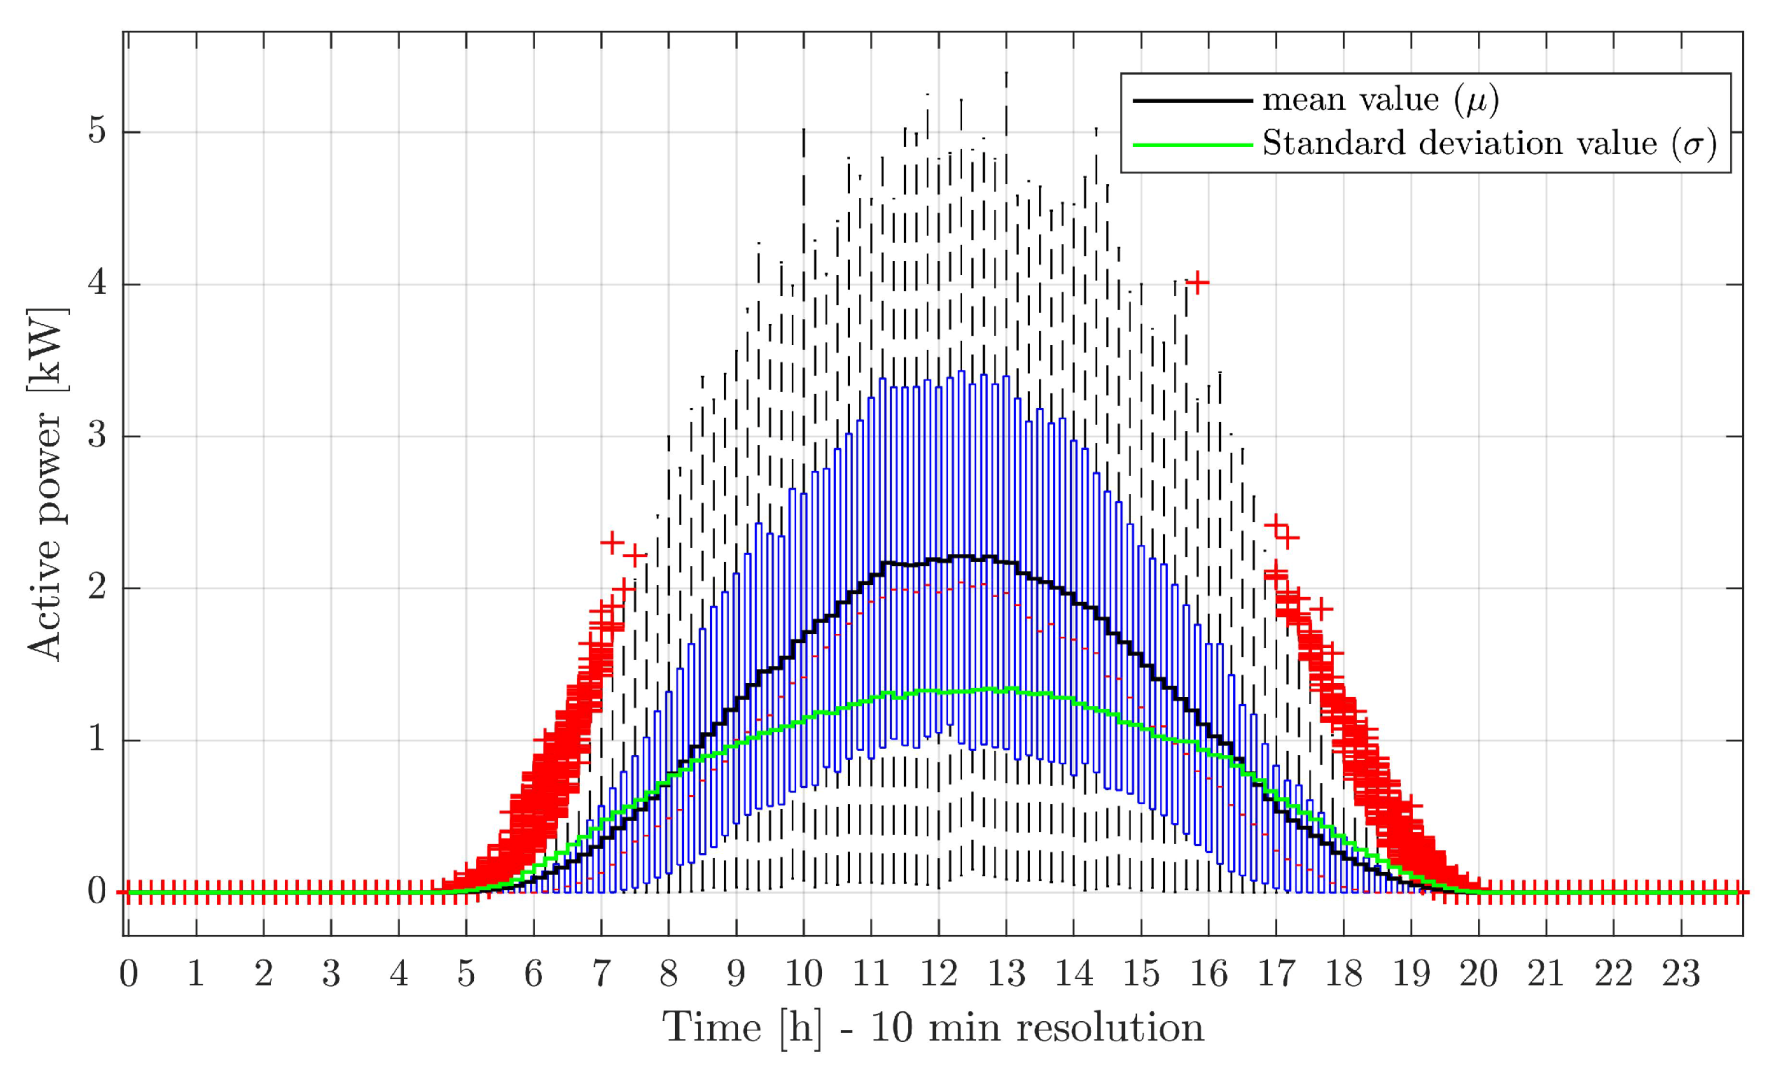
Figure 1 shows the statistical daily power generation for a 5 kW single-phase PV system with a 10 min resolution interval as a result of the model in Section 2.1. Based on these outcomes, the PV power output of each end user within the kth aggregator is randomly generated based on the mean and standard deviation value at each time step from the above figure. Then, the resulting PV power profiles are aggregated using Equation (1).
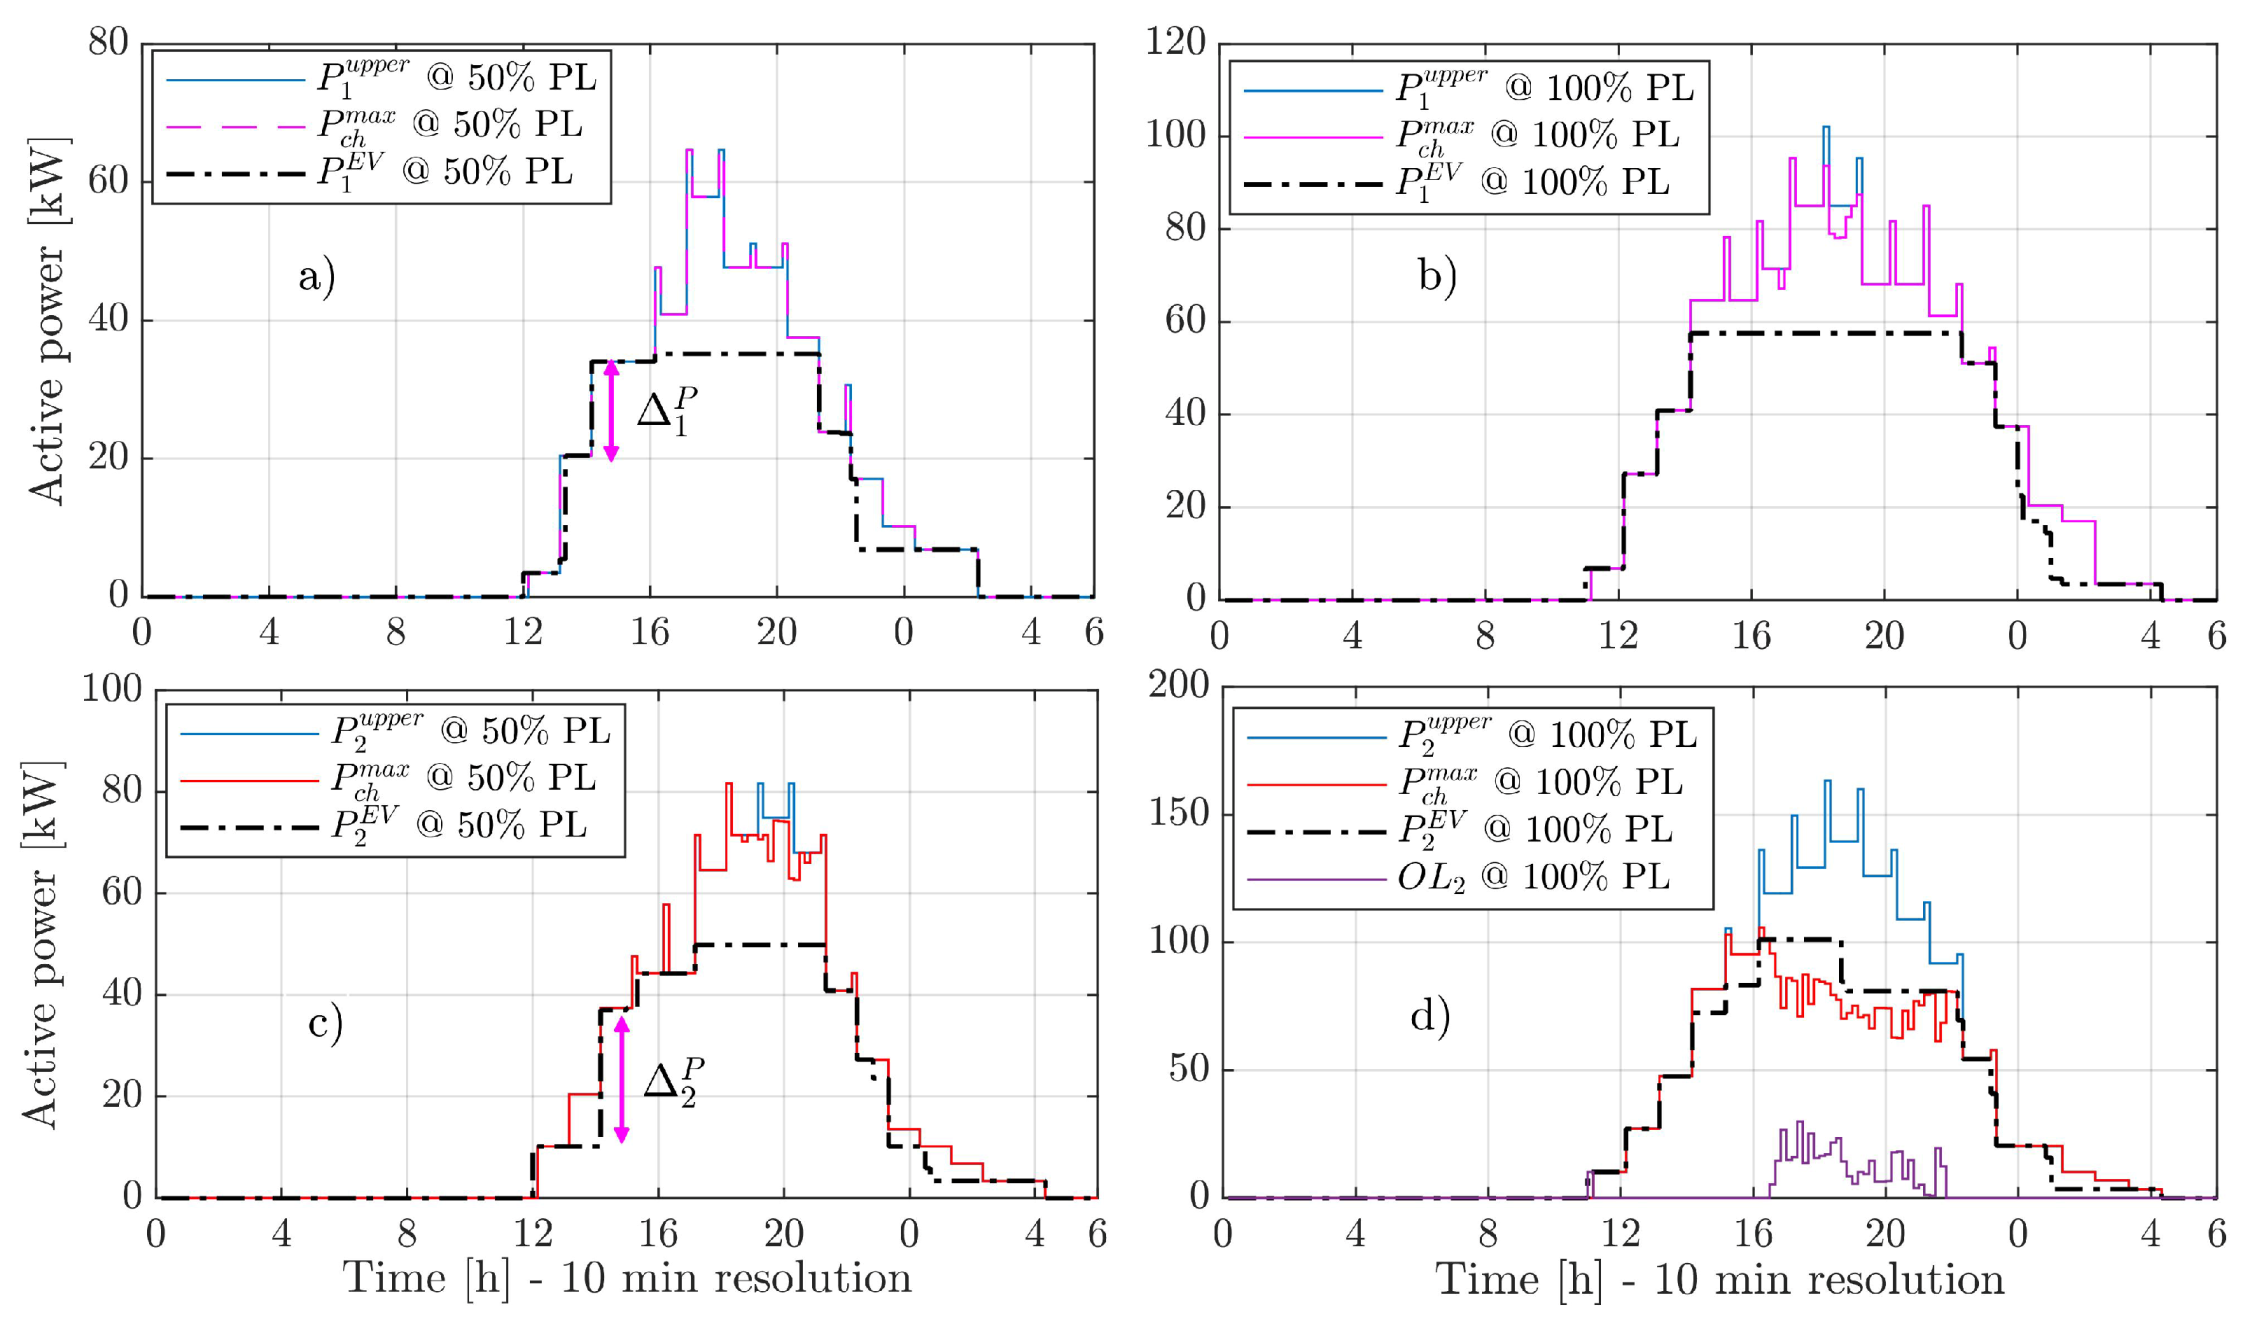
For the aggregation of EVs, Figure 2 compares the upper power boundaries, the maximum charging power ( P c h m a x ) , the overloading conditions ( O L k ) and the optimal charging power ( P k E V ) from both aggregators as a result of the proposed optimisation problem. Figure 2a–c show that the power needs from both aggregators are met thanks to the delay in the charging process and the dynamic adjustment of Δ k P . However, in Figure 2c, it can be seen that the second aggregator surpasses the remaining capacity of its feeder in order to fulfill its charging requirements. Although it seems to occur for an extended period (16:00 to 22:00), in reality, the overloading condition only occurs discontinuously from 20:00 to 22:00 because this situation is analysed from the point of view of the net power on the feeder.
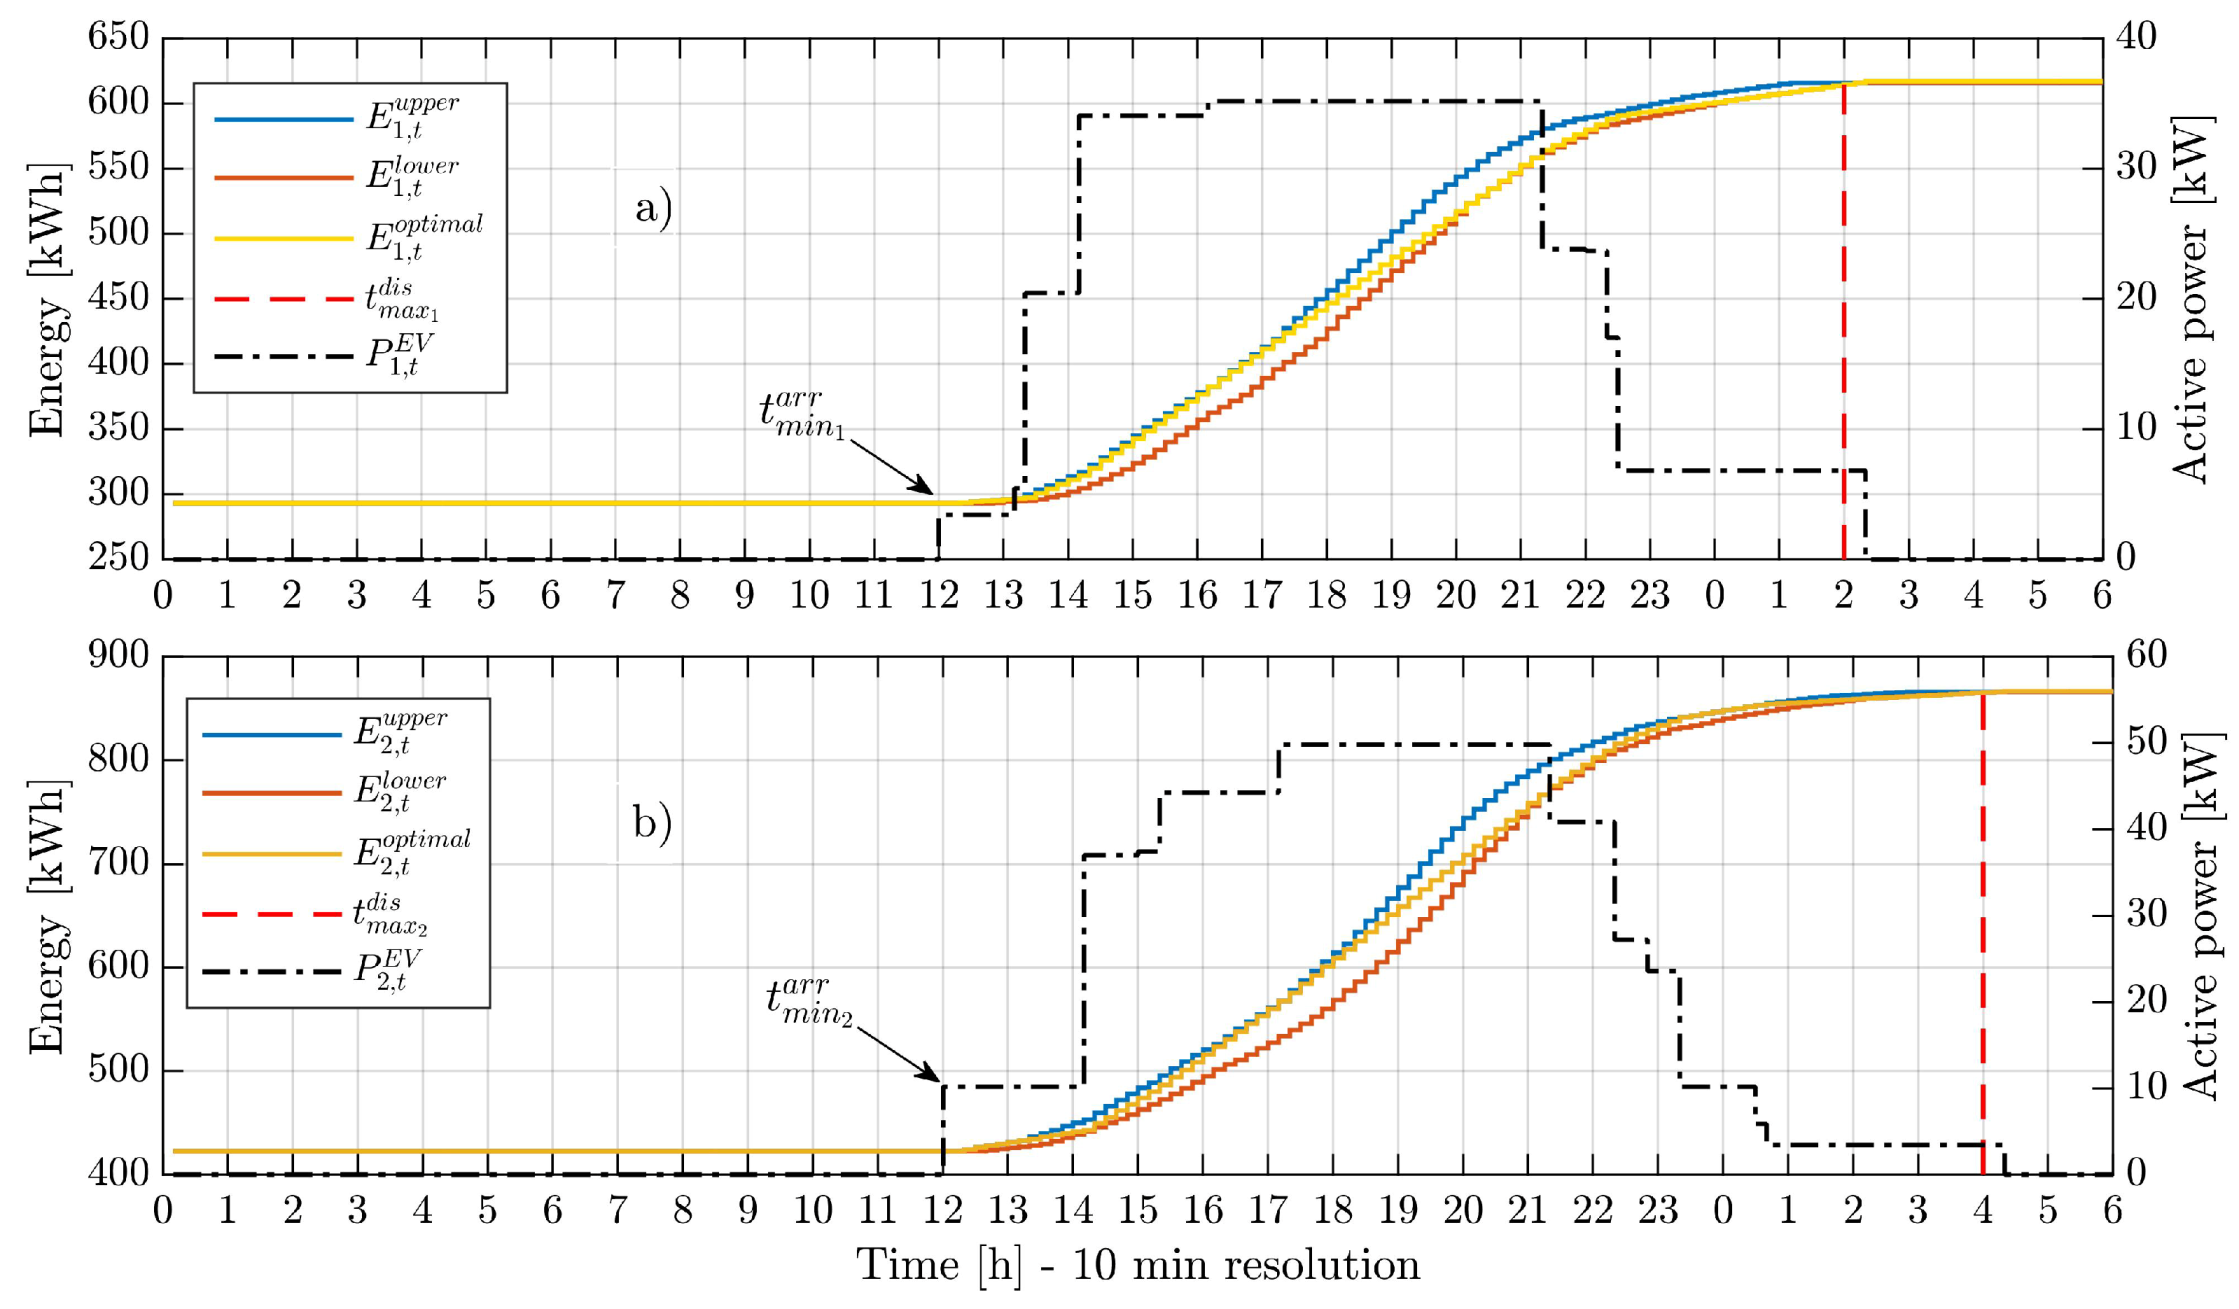
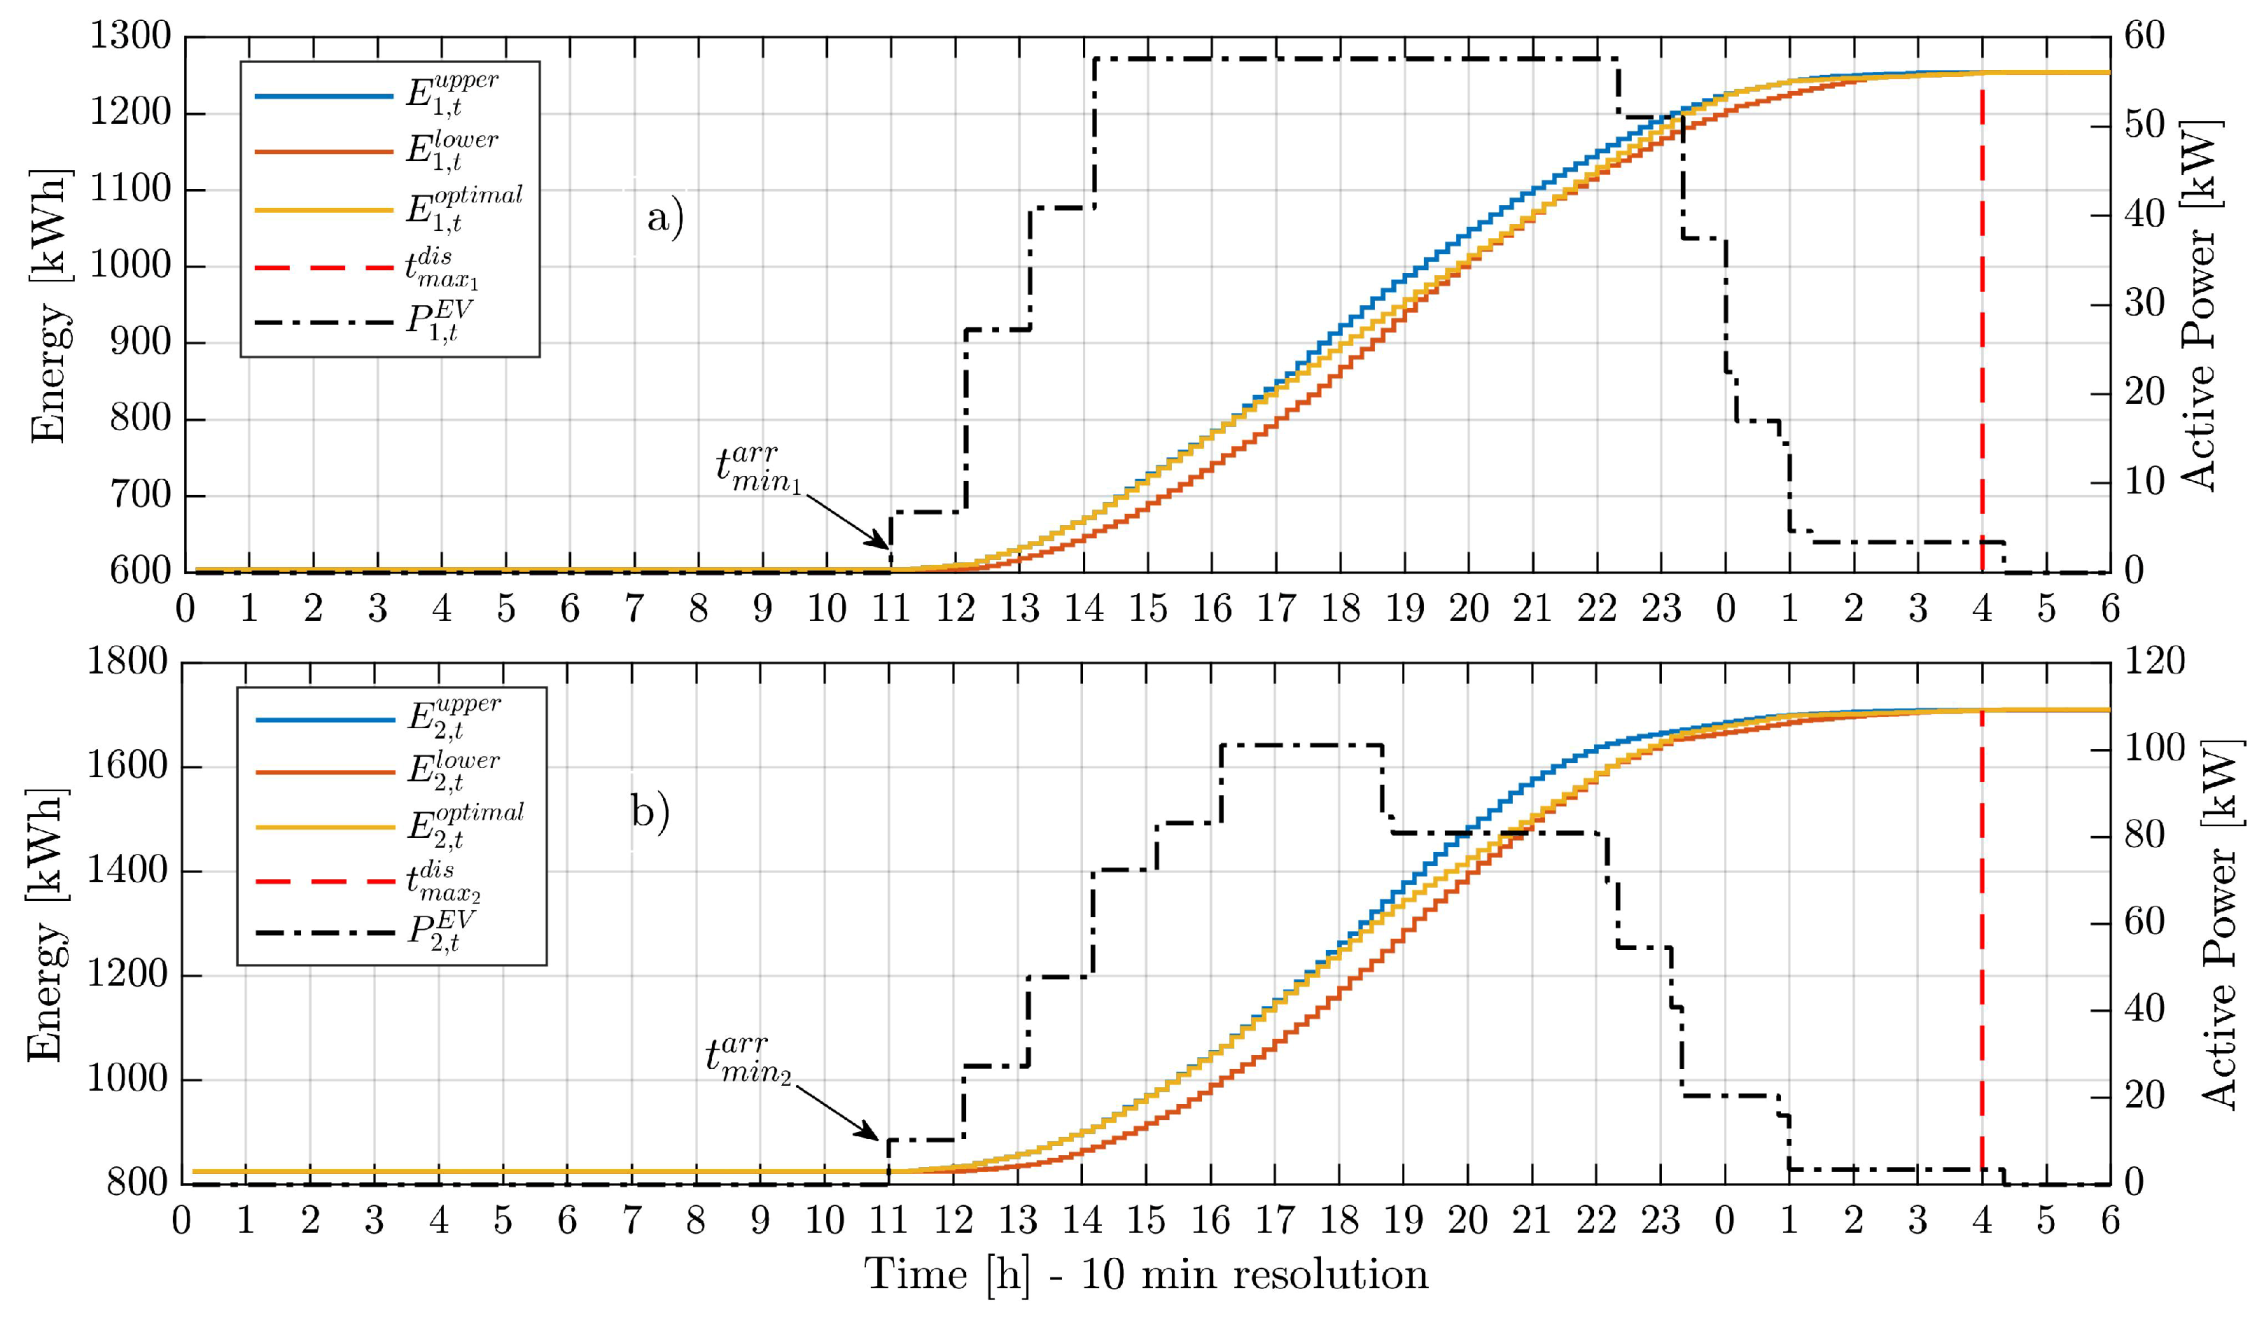
For each aggregator, Figure 3 and Figure 4 depict how the energy supplied to their EVs evolves between their aggregated energy boundaries as a result of the optimal charging profile for both penetration levels. This means that a total of 324 kWh and 446 kWh were delivered by combining the network and the aggregated PV power, respectively, to the EVs managed by each aggregator at the end of their charging periods.
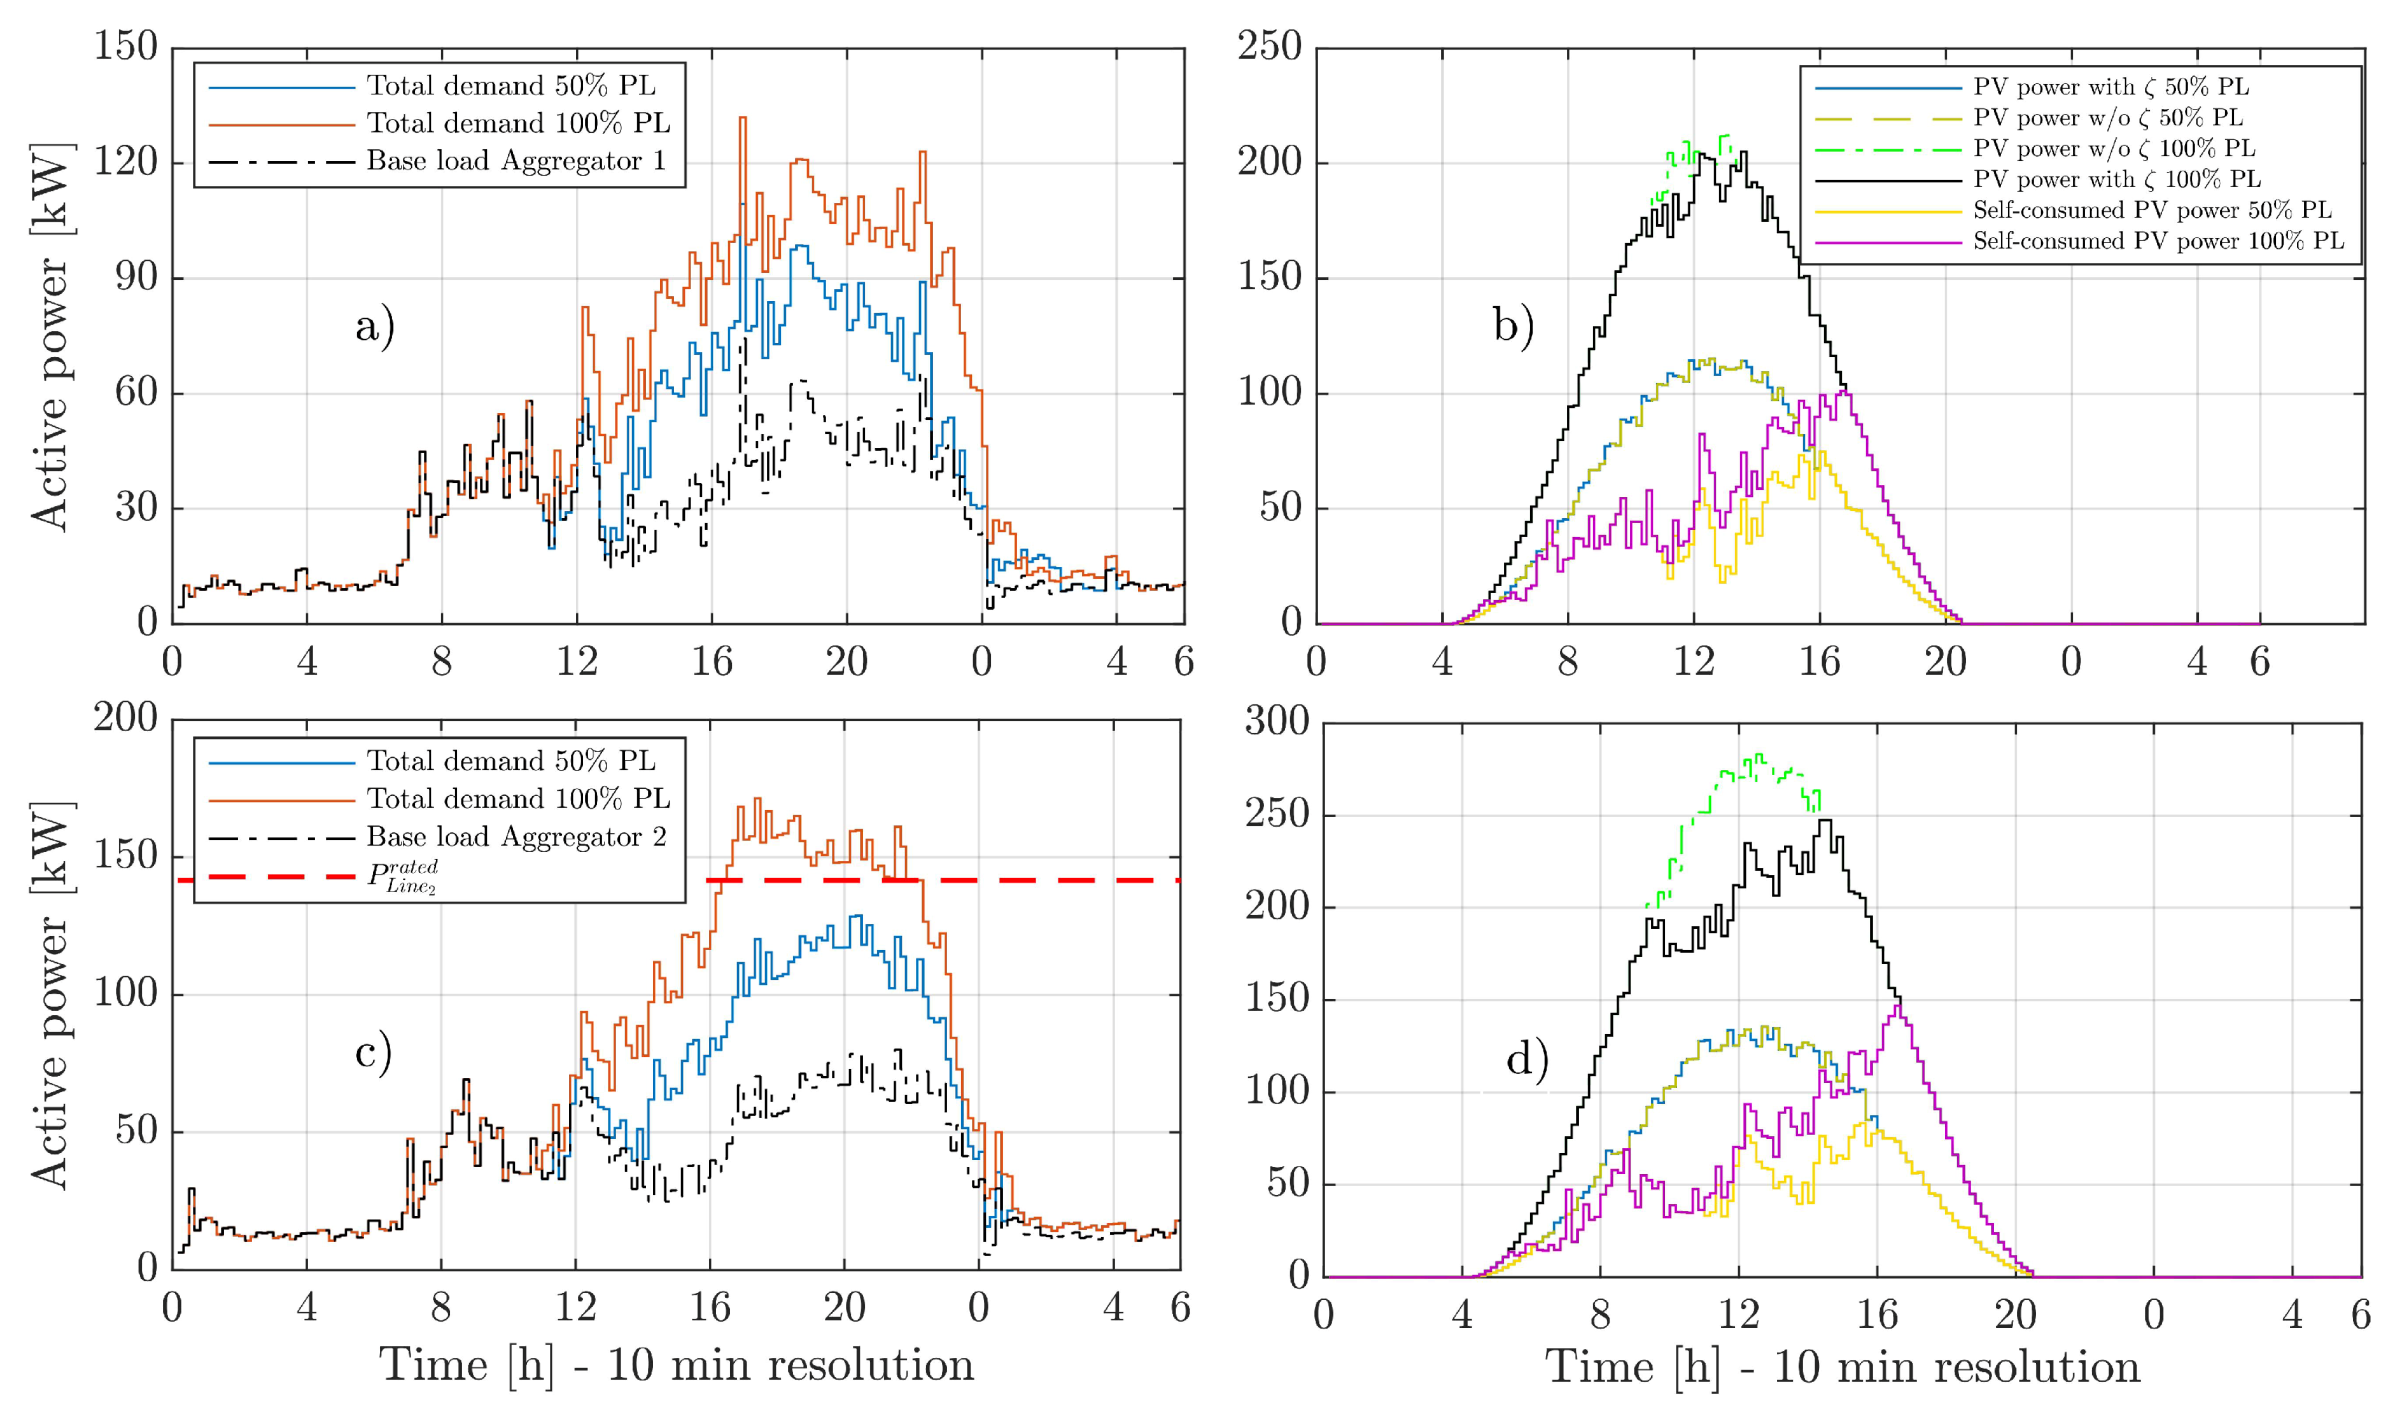
Moderate and critical penetration of EVs and PVs for both aggregators are compared in Figure 5. For a 50 % EV penetration, an increment of 47 % and 60 % in the peak power for each aggregator is observed in Figure 5a,c, respectively. For full EV penetration, each aggregator experiences a peak power increase of 77 % and 114 % , respectively, which means that the second aggregator would exceed the rated capacity of the feeder.
On the other hand, Figure 5b,d compare the real PV power as a result of the optimal export limit value ζ , the total expected PV power without any control action and the self-consumed PV generation. Thus, for moderate PV penetration, no export limit is necessary ( ζ k , t = 100 % ) for each aggregator. In terms of energy, this means to export 415 kWh and 460 kWh to the network and self-consuming 536 kWh and 648 kWh, respectively. Nonetheless, for complete PV penetration, an average export limit of 99 % and 94 % for aggregator 1 and 2 were found, respectively. This means an aggregated curtailment of 36 kWh and 250 kWh for aggregator 1 and 2, respectively. The results show that, as expected, the larger the aggregation of PV, the more reverse power flow and, hence, the lower the average value of ζ . As the power demand increases by the EVs charging power at midday, the PV power curtailment is lower thanks to the self-consumption capability.
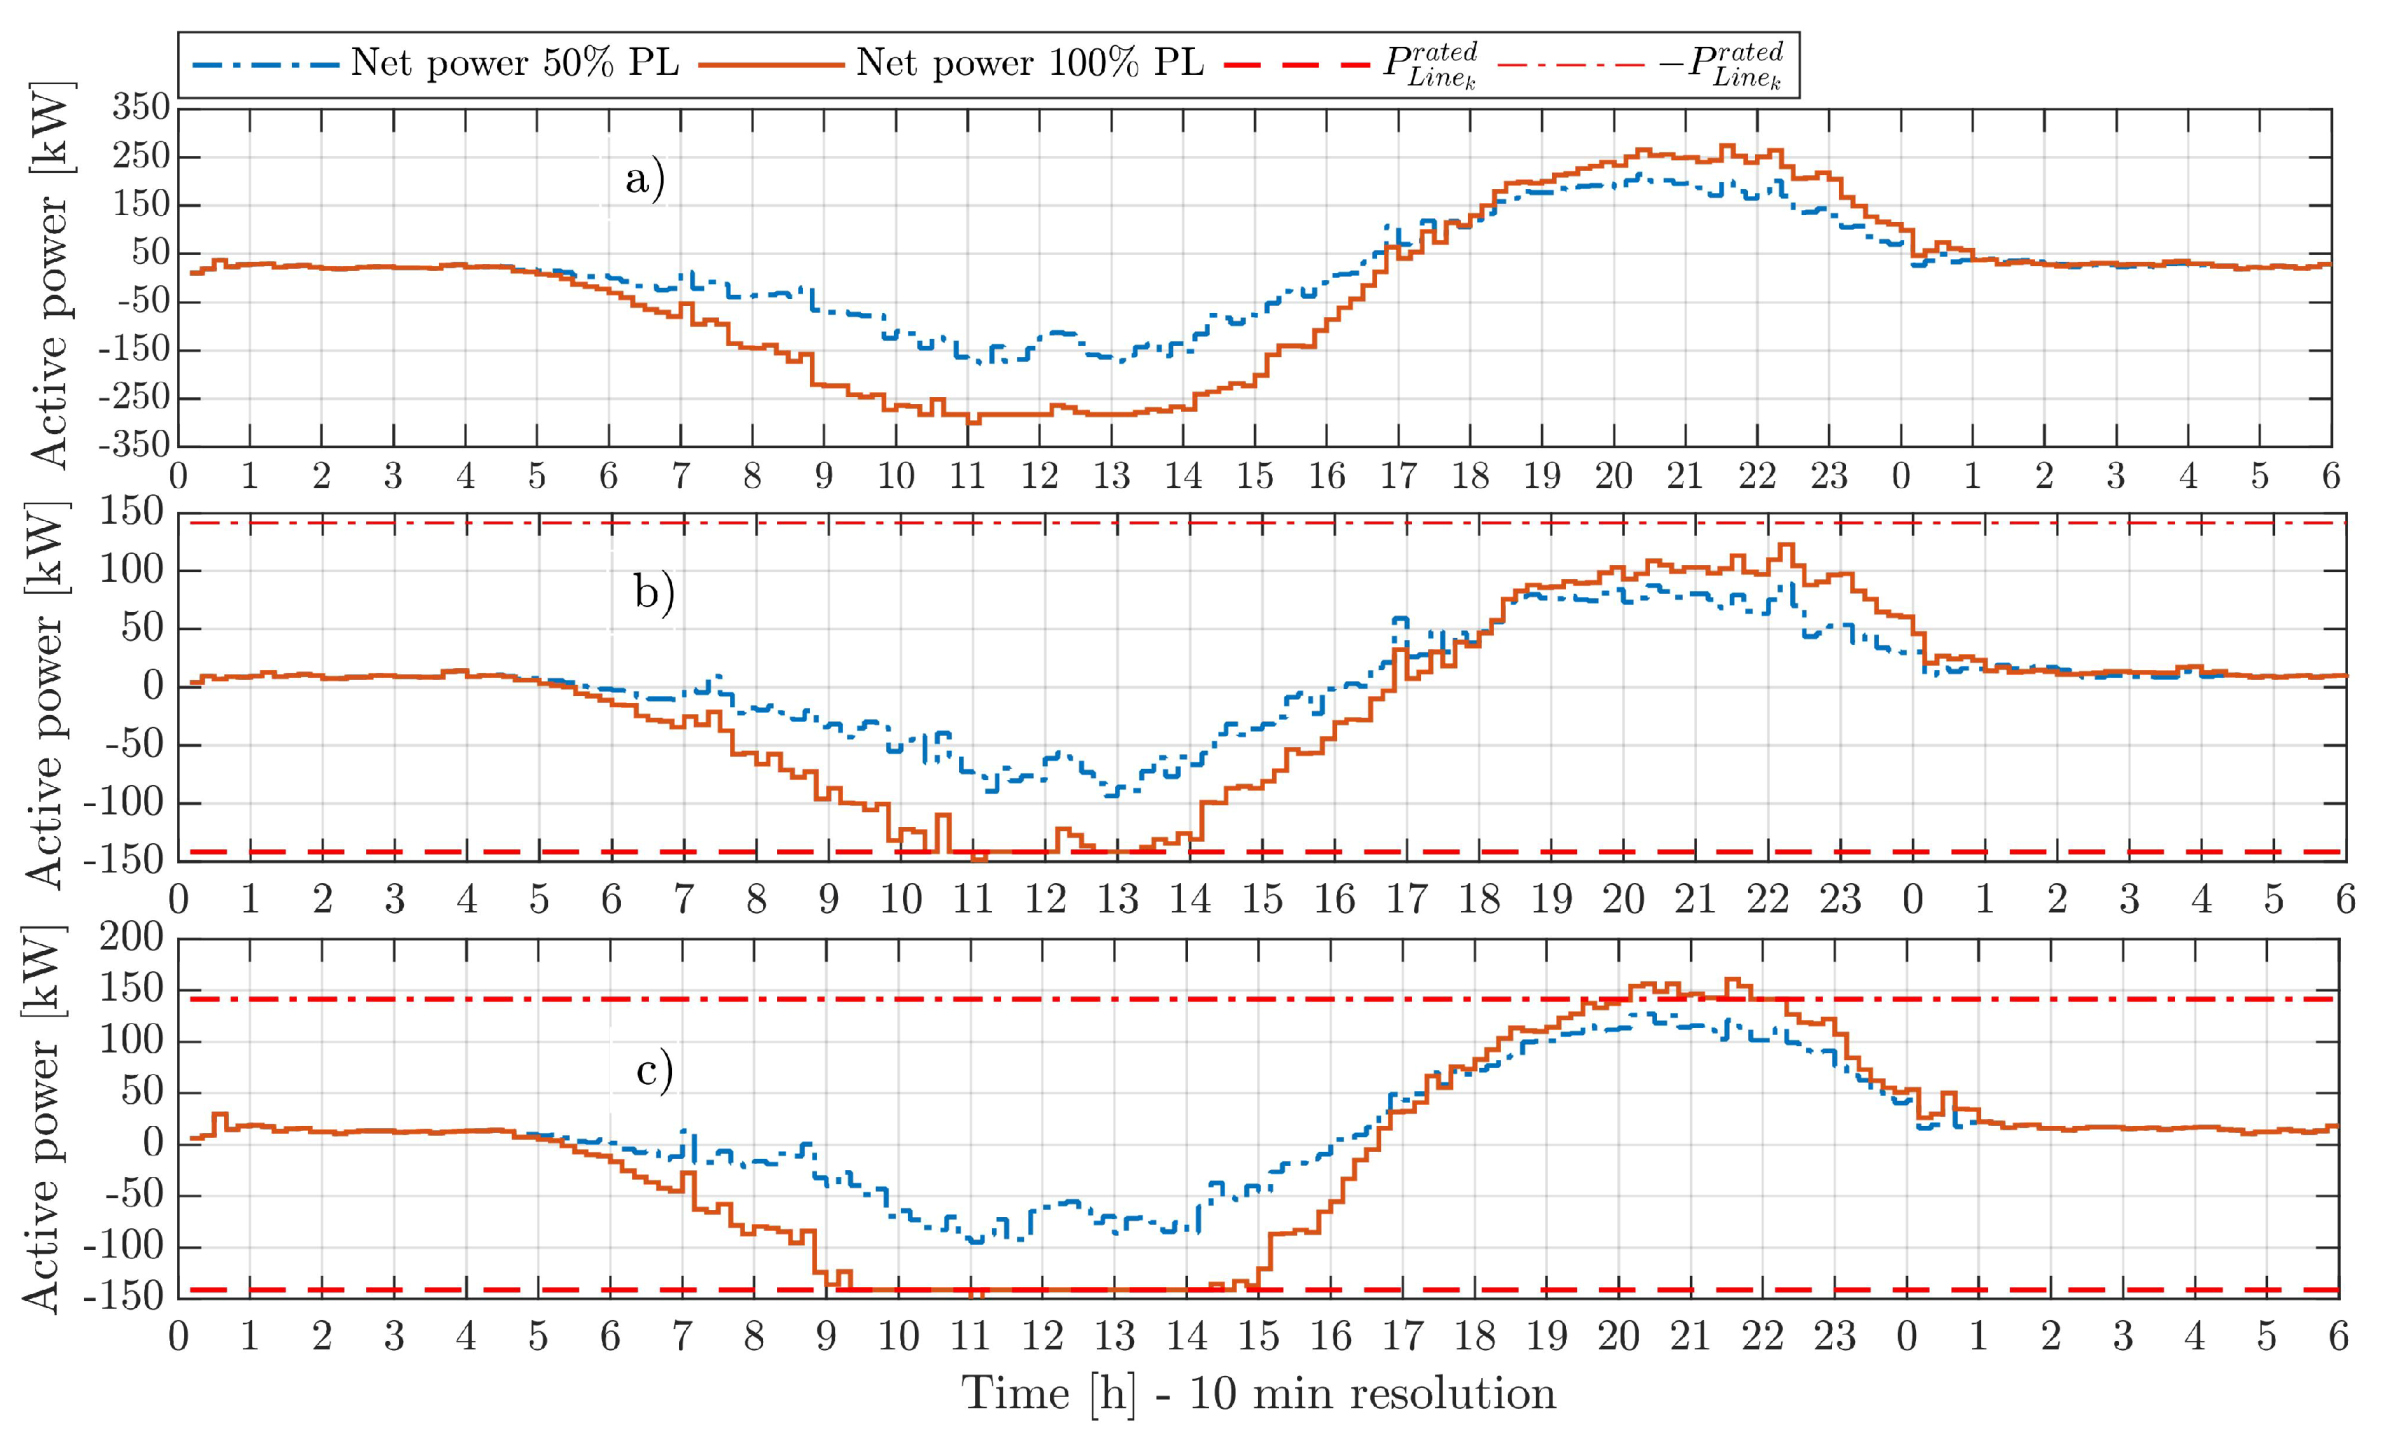
The total net power through the distribution transformer and the main cables of the feeders for both PL is presented in Figure 6. For a moderate PL, it is evident that the network’s assets are sufficiently sized for accommodating both the additional demand and local generation, assuming that their nominal capacity does not increase. In Figure 6b,c, it can be seen that for a critical PL, both aggregators limit the reverse power flow to the rated capacity of their feeders ( P L i n e k r a t e d = 141.5 kW) due to the operating constraint in (13). However, during the evening peak demand period, aggregator 2 experiences different overloading events which intermittently vary from P L i n e 2 r a t e d to 161 kW for approximately 1.6 h. This occurs due to the objective function being penalised because of the large number of EVs charging simultaneously at that time. Despite these operational conditions, the loading level on the main transformer is maintained below its rated capacity, as shown in Figure 6a. Notice that the results from this scenario would give to the DSO the input data for planning the reinforcement of their assets.
Note also that each aggregator could experience higher overloading conditions if a control strategy is not considered, i.e., the maximum expected charging power value ( P c h m a x ) would be equal to the upper power boundary from each aggregator. In addition, for a higher charging mode (based on the IEC 61851 [30]) and a larger PV rated capacity, the percentage of penetration would be much lower. However, if it is required to maintain the same PL, it would be necessary to reinforce both the transformer and the main cables.

6. Conclusions

This paper has proposed a centralised coordination strategy among aggregators at the DSO level to optimise their aggregated charging power and the export limit of the aggregated PV to the network. The proposed centralised approach has the following advantages: (1) By aggregating the individual power and energy boundaries of the EVs and the expected capacity of PV units within each aggregator before the coordination at the DSO, the computational burden of the proposed optimisation problem is highly reduced, as well as the amount of data exchange between the aggregators and DSO. (2) The optimisation problem dimensions are limited to the number of aggregators and number of time intervals, which enables the proposed strategy to be solved quickly even with a high number of PVs and EVs per aggregator. (3) As the aggregation of PV power and the power/energy boundaries of EVs is less complex, smooth and stable, it allows foresight into the different distribution system operational scenarios in the network. (4) The DSO is able to determine in a flexible way its peak net power based on the information provided by each aggregator. On the other hand, numerical examples prove the effectiveness of the proposed coordination strategy in limiting the overloading level on network assets when multiple aggregators manage high penetration of PVs and EVs. However, this work can be further extended by including other system operational constraints like voltage limits in terms of sensitivity coefficients derived from conventional power flow analysis or by defining a linearised OPF. Notice that a detailed model of the network under study must be considered. Moreover, from the point of view of the DSO, the requirement of the LV network reinforcement to supply new demand (e.g., EVs) can be analysed by employing the proposed optimisation strategy through several statistical scenarios.

Author Contributions

Conceptualisation, A.F.C.B., J.M. (Julia Merino) and E.T.; methodology, A.F.C.B.; validation, A.F.C.B.; jormal analysis, A.F.C.B., J.M. (Julia Merino) and E.T.; investigation, A.F.C.B.; resources, A.F.C.B., J.M. (Julia Merino) and E.T.; data curation, A.F.C.B.; writing—original draft preparation, A.F.C.B.; writing—review and editing, J.M. (Julia Merino), E.T. and J.M. (Javier Mazón); visualization, A.F.C.B.; supervision, J.M. (Javier Mazón); funding acquisition, J.M. (Julia Merino). All authors have read and agreed to the published version of the manuscript.

Funding

This work was supported by TECNALIA funding through its PhD scholarship program.

Acknowledgments

The authors also would like to thank the Basque Government (GISEL research group IT1191-19) and the UPV/EHU (GISEL research group 18/181) for their support in this work.

Conflicts of Interest

The authors declare no conflict of interest. The funders had no role in the design of the study; in the collection, analyses or interpretation of data; in the writing of the manuscript; or in the decision to publish the results.

Abbreviations

The following abbreviations are used in this manuscript:
BESSBattery Energy Storage System
DSODistribution System Operator
EMSEnergy Management System
EVElectric Vehicle
HVHigh Voltage
LPLinear Programming
LVLow Voltage
MILPMixed-Integer Linear Programming
MVMedium Voltage
OPFOptimal Power Flow
PVPhotovoltaic
QPQuadratic Programming
SQPSequential Quadratic Programming

References

  1. Renewable Energy Policy Network (REN21). Renewables 2020 Global Status Report; REN21: Paris, France, 2020. [Google Scholar]
  2. Chen, Q.; Liu, N.; Hu, C.; Wang, L.; Zhang, J. Autonomous Energy Management Strategy for Solid-State Transformer to Integrate PV-Assisted EV Charging Station Participating in Ancillary Service. IEEE Trans. Ind. Inform. 2017, 13, 258–269. [Google Scholar] [CrossRef]
  3. van der Meer, D.; Mouli, G.R.C.; Mouli, G.M.-E.; Elizondo, L.R.; Bauer, P. Energy Management System With PV Power Forecast to Optimally Charge EVs at the Workplace. IEEE Trans. Ind. Inform. 2018, 14, 311–320. [Google Scholar] [CrossRef] [Green Version]
  4. Riesen, Y.; Ballif, C.; Wyrsch, N. Control algorithm for a residential photovoltaic system with storage. Appl. Energy 2017, 202, 78–87. [Google Scholar] [CrossRef] [Green Version]
  5. Huang, P.; Lovati, M.; Zhang, X.; Bales, C. A coordinated control to improve performance for a building cluster with energy storage, electric vehicles, and energy sharing considered. Appl. Energy 2020, 268, 114983. [Google Scholar] [CrossRef]
  6. Marra, F.; Yang, G.Y.; Traeholt, C.; Larsen, E.; Ostergaard, J.; Blazic, B.; Deprez, W. EV charging facilities and their application in LV feeders with photovoltaics. IEEE Trans. Smart Grid 2013, 4, 1533–1540. [Google Scholar] [CrossRef]
  7. van der Kam, M.; van Sark, W. Smart charging of electric vehicles with photovoltaic power and vehicle-to-grid technology in a microgrid; a case study. Appl. Energy 2015, 152, 20–30. [Google Scholar] [CrossRef] [Green Version]
  8. Xu, Z.; Hu, Z.; Song, Y.; Zhao, W.; Zhang, Y. Coordination of PEVs charging across multiple aggregators. Appl. Energy 2014, 136, 582–589. [Google Scholar] [CrossRef]
  9. Xu, Z.; Su, W.; Hu, Z.; Song, Y.; Zhang, H. A Hierarchical Framework for Coordinated Charging of Plug-In Electric Vehicles in China. IEEE Trans. Smart Grid 2016, 7, 428–438. [Google Scholar] [CrossRef]
  10. Qi, W.; Xu, Z.; Shen, Z.J.M.; Hu, Z.; Song, Y. Hierarchical coordinated control of plug-in electric vehicles charging in multifamily dwellings. IEEE Trans. Smart Grid 2014, 5, 1465–1474. [Google Scholar] [CrossRef]
  11. Masood, A.; Hu, J.; Xin, A.; Sayed, A.R.; Yang, G. Transactive Energy for Aggregated Electric Vehicles to Reduce System Peak Load Considering Network Constraints. IEEE Access 2020, 8, 31519–31529. [Google Scholar] [CrossRef]
  12. Franco, J.F.; Ochoa, L.F.; Romero, R. AC OPF for smart distribution networks: An efficient and robust quadratic approach. IEEE Trans. Smart Grid 2018, 9, 4613–4623. [Google Scholar] [CrossRef] [Green Version]
  13. Ricciardi, T.R.; Petrou, K.; Franco, J.F.; Ochoa, L.F. Defining Customer Export Limits in PV-Rich Low Voltage Networks. IEEE Trans. Power Syst. 2019, 34, 87–97. [Google Scholar] [CrossRef] [Green Version]
  14. Cortés, A.; Mazón, J.; Merino, J. Strategy of management of storage systems integrated with photovoltaic systems for mitigating the impact on LV distribution network. Int. J. Electr. Power Energy Syst. 2018, 103, 470–482. [Google Scholar] [CrossRef]
  15. Su, X.; Masoum, M.A.; Wolfs, P.J. Optimal PV inverter reactive power control and real power curtailment to improve performance of unbalanced four-wire LV distribution networks. IEEE Trans. Sustain. Energy 2014, 5, 967–977. [Google Scholar] [CrossRef]
  16. Tonkoski, R.; Lopes, L.A.C.; El-Fouly, T.H.M. Coordinated Active Power Curtailment of Grid Connected PV Inverters for Overvoltage Prevention. IEEE Trans. Sustain. Energy 2011, 2, 139–147. [Google Scholar] [CrossRef]
  17. Ghosh, S.; Rahman, S.; Pipattanasomporn, M. Distribution Voltage Regulation Through Active Power Curtailment With PV Inverters and Solar Generation Forecasts. IEEE Trans. Sustain. Energy 2017, 8, 13–22. [Google Scholar] [CrossRef]
  18. Liu, N.; Chen, Q.; Liu, J.; Lu, X.; Li, P.; Lei, J.; Zhang, J. A Heuristic Operation Strategy for Commercial Building Microgrids Containing EVs and PV System. IEEE Trans. Ind. Electron. 2015, 62, 2560–2570. [Google Scholar] [CrossRef]
  19. Eldeeb, H.H.; Faddel, S.; Mohammed, O.A. Multi-Objective Optimization Technique for the Operation of Grid tied PV Powered EV Charging Station. Electr. Power Syst. Res. 2018, 164, 201–211. [Google Scholar] [CrossRef]
  20. Aleem, S.A.; Hussain, S.M.S.; Ustun, T.S. A Review of Strategies to Increase PV Penetration Level in Smart Grids. Energies 2020, 13, 636. [Google Scholar] [CrossRef] [Green Version]
  21. Cortés, A.; Merino, J.; Torres, E. Stochastic Generation of Aggregated Charging Profiles of PEVs for the Operation Analysis of Low Voltage Networks. In Proceedings of the 25th International Conference and Exhibition on Electricity Distribution, CIRED, Madrid, Spain, 3–6 June 2019; pp. 3–6. [Google Scholar] [CrossRef]
  22. Kazemi, M.A.; Sedighizadeh, M.; Mirzaei, M.J.; Homaee, O. Optimal siting and sizing of distribution system operator owned EV parking lots. Appl. Energy 2016, 179, 1176–1184. [Google Scholar] [CrossRef]
  23. Electricity North West. Low Voltage Network Solutions; Electriciy North West: Warrington, UK, 2019. [Google Scholar]
  24. U.S. Department of Energy. 2013 Nissan Leaf Advanced Vehicle Testing—Baseline Testing Results; Technical Report; U.S. Department of Energy: Washington, DC, USA, 2015. [Google Scholar]
  25. National Renewable Energy Laboratory. Transportation Secure Data Center; National Renewable Energy Laboratory: Golden, CO, USA, 2017. [Google Scholar]
  26. Shafie-Khah, M.; Heydarian-Forushani, E.; Osorio, G.J.; Gil, F.A.; Aghaei, J.; Barani, M.; Catalao, J.P. Optimal Behavior of Electric Vehicle Parking Lots as Demand Response Aggregation Agents. IEEE Trans. Smart Grid 2016, 7, 2654–2665. [Google Scholar] [CrossRef]
  27. Santos, S.F.; Fitiwi, D.Z.; Shafie-khah, M.; Bizuayehu, A.W.; Catalão, J.P. Introduction to Renewable Energy Systems. In Optimization in Renewable Energy Systems; Elsevier: Oxford, UK, 2017; pp. 1–26. [Google Scholar] [CrossRef]
  28. Open Data Euskadi. Weather Stations: Readings Collected in 2017. 2018. Available online: https://opendata.euskadi.eus/catalogo/-/838estaciones-meteorologicas-lecturas-recogidas-en-2017/ (accessed on 8 January 2018).
  29. IBM. DOcplex Python Modeling API; IBM: Armonk, NY, USA, 2020. [Google Scholar]
  30. Martínez-Lao, J.; Montoya, F.G.; Montoya, M.G.; Manzano-Agugliaro, F. Electric vehicles in Spain: An overview of charging systems. Renew. Sustain. Energy Rev. 2017, 77, 970–983. [Google Scholar] [CrossRef]
Figure 1. Box plot of a 5 kW PV inverter: output power derived from yearly meteorological data using the model in Section 2.1.
Applsci 10 07176 g001
Figure 2. Optimal charging profile for a moderate and critical penetration level: (a,b) aggregator 1 and (c,d) aggregator 2.
Applsci 10 07176 g002
Figure 3. Optimal charging trajectory and charging profile for a moderate penetration level: (a) aggregator 1 and (b) aggregator 2.
Applsci 10 07176 g003
Figure 4. Optimal charging trajectory and charging profile for a critical penetration level: (a) aggregator 1 and (b) aggregator 2.
Applsci 10 07176 g004
Figure 5. Comparison of active power demand and generation for a moderate and critical penetration level (PL). (a,b) aggregator 1 and (c,d) aggregator 2.
Applsci 10 07176 g005
Figure 6. Net active power for a moderate and critical penetration level (PL). (a) On the distribution transformer, (b) on the feeder’s main cable of aggregator 1 and (c) aggregator 2.
Applsci 10 07176 g006
Publisher’s Note: MDPI stays neutral with regard to jurisdictional claims in published maps and institutional affiliations.

