Article

Investigation of Mixed-Mode I/II Fracture under Impact Loading Using Split-Hopkinson Pressure Bar

1
Shock and Vibration of Engineering Materials and Structures Key Laboratory of Sichuan Province, Southwest University of Science and Technology, Mianyang 621000, China
2
MOE Key Laboratory Deep Underground Science and Engineering, College of Architecture and Environment, Sichuan University, Chengdu 610065, China
3
State Key Laboratory of Hydraulics and Mountain River Engineering, College of Water Resources and Hydropower, Sichuan University, Chengdu 610065, China
4
School of Transportation and Civil Engineering, Fujian Agriculture and Forestry University, Fuzhou 350002, China
5
College of Civil and Architecture Engineering, Panzhihua University, Panzhihua 617000, China
*
Authors to whom correspondence should be addressed.
Appl. Sci. 2020, 10(20), 7149; https://doi.org/10.3390/app10207149
Submission received: 20 September 2020 / Revised: 9 October 2020 / Accepted: 10 October 2020 / Published: 14 October 2020
(This article belongs to the Section Civil Engineering)

Abstract

:
Mixed-mode fracture of construction building materials under impact loading is quite common in civil engineering. The investigation of mixed-mode crack propagation behavior is an essential work for fundamental research and engineering application. A variable angle single cleavage semi-circle (VASCSC) specimen was proposed with which the dynamic fracture test was conducted by using a Split-Hopkinson pressure bar (SHPB). Notably, the mixed-mode crack propagation velocity could be detected by the synchronized crack velocity measuring system. With experimental results, the dynamic initiation stress intensity factors KI and KII were calculated by the experimental-numerical method. Additionally, the crack path of mixed-mode I/II fracture can be predicated precisely by using numerical method. Thus, a comprehensive approach of investigation on mixed-mode I/II fracture under impact loading was illustrated in this paper. The study demonstrates that the mixed-mode I/II crack would transform from complicated mode I/II to pure mode I during crack propagation, and several velocity decelerations induced crack deflection. The dynamic initiation fracture toughness of mixed-mode crack was determined by the experimental-numerical method. The VASCSC specimen has a great potential in investigating mixed-mode fracture problems with the SHPB device.

1. Introduction

Construction building materials are a significant component of civil engineering, which is shown to be increasingly crucial in dominating the structure strength and project safety. However, there are many inherent or induced discontinuities, such as natural defects, flaws, and micro-cracks, which can be found in general materials, such as concrete and rock. When the material is subjected to dynamic loading, the defects of material will develop and result in crack initiation as well as propagation. Consequently, the propagating crack might cause immense engineering disasters. Therefore, much attention has been attracted to this hot point, the dynamic fracture of construction building materials. Numerous laboratory investigations have been conducted to understand the crack propagation behavior and fracture mechanism [1,2,3,4,5,6].
The pure mode I crack propagation behavior with initiation, propagation, and arrest detected was illuminated by Ravi-Chandar [7] in the series work, while Freund [8] proposed a universal function method with which the dynamic stress intensity factor (DSIF) of mode I fracture can be calculated accurately. Then, the loading rate effect on crack propagation behavior was discussed [9,10], and the methods to determine the dynamic crack fracture toughness of mode I cracks were given by Chen [11] and Wang [12,13] with Split-Hopkinson pressure bar involved. Up to now, the majority of efforts have been mainly concentrated on the mode I crack, which of course enriches the knowledge of the dynamic fracture and crack propagation. However, the dynamic fracture of mixed-mode I/II crack has not been studied extensively at present. Actually, in practical applications, the mixed-mode I/II fracture can be found in most cases due to varied impact orientations and it is the dominator in controlling the damage of construction building materials, as well as structure stability.
For mixed-mode I/II crack, abundant achievements under static loading conditions have been made by researchers [14,15,16,17,18]. Several classic specimen configurations have been proposed to study the crack propagation behavior and fracture growth in brittle materials, such as the single edge notched three-point-bend (SENB) [19], the asymmetric four-point-bend (AFPB) [20], the Brazilian disk (BD) [21], and the semi-circular bends (SCB) [22], as shown in Figure 1.
Those specimen configurations were widely applied in the vast fracture toughness measuring and behavior detecting. Furthermore, fracture models such as the maximum tangential stress (MTS) [23,24], the maximum tangential strain [25], and the maximum energy release [26] were also employed to evaluate mixed-mode crack trajectory. Moreover, to investigate the mixed-mode fracture problems under static loading conditions, multiple numerical methods have been given in recent years with various applications [27,28,29,30,31]. However, the investigation on mixed-mode fracture under dynamic loading has been conducted very scarcely, as it might be impeded by the complexity of dynamic material properties, wave propagation, and rate effect. So far, only limited literature can be found related to dynamic mixed-mode I/II fracture investigation. Among them, the Brazilian disk (BD) in Figure 1d was used by Wang [32] to measure dynamic stress intensity factors with SHPB and the semi-circular bend (SCB) specimen in Figure 1e was mentioned in a famous review paper [33]. However, when it comes to the investigation of mixed-mode crack propagation, especially in a complete process including initiation, propagation, and arrest, a comprehensive investigation method with appropriate specimen remains unknown.
Therefore, in this paper, a variable angle single cleavage semi-circle (VASCSC) specimen was proposed to investigate the mixed-mode I/II crack propagation behavior in the whole propagation process. The Split-Hopkinson pressure bar device was employed to conduct impact tests cooperated by a synchronized crack velocity measuring system. The crack extending velocity data were detected accurately and the fracture phenomena were analyzed. Moreover, by using a finite element method, a determination of the dynamic initiation fracture toughness of mixed-mode crack was demonstrated. Additionally, an AUTODYN code was applied to realize the numerical prediction of mixed-mode crack. With the combination of the experimental approach and numerical method, the present literature illustrates a comprehensive method to investigate the crack propagation behavior of mixed-mode I/II crack, which can be applied in evaluating dynamic crack propagation behaviour, calculating dynamic initiation fracture toughness, and predicting crack trajectory. More critically, some crucial conclusions in this paper can be potentially applied in civil engineering for design structures and hazard prediction for reference.

2. Experiment

The crack propagation behavior of mixed-mode I/II fracture was experimentally investigated in experiments using the Split-Hopkinson pressure bar. The crack propagating velocity was detected by a synchronized crack velocity measuring system, simply called Crack Propagation Gauge (CPG) system.

2.1. Specimen and Experimental System

The propagation behavior of mixed-mode I/II crack is more complicated than mode I with its crack path developing irregularly, which means the propagating crack is hard to track. To make a quantitative investigation of mixed-mode I/II crack propagation, the variable angle single cleavage semi-circle (VASCSC) specimen was chosen as the basic configuration, and the pre-crack could be designed with different angles. Thanks to the VASCSC specimen configuration, sufficient space was available behind the pre-crack which made mixed-mode crack propagate adequately, and the fracture initiation was easily realized due to the semi-circle in the top of the specimen. In addition, with the variable angle of pre-crack, which controlled the loading direction, the crack initiation could perform a mixed-mode fracture.
The geometric parameters of the specimen are shown in Figure 2. The length of the specimen was 100 mm, the width was 70 mm, and the thickness was 25 mm. Besides, the diameter of the semi-circle was 26 mm, and the pre-crack was designed with a length of 20 mm, and its tip was sharpened by the laser technique. The angle (θ) between the pre-crack and specimen symmetrical axis could be varied. To reduce the random error induced by material heterogeneity, polymethyl methacrylate (PMMA) was used to make the specimens. PMMA is usually applied in investigating the dynamic fracture mechanism of brittle material, it shows similar fracture characteristics under impact loading to concrete and rock [34,35]. The measured material parameters of PMMA are shown in Table 1.
The Split-Hopkinson pressure bar (SHPB) system and Crack Propagation Gauge (CPG) system were coordinated together with synchronization to detect dynamic stress condition and crack extending velocity, shown in Figure 3. The material parameters of the incident bar and transmitted bar are listed in Table 2.
The voltage signal was collected by the ultra-dynamic strain amplifier from the strain gauges glued on the midpoint of the incident bar and transmitted bar. The strain signals can be obtained by Equation (1).
ε = 4 U 0 n E g K ,
where ε denotes the strain, U0 denotes the voltage, Eg denotes the voltage of the bridge, K denotes the sensitivity coefficient of the strain gauges, and n denotes the gain coefficient of the amplifier.
Then, with Equation (2), one can calculate the dynamic loading on the top and bottom of the sample.
P i ( t ) = A i E d [ ε i ( t ) + ε r ( t ) ] P t ( t ) = A t E d ε t ( t )
where Pi(t) and Pt(t) are the load on the top and bottom of the sample, respectively. εi(t), εr(t), and εt(t) denote incident strain, reflected strain, and transmitted strain, respectively. Ai and At are the cross-section area of the incident bar and transmitted bar, respectively.
In the experiment, sixteen specimens with two groups were impacted with a constant speed of 7.5 m/s which corresponds to high loading rate testing. According to the data processing principle, the experimental data were filtrated and carefully analyzed to avoid error interference, and the dynamic stress curves are illustrated in Figure 4.

2.2. Crack Propagation Gauge

The crack extending velocity is an essential index to identify crack propagation behavior; especially for mixed-mode I/II crack whose running speed is hard to get during the experiment, measuring instant crack speed is challenging work. Therefore, the Crack Propagation Gauge (CPG) test system was applied to implement the task. In view of the trajectory irregularity of mixed-mode crack, a novel sensitive gauge, shown in Figure 3, was introduced in this experiment which was large enough to cover the potential area where the mixed-mode running crack might pass. Notably, this gauge has a very brittle glass-silk baseplate on which the resistance wires are uniformly spaced. When the gauges were tightly glued on the surface of the specimen, the fine resistance wires would be fractured synchronously with propagating crack passing by. Thus, the voltage would change correspondingly, shaping a stair step signal and the fracture time of each wire could be confirmed precisely with the help of the derivative of the CPG signal. Then by determining the distance between adjacent wires, the crack propagating velocity could be calculated.
Figure 5 shows the CPG signal curves of specimen-0° and specimen-30°, respectively. The specimen-0° is the typical mode I crack, the propagation time between adjacent wires stayed approximately the same after initiation, until a distinct time interval, 62.4 μs, observed between the 16th and 17th fine wires. Based on the conclusion proposed by Wang [36], there should be a crack arrest that appeared here at a very low speed. While for specimen-30° with mixed-mode I/II initiation in, the CPG signal curve presents a subtle change at 7th–8th fine wires, there were decelerations at the 16th fine wire, and the crack initiation time of specimen-30° is later than mode I fracture. It is clear that the dynamic crack propagation behavior between mode I and mixed-mode I/II fracture has a difference.

2.3. Discussion of Experimental Results

To better understand the dynamic mixed-mode I/II fracture, an in-depth analysis was carried out. The two specimen patterns are displayed in Figure 6. The fracture mode of crack initiation presents different forms when the angle between pre-crack and the axis of the specimen varies. The maximum initiation angle of the specimen-30° is 62.13°, shown in Figure 6b, and the average initiation angle is 57.32°, which indicates that the fracture mode of the specimen-30° is mixed-mode I/II fracture. Meanwhile, the crack propagation paths also demonstrate different features related to the fracture mode. For specimen-0°, both the crack initiation angle and the dip angle are 0°, the crack propagates along the symmetrical axis of the sample leaving a straight line before it stops in the rear area, showing the typical mode I feature.
For specimen-30°, the crack propagation behavior becomes more active than mode I crack, a larger movement can be caught and a more irregular trajectory can be observed. Instead of extending as a straight line, the crack first kept propagating with the direction of the initiation angle, then adjusted the orientation and ran towards the symmetrical axis of the specimen shaping a curved path. Particularly, several deflection points can be seen on the crack path of specimen-30°. Among them, the two crucial points are marked with A and B, respectively. It is acknowledged that the point A on both specimen-0° and specimen-30° is a crack arrest area according to the historical stress curve and CPG signal, which should be induced mainly by the tensile stress wave reflected on the bottom of the specimen. The main reason is that the time when point A was shaped is almost 400 μs after the specimen subjected to the stress wave, which means the compressive stress wave has a limited function on crack propagation. When the extending crack approach to the bottom of the specimen, the reflected stress wave has a great effect on arresting crack. Whereas, deflection point B can only be found on the specimen-30° with mixed-mode I/II initiation, indicating the crack propagation of mixed-mode I/II is not a very consecutive process. The points might be dominated by the crack deceleration which gives running crack an opportunity to release the inertia effect caused by high-speed propagation and choose a new direction to develop. To verify this speculation, the cracks propagation velocity is focused.
Figure 7 illustrates a very interesting phenomenon that the propagating crack does have distinct velocity deceleration between 7th–8th wires and 8th–9th wires, which forms exactly the area where point B is located. Furthermore, the velocity decelerations of all the specimens between the 16th–17th wires are confirmed with very low speed, about 31 m/s, which can be the direct proof that the crack arrest had occurred. Therefore, the crack propagation behavior before the 16th wire can be defined as the whole propagation process with initiation, propagation, and arrest. It is worth mentioning that the average initiation time of the specimen-0° and specimen-30° are 208.12 μs and 223.32 μs, respectively. When compared mixed-mode I/II fracture with the mode I, the crack extending velocity of the mode I/II crack is more stable in a stone’s throw after initiation. All the above indicates that the specimens with a dip angle of 30° are harder to initiate than mode I specimen with an angle of 0°. Meanwhile, a very sharp acceleration can be seen in specimen-0° with mode I fracture in Figure 7a, which manifests there is an intense energy accumulation before crack initiating followed by a very fierce energy release. However, for mixed-mode I/II crack, the energy release after fracture is relatively smooth due to tensile-shear fracture mode. In addition, by investigating the motion tendency of the crack with mixed-mode I/II initiation, one can find that crack velocity deceleration phenomena can be detected at the crack deflection area, in Figure 7b, and the crack propagation path gradually parallels the central axis of the specimen after every deceleration. Thus, a conclusion can be obtained that the mixed-mode crack would transform from complicated mode I/II to basic mode I after several deflections accompanied with crack deceleration.

3. Dynamic Initiation Stress Intensity Factor

In order to determine the dynamic initiation fracture toughness of mixed-mode fracture, the dynamic initiation stress intensity factor (DISIF) is calculated by ABAQUS, and an experimental-numerical method [13,37] is introduced.

3.1. Verification of ABAQUS

The accuracy of finite element software ABAQUS plays a significant role in calculating the dynamic initiation stress intensity factor. Before establishing a numerical model, the accuracy of ABAQUS should be validated. Therefore, a well-known benchmark model, Chen problem [38], was introduced to estimate the calculation precision of ABAQUS.
Chen’s model is a simple two-dimensional model, shown in Figure 8a. The geometry of the sample is 40 mm in length and 20 mm in width, a single crack deployed in the middle of the bar with a length of 4.8 mm. The dynamic tensile forces P(t) on both sides of the bar can be express by the Heaviside step function. Based on the model above, the numerical sample was established in the ABAQUS with the same geometry, parameters, and loading condition. The KI(t) curve of Chen’s model was extracted from the figure given by Chen, together with the curve of calculation result by ABAQUS, the two curves were plotted in Figure 8b to make a clear comparison. It is obvious that the computation of ABAQUS agreed well with Chen’s result, indicating the ABAQUS has a great capacity to calculate dynamic stress intensity factors.

3.2. Determination of Dynamic Initiation Stress Intensity Factor

To calculate the Dynamic Initiation Stress Intensity Factor, the numerical samples which have the same dimension as the experimental specimens were established in the ABAQUS, and each assembled with the same material parameters given in Table 1. The crack tips were well-meshed with six-node triangular elements (CPS 6), while eight-node quadrilateral elements (CPS 8) were applied in the rest of the area shown in Figure 9.
The numerical model was composed of 47,668 elements. The dynamic impact loading obtained in the experiment, shown in Figure 4, was applied in the simulation. For CPS 6 element, the rOA is equal to a quarter of rOB. Based on the fracture mechanics, the displacement-time data of points A and B was used to compute dynamic stress intensity factors. The relationship can be expressed by Equation (3) [8].
K I ( t ) = E d 24 ( 1 ν d 2 ) 2 π r O A [ 8 u A ( t ) u B ( t ) ] ,
where Ed denotes the dynamic elastic modulus, vd denotes Poisson’s ratio. uA(t) and uB(t) are the historical displacement of point A and B, respectively.
The DSIF versus time were extracted from ABAQUS, and the DSIF curves of the specimen-0° and specimen-30° are illustrated in Figure 10. With the initiation fracture time obtained by the CPG in the experiment, the DISIF could be determined sophisticatedly. The negative period of the KI curve means the crack is under compressive condition, while the positive indicates tensile status. However, when it comes to KII, the positive and negative of KII can only denote the moving direction of the crack surface. It is distinctive that the specimen-0° is the mode I initiation due to the value of KII is constant 0 MPa·m1/2, and the DISIF of the specimen-0° is 5.57 MPa·m1/2, less than the maximum DSIF 8.33 MPa·m1/2. However, for specimen-30° in Figure 10b the dynamic stress intensity factor curve of KII varies with the time, which indicates that the specimen-30° is mixed-mode I/II crack. Based on the experimental results, the initiation time of the specimen-30° is 223.32 μs and the initiation of crack could be dominated by KI = 4.35 MPa·m1/2 and KII = 2.95MPa·m1/2, which is the initiation fracture toughness.

4. Numerical Approach

To realize the numerical prediction of mixed-mode I/II crack propagation, the AUTODYN, a finite difference code, was applied in the present paper. The multifarious problems characterized by both geometric and material nonlinearity can be solved by AUTODYN with high precision. Especially for brittle material under dynamic loadings, such as rock and concrete, the AUTODYN has satisfied the ability to obtain high-quality computation.

4.1. Numerical Model of AUTODYN

The algorithm of the AUTODYN has been introduced in previous works with its validity verified [39,40,41]. When the numerical model is established in AUTODYN, the material state should be considered. Under impact loading, the PMMA specimen shows common properties that the deformation and pressure of the material are very small, and it has little to do with the thermodynamic entropy. Therefore, the dynamic failure behavior of the PMMA can be expressed by the linear equation of state given in Equation (4).
P = k ( ρ ρ 0 1 ) ,
where P denotes uniform hydrostatic pressure of the material determined by the local density and bulk modulus, k denotes the bulk modulus, ρ0 denote reference density, while ρ denotes current density.
To illuminate crack propagation behavior and characteristics of mixed-mode I/II fracture, the principal stress criterion was chosen as the fundamental failure criterion. All the elements were dominated by the rule that once the major tensile principal stress or major shear principal stress exceeded the value of maximum dynamic tensile or shear strength of the material, the element would damage immediately. This failure criterion can be directly expressed by Equation (5).
σ 11 σ T ,   τ 12 τ s ,
where σ11 denotes the principal tensile stress, σT denotes the dynamic tensile strength, τ12 denotes the principal shear stress, τs denotes the dynamic shear strength.
Based on the practical geometric dimension of the specimen, the numerical models, for both specimen-0°and specimen-30°, were established in the AUTODYN with experimental material parameters referenced. To ensure calculation accuracy, the structured grids were applied in meshing the model. The whole specimen was divided into several blocks, each with different grid density so that the calculation efficiency could be primarily improved. The area around the pre-crack tip and potential crack propagation path were deployed by a very fine element of 0.1 mm × 0.1 mm grid shown in Figure 11. With this strategy, the effect of the grid on crack propagation behavior can be reduced as much as possible. Meanwhile, the pre-crack tip in the numerical model was meticulously designed making it tally to the real crack. Moreover, the force boundary condition [42] which performs well in the numerical simulation was applied, and the dynamic loading acted on both sides of the specimen was the historical loading data obtained in the actual experiment.

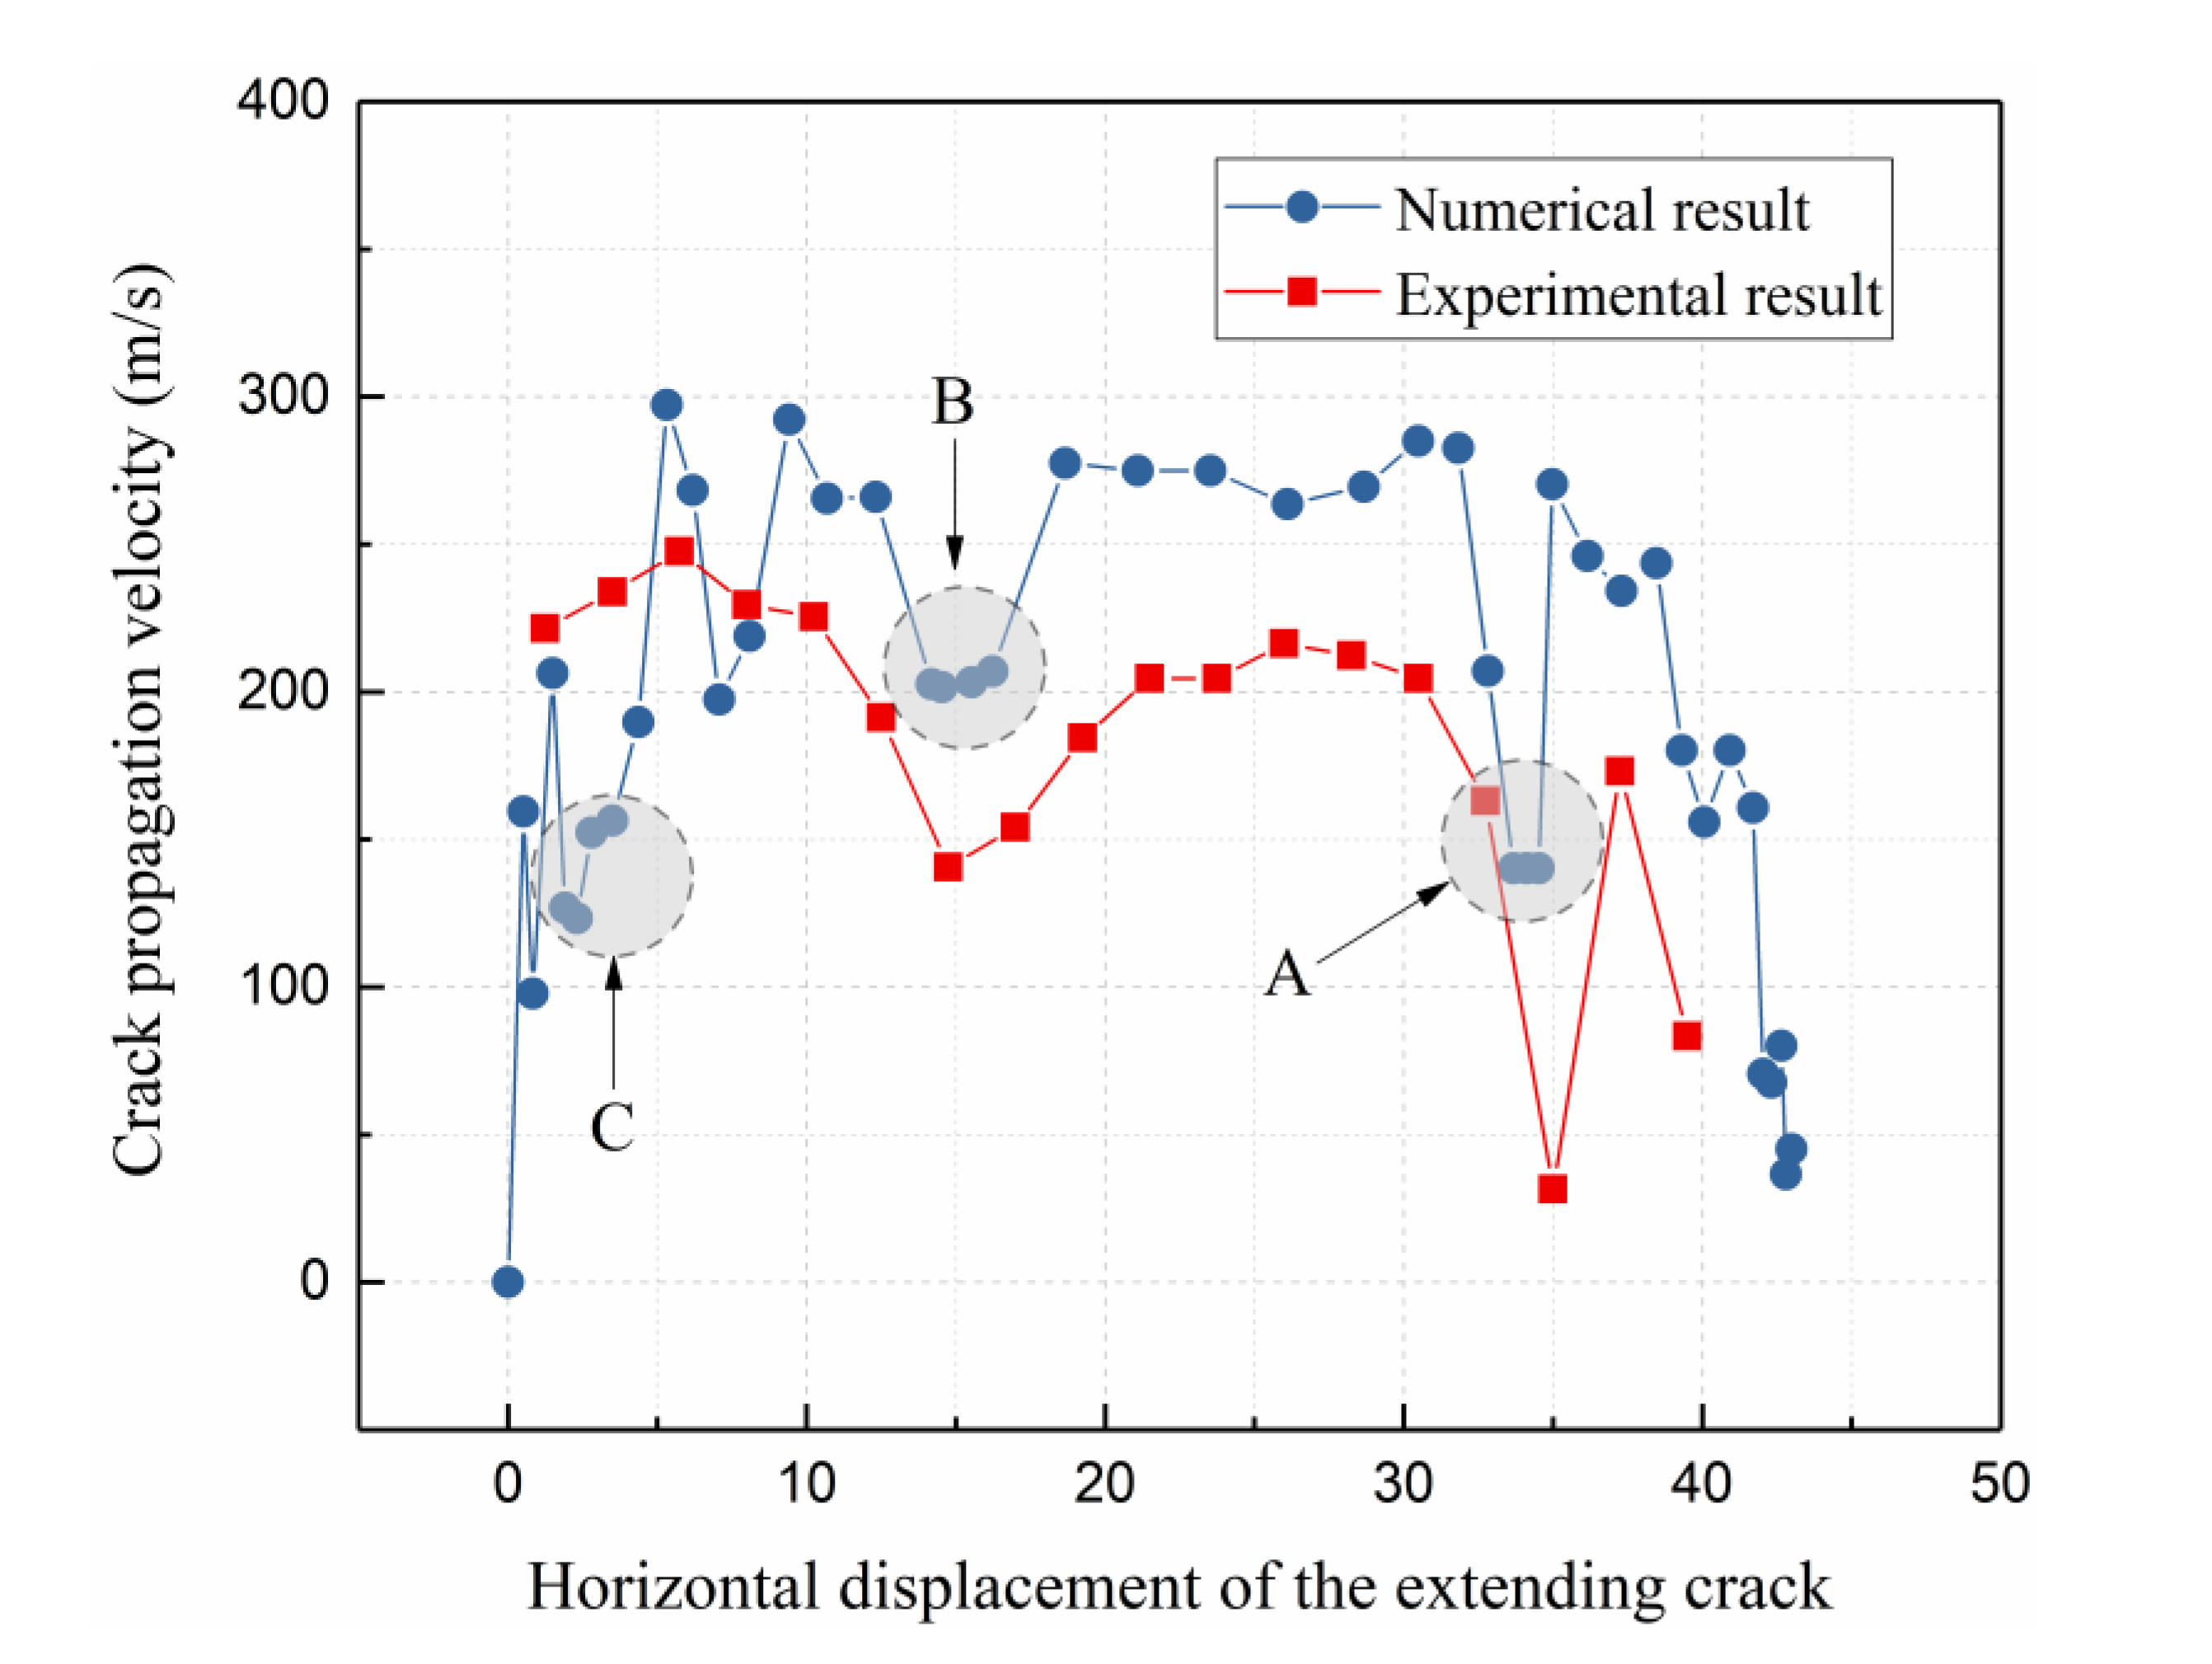
4.2. Numerical Result

The crack propagation paths of specimens with different fracture modes are illustrated in Figure 12 with their initiation angle highlighted.
For specimen-0°, the crack propagates with an initiation angle of zero forming a very perfectly straight line. For the numerical samples specimen-30°, the intact crack propagation path is a curved line with a complicated variation trend associated with mixed-mode I/II fracture. Furthermore, there are several deflection points induced by crack deviation that could be observed in the experiment. However, some deflection points observed in the experiment are hard to be realized by the numerical approach. This is because the numerical method relies on the theoretical operation which sometimes cannot deduce exactly the same result as the experimental one which is controlled by a complex condition.
When specimen-30° is compared with actual flaw patterns, the numerical results agree well with the experimental one. Especially, the initiation angle calculated by the numerical model does characterize the initiation fracture mode well. The initiation angle of specimen-30° is 60.22° which is nearly similar to the test result, 62.12°, and the specimen-30° can be identified as mode I/II initiation. Furthermore, judging from the strained condition around the pre-cracks in Figure 12b, one can distinctly found that the specimen-30° should be a tensile-shear initiation where the tensile fracture is the dominator accompanied with shear fracture, and there is no closed crack being found during the crack propagation process.
Meanwhile, the main deflection points of the crack appear in the approximate position as what was observed in the experiment, the points A and B in the numerical sample correspond to point A and B in the actual sample in Figure 6b. The crack trajectory is more irregular near the deflection point than in other areas. Especially in the initial propagation stage, the variation of the crack path is very complex and its propagation is unsteady, it looks like the extending crack is continuously adjusting fracture propagation direction.
To confirm the crack propagation behavior discussed above, the fracture path in the numerical simulation was extracted in every 5.2 μs with its length measured. Then the average crack extending velocity can be calculated and plotted in Figure 13 together with the experimental one. In addition, the horizontal displacement of the extending crack is defined as the benchmark to unify measurement for comparison purposes. Openly, the variation of both curves stays almost the same in Figure 13, and the crack deceleration at point A, B, and C can be detected clearly, even the amplitude of the decline of both are very similar. This implies that a very drastic deceleration event has occurred in the area near the deflection points leaving such trace before transform propagation direction, which matches the phenomenon in the experiment, too. One detail should be noticed, which is that the crack has a very low speed in the initial stage which cannot be recorded by crack propagation gauge in the experiment due to the too-short distance. Near the area C in Figure 13, the crack keeps a relatively low velocity before crack acceleration, and the speed is very fluctuant, which means the mixed-mode I/II crack propagation is a discontinuous process within the short period after initiation companies with high energy consumption. Moreover, this discontinuous process can be described as a deceleration-acceleration movement with unconstant extending speed. To better understand the whole crack propagation process, the crack propagation paths of the specimen-30° in the crucial moments were captured together with its Von Mises contour plots corresponding to time, illustrated in Figure 14 for reference.

5. Conclusions

With the proposed variable angle single cleavage semi-circle (VASCSC) specimen, a comprehensive method of investigation on mixed-mode fracture under impact loading was introduced with both experimental and numerical approaches applied. The mixed-mode I/II crack propagation behavior and determination of initiation stress intensity factor were discussed and a numerical predict strategy was demonstrated. The conclusions are listed below.
  • During the mixed-mode I/II crack propagation process, the deceleration of crack extending velocity would occur at the deflection area of the crack path, which is the flag of fracture mode transformation.
  • The variable angle single cleavage semi-circle (VASCSC) specimen is applicable to the investigation of mixed-mode fracture with SHPB device. It can not only be applied in crack propagation behavior study but also employed for determining dynamic initiation fracture toughness of brittle material with the mixed-mode fracture.
  • The AUTODYN can be applied in predicting crack propagation of mixed-mode I/II for brittle material under dynamic loading with guaranteed precision.

Author Contributions

Conceptualization, F.W., Z.Z., and M.W.; methodology, F.W., Z.Z., and M.W.; software, F.W. and H.Q.; validation, Z.Z. and M.W.; formal analysis, F.W.; investigation, F.W.; resources, Z.Z. and M.W.; data curation, F.W. and P.Y.; writing—original draft preparation, F.W.; writing—review and editing, F.W., Z.Z., M.W., and R.L.; visualization, F.W. and L.Z.; supervision, Z.Z. and M.W.; funding acquisition, Z.Z., M.W. and R.L.; All authors have read and agreed to the published version of the manuscript.

Funding

This research was funded by the National Natural Science Foundation of China (grant number 11702181, 11672194), the open fund of Shock and Vibration of Engineering Materials and Structures Key Laboratory of Sichuan Province (18yfjk02), the Fundamental Research Funds for the Central Universities, the Sichuan Science and Technology Program (Grant Numbers 2019YFG0047).

Conflicts of Interest

The authors declare no conflict of interest.

References

  1. Zhou, L.; Zhu, Z.M.; Dong, Y.Q.; Fan, Y.; Zhou, Q.; Deng, S. The influence of impacting orientations on the failure modes of cracked tunnel. Int. J. Impact Eng. 2019, 125, 134–142. [Google Scholar] [CrossRef]
  2. Rossmanith, H.P.; Daehnke, A.; Knasmillner, R.E.; Kouzniak, N.; Ohtsu, M.; Uenishi, K. Fracture mechanics applications to drilling and blasting. Fatigue Fract. Eng. Mater. Struct. 1997, 20, 1617–1636. [Google Scholar] [CrossRef]
  3. Eberhardt, E.; Stead, D.; Stimpson, B.; Read, R.S. Identifying crack initiation and propagation thresholds in brittle rock. Can. Geotech. J. 1998, 35, 222–233. [Google Scholar] [CrossRef]
  4. Soh, A.K.; Yang, C.H. Numerical modeling of interactions between a macro-crack and a cluster of micro-defects. Eng. Fract. Mech. 2004, 71, 193–217. [Google Scholar] [CrossRef]
  5. Lang, L.; Zhu, Z.M.; Zhang, X.S.; Qiu, H.; Zhou, C.L. Investigation of crack dynamic parameters and crack arresting technique in concrete under impacts. Construre Build. Mater. 2019, 199, 321–334. [Google Scholar] [CrossRef]
  6. Yue, Z.W.; Song, Y.; Yang, R.S.; Yu, Q. Comparison of caustics and the strain gage method for measuring mode I stress intensity factor of PMMA material. Polym. Test. 2017, 59, 10–19. [Google Scholar] [CrossRef]
  7. Ravi-Chandar, K.; Knauss, W.G. An experimental investigation into dynamic fracture: I. Crack initiation and arrest. Int. J. Fract. 1984, 25, 247–262. [Google Scholar] [CrossRef]
  8. Freund, L.B. Dynamic Fracture Mechanics; Cambridge University Press: New York, NY, USA, 1990; 563p. [Google Scholar]
  9. Gao, G.; Yao, W.; Xia, K.; Li, Z. Investigation of the rate dependence of fracture propagation in rocks using digital image correlation (DIC) method. Eng. Fract. Mech. 2015, 138, 146–155. [Google Scholar] [CrossRef] [Green Version]
  10. Wang, F.; Wang, M.; Nezhad, M.M.; Qiu, H.; Ying, P.; Niu, C.Y. Rock Dynamic Crack Propagation under Different Loading Rates Using Improved Single Cleavage Semi-Circle Specimen. Appl. Sci. 2019, 9, 4944. [Google Scholar] [CrossRef] [Green Version]
  11. Chen, R.; Xia, K.; Dai, F.; Lu, F.; Luo, S.N. Determination of dynamic fracture parameters using a semi-circular bend technique in split Hopkinson pressure bar testing. Eng. Fract. Mech. 2009, 76, 1268–1276. [Google Scholar] [CrossRef]
  12. Meng, W.; Zhu, Z.; Dong, Y.; Lei, Z. Study of mixed-mode I/II fractures using single cleavage semicircle compression specimens under impacting loads. Eng. Fract. Mech. 2017, 177, 33–44. [Google Scholar]
  13. Wang, F.; Wang, M.; Zhu, Z. Rock Dynamic Crack Propagation Behaviour and Determination Method with Improved Single Cleavage Semi-circle Specimen Under Impact Loads. Acta Mech. Solida Sin. 2020. [Google Scholar] [CrossRef]
  14. Chang, S.H.; Lee, C.I.; Jeon, S. Measurement of rock fracture toughness under modes I and II and mixed-mode conditions by using disc-type specimens. Eng. Geol. 2002, 66, 79–97. [Google Scholar] [CrossRef]
  15. Aliha, M.R.M.; Mousavi, S.S.; Bahmani, A.; Linul, E.; Marsavina, L. Crack initiation angles and propagation paths in polyurethane foams under mixed modes I/II and I/III loading. Theor. Appl. Fract. Mech. 2019, 101, 152–161. [Google Scholar] [CrossRef]
  16. Eftekhari, M.; Baghbanan, A.; Hashemolhosseini, H. Fracture propagation in a cracked semicircular bend specimen under mixed mode loading using extended finite element method. Arab. J. Geosci. 2015, 8, 9635–9646. [Google Scholar] [CrossRef]
  17. Ayatollahi, M.R.; Aliha, M.R.M. Fracture toughness study for a brittle rock subjected to mixed mode I/II loading. Int. J. Rock Mech. Min. Sci. 2007, 44, 617–624. [Google Scholar] [CrossRef]
  18. Gregoire, D.; Maigre, H.; Rethore, J.; Combescure, A. Dynamic crack propagation under mixed-mode loading-Comparison between experiments and X-FEM simulations. Int. J. Solids Struct. 2007, 44, 6517–6534. [Google Scholar] [CrossRef]
  19. Lin, Q.; Wan, B.; Wang, S.Q.; Li, S.Y.; Fakhimi, A. Visual detection of a cohesionless crack in rock under three-point bending. Eng. Fract. Mech. 2019, 211, 17–31. [Google Scholar] [CrossRef]
  20. Aliha, M.R.M.; Mousavi, S.S.; Ghoreishi, S.M.N. Fracture load prediction under mixed mode I plus II using a stress based method for brittle materials tested with the asymmetric four-point bend specimen. Theor. Appl. Fract. Mech. 2019, 103, 102249. [Google Scholar] [CrossRef]
  21. Al-Shayea, N.A. Crack propagation trajectories for rocks under mixed mode I-II fracture. Eng. Geol. 2005, 81, 84–97. [Google Scholar] [CrossRef]
  22. Zuo, J.P.; Yao, M.H.; Li, Y.J.; Zhao, S.K.; Jiang, Y.Q.; Li, Z.D. Investigation on fracture toughness and micro-deformation field of SCB sandstone including different inclination angles cracks. Eng. Fract. Mech. 2019, 208, 27–37. [Google Scholar] [CrossRef]
  23. Akbardoost, J.; Ayatollahi, M.R.; Aliha, M.R.M.; Pavier, M.J.; Smith, D.J. Size-dependent fracture behavior of Guiting limestone under mixed mode loading. Int. J. Rock Mech. Min. Sci. 2014, 71, 369–380. [Google Scholar] [CrossRef]
  24. Ayatollahi, M.R.; Aliha, M.R.M. On the use of Brazilian disc specimen for calculating mixed mode I-II fracture toughness of rock materials. Eng. Fract. Mech. 2008, 75, 4631–4641. [Google Scholar] [CrossRef]
  25. Wei, M.D.; Dai, F.; Xu, N.W.; Liu, Y.; Zhao, T. Fracture prediction of rocks under mode I and mode II loading using the generalized maximum tangential strain criterion. Eng. Fract. Mech. 2017, 186, 21–38. [Google Scholar] [CrossRef]
  26. Lim, I.L.; Johnston, I.W.; Choi, S.K.; Boland, J.N. Fracture testing of a soft rock with semicircular specimens under 3-point bending. 1: Mode-I. Int. J. Rock Mech. Min. Sci. Geomech. Abstr. 1994, 31, 185–197. [Google Scholar] [CrossRef]
  27. Dimitri, R.; Fantuzzi, N.; Li, Y.; Tornabene, F. Numerical computation of the crack development and SIF in composite materials with XFEM and SFEM. Compos. Struct. 2017, 160, 468–490. [Google Scholar] [CrossRef]
  28. Dimitri, R.; Trullo, M.; Zavarise, G. A consistency assessment of coupled cohesive zone models for mixed-mode debonding problems. Frat. Integrità Strutt. 2014, 29, 266–283. [Google Scholar] [CrossRef] [Green Version]
  29. Dimitri, R.; Zavarise, G. Isogeometric treatment of frictional contact and mixed mode debonding problems. Comput. Mech. 2017, 60, 315–332. [Google Scholar] [CrossRef]
  30. Moës, N.; Belytschko, T. Extended finite element method for cohesive crack growth. Eng. Fract. Mech. 2002, 69, 813–833. [Google Scholar] [CrossRef] [Green Version]
  31. Liaghat, F.; Hematiyan, M.R.; Khosravifard, A.; Rabczuk, T. A robust meshfree method for analysis of cohesive crack propagation problems. Theor. Appl. Fract. Mech. 2019, 104, 13. [Google Scholar] [CrossRef]
  32. Wang, Q.Z.; Feng, F.; Ni, M.; Gou, X.P. Measurement of mode I and mode II rock dynamic fracture toughness with cracked straight through flattened Brazilian disc impacted by split Hopkinson pressure bar. Eng. Fract. Mech. 2011, 78, 2455–2469. [Google Scholar] [CrossRef]
  33. Zhang, Q.B.; Zhao, J. A Review of Dynamic Experimental Techniques and Mechanical Behaviour of Rock Materials. Rock Mech. Rock Eng. 2014, 47, 1411–1478. [Google Scholar] [CrossRef] [Green Version]
  34. Wang, F.; Wang, M. Effect of Holes on Dynamic Crack Propagation under Impact Loading. Appl. Sci. 2020, 10, 1122. [Google Scholar] [CrossRef] [Green Version]
  35. Qiu, P.; Yue, Z.W.; Yang, R.S. Mode I stress intensity factors measurements in PMMA by caustics method: A comparison between low and high loading rate conditions. Polym. Test. 2019, 76, 273–285. [Google Scholar] [CrossRef]
  36. Wang, M.; Zhu, Z.; Xie, J. Experimental and numerical studies of the mixed-mode i and ii crack propagation under dynamic loading using shpb. Chin. J. Rock Mech. Eng. 2015, 34, 2474–2485. [Google Scholar]
  37. Wang, Q.Z.; Yang, J.R.; Zhang, C.G.; Zhou, Y.; Li, L.; Wu, L.Z.; Huang, R.Q. Determination of Dynamic Crack Initiation and Propagation Toughness of a Rock Using a Hybrid Experimental-Numerical Approach. J. Eng. Mech. 2016, 142, 9. [Google Scholar] [CrossRef]
  38. Chen, Y.M. Numerical computation of dynamic stress intensity factors by a Lagrangian finite-difference method. Eng. Fract. Mech. 1975, 7, 653–660. [Google Scholar] [CrossRef] [Green Version]
  39. Zhu, Z. Numerical prediction of crater blasting and bench blasting. Int. J. Rock Mech. Min. Sci. 2009, 46, 1088–1096. [Google Scholar] [CrossRef]
  40. Zhu, Z.; Mohanty, B.; Xie, H. Numerical investigation of blasting-induced crack initiation and propagation in rocks. Int. J. Rock Mech. Min. Sci. 2007, 44, 412–424. [Google Scholar] [CrossRef]
  41. Zhu, Z.; Chao, W.; Kang, J.; Li, Y.; Meng, W. Study on the mechanism of zonal disintegration around an excavation. Int. J. Rock Mech. Min. Sci. 2014, 67, 88–95. [Google Scholar] [CrossRef]
  42. Wang, M.; Wang, F.; Zhu, Z.M.; Dong, Y.Q.; Nezhad, M.M.; Zhou, L. Modelling of crack propagation in rocks under SHPB impacts using a damage method. Fatigue Fract. Eng. Mater. Struct. 2019, 42, 1699–1710. [Google Scholar] [CrossRef]
Figure 1. Different specimens in the mixed-mode fracture testing. (a) Single edge notched three-point-bend (SENB). (b) Asymmetric four-point-bend (AFPB). (c) Brazilian disk (BD) under static loads. (d) Semi-circular bends (SCB) under static loads. (e) Brazilian disk (BD) under dynamic loads. (f) Semi-circular bends (SCB) under dynamic loads.
Applsci 10 07149 g001
Figure 2. Variable angle single cleavage semi-circle (VASCSC) specimen geometry.
Applsci 10 07149 g002
Figure 3. Split-Hopkinson pressure bar (SHPB) system and Crack Propagation Gauge (CPG) system.
Applsci 10 07149 g003
Figure 4. Dynamic stress waves in the experiment. (a) Dynamic stress waves of the Bars. (b) The historical stress waves of the specimen.
Applsci 10 07149 g004
Figure 5. Crack propagation gauge (CPG) signal and derivative of CPG signal. (a) CPG signal curve of specimen-0°. (b) CPG signal curve of specimen-30°.
Applsci 10 07149 g005
Figure 6. Crack fracture patterns of the specimens. (a) The crack pattern of the specimen-0°. (b) The crack pattern of the specimen-30°.
Applsci 10 07149 g006
Figure 7. Crack propagation velocity curves of specimens. (a) specimen-0°. (b) specimen-30°.
Applsci 10 07149 g007
Figure 8. Verification of the ABAQUS. (a) The geometry of Chen’s model. (b) Comparison between Chen’s model and ABAQUS.
Applsci 10 07149 g008
Figure 9. A numerical model of the specimen in ABAQUS.
Applsci 10 07149 g009
Figure 10. Dynamic stress intensity factor curves and determination of DISIF. (a) Historical DSIF curve of specimen-0°. (b) Historical DSIF curve of specimen-30°.
Applsci 10 07149 g010
Figure 11. Numerical (AUTODYN) model of the specimen-30°.
Applsci 10 07149 g011
Figure 12. Numerical (AUTODYN) crack propagation paths. (a) Crack path of the specimen-0°. (b) Crack path of the specimen-30°.
Applsci 10 07149 g012
Figure 13. Crack propagation velocity of the numerical (AUTODYN) and experimental result.
Applsci 10 07149 g013
Figure 14. Crack propagation path and Von Mises contour plot of the specimen-30° in the numerical (AUTODYN) simualtion. (a) t = 235.39 μs. (b) t = 262.42 μs. (c) t = 296.61 μs. (d) t = 338.91 μs. (e) t = 356.57 μs. (f) t = 403.16 μs.
Applsci 10 07149 g014
Table 1. Material parameters of polymethyl methacrylate (PMMA) in the experiment.
MaterialCd (m/s)Cs (m/s)ρ (kg/m3)Ed (GPa)k (GPa)νd
PMMA2382130511875.614.350.28
In this table, Cd denotes the longitudinal wave velocity, CS denotes the transverse wave velocity, Ed denotes the dynamic elastic modulus, vd denotes Poisson’s ratio, k denotes the bulk modulus and ρ denotes the density.
Table 2. Material parameters of the Split-Hopkinson pressure bar.
NameMaterialLength (mm)Diameter (mm)ρ (kg/m3)Ed (GPa)νd
Incident Bar40CrmoV30008076002100.25
Transmitted Bar40CrmoV20008076002100.25
Publisher’s Note: MDPI stays neutral with regard to jurisdictional claims in published maps and institutional affiliations.

