Abstract
Background: To investigate the accuracy and reproducibility of digital measurements of Little’s Irregularity Index and to evaluate if different degrees of dental crowding could influence these measurements. Methods: The study included 40 dental models and 5 sub-groups were created according to the severity of the crowding. In both the digital models and the study cast, Little’s Irregularity Index was recorded by measuring (1) the mesiodistal width of each tooth and (2) the arch lengths in both the maxillary and mandibular jaw. Two operators performed measurements on plaster and digital models using, respectively, a digital caliper and OrthoAnalyzerTM 3D software (3Shape A/S, Copenhagen, Denmark). Statistical analysis was performed to assess intra- and inter-operator variability, the accuracy between manual and digital measurements and if the amount of crowding could affect the accuracy of the digital measurements. Results: Concerning intra-examiner reliability, no statistically significant differences were detected (p > 0.05). In the maxillary and mandibular arch, the Intraclass Correlation Coefficient (ICC) value was 0.996 and 0.997 for the analogic measurements and 0.998 and 0.978 for the digital measurements. For the maxillary arch, the mean difference between the analogic and digital Little’s Irregularity Index (LII) measurements was 0.43 mm while for the mandibular arch the mean difference was 0.24 mm, showing some overestimation of the digital measurements (p < 0.05). No differences were found according to crowding subgroups (p > 0.05). Conclusions: Digital measurements of LII could be considered as a valid substitute of the gold standard analogical measurement.
1. Introduction
Study models allow clinicians to carry out space analysis and to evaluate the discrepancy in tooth size and arch length by using Bolton’s ratio and other parameters such as Little’s Irregularity Index (LII). LII is a method introduced in 1975 by Little [1], used to calculate the misalignment of mandibular anterior teeth, from canine to canine, through the sum of the displacements of the interproximal contact points of the incisors from contiguous teeth [2]. Once summed, the value represents the degree of anterior crowding. LII has been used mostly as a valid measurement of anterior arch length discrepancy [3,4,5,6] and to analyze the normal maturational changes of the dentition.
Nowadays, thanks to the introduction of new technologies, such as three-dimensional (3D) intra- and extra-oral scanners, the use of digital models is increasingly widespread and offers important advantages: less storage space than plaster models; instantaneous accessibility to patients’ records on the computer screen; accuracy and efficiency of tooth measurements, arch sizes and dental crowding; and online sharing systems of diagnostic records [7]. However, measurements made on the plaster models are still considered as the “gold standard” despite requiring physical storage space [8,9], and can undergo breakage and degradation issues in the long term [10,11]. It is still questionable if digital measurements can substitute those obtained from dental casts and controversial if any definitive conclusions have been reached [11]. Although some authors [2,10,12,13,14] have compared LII measurements between plaster casts and digital models, they have not focused the correlation with different degrees of crowding, according to the American Board of Orthodontics (ABO) Discrepancy Index.
Accordingly, the objective of this investigation was to evaluate the accuracy and reproducibility of the LII digital measurements, on the upper and lower arches, comparing the values taken from the plaster casts with the ones taken from digital models and to evaluate if the different degrees of dental crowding could influence these measurements.
2. Materials and Methods
The 40 plaster models (maxillary and mandibular jaws) with a different degree of crowding were selected among 313 dental models of subjects undergoing orthodontic treatment in private practice from March 2016 to August 2019.
Dental crowding was preliminary assessed by a specialist clinician (L.R.) and five groups were defined following the Discrepancy Index of the American Board of Orthodontists (ABO): from ≥0 to ≤1 mm = group “A”; from >1 to ≤3 = mm group “B”; from >3 to ≤5 mm = group “C”; from >5 to ≤7 mm = group “D”; and >7 mm = group “E”. Finally, 8 models were randomly recruited from each group by using web-based software (www.randomizer.org).
A power calculation was preliminary performed using a specific research toolkit (DSS Research, Washington, USA), which indicated that a minimum of 6 models were necessary for each subgroup to register 0.3 mm of difference between the analogic and digital measurements, setting the confidence level at 95% and the Beta error at 15%.
The inclusion criteria were selected as follow: patient’s age under 16 years old, no previous orthodontic treatment, fully erupted maxillary and mandibular teeth, and LII > 4 mm.
The exclusion criteria were selected as follow: presence of missing teeth or agenesis (except for third molar), form anomaly, interproximal restorations and unrestored carious cavities.
After collecting the plaster models, they were blindly coded for de-identification process, scanned using a 3D laser scanner (3Shape D500, 3Shape A/S, Copenaghen, Denmark) and then rendered into a 3D stereolitographic digital model (.stl) through specific software (ScanIt™ Orthodonthics, 3Shape A/S, Copenaghen, Denmark). Then, both the digital and plaster models were collected together in order to perform the measurements. Afterwards, Little’s index was calculated according to the ABO’s guidelines [8].
In this contest, manual measurements were performed on dental casts by using a digital caliper (Figure 1) and registered to the nearest 0.1 mm [1,15].
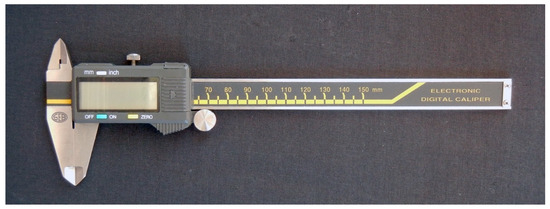
Figure 1.
Digital Vernier caliper used to measure the displacement of the contact points.
On the other hand, digital measurements were carried out on digital models using a specific software from a 3D scanner manufacturer (OrthoAnalyzerTM 3D software, version 1.6.1.6, 3Shape A/S, Copenhagen, Denmark) on a calibrated flat 22” monitor with a mouse, which were both set and checked (Figure 2).
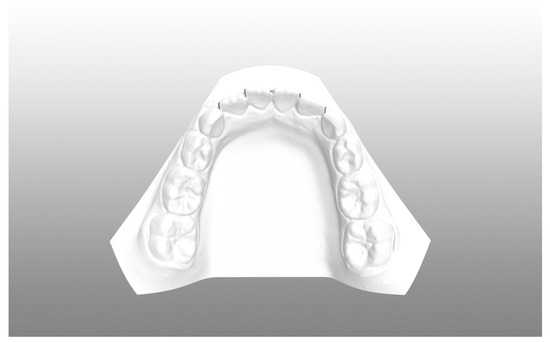
Figure 2.
3Shape Ortho Analyzer Tool used to measure the displacement of contact points on a digital 3D model.
In order to assess the intra- and inter-operator accuracy and reliability, analogic and digital measurements were repeated after two weeks by two specialized operators (V.R. and L.R.) working independently with 5 years of orthodontic experience [9,16,17]. Only seven sets of casts per day were measured, in order to avoid eye fatigue and to minimize the possibility of subjective errors.
Statistical Analysis
All measurements data were registered on a spreadsheet and were analyzed using SPSS statistics software, version 24.0.0 (IBM Corporation, 1 New Orchard Road, Armonk, New York, USA), setting the level of significance at p < 0.05.
Parametric tests were used for statistical purposes since the Shapiro–Wilk test showed a normal distribution of the data.
In order to evaluate the intra-operator reliability, a paired t-test was used; in turn, the inter-operator reliability was assessed by the Intraclass Correlation Coefficient (ICC).
In order to compare the accuracy between both methods, a paired t-test was carried out. Finally, the one-way analysis of variance (ANOVA) was performed to evaluate the differences between the analogical and digital measurements for the five subgroups of crowding, according to the ABO Discrepancy Index.
3. Results
No statistically significant difference was obtained when comparing the intra-operator reliability of the two sets of analogic and digital measurements for all the operators (p ≥ 0.05) (Table 1)

Table 1.
Intra-operator reliability for Operator 1 and 2. Units are represented in millimeters. The p value obtained from paired t-tests. NS = non-significant (p > 0.05).
The inter-operator reliability, investigated using ICC, was almost perfect (Table 2), with ICC values of 0.996 and 0.997, respectively, for the analogic measurements on maxillary and mandibular arches, and 0.998 and 0.978, respectively, for the digital measurements on the maxillary and mandibular arches.
Table 2.
Inter-operator reliability for the plaster and digital measurements. Units are represented in millimeters. ICC = intraclass correlation coefficient.
The mean difference between the analogic and digital LII measurements was 0.43 mm for the maxillary jaw and 0.24 mm for the mandibular jaw, showing that the greatest difference was retrieved in the upper arch, with an overestimation of digital measurements in both arches.
Additionally, when comparing the measurements taken from the digital and plaster casts with a paired t-test (Table 3), statistically significant differences were obtained for both the lower (p ≤ 0.05) and upper (p ≤ 0.01) arches.
Table 3.
Differences in Little’s Irregularity Index measurements between the plaster and digital models. Units are represented in millimeters. The p values are based on paired t-tests. * p ≤ 0.05; ** p ≤ 0.01.
When comparing the differences between the analogic and digital measurements for the 5 ABO groups of crowding for both the upper and lower arch, no statistically significant correlation, using one-way ANOVA, was obtained (p ≥ 0.05) (Table 4).
Table 4.
Mean values and difference between the plaster and digital measurements (ABO score) for each group of crowding.
4. Discussion
Few studies [2,10,11] have investigated the reliability/accuracy of LII taken from digital models, but no one, to our knowledge, has evaluated these features in association with different degrees of dental crowding. Among these studies, only Goonewardene et al. [2] has evaluated the LII measurements in both the maxillary and mandibular arches while other studies [3,11,12] have assessed the index only on one dental arch. In this contest, two other studies [11,13] investigated the accuracy of LII respectively on both arches and on the upper arch, although using only manual measurements of the dental casts.
Regarding the accuracy of the digital LII measurements, our study disagreed with the findings reported by Goonewardene et al. [2], which demonstrated no significant difference between the digital and analogic methods and that accurate and precise measurements of LII could be taken also digitally. In fact, findings from our study demonstrated that the differences between the analogic and digital measurements were significant, especially for maxillary arches with a mean difference of 0.43 mm (p ≤ 0.01), whereas differences were lower in the mandibular arch (0.24 mm) (p ≤ 0.05). In this contest, our findings were in accordance with the study of Czarnota et al. [12], which showed a difference of 0.41 mm between the mean values obtained from digital and plaster casts but concluded that LII measured on digital models could be considered reliable and, consequently, could be employed in clinical practice, although a little overestimation for the digital measurements was present.
In this contest, the differences found in the present investigation were of a very small entity and could not affect the accuracy of the LII measurements, especially when they were carried out on the mandibular arch, considered the guidance arch to plan a correct orthodontic treatment [14,15,16].
Regarding the reliability of the LII digital and analogical measurements, our study corroborates findings reported by Dowling et al. [11], which demonstrated an improvement of LII reliability by using a digital measurement method. In fact, our findings demonstrate an excellent intra- and inter-operator reliability obtained in the two record sessions, for both the digital and plaster models, and this is coherent with other studies [2,11,12,15,17,18,19,20].
In this study, we evaluated LII measurements in both the lower and upper arches and for the first time we have also considered the correlation between the accuracy of the LII digital measurements, with respect to the analogic ones, and the dental crowding by selecting five crowding groups according to the ABO Discrepancy Index. Our findings demonstrated that there was no correlation between the accuracy of the digital LII measurements and the different degrees of dental crowding (p ≥ 0.05) (Table 4).
The question if LII is a good parameter for using in clinical practice is still debatable [8,11]. In fact, LII had some deficiencies, especially when there was a single tooth with severe displacement that produced a high LII score not correlated to the arch length discrepancy (ALD). A limitation of the LII is that this it is only a measurement of irregularity; thus, it does not take into account tooth rotations and axial inclinations [7,21].
We found that LII digital measurements were more reliable when the contact point displacement was gradually increasing, especially for the mandibular arch. These findings are in agreement with the study of Dowling et al. [11], which suggested an improvement in LII reliability, using digital measurements, for a contact point displacement ≥ 1 mm, due to a reduction in subjectivity in the points selecting and overcoming the difficulty of measuring the displacement of the contact points using a bulky caliper.
Furthermore, using digital measurements, it is possible to obtain a magnification of the images and this permits to have a finer evaluation of the contact points despite the plaster models, in which the abnormal teeth’s relationship may alter the correct localization of the ideal interproximal contact points [22,23].
5. Limitations
Recent evidence has reported a slight underestimation of measurements performed on digitalized plaster model compared to those performed on the original digital model, due to an intrinsic computation algorithm bias [24,25]. Accordingly, it could be possible that the present study might be biased from this limitation.
6. Conclusions
Both digital and analogic measurements of LII demonstrated a high level of intra- and inter-operator reliability. A slight overestimation was found with the digital assessment of the irregularity index compared with the manual method; however, it could be considered clinically negligible. Moreover, the amount of dental crowding does not alter the accuracy of the digital measurements compared to the manual measurements. According to these findings, digital measurements of LII could be considered as a valid substitute of the plaster measurements, which represents the current gold standard.
Author Contributions
Conceptualization, G.P.; writing, V.R.; co-writing, L.R.; formal analysis, S.M.; software, G.F.; data curation, P.C.; supervision and validation, R.N. All authors have read and agreed to the published version of the manuscript.
Funding
This research received no external funding.
Conflicts of Interest
The authors declare no conflict of interest.
References
- Little, R.M. The irregularity index: A quantitative score of mandibular anterior alignment. Am. J. Orthod. 1975, 68, 554–563. [Google Scholar] [PubMed]
- Goonewardene, R.W.; Goonewardene, M.S.; Razza, J.M.; Murray, K. Accuracy and validity of space analysis and irregularity index measurements using digital models. Aust. Orthod. J. 2008, 24, 83–90. [Google Scholar] [PubMed]
- Isola, G.; Alibrandi, A.; Currò, M.; Matarese, M.; Ricca, S.; Matarese, G.; Ientile, R.; Kocher, T. Evaluation of salivary and serum ADMA levels in patients with periodontal and cardiovascular disease as subclinical marker of cardiovascular risk. J. Periodontol. 2020, 91, 1076–1084. [Google Scholar] [CrossRef]
- Lo Giudice, A.; Nucera, R.; Perillo, L.; Paiusco, A.; Caccianiga, G. Is low-level laser therapy an effective method to alleviate pain induced by active orthodontic alignment archwire? A randomized clinical trial. J. Evid. Based Dent. Pract. 2019, 19, 71–78. [Google Scholar] [PubMed]
- Lo Giudice, A.; Ronsivalle, V.; Grippaudo, C.; Lucchese, A.; Muraglie, S.; Lagravère, M.O.; Isola, G. One Step before 3D Printing-Evaluation of Imaging Software Accuracy for 3-Dimensional Analysis of the Mandible: A Comparative Study Using a Surface-to-Surface Matching Technique. Materials 2020, 13, 2798. [Google Scholar]
- Burns, A.; Dowling, A.H.; Garvey, T.M.; Fleming, G.J. The reliability of Little’s Irregularity Index for the upper dental arch using three dimensional (3D) digital models. J. Dent. 2014, 42, 1320–1326. [Google Scholar] [PubMed]
- Lo Giudice, G.; Lo Giudice, A.; Isola, G.; Fabiano, F.; Artemisia, A.; Fabiano, V.; Nucera, R.; Matarese, G. Evaluation of bond strength and detachment interface distribution of different bracket base designs. Acta Med. Mediterr 2015, 31, 585. [Google Scholar]
- Stevens, D.R.; Flores-Mir, C.; Nebbe, B.; Raboud, D.W.; Heo, G.; Major, P.W. Validity, reliability, and reproducibility of plaster vs. digital study models: Comparison of peer assessment rating and Bolton analysis and their constituent measurements. Am. J. Orthod. Dentofac. Orthop. 2006, 129, 794–803. [Google Scholar]
- Akyalcin, S.; Cozad, B.E.; English, J.D.; Colville, C.D.; Laman, S. Diagnostic accuracy of impression-free digital models. Am. J. Orthod. Dentofac. Orthop. 2013, 144, 916–922. [Google Scholar]
- Lippold, C.; Kirschneck, C.; Schreiber, K.; Abukiress, S.; Tahvildari, A.; Moiseenko, T.; Danesh, G. Methodological accuracy of digital and manual model analysis in orthodontics; A retrospective clinical study. Comput. Biol. Med. 2015, 62, 103–109. [Google Scholar] [PubMed]
- Dowling, A.H.; Burns, A.; Macauley, D.; Garvey, T.M.; Fleming, G.J. Can the intra-examiner variability of Little’s Irregularity Index be improved using 3D digital models of study casts? J. Dent. 2013, 41, 1271–1280. [Google Scholar] [CrossRef] [PubMed]
- Czarnota, J.; Hey, J.; Fuhrmann, R. Measurements using orthodontic analysis software on digital models obtained by 3D scans of plaster casts: Intrarater reliability and validity. J. Orofac. Orthop. 2016, 77, 22–30. [Google Scholar] [CrossRef] [PubMed]
- Macauley, D. Using Little’s Irregularity Index in orthodontics: Outdated and inaccurate? J. Dent. 2012, 40, 1127–1233. [Google Scholar] [CrossRef] [PubMed]
- Currò, M.; Matarese, G.; Isola, G.; Caccamo, D.; Ventura, V.P.; Cornelius, C.; Lentini, M.; Cordasco, G.; Ientile, R. Differential expression of transglutaminase genes in patients with chronic periodontitis. Oral Dis. 2014, 20, 616–623. [Google Scholar] [CrossRef]
- Mayers, M. Comparison of peer assessment rating (PAR) index scores of plaster and computer-based digital models. Am. J. Orthod. Dentofac. Orthop. 2005, 128, 431–434. [Google Scholar] [CrossRef] [PubMed]
- Isola, G.; Alibrandi, A.; Pedullà, E.; Grassia, V.; Ferlito, S.; Perillo, L.; Rapisarda, E. Analysis of the Effectiveness of Lornoxicam and Flurbiprofen on Management of Pain and Sequelae Following Third Molar Surgery: A Randomized, Controlled, Clinical Trial. J. Clin. Med. 2019, 8, 325. [Google Scholar] [CrossRef]
- Isola, G.; Matarese, M.; Ramaglia, L.; Cicciù, M.; Matarese, G. Evaluation of the efficacy of celecoxib and ibuprofen on postoperative pain, swelling, and mouth opening after surgical removal of impacted third molars: A randomized, controlled clinical trial. Int. J. Oral Maxillofac. Surg. 2019, 48, 1348–1354. [Google Scholar] [CrossRef]
- Perillo, L.; Isola, G.; Esercizio, D.; Iovane, M.; Triolo, G.; Matarese, G. Differences in craniofacial characteristics in Southern Italian children from Naples: A retrospective study by cephalometric analysis. Eur. J. Paediatr. Dent. 2013, 14, 195–198. [Google Scholar]
- Isola, G.; Polizzi, A.; Santonocito, S.; Alibrandi, A.; Ferlito, S. Expression of Salivary and Serum Malondialdehyde and Lipid Profile of Patients with Periodontitis and Coronary Heart Disease. Int. J. Mol. Sci. 2019, 20, 6061. [Google Scholar] [CrossRef]
- Isola, G.; Polizzi, A.; Iorio-Siciliano, V.; Alibrandi, A.; Ramaglia, L.; Leonardi, R. Effectiveness of a nutraceutical agent in the non-surgical periodontal therapy: A randomized, controlled clinical trial. Clin. Oral Investig. 2020. Epub ahead of print. [Google Scholar] [CrossRef]
- Lo Giudice, A.; Ronsivalle, V.; Lagravere, M.; Leonardi, R.; Martina, S.; Isola, G. Transverse dentoalveolar response of mandibular arch after rapid maxillary expansion (RME) with tooth-borne and bone-borne appliances: A CBCT retrospective study. Angle Orthod. 2020, 90, 680–687. [Google Scholar] [CrossRef]
- Nucera, R.; Lo Giudice, A.; Matarese, G.; Artemisia, A.; Bramanti, E.; Crupi, P.; Cordasco, G. Analysis of the characteristics of slot design affecting resistance to sliding during active archwire configurations. Prog. Orthod. 2013, 14, 35. [Google Scholar] [CrossRef] [PubMed]
- Gül Amuk, N.; Karsli, E.; Kurt, G. Comparison of dental measurements between conventional plaster models, digital models obtained by impression scanning and plaster model scanning. Int. Orthod. 2019, 17, 151–158. [Google Scholar] [CrossRef] [PubMed]
- Lo Giudice, A.; Leonardi, R.; Ronsivalle, V.; Allegrini, S.; Lagravère, M.; Marzo, G.; Isola, G. Evaluation of pulp cavity/chamber changes after tooth-borne and bone-borne rapid maxillary expansion. A CBCT study using surface-based superimposition and deviation analysis. Clin. Oral Investig. 2020, in press. [Google Scholar] [CrossRef] [PubMed]
- Lo Giudice, A.; Ortensi, L.; Farronato, M.; Lucchese, A.; Lo Castro, E.; Isola, G. The step further smile virtual planning: Milled versus prototyped mock-ups for the evaluation of the designed smile characteristics. BMC Oral Health 2020, 20, 165. [Google Scholar] [CrossRef]
© 2020 by the authors. Licensee MDPI, Basel, Switzerland. This article is an open access article distributed under the terms and conditions of the Creative Commons Attribution (CC BY) license (http://creativecommons.org/licenses/by/4.0/).