Optimization of Soil to Fly-Ash Mix Ratio for Enhanced Engineering Properties of Clayey Sand for Subgrade Use
Abstract
1. Introduction
2. Materials and Methods
3. Results and Discussion
3.1. Specific Gravity
3.2. Optimum Moisture Content and Maximum Dry Density
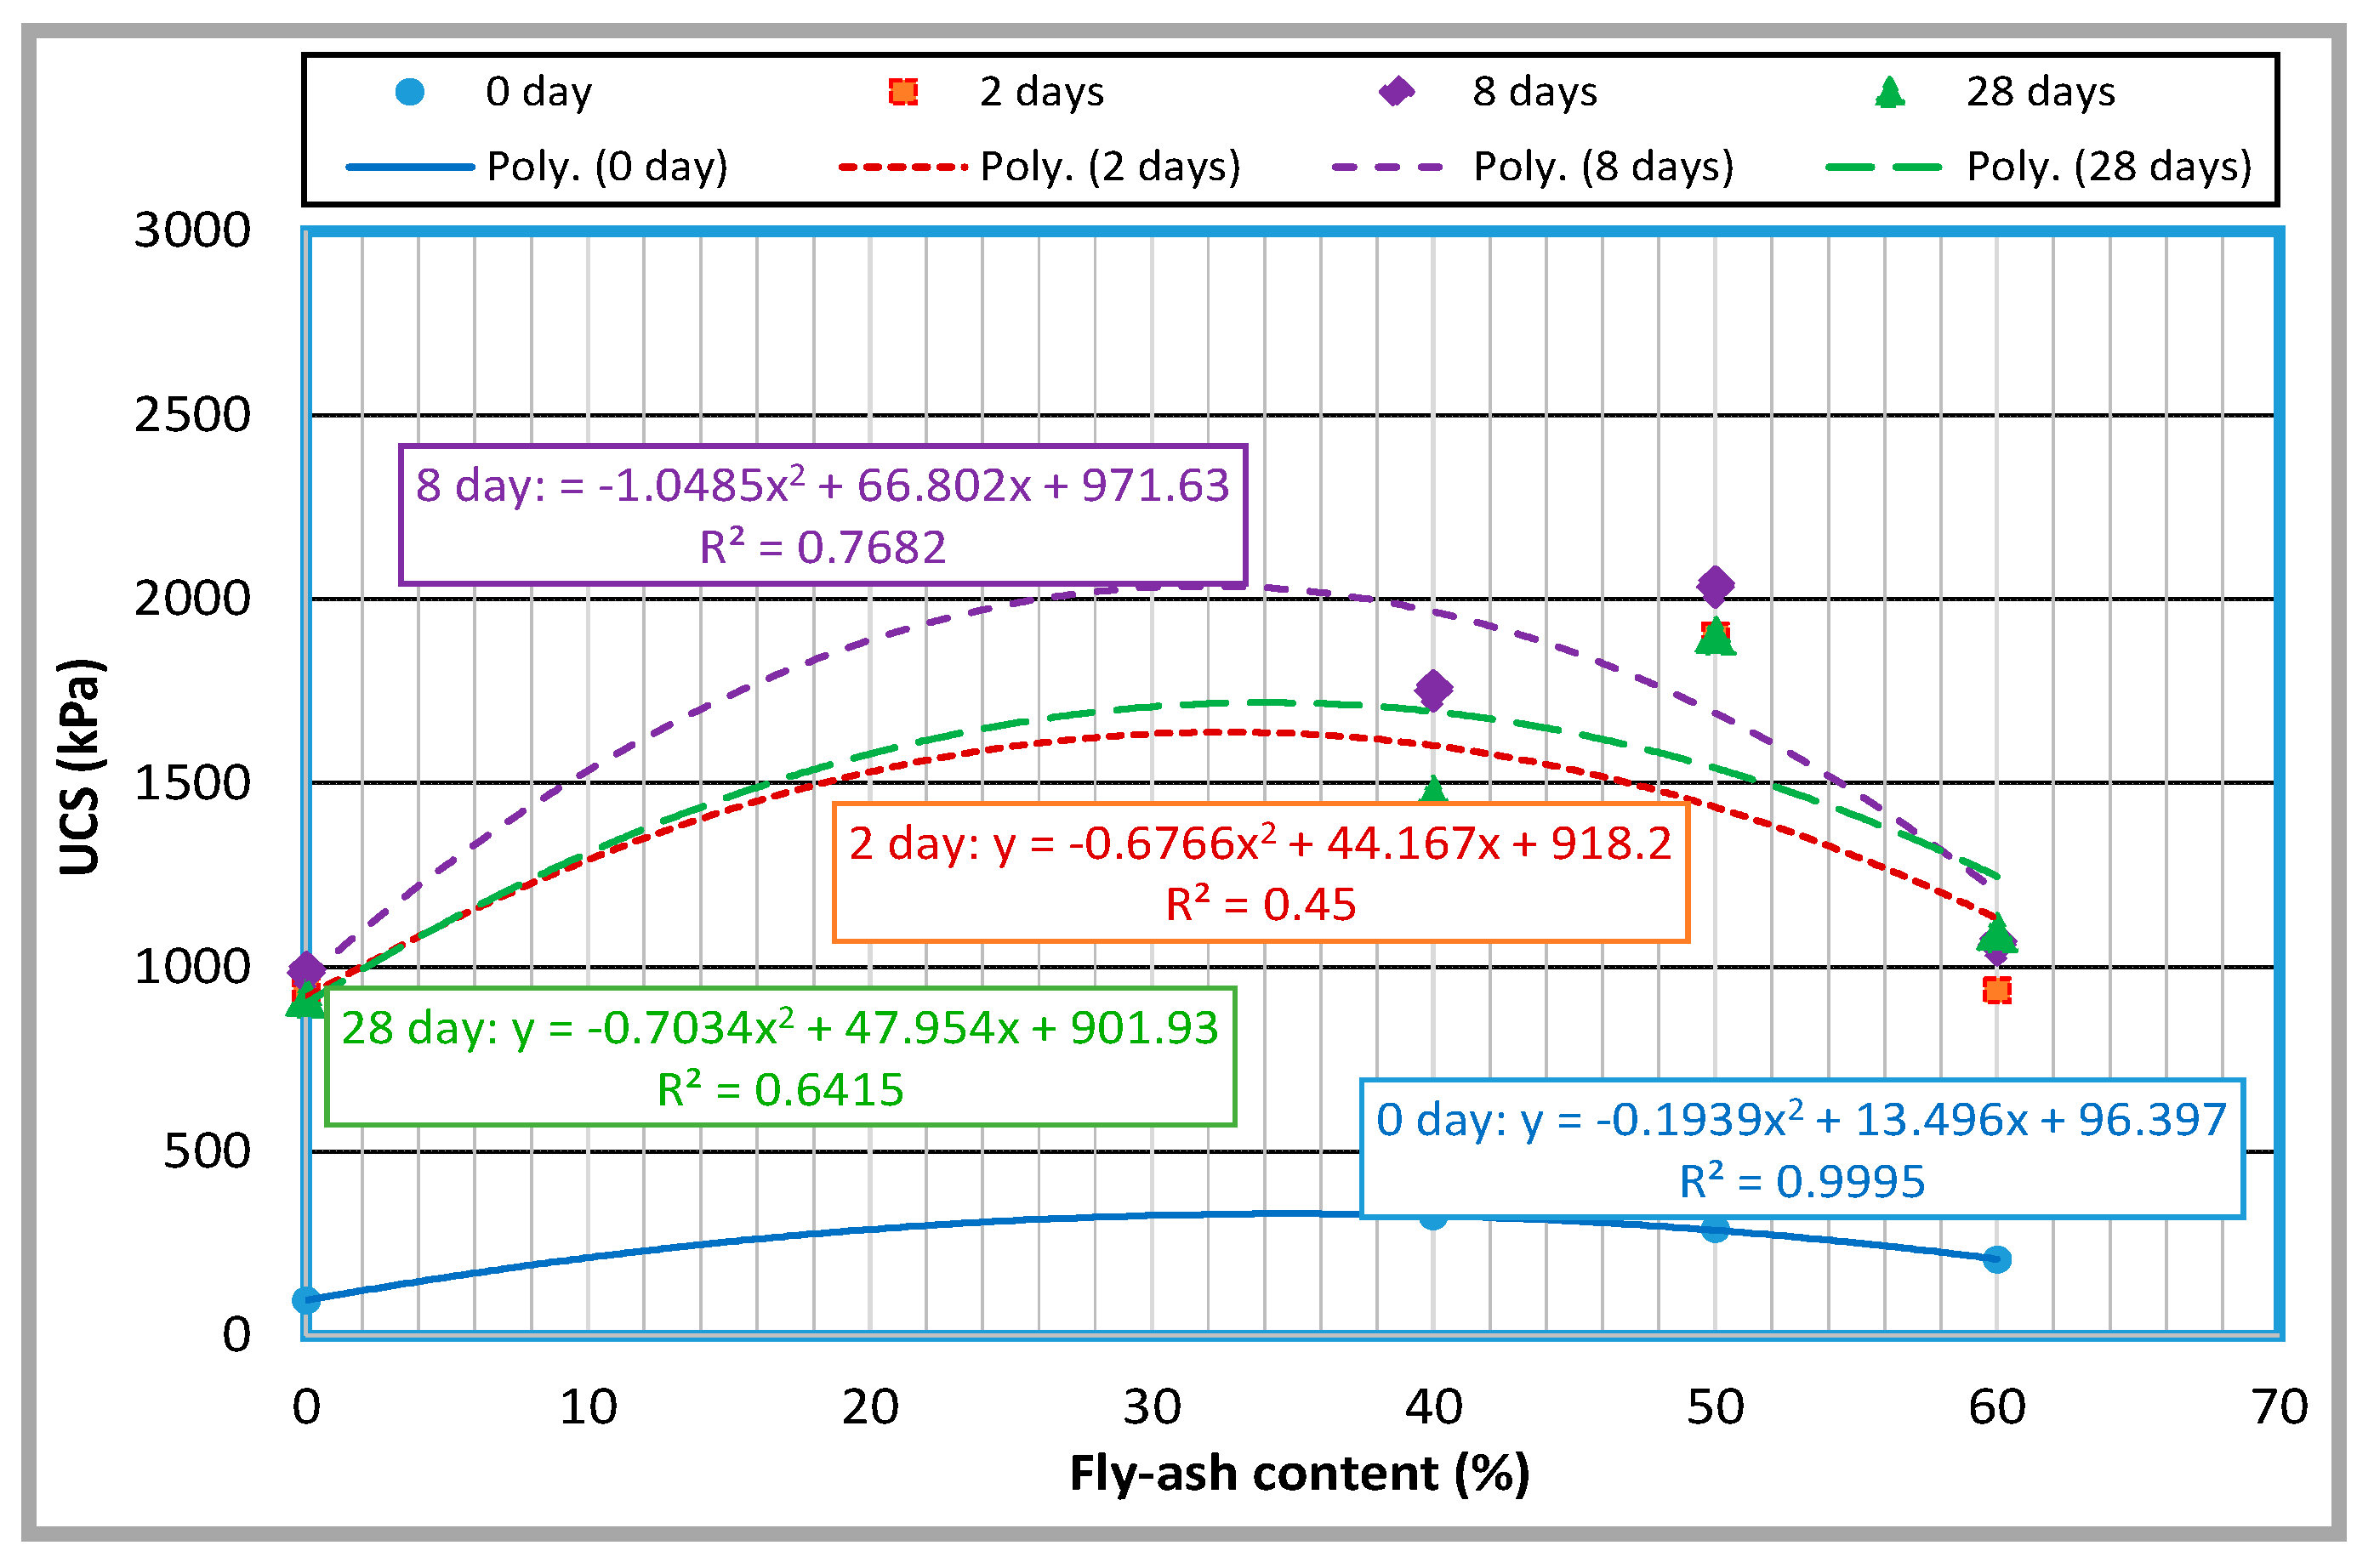
3.3. Unconfined Compressive Strength and Curing Period
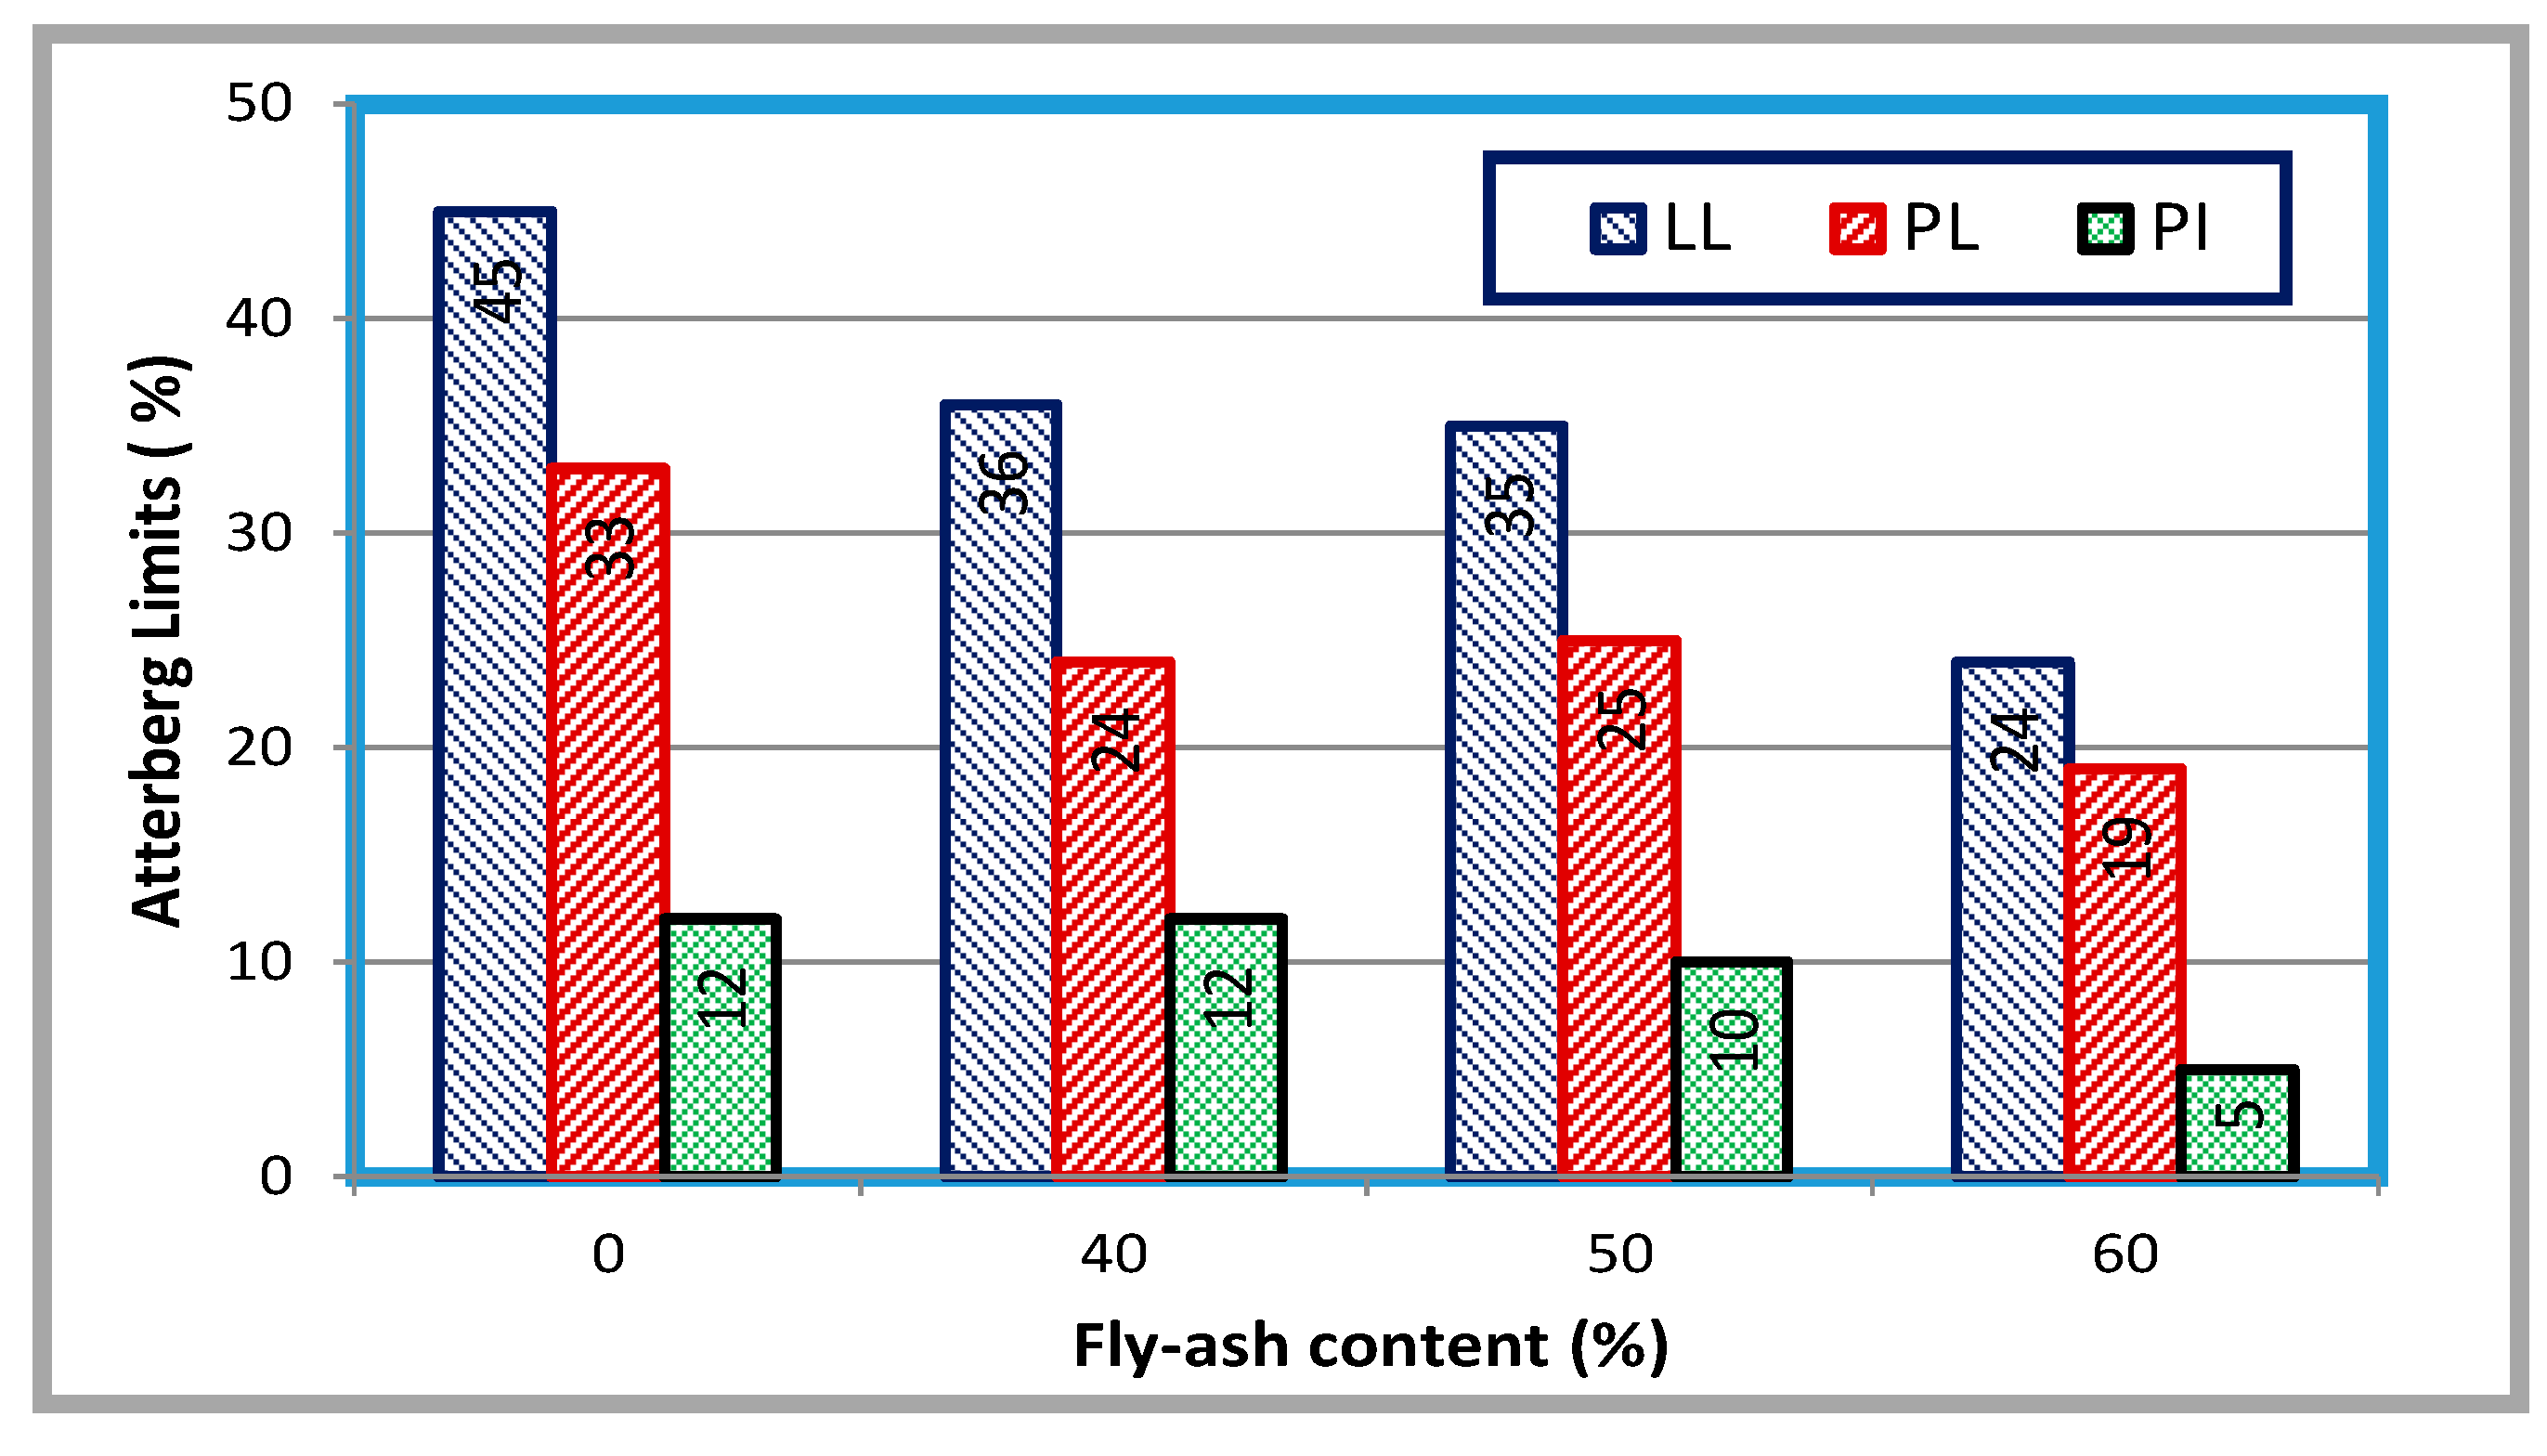
3.4. Atterberg Limits
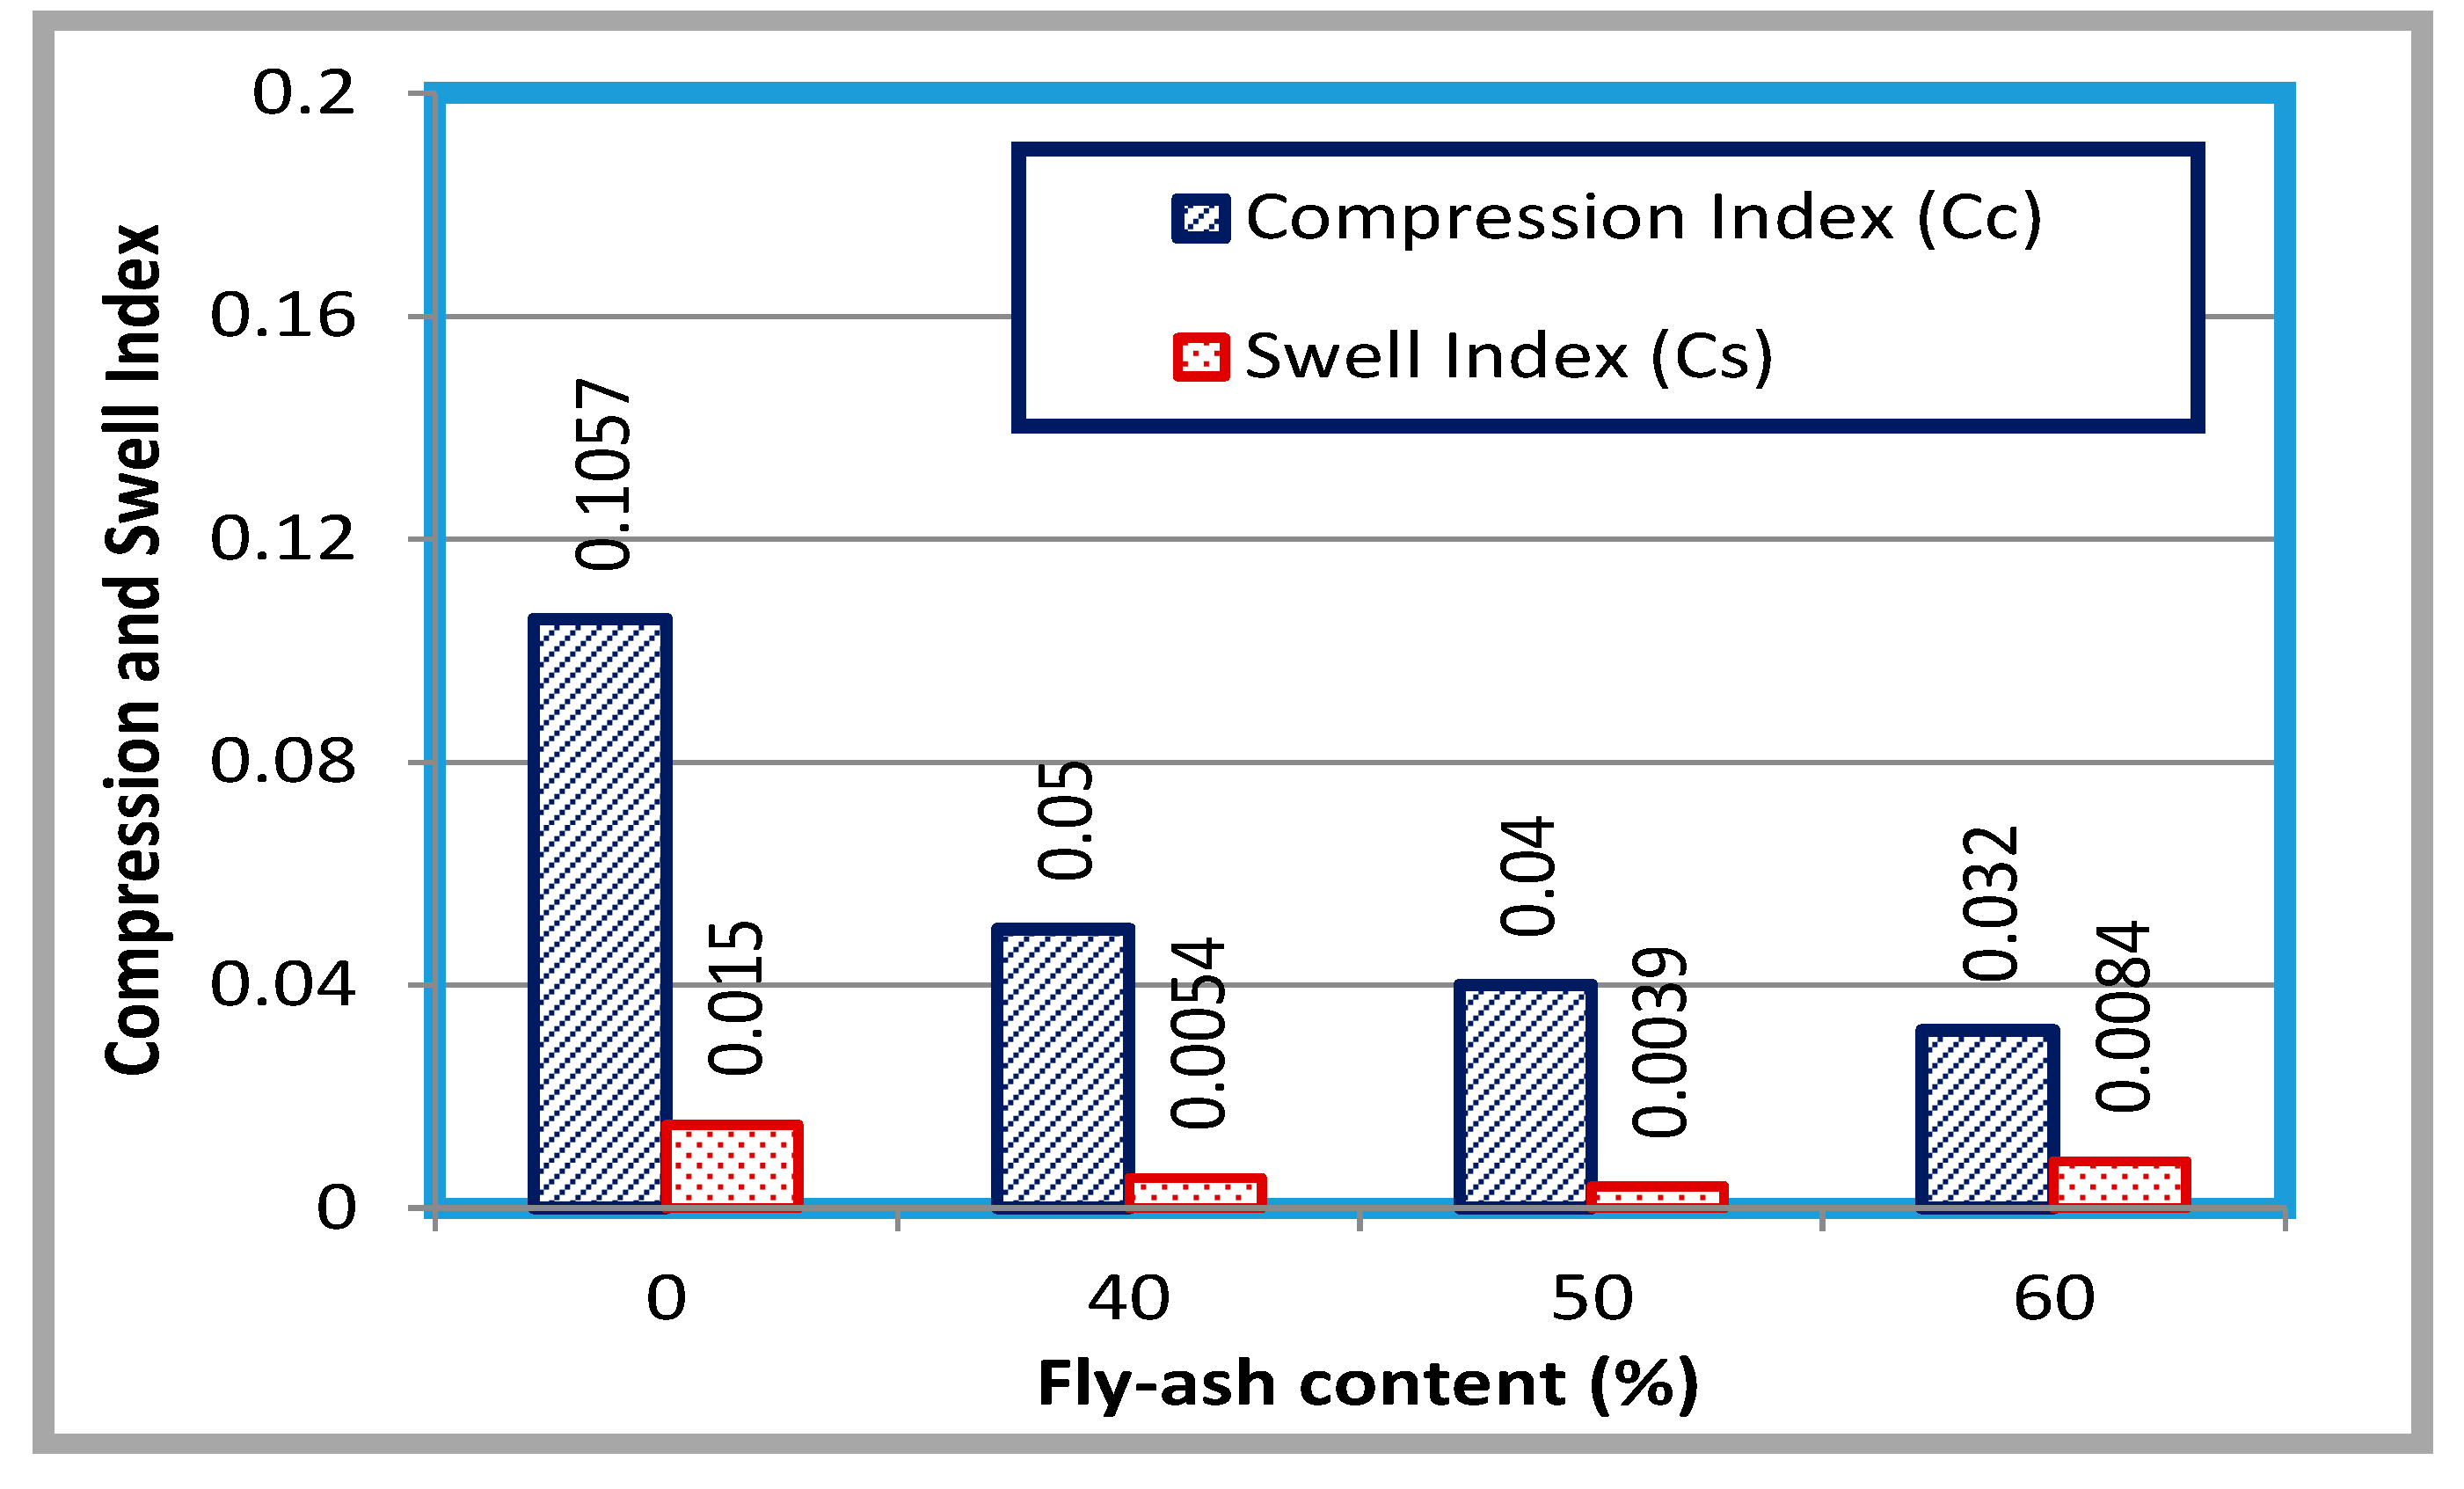
3.5. Compression Index and Swell Index
4. Conclusions and Recommendations
4.1. Conclusions
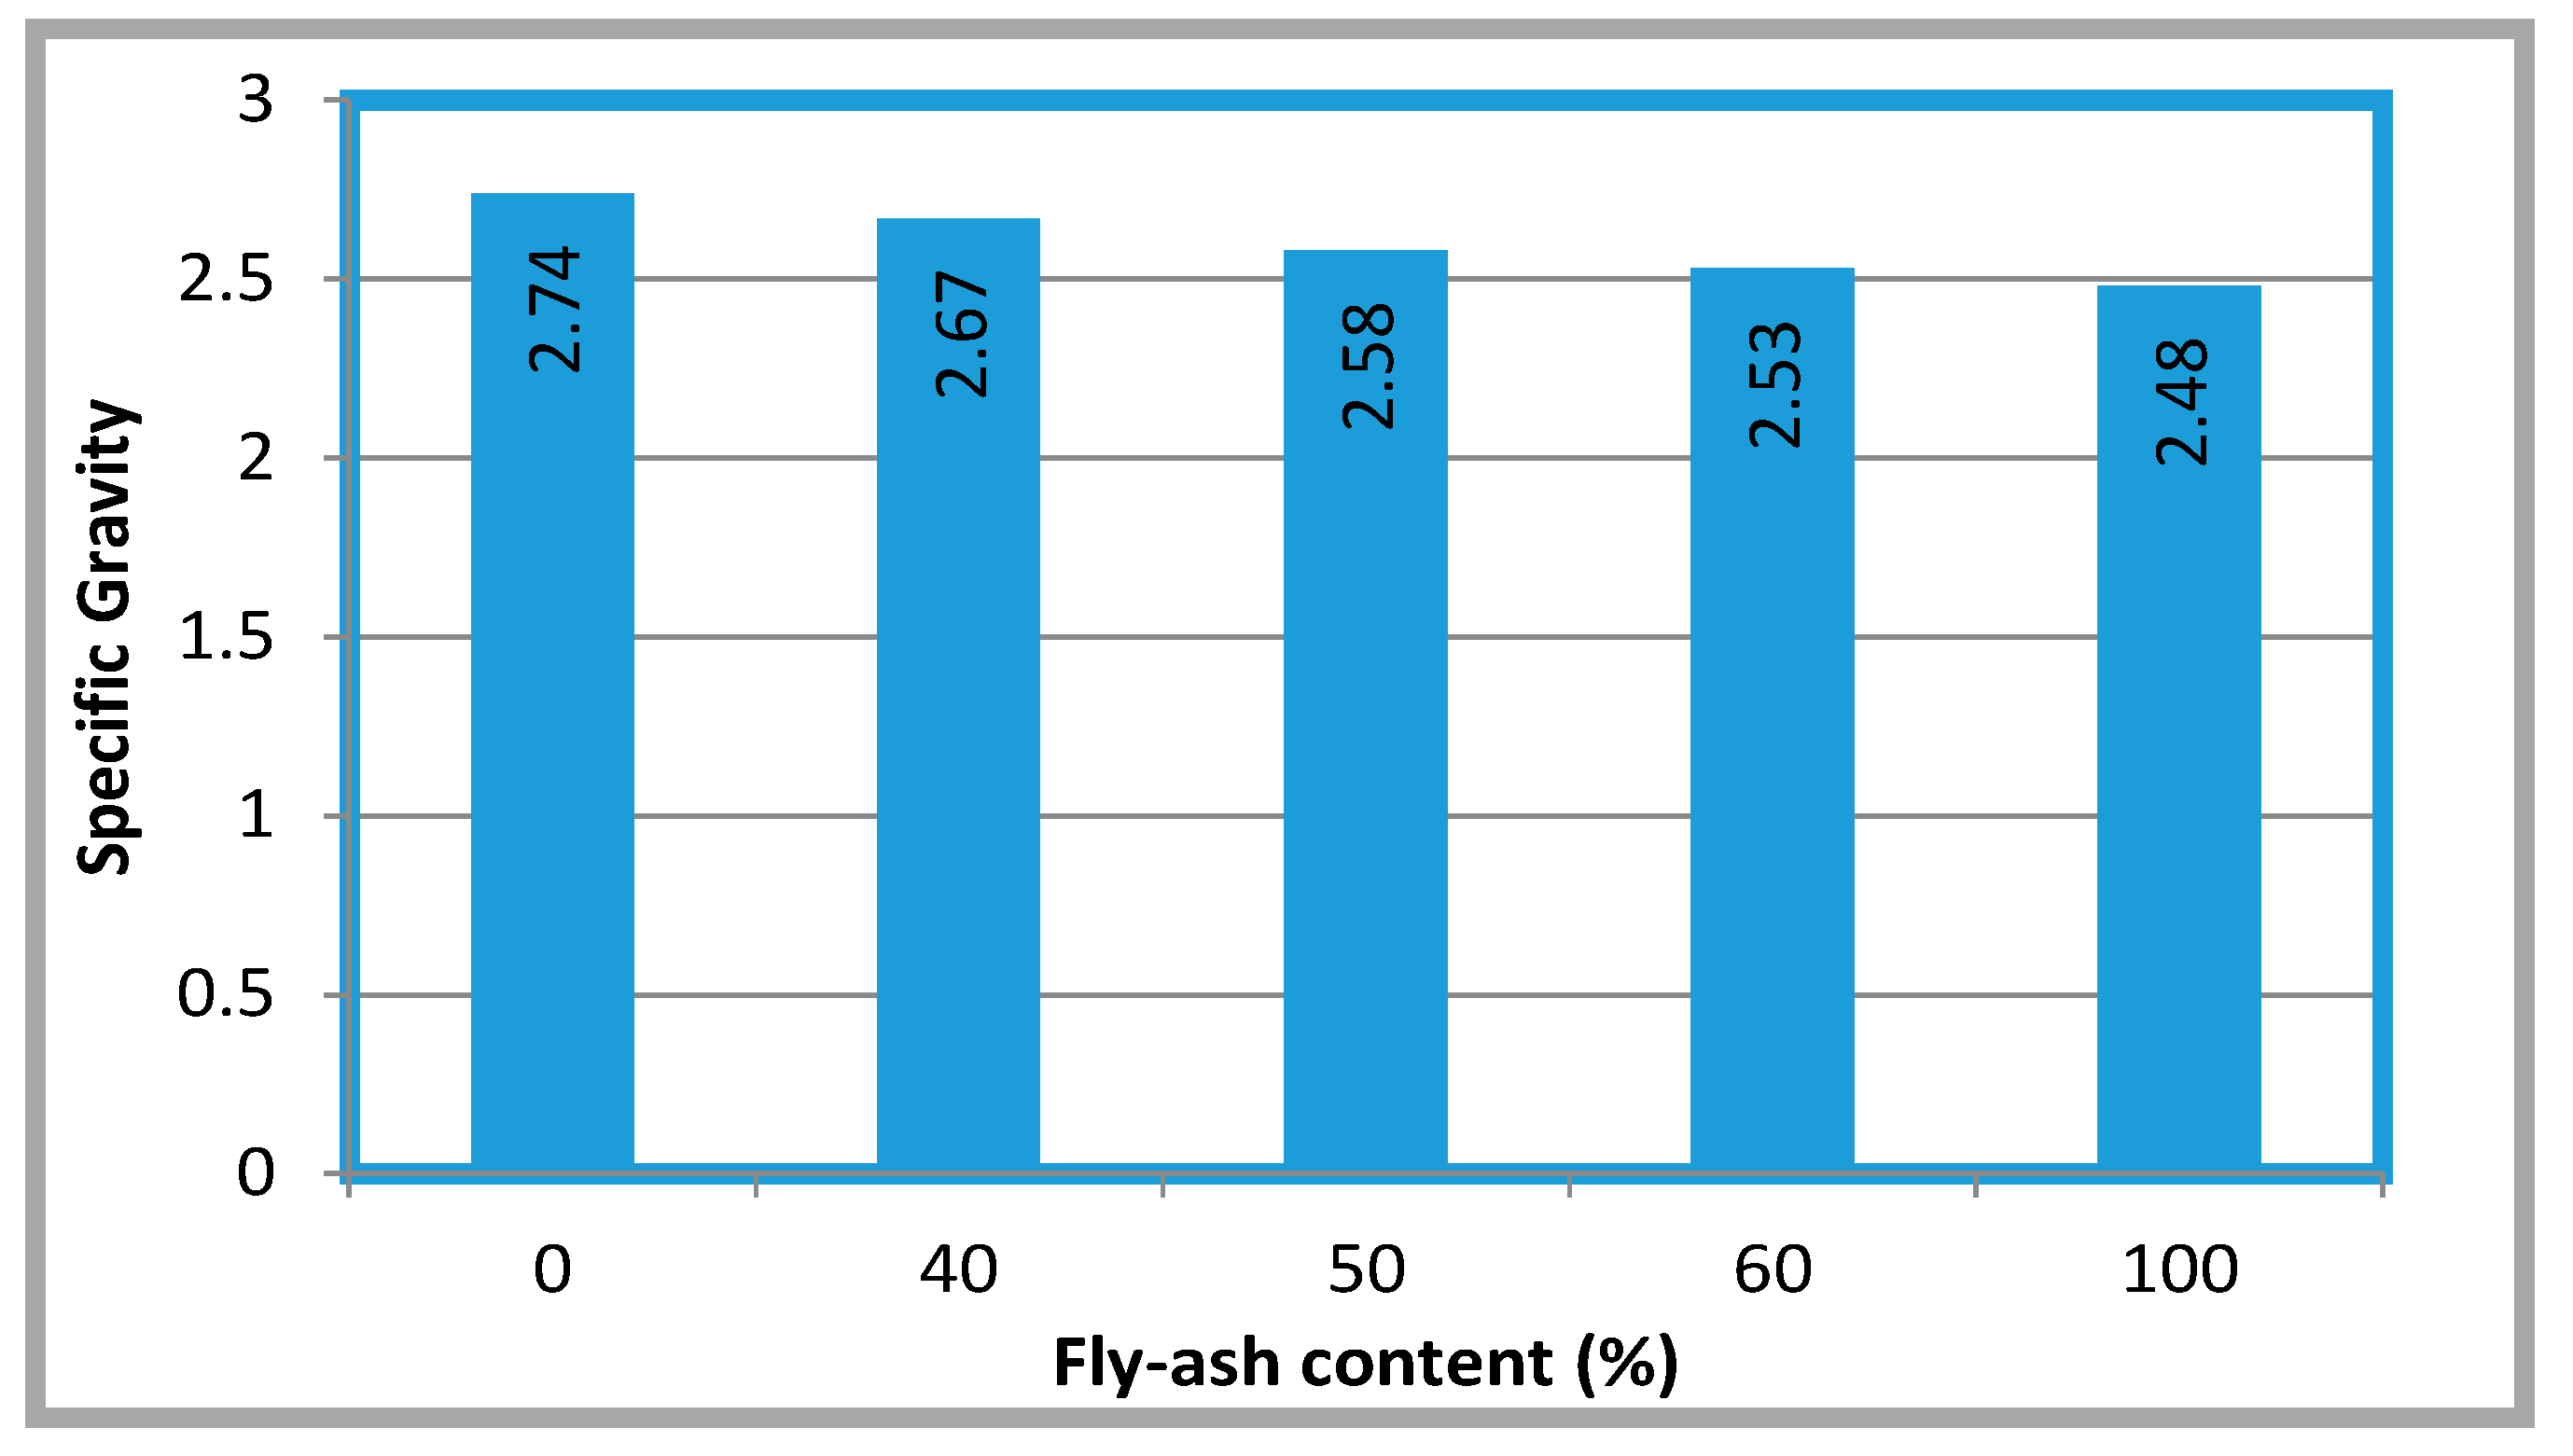
- The specific gravity of the mixtures decreased as the percentage of fly ash content in the mixture increased. This could be because the specific gravity of the fly ash was lower than the specific gravity of the original soil. The specific gravity decreased as the fly ash content increased.
- Based on the OMC and MDD values, the mixtures with 40% and 50% fly ash content both seemed to be acceptable in terms of providing maximum compaction. Therefore, the addition of Class F fly ash to clayey sand (A-7-5) improved the compaction properties of the soil.
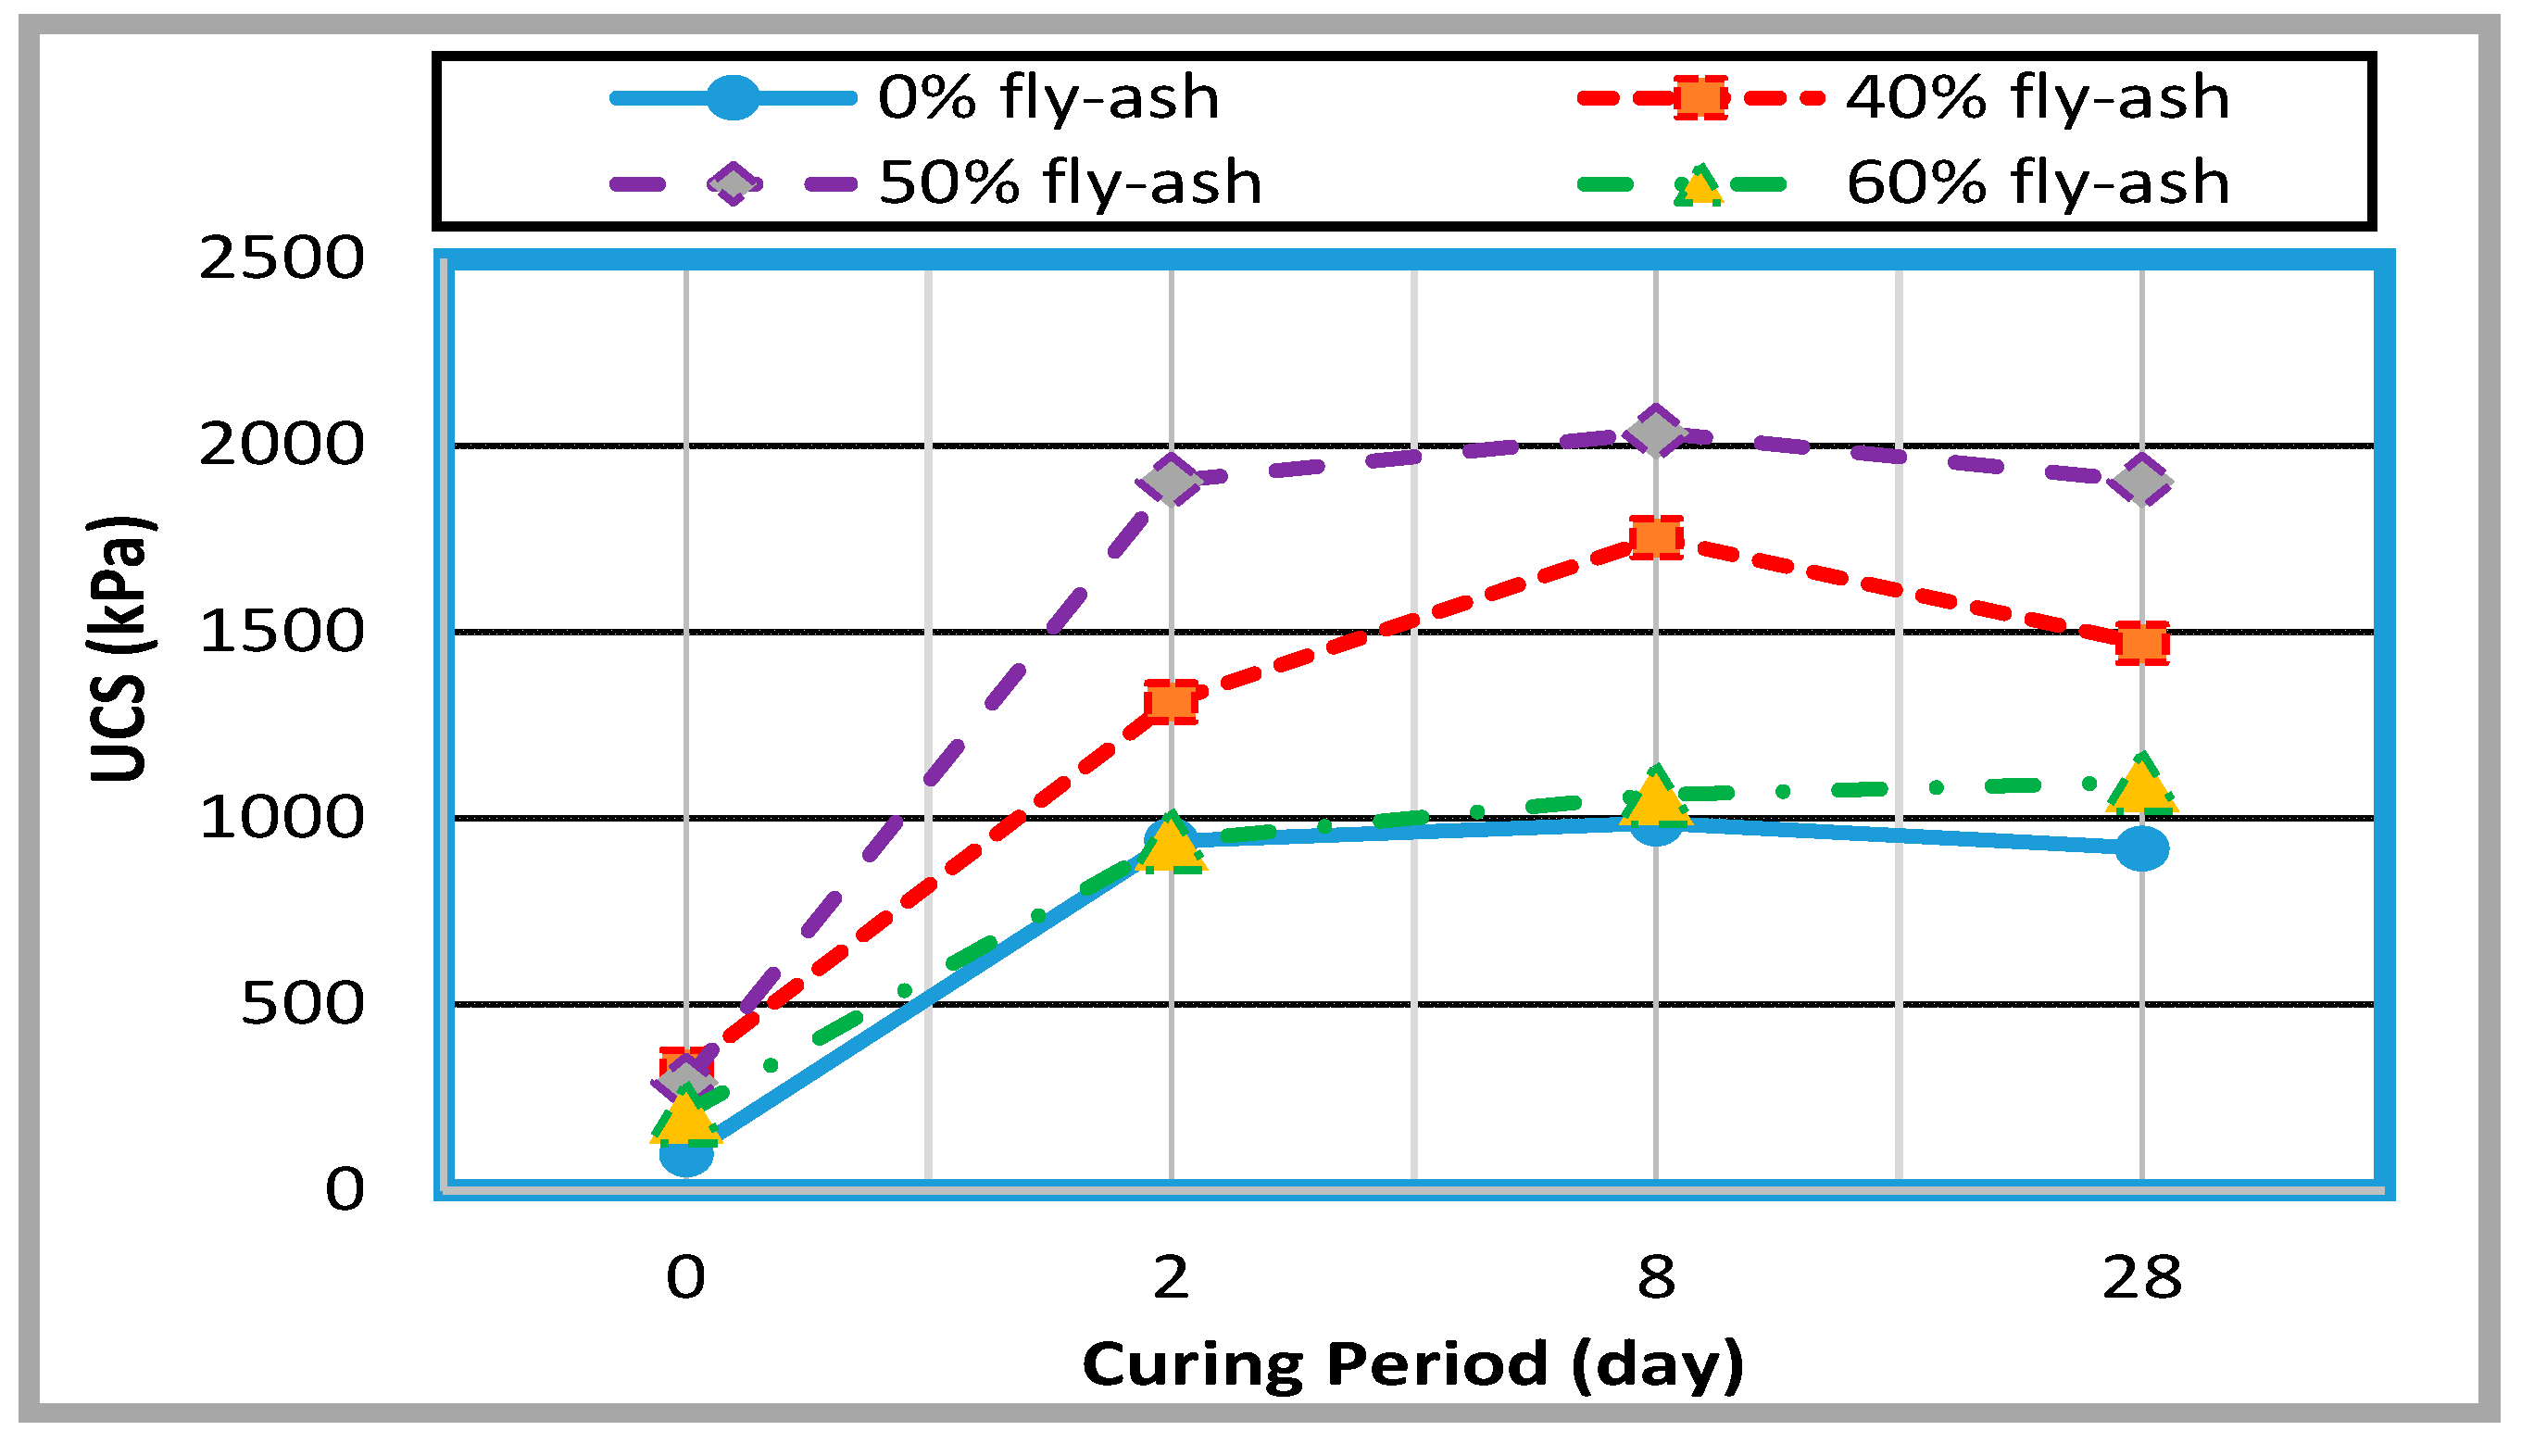
- Based on the UCS values, a mixture with 50% fly ash content seemed to be better in terms of providing strength as subgrade material for a curing period of 8 days. However, based on the trend analysis, the optimum fly ash content seemed to have a wide range of 32–46%, with an optimum curing period range of 16–19 days.
- In accordance with PI values, the mixture with 40% fly ash content seemed to be better in terms of compactability. It can be concluded from the experimental data that a mixture of soil with 50% fly ash content seemed to be an optimum and better option for subgrade material for a curing period of 8 days, however, a mixture with 40% fly ash content could be used as a viable alternative for the same curing period. This did not match with the findings from the trend analysis and might change with the future recommended study experimental data. Until the new data are available, this finding could be used.
- The volumetric swelling potential decreased with increased fly ash contents. Potentially, 32–50% fly ash can be used as a beneficial use that would otherwise go to landfill. Based on the Cc and Cs values, the soil–fly ash mixtures with 40% and 50% fly ash content both experience less settlement and volume change, ranging from 44% to 70%, compared to the original soil.
4.2. Recommendations for Future Studies
- To narrow the range of optimum fly ash contents and to determine a single fly ash content, several experiments can be conducted with 30%, 35%, 40%, 45%, 50%, 55%, and 60% fly ash (both type F and C) content for a curing period of 17 days or several other curing periods to confirm the results.
- The decrease in the UCS seems to be due to the changes in outside humidity, since the samples were kept in the lab and the indoor temperature and humidity are related to outdoor factors. Future studies can be performed to simulate outdoor conditions to eliminate this limitation.
- Future studies can use the resilient modulus (MR) to characterize and quantify the mechanical behavior of soil materials for pavement design purposes, as well as investigate the effects of seasonal moisture fluctuations, which ultimately affect both the load bearing capacity and the overall performance of the materials [14]. Future studies can also (a) formulate and develop an enhanced hyperbolic constitutive model (eHCM) for the estimation of MR based on small-strain modulus measurements from the free-free resonant column (FFRC) test, (b) estimate MR values using the eHCM model along with FFRC test measurements, (c) calibrate and validate the eHCM model using modulus measurements obtained through conventional MR testing, and (d) establish statistical correlations between eHCM model parameters and routinely measured soil properties [13].
Author Contributions
Funding
Acknowledgments
Conflicts of Interest
References
- ACAA—American Coal Ash Association. 2016 Production and Use Survey Results News Release. 2016. Available online: https://www.acaa-usa.org/Publications/ProductionUseReports.aspx (accessed on 28 May 2018).
- Mahvash, S.; López-Querol, S.; Bahadori-Jahromi, A. Effect of class F fly ash on fine sand compaction through soil stabilization. Heliyon 2017, 3, e00274. [Google Scholar] [CrossRef] [PubMed]
- Naik, T.R.; Singh, S.S.; Ramme, B. Effect of Source of Fly Ash on Abrasion Resistance of Concrete. J. Mater. Civ. Eng. 2002, 14, 417–426. [Google Scholar] [CrossRef]
- Yadav, A.K.; Gaurav, K.; Kishor, R.; Suman, S. Stabilization of alluvial soil for subgrade using rice husk ash, sugarcane bagasse ash and cow dung ash for rural roads. Int. J. Pavement Res. Technol. 2017, 10, 254–261. [Google Scholar] [CrossRef]
- White, D.J.; Harrington, D.S.; Thomas, Z. Fly Ash Soil Stabilization for Non-Uniform Subgrade Soil. Volume I: Engineering Properties and Construction Guidelines. 2005. Available online: https://trid.trb.org/view/755950 (accessed on 9 October 2020).
- Phanikumar, B.; Sharma, R.S. Volume Change Behavior of Fly Ash-Stabilized Clays. J. Mater. Civ. Eng. 2007, 19, 67–74. [Google Scholar] [CrossRef]
- Ozdemir, M.A. Improvement in Bearing Capacity of a Soft Soil by Addition of Fly Ash. Procedia Eng. 2016, 143, 498–505. [Google Scholar] [CrossRef]
- Nath, B.D.; Molla, K.A.; Sarkar, G. Study on Strength Behavior of Organic Soil Stabilized with Fly Ash. Int. Sch. Res. Not. 2017, 2017, 1–6. [Google Scholar] [CrossRef] [PubMed]
- Mahesh, K.G.; Satish, T.B. Effect of fly ash on Properties of Expansive soil. Int. J. Sci. Eng. Res. 2013, 4, 37–40. [Google Scholar]
- Georgia Power’s Plant Bowen Environmental Management System. Available online: http://www.georgiapower.com/company/research-conservation-and-stewardship/management-closures/plant-list/plant-bowen.html (accessed on 9 October 2020).
- Hemalatha, T.; Ramaswamy, A. A review on fly ash characteristics—Towards promoting high volume utilization in developing sustainable concrete. J. Clean. Prod. 2017, 147, 546–559. [Google Scholar] [CrossRef]
- Hassan, A.S. Unitization of High Percentage of Fly-ash in Silty Soil to Enhance the Engineering Properties for Subgrade Use. Master’s Thesis, Kennesaw State University, Marietta, GA, USA, 30 April 2018. [Google Scholar]
- Walubita, L.F.; Mercado, V.; Lee, S.I.; Fuentes, L.; Villegas, J.M. Exploration of a mechanistic model for the quantification of the resilient modulus using free-free resonant column testing. Road Mater. Pavement Des. 2020, 1–15. [Google Scholar] [CrossRef]
- Teshale, E.Z.; Shongtao, D.; Walubita, L.F. Evaluation of Unbound Aggregate Base Layers using Moisture Monitoring Data. Transp. Res. Rec. J. Transp. Res. Board 2019, 2673, 399–409. [Google Scholar] [CrossRef]
- Javed, S. Prediction of Compression and Recompression Indices of Texas Over Consolidated Clays. Available online: http://www.foundationperformance.org/pastpresentations/javedpresentation-12oct05.pdf (accessed on 28 May 2018).
- Bhuvaneshwari, S.; Robinson, R.G.; Gandhi, S.R. Stabilization of Expansive Soils using Flyash. Available online: https://www.researchgate.net/publication/265120272 (accessed on 9 October 2020).
- Spiess, A.-N.; Neumeyer, N. An evaluation of R2 as an inadequate measure for nonlinear models in pharmacological and biochemical research: A Monte Carlo approach. BMC Pharmacol. 2010, 10, 6. [Google Scholar] [CrossRef]
- Das, B.M. Principle of Geotechnical Engineering, 5th ed.; Nelson: Toronto, ON, Canada, 2002. [Google Scholar]
- Seed, H.B.; Woodward, J.; Lundgren, R. Prediction of Swelling Potential for Compacted Clays. J. Soil Mech. Found Div. 1962, 88, 53–87. [Google Scholar]
- Mitchell, J.K. Fundamentals of Soil Behavior; John Wiley & Sons, Inc.: Hoboken, NJ, USA, 1993. [Google Scholar]




| Element | Oxide | Concentration (%) | |
|---|---|---|---|
| Class C | Class F | ||
| Calcium (Ca) | CaO | 15.1–54.8 | 0.50–14.0 |
| Silicon (Si) | SiO2 | 11.8–46.4 | 37.0–62.1 |
| Aluminum (Al) | Al2O3 | 2.6–20.5 | 16.6–35.6 |
| Iron (Fe) | Fe2O3 | 1.4–15.6 | 2.6–21.2 |
| Magnesium (Mg) | MgO | 0.1–6.7 | 0.3–5.2 |
| Potassium (K) | K2O | 0.3–9.3 | 0.1–4.1 |
| Sodium (Na) | Na2O | 0.2–2.8 | 0.1–3.6 |
| Sulfur (S) | SO3 | 1.4–12.9 | 0.02–4.7 |
| Phosphorus (P) | P2O5 | 0.2–0.4 | 0.1–1.7 |
| Carbon (C) | TiO2 | 0.6–1.0 | 0.5–2.6 |
| Manganese (Mn) | MnO | 0.03–0.2 | 0.03–0.1 |
| Properties | 0% Fly Ash | 40% Fly Ash | 50% Fly Ash | 60% Fly Ash |
|---|---|---|---|---|
| OMC 1 (%) | 20.5 | 15.5 | 16.5 | 15.0 |
| MDD 2 (kg/m3) | 1648.3 | 1822.9 | 1770.0 | 1754.0 |
| Fly Ash Content | Fitted Polynomial Equation (y = f(x)) | dy/dx = 0 | d2y/dx2 | R2 | RMSE | MAE | x = Optimum Curing Period (day) | y = Max UCS (kPa) |
|---|---|---|---|---|---|---|---|---|
| 0% | As shown in Figure 7 | −7.4432x + 142.33 = 0 | −7.4432 | 0.6256 | 712.33 | 627.80 | 19 | 1707 |
| 40% | As shown in Figure 7 | −13.0382x + 214.6 = 0 | −13.0382 | 0.8374 | 1140.17 | 1037.47 | 16 | 2329 |
| 50% | As shown in Figure 7 | −14.630x + 245.02 = 0 | −14.6300 | 0.6453 | 1464.32 | 1310.12 | 17 | 2815 |
| 60% | As shown in Figure 7 | −6.893x + 120.67 = 0 | −6.8930 | 0.7330 | 776.89 | 705.90 | 18 | 1470 |
| Curing Period | Fitted Polynomial Equation (y = f(x)) | dy/dx = 0 | d2y/dx2 | R2 | RMSE | MAE | x = Optimum Fly Ash Content (%) | y = Max UCS (kPa) |
|---|---|---|---|---|---|---|---|---|
| 0 day | As shown in Figure 9 | −0.3878x + 13.496 = 0 | −0.3878 | 0.9995 | 209.80 | 195.96 | 35 | 331 |
| 2 days | As shown in Figure 9 | −1.3532x + 44.167 = 0 | −1.3532 | 0.4500 | 1262.18 | 1206.72 | 33 | 1639 |
| 8 days | As shown in Figure 9 | −2.097x + 66.802 = 0 | −2.097 | 0.7682 | 1308.69 | 1246.79 | 32 | 2036 |
| 28 days | As shown in Figure 9 | −1.4068x + 47.954 = 0 | −1.4068 | 0.6415 | 1201.19 | 1150.92 | 46 | 1623 |
© 2020 by the authors. Licensee MDPI, Basel, Switzerland. This article is an open access article distributed under the terms and conditions of the Creative Commons Attribution (CC BY) license (http://creativecommons.org/licenses/by/4.0/).
Share and Cite
Karim, M.A.; Sami Hassan, A.; Kaplan, A. Optimization of Soil to Fly-Ash Mix Ratio for Enhanced Engineering Properties of Clayey Sand for Subgrade Use. Appl. Sci. 2020, 10, 7038. https://doi.org/10.3390/app10207038
Karim MA, Sami Hassan A, Kaplan A. Optimization of Soil to Fly-Ash Mix Ratio for Enhanced Engineering Properties of Clayey Sand for Subgrade Use. Applied Sciences. 2020; 10(20):7038. https://doi.org/10.3390/app10207038
Chicago/Turabian StyleKarim, M. A., Ahmed Sami Hassan, and Adam Kaplan. 2020. "Optimization of Soil to Fly-Ash Mix Ratio for Enhanced Engineering Properties of Clayey Sand for Subgrade Use" Applied Sciences 10, no. 20: 7038. https://doi.org/10.3390/app10207038
APA StyleKarim, M. A., Sami Hassan, A., & Kaplan, A. (2020). Optimization of Soil to Fly-Ash Mix Ratio for Enhanced Engineering Properties of Clayey Sand for Subgrade Use. Applied Sciences, 10(20), 7038. https://doi.org/10.3390/app10207038


