1. Introduction
The trend of global production is based increasingly on ensuring high flexibility of production systems, which must be adapted to the needs of customers and the market demands. Rapid, dynamic market changes, where quantities and order types fluctuate rapidly, present challenges to the design of production systems in order to keep pace with global competition. Tracking market demand is necessary to keep up to date, which requires the analysis of a huge amount of data, where it is necessary to exclude parameters that may influence the justification of our production. The use of visual computing methods and data-driven simulation models has already been well studied. In the time of Industry 4.0, a multitude of new applications of these methods are emerging, which can be used to analyze individual groups of manufacturing or service companies in detail. The presented manuscript focuses on the solution of the problem of adapting the manufacturing system to the customer’s needs from the point of manufacturing capacities and cost efficiency of the manufacturing process. The use of visual data processing methods to collect data from a real-world manufacturing system and the direct transfer into a data-driven simulation model allow for a detailed cost–time analysis of the manufacturing system justification. The research work deals with the use of data obtained by the method of visual computing for the purpose of ergonomic analysis of workplaces. In relation to existing solutions and the literature, in which workplace evaluation can be found as a secondary contribution, the presented manuscript primary focuses on the use of visual computing methods and data-driven simulation modeling for the purpose of comprehensive workplace assessment as the state-of-the-art scientific contribution.
The trend toward the use of visual computing methods is increasing in Industry 4.0, as the industrial internet enables a fast and efficient use of visual computing methods’ results [
1]. Researchers use the method as a support mechanism for the design of a manufacturing system [
2] in conjunction with different types of manufacturing systems from job-shop production [
3] to mass production systems [
4]. In view of the wide range of visual data processing method applications and more accessible and powerful hardware and software, it is possible to find a wide applicability in various technological solutions within the manufacturing system [
5] for capture and reconstruct structured three dimensional models [
6]. However, data acquisition and processing without application and transfer to the real-world environment does not contribute to the sustainable viability of manufacturing systems [
7]. The use of data-driven simulation modeling methods enables the transfer and use of data obtained by visual computing to the real-world environment [
8]. Data-driven simulation models enable the optimization of dynamically changing manufacturing systems with regard to appropriate scheduling [
9] and decision logic [
10], making production systems with a high-mix and low-volume production more competitive in the global market [
11]. Data-driven simulation models tend to use data that change in real-time [
12]. The data are transferred directly from the manufacturing system to the simulation model via a unified data information system, and adjustments are made in the manufacturing system via a feedback loop [
13]. In the presented research, the three-dimensional workplace model created with the spherical camera Samsung Gear 360 (
https://www.samsung.com/global/galaxy/gear-360/) was imported to the ergonomics software Siemens Tecnomatix Jack (
https://www.plm.automation.siemens.com/global/en/). Jack is a complete system for generating 3D environments and interacting with them in a powerful graphical environment. It is based on a detailed link segment model with biologically accurate motion prediction and joint kinematics. Using ergonomics software, we can design a real-time environment with interactive viewing, multiple windows, lights, cameras, textures, and mirrors. The collected data can be used to make diagnoses and forecasts [
14], which allow detailed tracking of market demand [
15] and ensure supply chain efficiency [
16,
17]. The integration of different aspects of manufacturing processes with due consideration of external influences is reflected in the adequacy of the manufacturing system from the support architecture [
18], workplace design [
19], internal logistics [
20] and the importance of a detailed analysis of the impact of collaborative workplaces on the existing situation in manufacturing processes [
21].
The presented innovative approach of using a financially accessible spherical camera to collect data from a real-world manufacturing system, to transfer that data into a data-driven simulation model, and to perform detailed simulation studies of the optimization possibilities of the production capacity, cost-time efficiency, and ergonomic analysis is unique in the research sphere. With the method presented and the results obtained, we demonstrate the ability to hybridize different research methods and approaches in order to achieve more efficient, safer, and more sustainable production systems, which are becoming increasingly important in the time of Industry 4.0.
2. Problem Description
The research problem deals with the analysis of the manual assembly and automated control workplace, where the worker assembles the semi-finished products to the final product. The current work process has two such workplaces, including two workers per eight shifts. The assembled product is tested in an automated control station to ensure the suitability of the manual assembly activities. The automated testing process has a constant process time, and the problem arises in manual assembly, where this process time of assembly varies according to the worker’s skills, shift period, and degree of assembly irregularities, which introduce variables into the manufacturing system that need to be studied. Depending on the needs of global customers, the company wants to supply a larger annual volume of manufactured products, but there is a problem in providing production capacity of the current manufacturing process and the possible introduction of additional production capacity.
Table 1 presents current and desired assembly workplace characteristics. The current workplace characteristics are provided by the company, and the assembled product per shift represents the average value of the finished products. The process time of the assembly operation was defined using the proposed visual computing approach, using spherical camera and a video recording of the existing manufacturing process. The costs of the assembly workplace are defined on the sum of the gross hourly wage of a worker of €14.79/h and the operating costs of the test station machine of €3.012/h. The cost calculation of the test station is shown in
Section 3.2. Reassembly operation described in percent describes products that have been assembled multiple mistakes per products can be made. Mistakes are mainly made by workers and are not related to the input material. A detailed investigation of the workplace with visual computing methods and the performance of a simulation modeling study will allow the evaluation of newly proposed methods to solve the presented research problem.
2.1. Visual Computing
The visualization in manufacturing systems is done mostly with two-dimensional models and simplified three-dimensional representations. Visual computing methods represent a wide field of acquisition, analysis, and synthesis of visual acquisition data, with the help of computers equipped with suitable hardware and software tools [
1]. The main advantage of using visual data processing methods is that different experts within the group managing the manufacturing process can understand and use the results of the collected data [
2].
The presented research proposes the use of economically accessible commercially used spherical cameras to capture real-world-object three-dimensional characteristics in the manufacturing system. The hardware ensures easy handling, time-efficient preparation and acquisition of the equipment, satisfactory accuracy and a high degree of application possibilities. From the captured three-dimensional object, data of the point cloud representing the evaluated object can be obtained, and realistic data describing the time and value criteria of the manufacturing system can be obtained on the basis of the captured video. Based on the captured data, we can adjust, modify, and evaluate the system in detail, and the captured data can be hybridized with the help of other tools that ensure high usability of the presented method [
5]. The data acquisition with a spherical camera is performed with the proposed three-step approach.
Preparation of a scanned object, which includes the layout of all components of the workplace and the associated subassemblies. Adequate fixed installation of a spherical camera with respect to the angle of data acquisition and the illumination of the object requires detailed considerations, since improper placement can significantly affect the quality of the acquired data [
22].
When scanning the object using a spherical camera, we can use multiple static images or video to capture the data. Capturing an object using static images allows us to create a data point cloud, and video allows us to evaluate the changing parameters of the observed object further in relation to dynamics changing inside the manufacturing system.
Processing the captured data in the primary phase includes filtering unnecessary components of the static image capture and selecting data in video files.
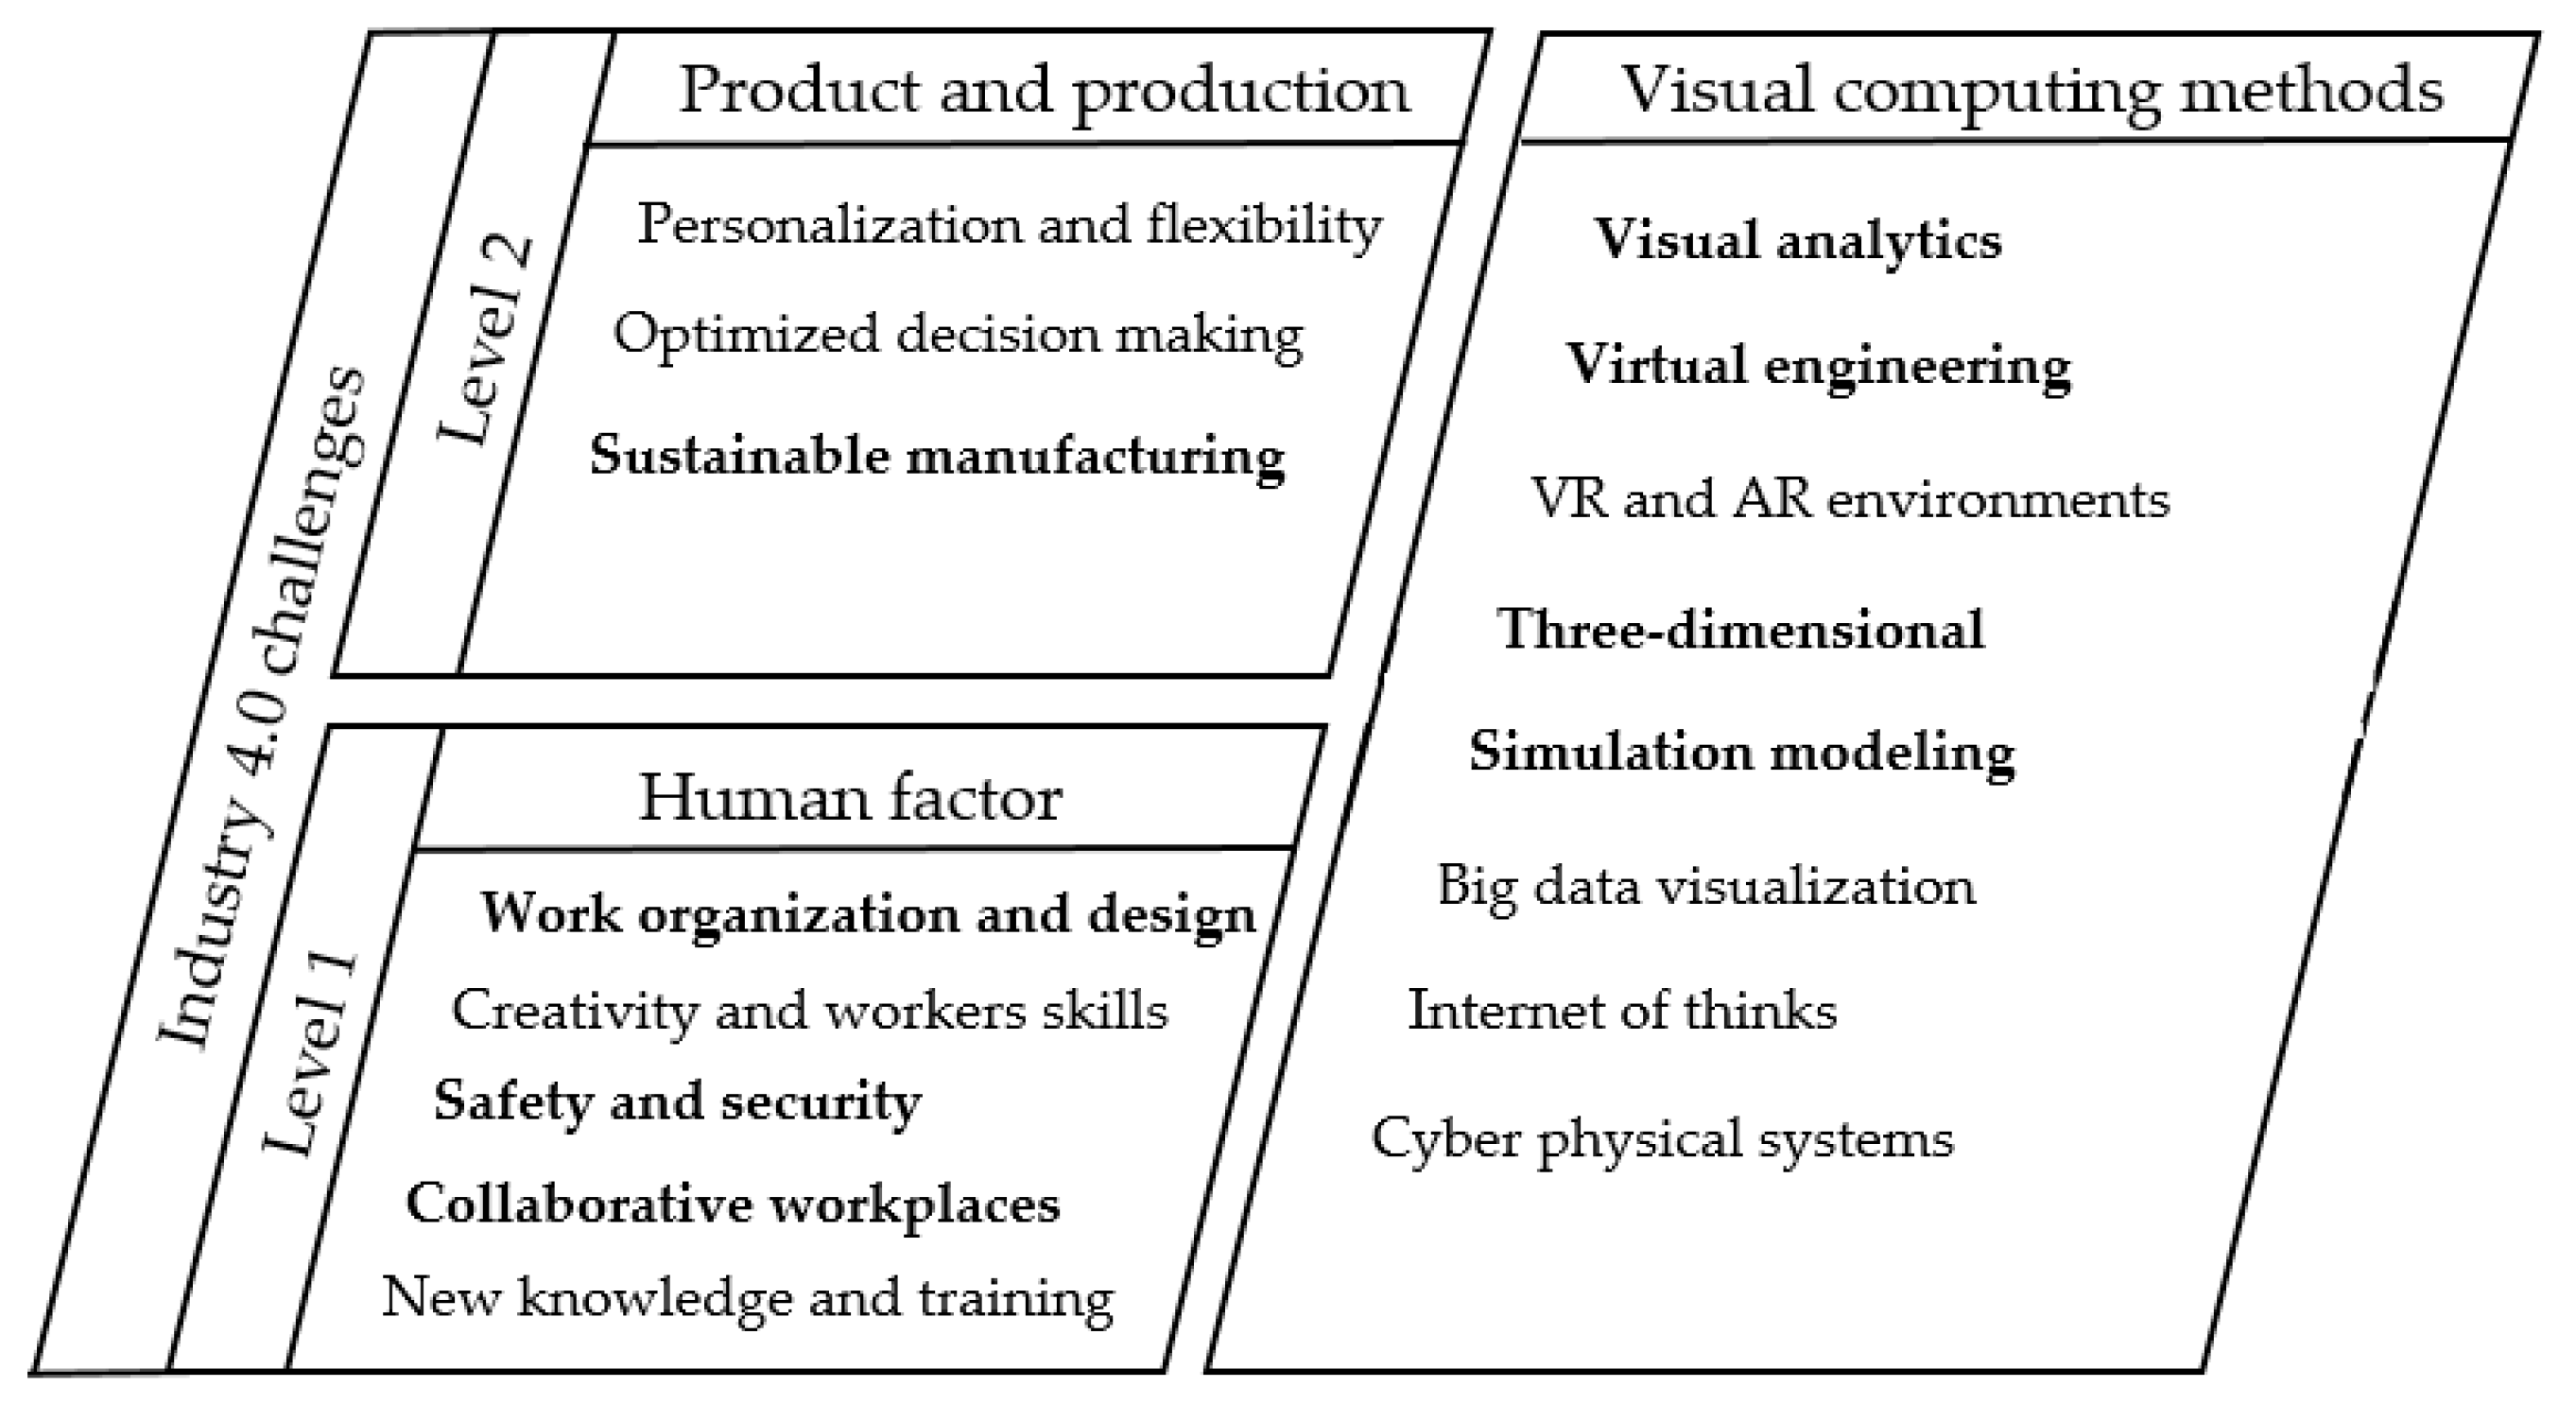
Figure 1 shows the proposed two-level architecture model, which highlights two aspects in the context of Industry 4.0: the human factor and the product factor in relation to production. Visual computing methods are becoming increasingly important in the study of the human factor, especially when it comes to collaborative workplace design from a security perspective. The effects of a correct workplace organization and an ergonomic analysis of the workplace environment allow for sustainable efficiency and long-term success of the work process, based on the appropriate level of knowledge and skills of the employees. The competitiveness of small and medium-sized enterprises depends, in most cases, on the ability to adapt to customer needs. High order dynamics and the rapid development of new personalized products require a high degree of flexibility of the production system. Visual computing methods allow for detailed analyses to be carried out, which, if evaluated appropriately, contribute to a higher degree of manufacturing systems’ optimization. The bold marked text in
Figure 1 presents the Industry 4.0 challenges addressed in the presented work.
2.2. Data-Driven Simulation Modeling
Simulation methods, such as discrete systems simulations [
23], system dynamics, and agent-based simulations, have their main advantage in evaluation efficiency of highly flexible manufacturing systems, where they have to continuously adapt and evaluate real-world systems (preferably in real time) by accessing data bases, documents, spreadsheets, and a central data information service [
8]. Such simulation methods reflect the complex decision logics of the interdependence of different model units. Data-driven simulation modeling is defined as a method that enables the user to design and use simulation modeling without detailed knowledge of program codes. The advantage of data-driven simulation models is the simplicity and transparency of the design and use of the simulation model [
9]. The user is not necessarily a research specialist but rather an operator who adjusts, controls, and evaluates the simulation model using simulation scenarios. Data-driven simulation models are built in four consecutive steps.
Preparation of data obtained directly from the evaluated system. The data must be relevant, identified, and classified according to the described problem. Information modeling is used to describe the complex interdependencies of the data objects and the connection to the modeled system. Commercial application platforms enable relational or object-oriented data modeling. Relational data modeling with specific syntax allows the construction of an information schema for data transfer and usage. Object-oriented modeling allows objects and entities to be reused in a hierarchical order that allows multiple intersections with each other. Input data can be collected using various approaches, usually using advanced communication protocols via a central data information service. In the present manuscript, the acquisition of input data of a simulation model is performed using visual computing methods and hardware represented by a spherical camera. Input data from the spherical camera defines three-dimensional model of the workplace and operational parameters of the manufacturing system. The acquisition and processing of the input data play a key role for the relevance and significance of the following three modeling steps.
Design of a simulation model that defines the specificity of the modeled object and ensures the identity of the model with relation to real-world modeled objects. The most commonly used integrated logic of a commercial environment is extended by a specially designed program code that allows a detailed description of a real-world system’s characteristics. In addition to static data, the simulation model also uses dynamic data, which influence the continuous change of the model in the process of implementation and testing different simulation scenarios. In the present manuscript, the simulation model design was made using data captured by the spherical camera.
The verification of the simulation model is crucial to achieve credible simulation results. Verification is a process in which the adequacy of a computer-controlled simulation model is verified with data obtained from a real-world modeled system. Conceptual simulation scenarios, where the results describe new derivatives of the modeled object, must be evaluated with parallels to the basic reference data set. In presented manuscript one referential simulation scenario was used and two additional optimization scenarios, describing current manufacturing system state and new solutions proposals.
Simulation of scenarios that enter variable data into the object model dynamically and describe the situation in the existing real-world object or newly proposed solutions of existing parameters. Simulation scenarios represent the final step in the configuration of a data-driven simulation model that is closely related to events happening in the real-world system.
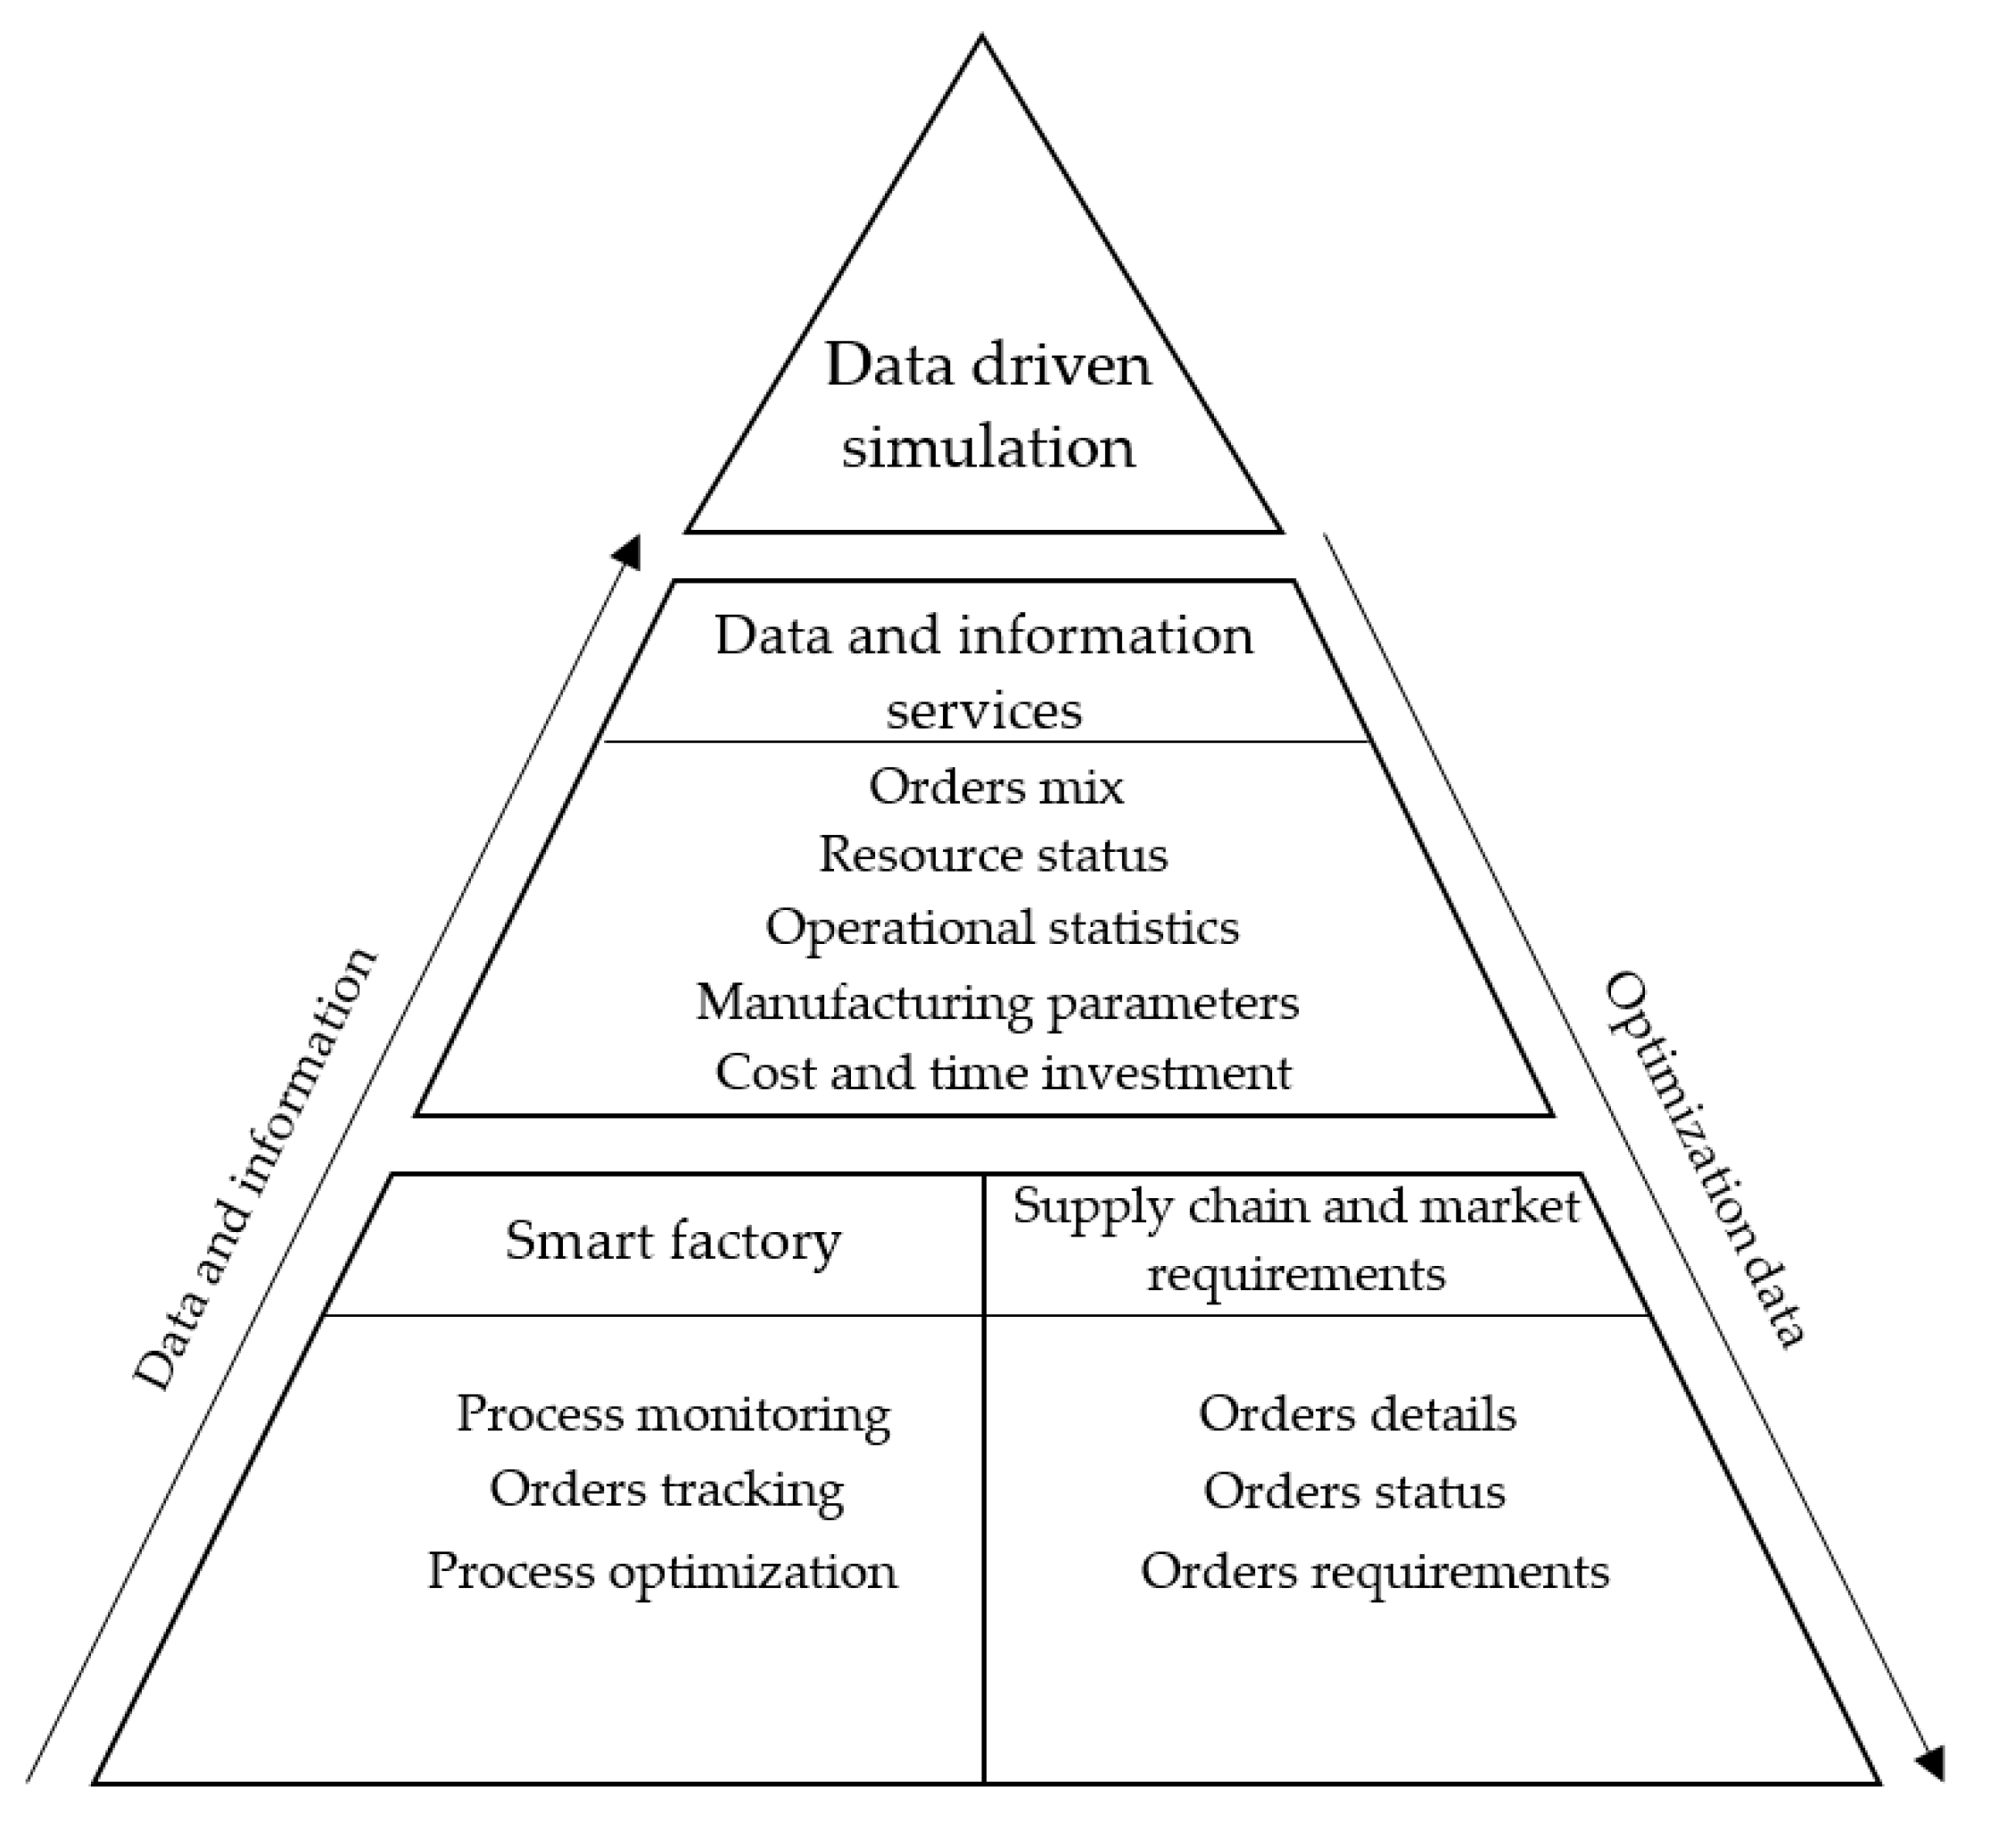
Figure 2 shows the proposed architectural model of the data-driven simulation model in combination with the visual computing methods used in the presented research. In the first phase, the data describing the manufacturing system are supplemented by data representing the supply chain and market requirements. These data form the basis for the construction of a flexible data-driven simulation model via the central data information service. The transfer of the data from the introduction phase to the built-up simulation model enables the optimization of the entire production system in the implementation of the simulation results, which guarantees a sustainable justification of the evaluated manufacturing system.
3. Methods
The methods for solving the research problem of workplace evaluation and optimization are further subdivided into three main areas (cost, productivity, and ergonomics), which deal with the optimization problem in a comprehensive way. Since we want to investigate the ability to increase the number of finished products in a shift and achieve a higher annual quantity of finished quality products, the visual computing method was used to study the terminology and values of manual assembly and automatic testing operations within the real-world manufacturing system. Depending on the location of two manual assembly and two automated testing stations, which produce 1250 pieces/shift in the reference state, with the aim of increasing the manufacturing capacity to 1680 pieces/shift or 1,330,000 pieces/year, the method of simulation modeling and the approach of optimization solutions evaluation are used with simulation scenarios. Reference simulation scenarios represent a current stat simulation model of the manufacturing system where two workers perform a manual assembly operation. The adequacy of the manual assembly process is tested on two automated testing stations. Given the manufacturing characteristics, 8% of manual assembly parts do not meet the minimum standards of an automated testing station, so the simulation model takes into account the re-execution of manual disassembly, reassembly and the new test cycle. Considering that the manufacturing goal is to increase the number of finished products by 34.4%, the second simulation scenarios consider increasing the number of assembly stations with additional workers and additional test operations. Due to the increase of Industry 4.0 concept implementation, the option of introducing a collaborative workplace in a manufacturing system where a collaborative robot assembles products and two test operations test them is evaluated in the third simulation scenario. The robot’s service is provided by a worker who spends about one-third of the working time on the service of one collaborative workplace. The service of the robot includes loading the components into the input buffer of the robot, removing the finished products from the robot’s workstation and checking the correct operation of the robot. The analysis of the time and value investment of a collaborative workplace is not directed to the employee. An ergonomic analysis was also carried out to improve workplace design efficiency. The performance of the ergonomic analysis is related to the use of a workstation model created using the visual computing methods presented in
Section 3.1 and
Section 3.3.
3.1. Visual Computing
The method of visual computing was carried out with the aim of building a three-dimensional model of the workplace. In the described research problem, only the three-dimensional model was not sufficient, and it was also necessary to analyze the workplace regarding the real-world manufacturing process operations’ processing times (recording the normative assembly time deviations) and the realistic number of finished products. The hardware used was a spherical Samsung Gear 360 camera mounted on the workstation, where it was used for three-dimensional model capturing of the workstation, and for continuous recording of the workstation manufacturing characteristics in three shifts in one working week (the individual worker was under the evaluation for one shift of eight hours).
Figure 3 shows a real-world manufacturing workplace with manual product assembly and automated testing operations. During assembly, the worker always has access to individual components and the necessary tools. The workstation, with one worker, shown represents only half of the entire manual assembly process, as this workstation is mirrored on the
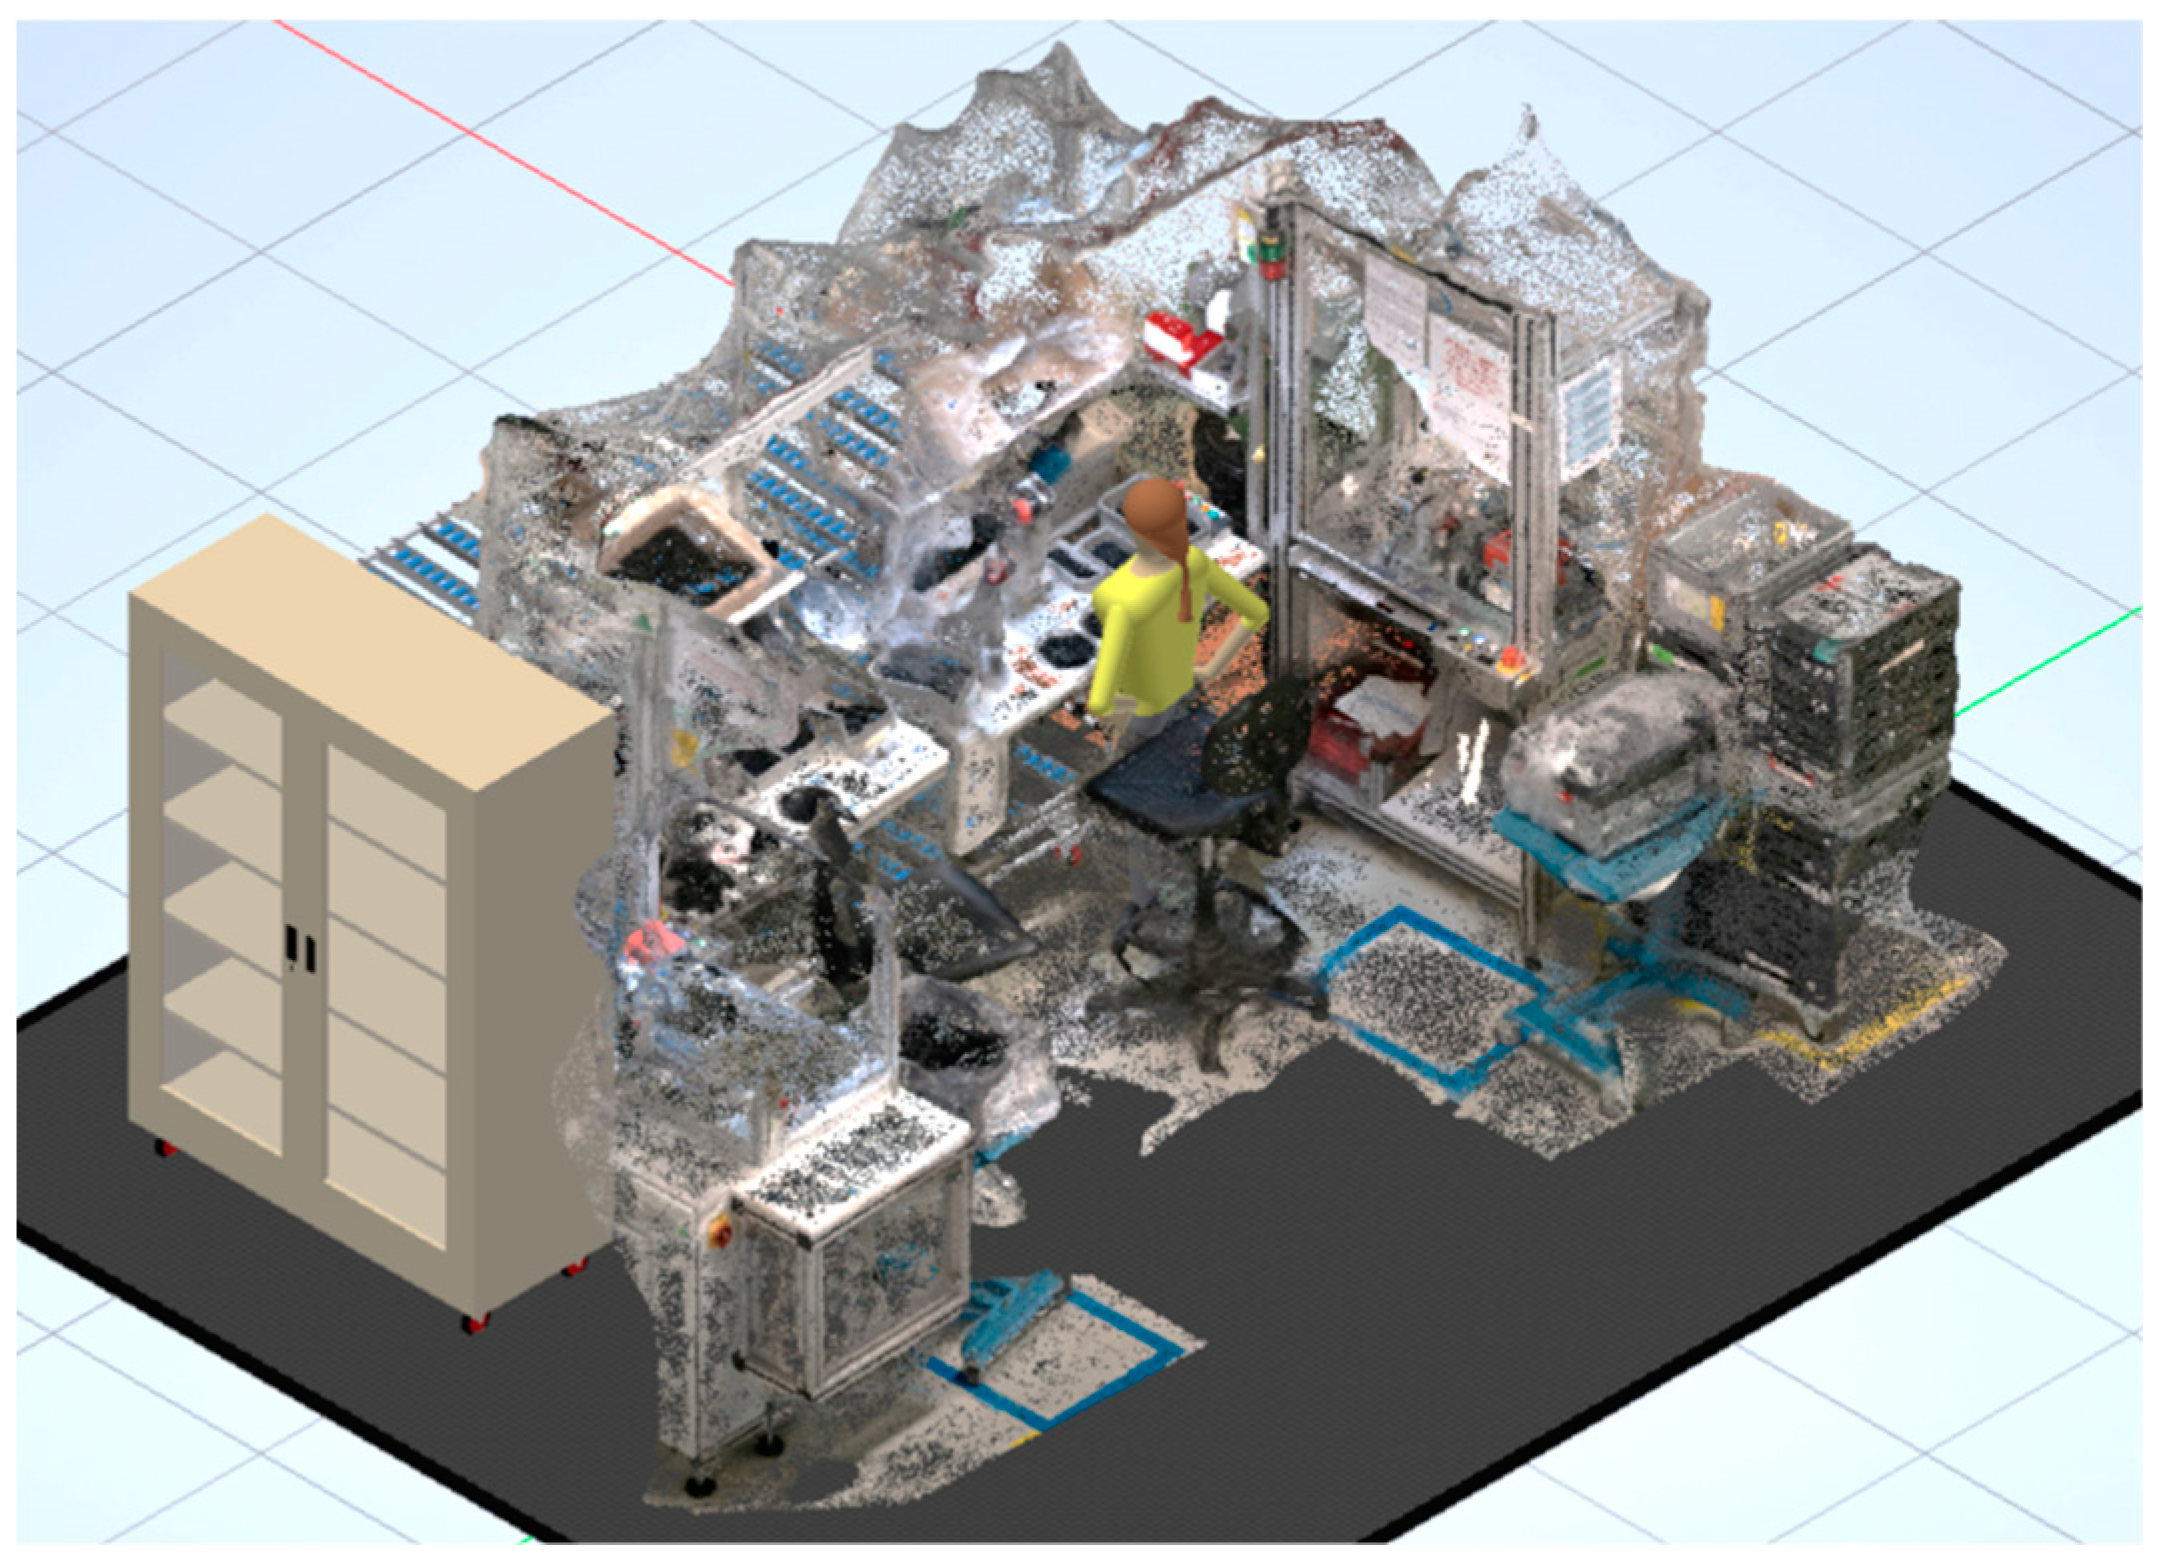
y-axis, where the work is performed by another worker. Workers in the manual assembly workplace are adequately educated by the employer’s internal training. No formal education prior knowledge is required. An investigation is presented of the appropriateness of workplace mirroring in relation to the ergonomic efficiency of the workplace. The presented visual computing method of recording a workplace with spherical camera lists two areas as results. The first area deals with the acquisition of a three-dimensional workplace model and the transfer of real-world dimensions into a simulation environment, shown in
Figure 4. The second area deals with the manual evaluation of the recorded workplace parameters. In this case, presented approach does not deal with computer-aided evaluation and automatic parameter acquisition, but with manual monitoring, time standardization and detailed evaluation of the manual assembly operation of a real-world manufacturing system.
The workplace capture, which was performed with a low-cost spherical camera, was initially computed visually with Autodesk ReCap software, which allows the creation of a captured object point cloud, including the
x,
y and
z positions. Given the literature [
24] and the characteristics of the research problem, the accuracy of the point cloud capture is satisfactory. When comparing the real-world dimensions and the generated point cloud data, the deviation range was approximately 2 mm. In the case of a need for very accurate data, the low-cost spherical camera may not achieve the desired results. Based on the point cloud data, a mash structure was generated in Agisoft Metashape [
25], on which the build texture was stretched, and together, they formed a three-dimensional model as shown in
Figure 4. The workplace visually computed model shown in
Figure 4 also contains data that was captured during the three shifts, a one work week assembly video recording process. During the continuous recording of the workplace and the operations’ execution, the employees were aware of this and agreed to it. According to the average values of the operations’ evaluation, it was found that the processing time of manual assembly operation is 30 s, and the processing time of the automated testing stage is 25.5 s. Based on the numerical values obtained by visual computing analysis, we can assume that the manual assembly operation is a bottleneck in the manufacturing process. The analysis of the additional video validation confirmed the initial problem of 8% of the insufficient quality of assembled products is present in manual assembly operations. This numerical result also relates to reducing the final number of properly manufactured products.
3.2. Simulation Modeling
Captured data from visual computing methods and real-world data provided by the company form the basis for building a simulation model. Real-world data provided by the company were primarily used in a reference simulation scenario; these data were numerically determined when designing the workplace within the company. The data describe the process time of manual assembly, the process time of the automated test phase and the desired quantity of manufactured products. The simulation model is designed in the software environment Simio (
https://www.simio.com), which enables the development, experimentation, and evaluation of data-driven simulation models.
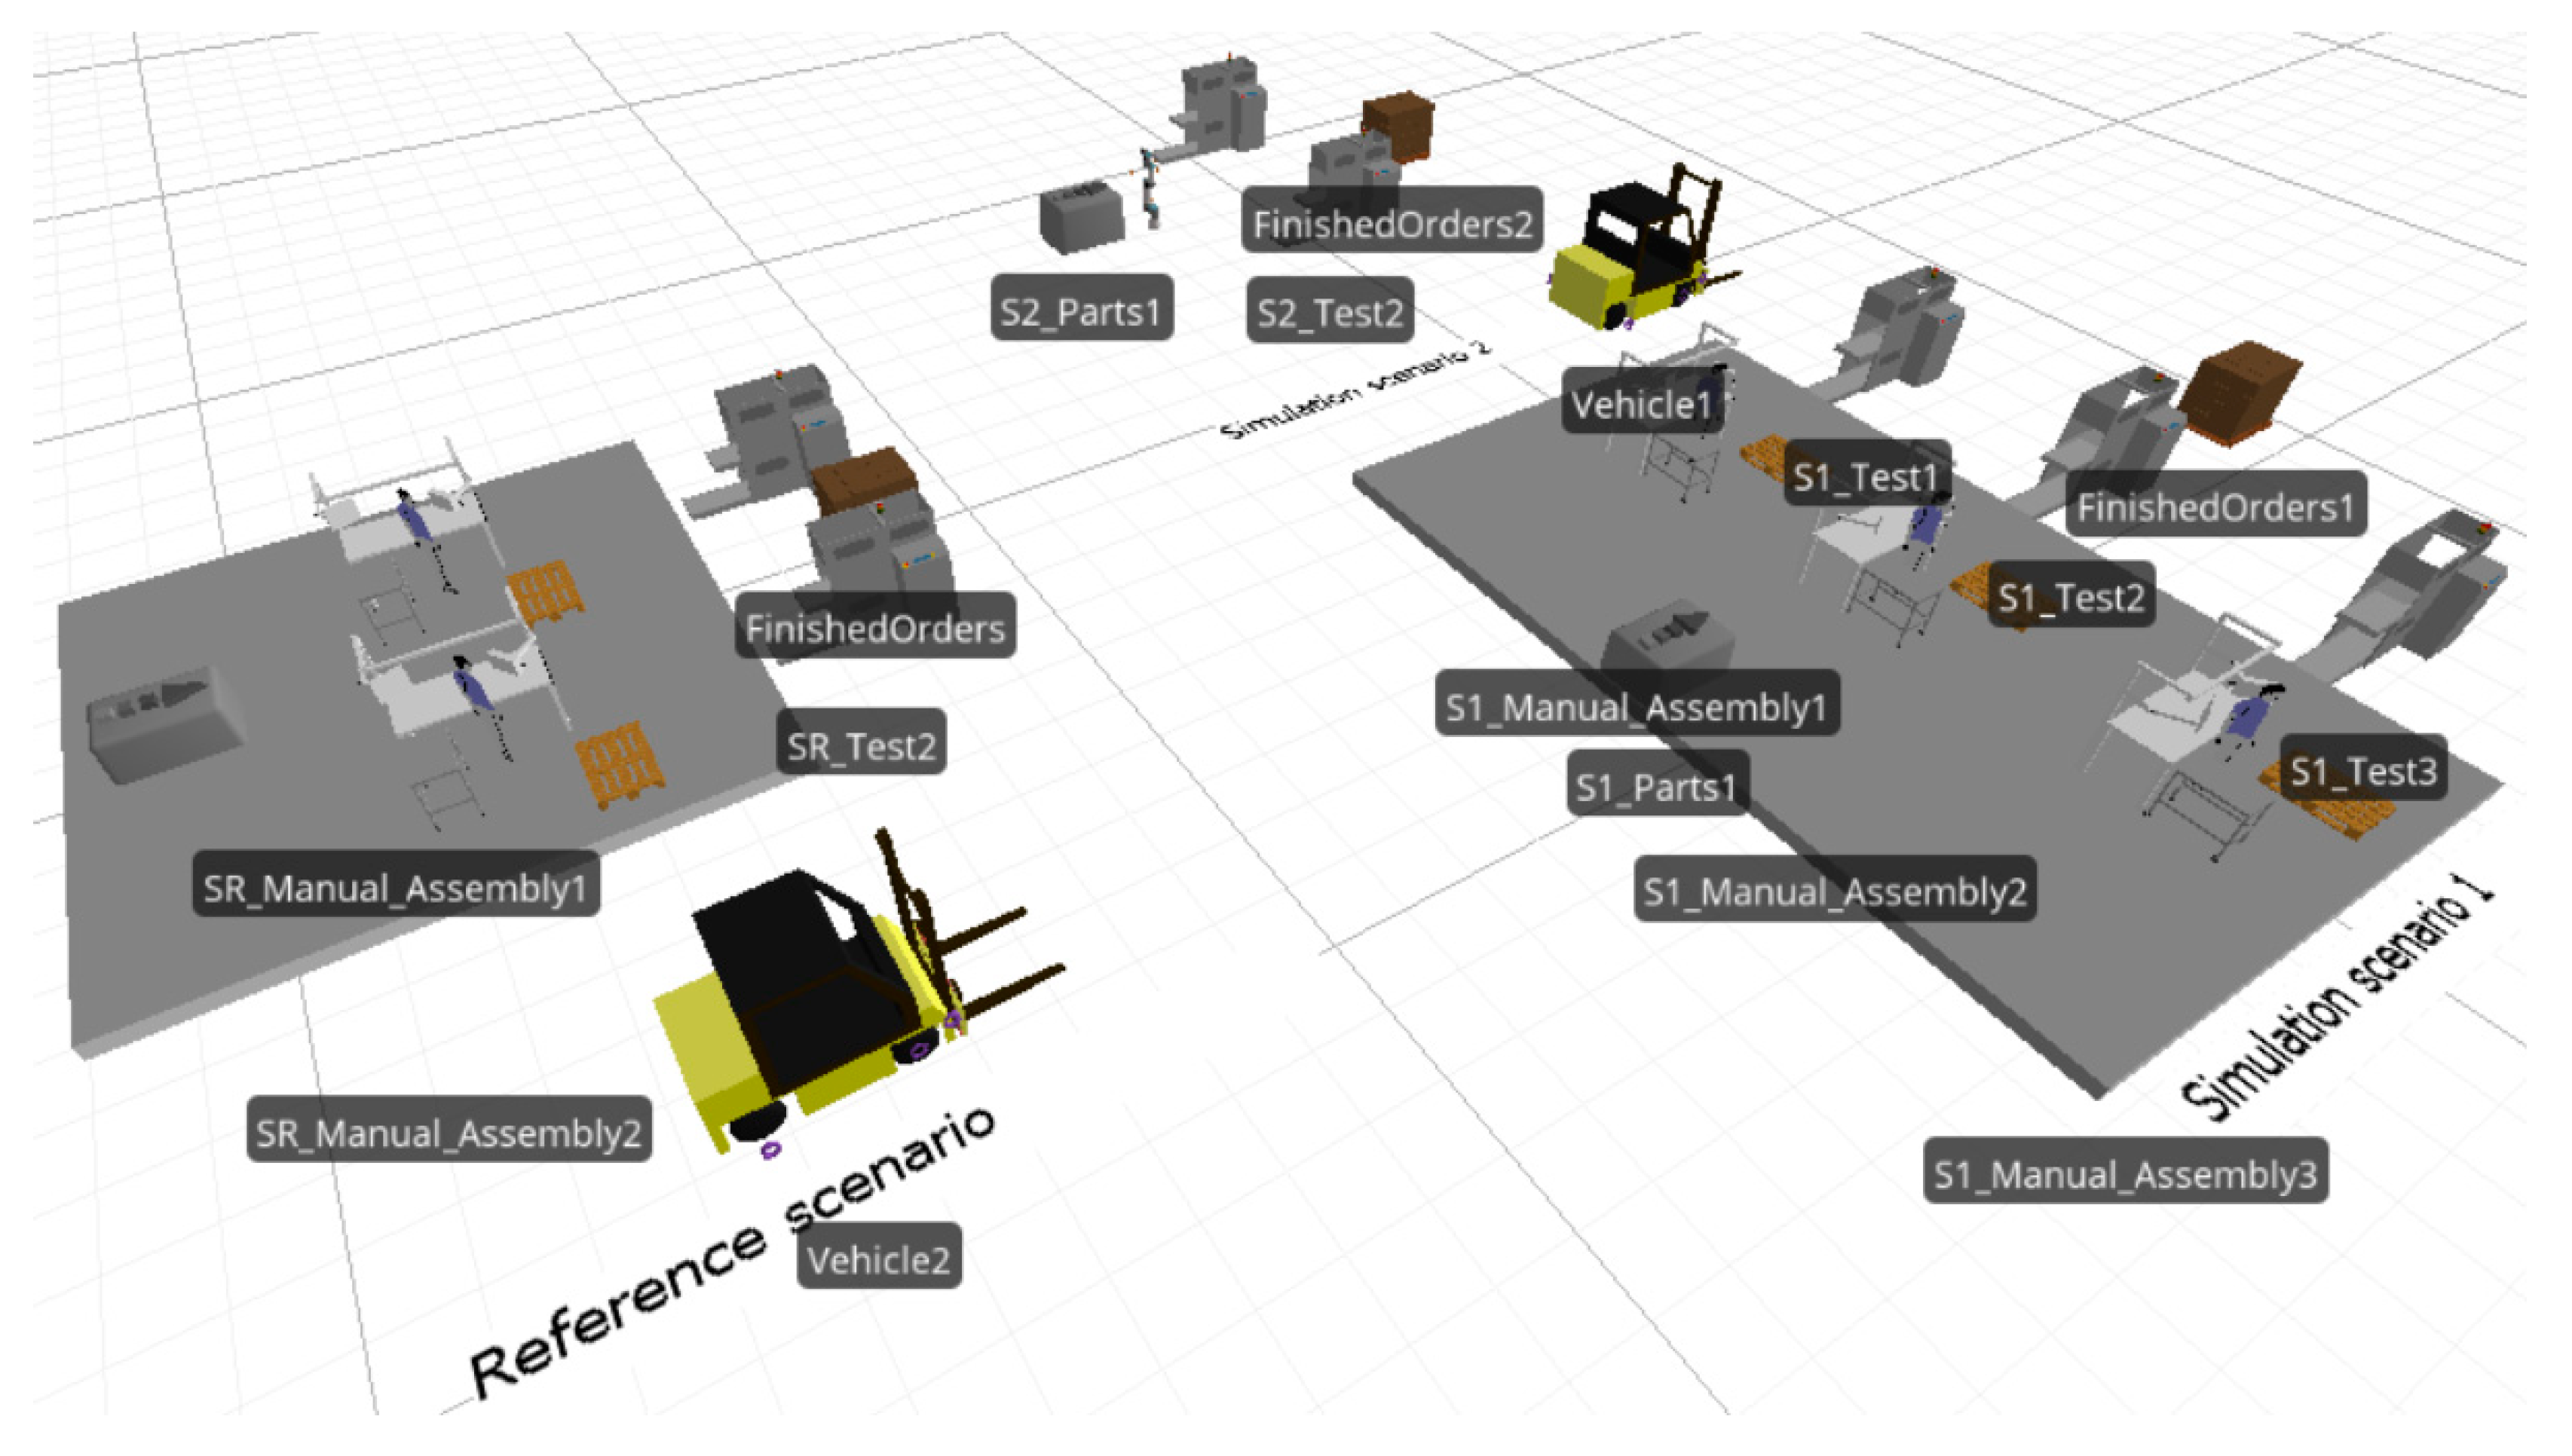
Figure 5 shows a simulation model of three simulation scenarios, which are used to estimate the possibility of increasing the number of finished products on the manufacturing assembly line.
Simulation scenarios are defined as
The reference simulation scenario (S
R), which represents the current state of the manufacturing system. The manufacturing process produces on average 1250 pieces/shift according to the numerical values determined by the visual computing recorded values. The average process time of the manual assembly process is 30 s. Using the normal distribution, the deviations of realistic processing time in the simulation experiment are between 27.5 s and 33 s. The normal distribution function is generated according to the results of the numerical evaluation of the visual computing workplace evaluation. The processing time of the testing stage is a constant 25.5 s. S
R is marked in blue in
Figure 5.
The first simulation scenario (S
1) includes an additional manual assembly workplace and one automated testing stage. The processing times of the operations are the same as for S
R. In
Figure 5, S
1 is marked in brown.
The second simulation scenario (S
2) follows the guidelines of Industry 4.0, as it introduces a collaborative robot at the manual assembly workstation that can handle a maximum load of two test operations with a process time of 12.75 s, and process scrap rate reduction from 8% to 2.5%. The process time of the robot was determined based on a simulation study carried out in the software environment of the intended robot workstation manufacturer. The service of the robot, the workplace preparation and the random control of the manufactured parts by the robot assembly, is carried out by an employee who can supervise three collaborative workplaces in one shift. In
Figure 5, S
2 is highlighted in gray.
The simulation model runs with three-shift working from Monday to Friday, with a shift rated time (maximal usable time) of 415 min for a worker and 470 min for a robot. The usable shift time includes the breaks and workplace preparation times of the workers, the shift handover, and the cleaning times at the workplace. A one-year manufacturing process runs in 264 working days. The assumptions in the simulation model assume that the input material is always available in sufficient quantities and that the finished products are brought to the warehouse or promptly sent to the customer.
The simulation model manufacturing process operation assumptions are defined as follows:
Product assembly workplaces follow a pull operation system. The input sequence of assembly products is released based on customer demands from the enterprise resource planning system.
Manually operated forklifts, when requested automatically, take the input material handling process of the required assembly parts to the input buffers. The simulation model assumes that the input buffer is never empty. Final assembled products are transferred to the enterprise workhouse and shipped to the customer according to the just in time methodology.
The assembly line assumes mean time between failures (MTBF) and mean time to repair (MTTR) of 500 h and 0.75 h respectively. Listed data are collected from the real-world manufacturing process and used in the simulation model.
In addition to the number of finished products, the workplace utilization and the time efficiency of the operation, the simulation model also deals with financial eligibility. When determining the employee’s hourly rate, the real-world data provided by the company are taken into account. In the evaluated case, the gross hourly wage of a worker working in three shifts is 14.79 €/h. The worker’s costs refer to the whole working day, which for the worker is 480 min/shift. The costs do not differ if the employee performs the operation or he waits for new one. However, to determine the cost of robot and test station, a numerical cost calculation has been performed, which is shown in
Table 2. In view of the numerically determined values of the station costs, we can assume that the average cost of the entire assembly and test workplace is 35.60 €/h in S
R, 53.41 €/h in S
1, and 21.46 €/h in S
2. This assumption is based on the assumption that all operations are working at full capacity and does not include the idle time. However, the calculated cost in the simulation model takes into account the corrected values of the idle costs rate for robot and test station based on the data presented in
Table 2.
3.3. Ergonomic Workplace Analysis
Ergonomics is the field of science that deals with the exploration of human physical and mental capabilities during working, and adjusting the working load considering working conditions. With ergonomic workplace design, it is possible to adapt work to a human’s physical and mental characteristics and to reduce or prevent adverse effects on health [
26]. Appropriate workplace design can improve effectiveness and safety at work. The impact factors that influence stress at work can be divided to:
working environment—with working conditions such as noise, heat, humidity, illumination, air velocity; and
body postures—especially awkward postures that can cause health problems.
For the effective workplace design, the following steps are usually taken:
subjective workplace analysis and evaluation to define basic workplace characteristics;
analysis of the existent workstation dimensions with respect to working postures and workers’ perceptions;
workplace analysis considering the working environment (these results are not presented in the paper);
precise simulation of workers’ positions and movements if we use computer aided workplace analyses and design, e.g., ergonomics software [
27]; for manually performed ergonomics’ analyses the procedure is different;
different ergonomics analyses (OWAS, RULA, LBA, NIOSH) performed with ergonomics software;
prepositions for changes in the working procedure based on ergonomics analyses’ results.
Ovaco working analyzing system (OWAS) and rapid upper limb assessment (RULA) analysis were performed for the presented problem consideration. OWAS is a method of posture monitoring developed in Finland (1973) for examining workers’ postures in the steel industry [
28]. The OWAS procedure consists of two parts: an observational technique for classifying body postures and a set of criteria for the redesigning of working methods and workplaces. Body postures are classified into 28 positions, including the positions of the back (four positions), upper limbs (four), hands (three), lower limbs (nine), head and neck (five), as well as the load or force handled (three). Each of these positions has pre-defined high-risk and low-risk postures. In manually performed OWAS, each of these positions is coded by the observer, and after calculating the amount of time the worker maintains these postures, a four-level action code for task improvement is assigned. These four action codes are defined as follows: changes are not needed, changes needed in the near future, changes needed immediately, and need intensive observation.
RULA was developed by Dr. Lynn McAtamney and Dr. Nigel Corlett (1993) [
29]. This method evaluates individuals’ exposures to postures, forces, and muscle activities that have been shown to contribute to Repetitive Strain Injuries. Use of this ergonomic evaluation approach results in a risk score between one and seven, where higher scores signify greater levels of apparent risk. For a given manual task, RULA assesses the risk of upper limb disorders based on posture, muscle use, the weight of loads, task duration and frequency and then assigns the evaluated task a score that indicated the degree of intervention required to reduce the risk of an upper limb injury. These scores are compared to tables stating risk on four levels and actions needed: acceptable posture; further investigation—change may be needed; further investigation—change soon; and implement change.
Both OWAS and RULA are used for whole body load assessment but with some differences, e.g., with RULA, right and left body parts have to be assessed separately, RULA does not consider duration of exposure, and OWAS does not consider repetition or duration of the sequential postures. Despite these differences, both methods have the same focus and their results can be used for making up a deficiency. Since both methods are time consuming and can be disturbing for the worker, computer-based OWAS and RULA analysis were performed.
For assessing the presented workplace, the ergonomic software Jack was used (
Figure 6). The most important and useful part of ergonomics software is the possibility to perform different analyses. The ergonomics software analysis toolkit is a set of ergonomic analysis tools that help us to design better work areas and evaluate physical tasks.
The first step in computer aided analysis and design with ergonomics software is creating the working environment. The three-dimensional workplace model created with the spherical camera was imported to the ergonomics software. This data-driven simulation model is the best approximation of the real working environment with worktable heights and shapes identical to those in a real-world manufacturing system. The next step is inserting a human model, and since, on this workplace mostly women, work we inserted a female human model and created simulation of her movements during work. In the last step, different ergonomics analyses were performed and recommendations for work changes were given based on their results.
4. Results
The simulation results are divided into three sections, showing the results of three simulation scenarios in terms of the total number of finished products, workstation costs and the results of the ergonomic analysis of the manual assembly workplace.
Table 3 shows the results of the workplaces’ utilization and the total number of finished products per workplace. The numerical values of the high manual assembly workplaces’ utilization support the previous assumption that these workplaces represent bottlenecks in the manufacturing process. In the S
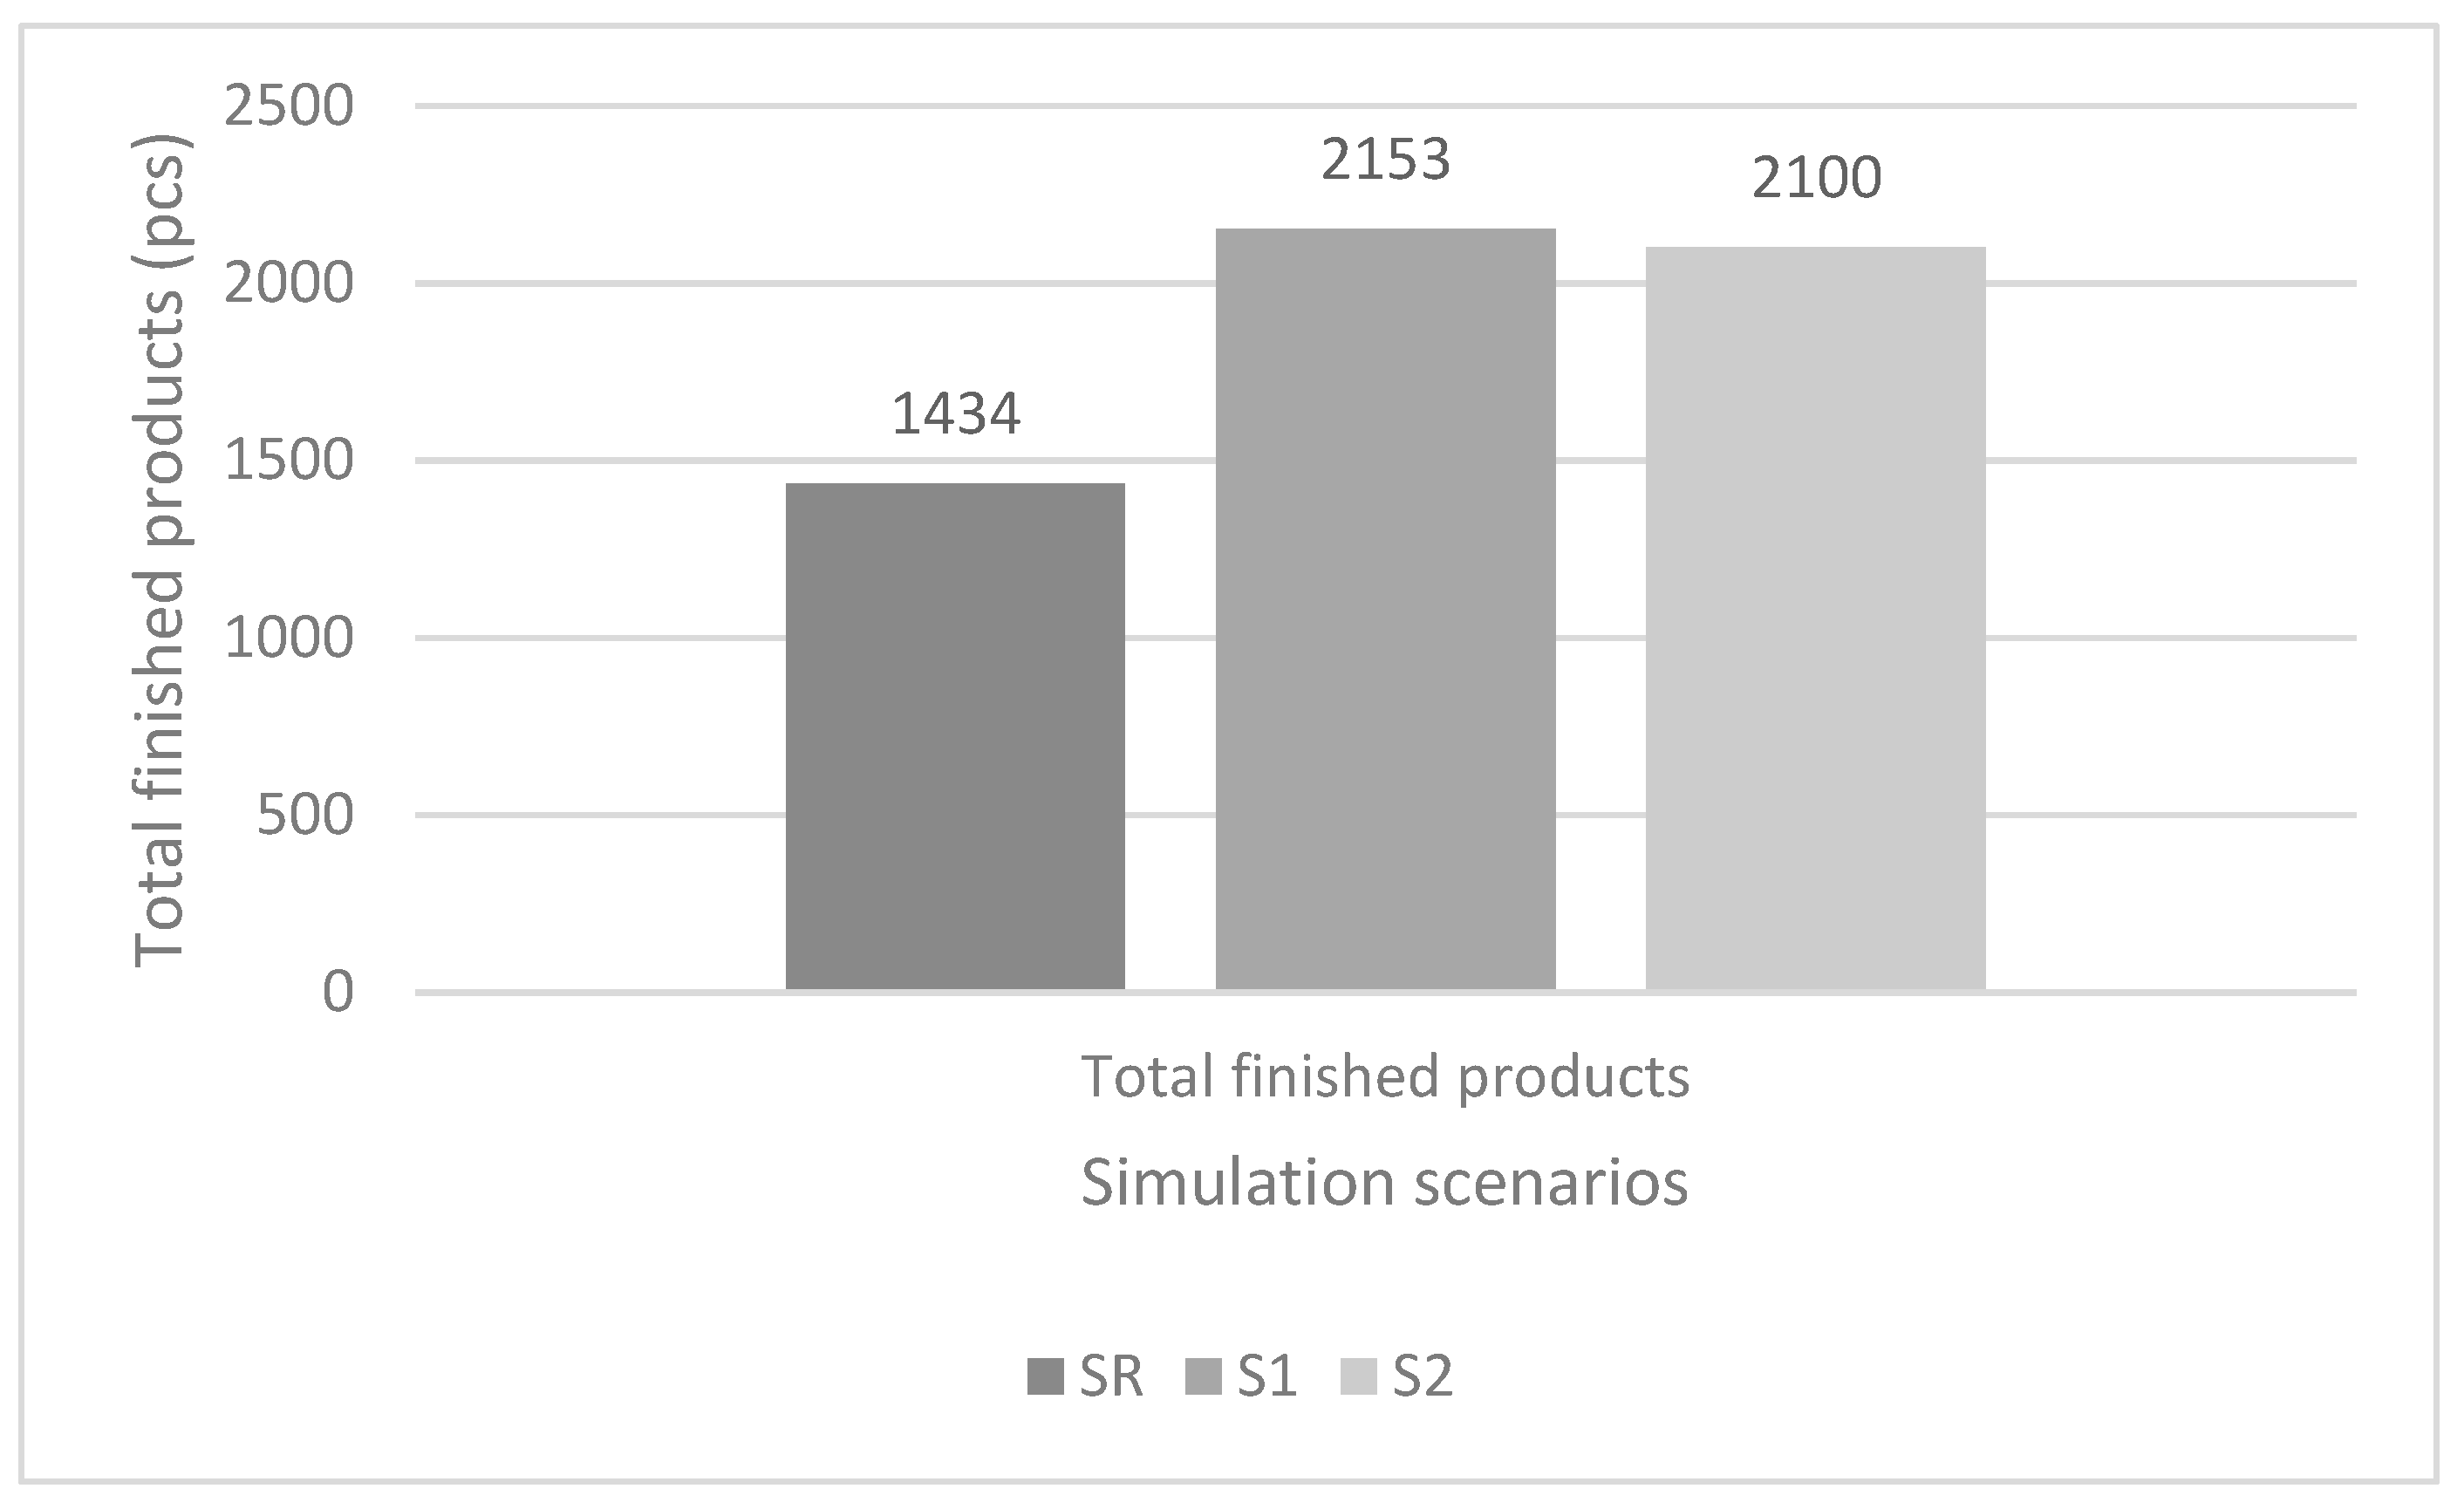
R, the results show that, with an average of thirty iterations of the simulation model, the manufacturing process completed 1434 products in one shift. Compared to the real-world number of finished products, which is an average of 1250 pieces per shift, the simulation model predicts a 12.8% higher value of finished products in relation to real-world manufacturing system. The higher value of the finished products in the simulation model compared to the evaluated real manufacturing system can be attributed to the difficulties of the workers to ensure a constant work flow with a low number of unnecessary stops and a higher coefficient of incorrectly assembled products that have to be disassembled and reassembled. Based on the numerical results shown by the simulation model, we conclude that the existing manufacturing system can be optimized by a more appropriate work organization, and by ensuring an adequate efficiency of the manual assembly process.
With the introduction of an additional manual assembly and test operation workstation in S1, we find that the number of finished products increased by half of the initial values. Such an extension of the manufacturing system would allow the assembly of approximately 1,705,000 products per year, which is notably is 50.1% more than the number of finished products in SR.The additional order capacity contributes to a higher number of finished products in one shift, but, when it is introduced, it increases the cost of the initial workplace investment and the running cost of the entire manufacturing process notably, which is presented in detail below. With the increase in the number of finished products, the three manual assembly workplaces still represent a bottleneck in the new proposed manufacturing system, which must be ensured by optimizing the work processes accordingly, and by balancing assembly and testing operations. If the annual target value of finished products is reached, the introduction of a third additional workplace would, if necessary, lead to a standstill, relocate workers, or carry out assembly work in a reduced number of shifts. Such planning of workplaces would require more work in planning and managing production and the associated production capacity.
S2 deals with the introduction of a collaborative workplace at an automated robot assembly station. With the introduction of a suitable collaborative robot, the production system would produce 2100 products per shift, an increase of 46% compared to the reference simulation scenario. The total annual capacity would be 1,663,200 products, which is 12.5% higher than the estimated planned value of the customer’s orders in SR. Given the high utilization of all automated workplaces, it is determined that the stated value of finished products shows the maximum utilization of the proposed manufacturing system. Appropriate operation of the collaborative workplace by the employee and appropriate time-coordinated supply of input materials and removal of finished products can only ensure such high utilization. The maximum utilization of the manufacturing process in S
2 could be reduced to a value of 12%, and, at the same time, production would reach the target values of finished products in one shift and the annual number of delivered orders. Depending on the characteristics of the automated system, it allows a higher degree of flexibility with a lower degree of financial and time inefficiency. Graphical results of total finished products simulation scenarios’ comparison are presented in
Figure 7.
The numerical results of simulation cost modeling are based on the used numerical calculated values shown in
Table 2. The results in
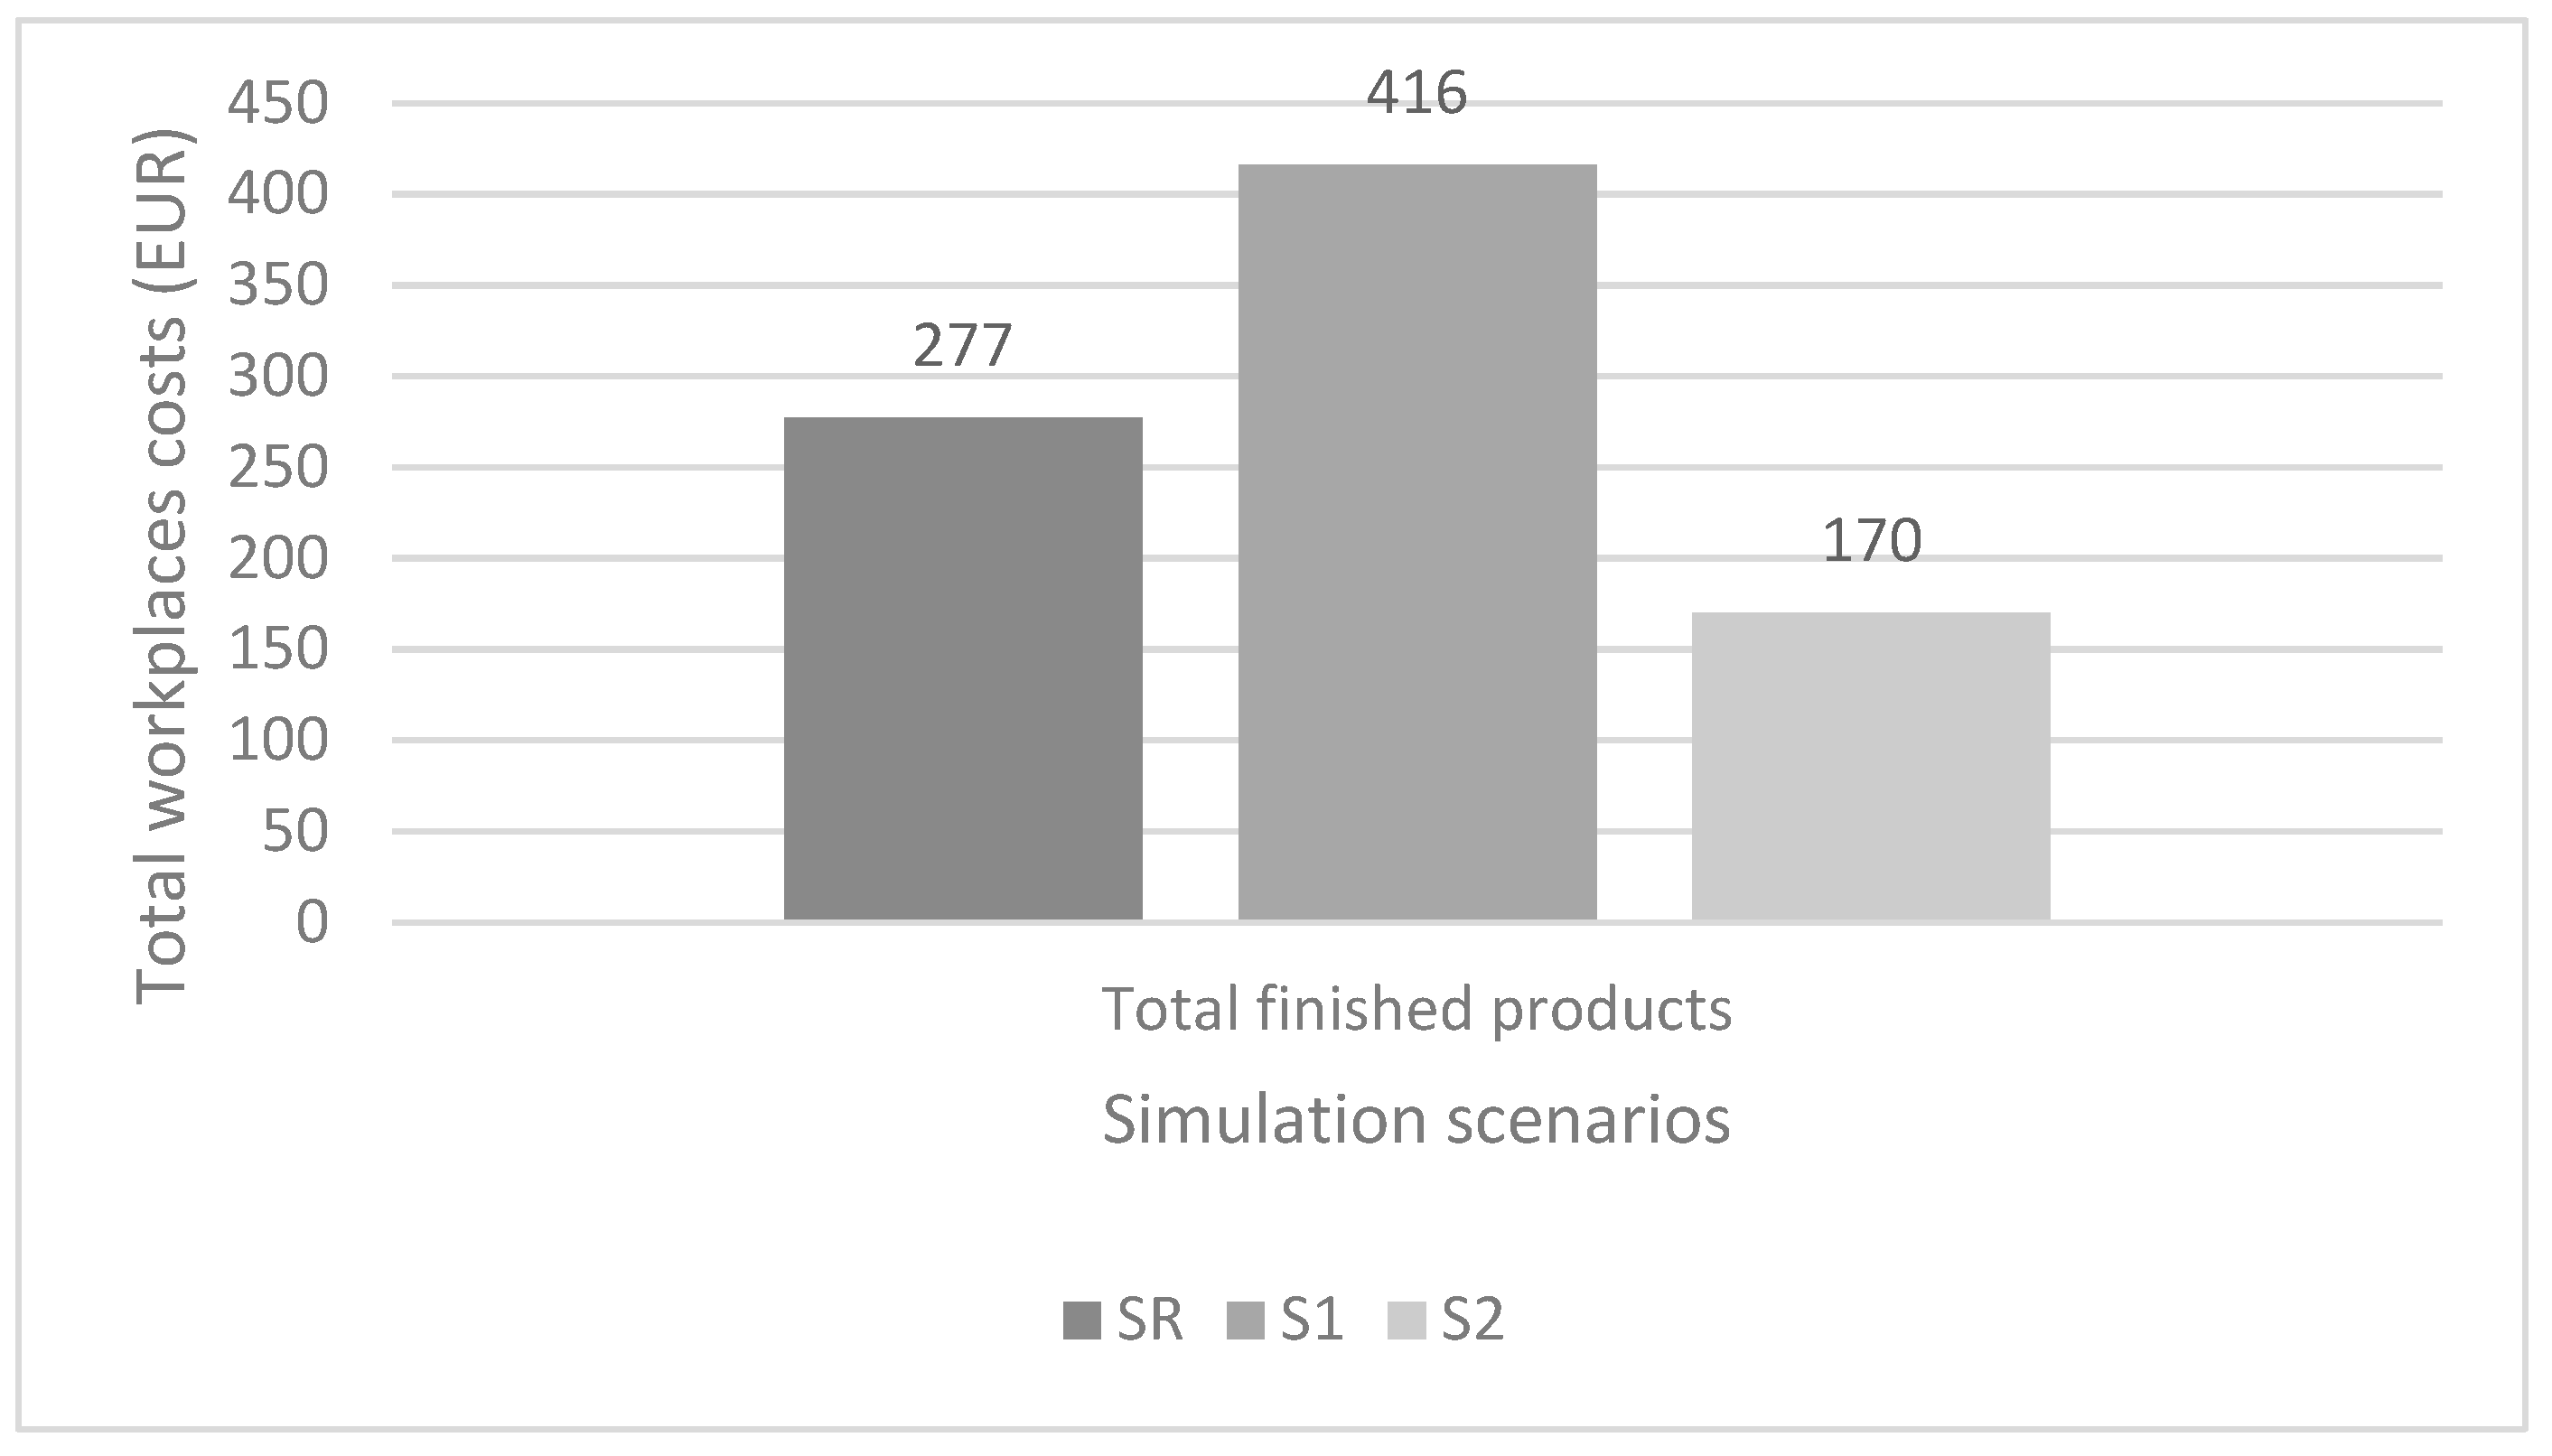
Table 4 show a notable increase in the cost of the assembly process with the introduction of an additional manual assembly workplace and additional automated control station. The increase in the cost of the additional workplace in S
2 is almost half of the initial cost in S
R. Despite the increase in production capacity resulting from the introduction of an additional manual assembly workplace, there are additional costs for the initial investment and high operating costs. Adapting to the customer’s needs and possible order fluctuations would make it even more difficult to plan the manufacturing process correctly, and additional problems would arise in ensuring the financial justification of the manual assembly operation.
Compared to S1, the S2 assumes the validity of the collaborative workplace, allows a notable reduction in the operating costs of the automated assembly and testing workplace. The reduction of the operating costs of the workplace is 38.63% according to the data, and the higher initial investment cost would be refunded in 42 months. Calculation was made after the numerical calculation of the difference between the value of the operating costs and the initial investment, assuming that the workplace works in three shifts. In view of the reduction in the proportion of incorrectly assembled products and the resulting decrease in the duration of the reassembly process from 8% to 2.5%, the introduction of a cooperative workplace ensures a higher quality level of manufactured products in a shorter time at lower production costs.
Figure 8 shows a graphic representation of the numerical results. The introduction of an automated collaborative workplace, depending on the results shown, allows a justified investment in terms of cost-time value and easier more flexible adaptation to the customer’s needs.
Ergonomics Analyses Results
The manufacturing workplace with manual product assembly and automated controls operations presented in
Section 3.1 was examined with ergonomic analyses OWAS and RULA. Since the workstation represents a half of the entire assembly process (the workstation is mirrored on the
y-axis, where the work is performed by another worker), only results for one workplace will be presented.
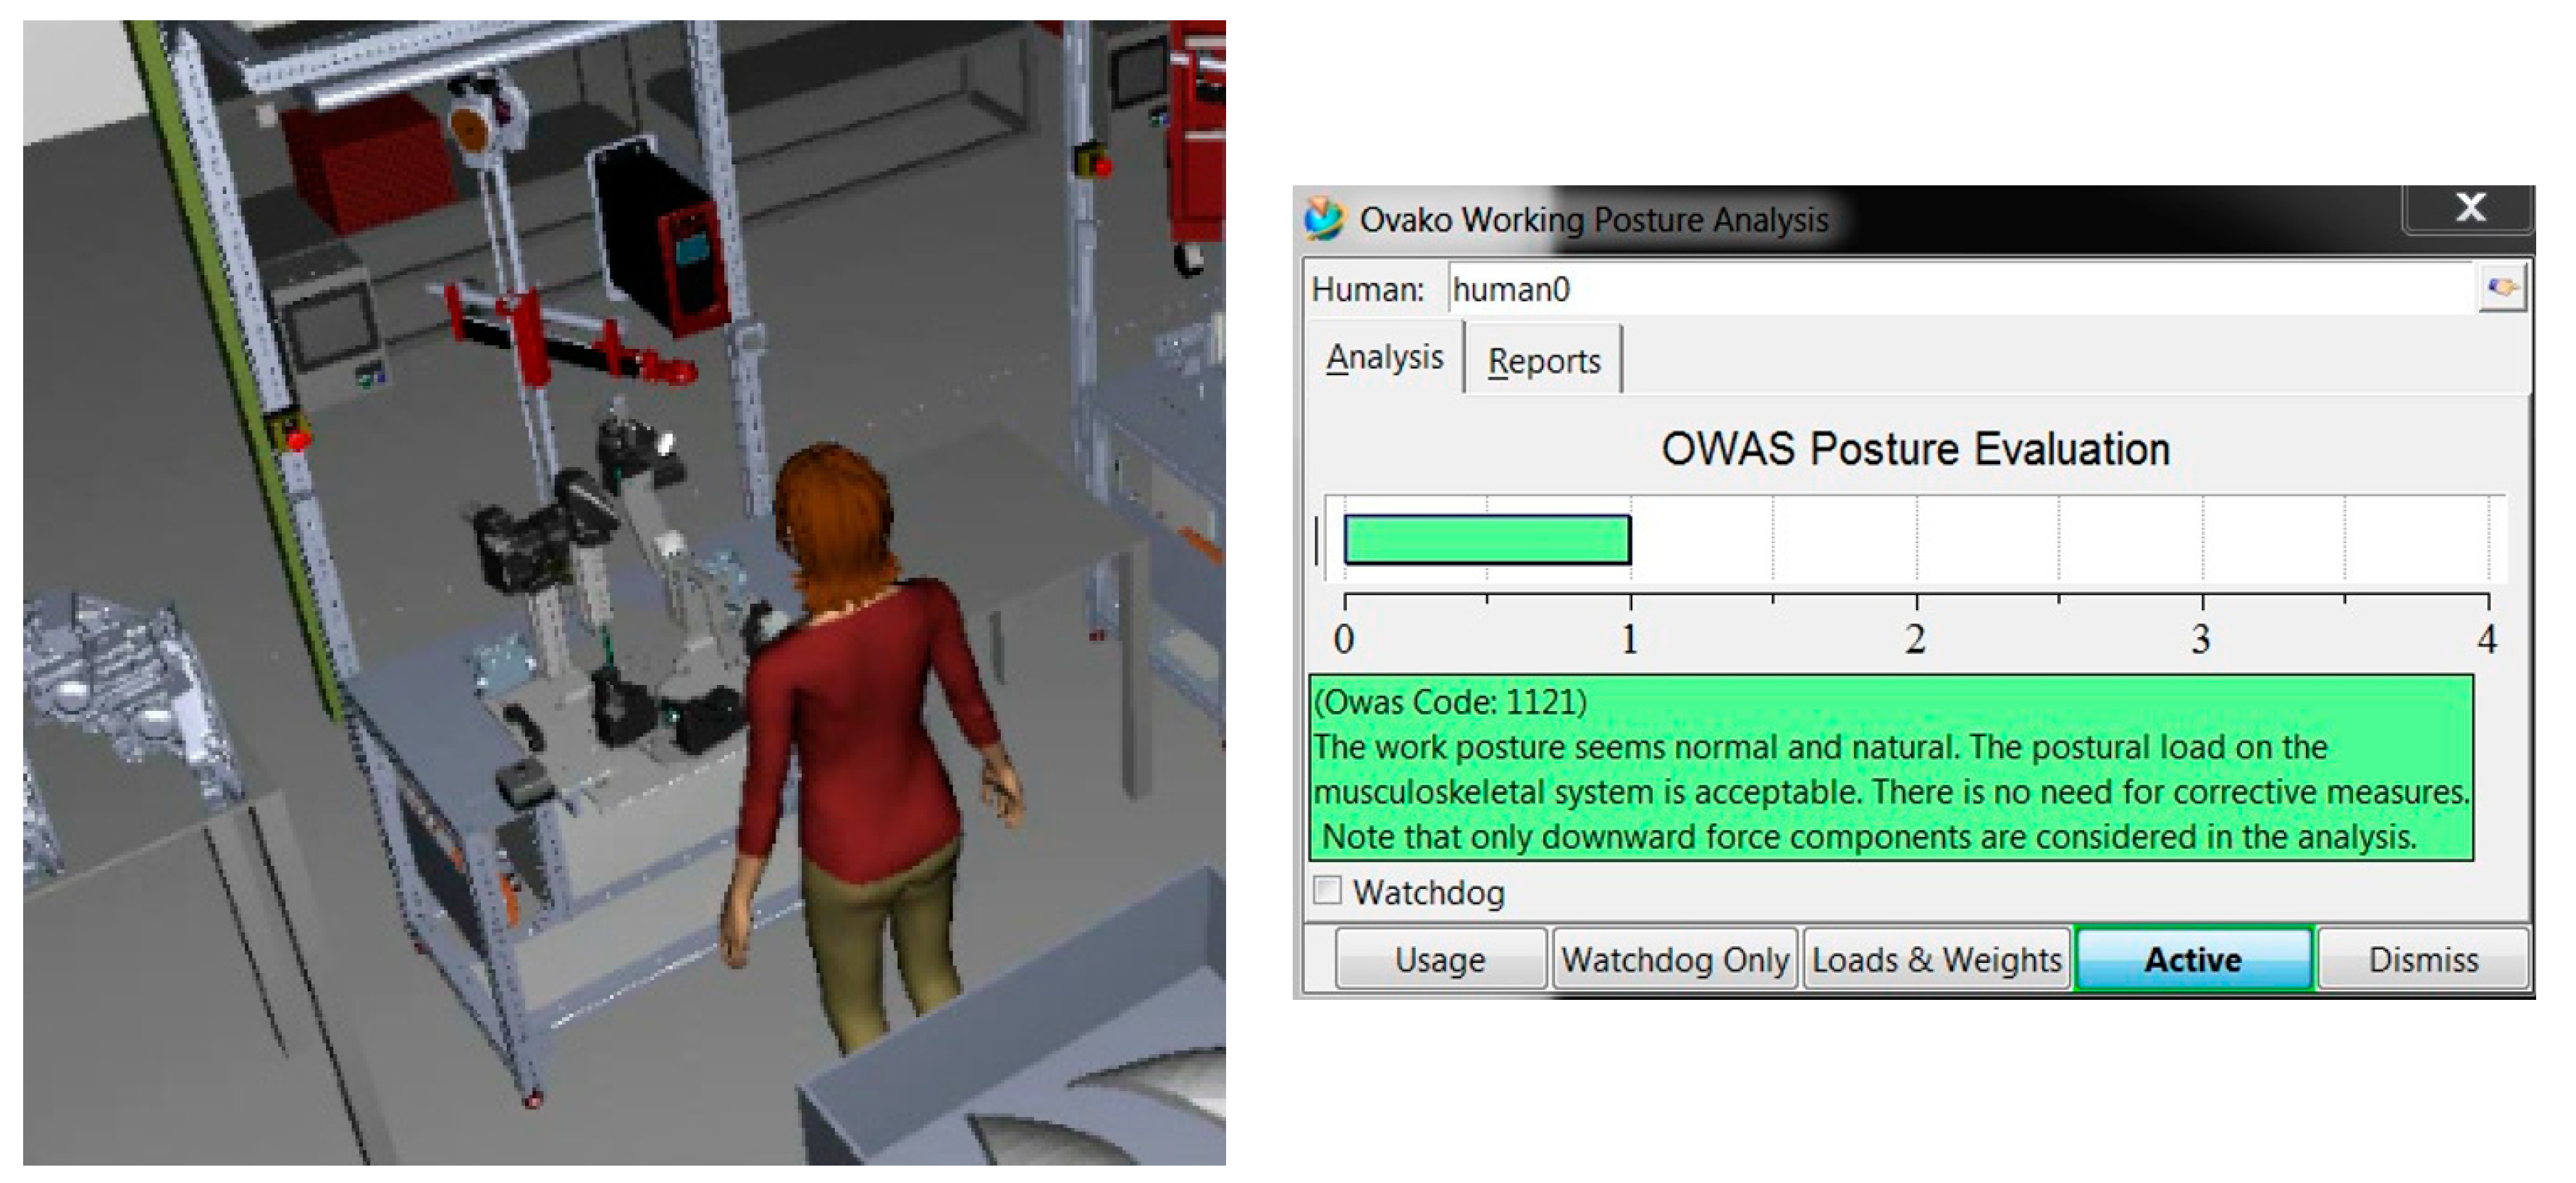
Figure 9 shows a three-dimensional workplace model, which was captured with a spherical camera. The model was first computed visually and transferred to the Autodesk Inventor software environment. With the model used, we can perform the ergonomic analysis faster, easier and more realistically, while the three-dimensional model represents a real-world workplace environment. The model can be adapted according to the workplace evaluation proposals and specific ergonomic analyses.
Results of the performed OWAS analysis show that the majority of performed worker’s movements is safe, except for two positions where harmful effects are possible. During the reach out for the assembly part a bend is present in the lumbar spine, estimated as potentially harmful for the musculoskeletal system (
Figure 9, left window), and the same warning (with a bit different code) appeared during the phase when putting a product into the right testing position. The problem could be solved easily with an adjustable height worktable.
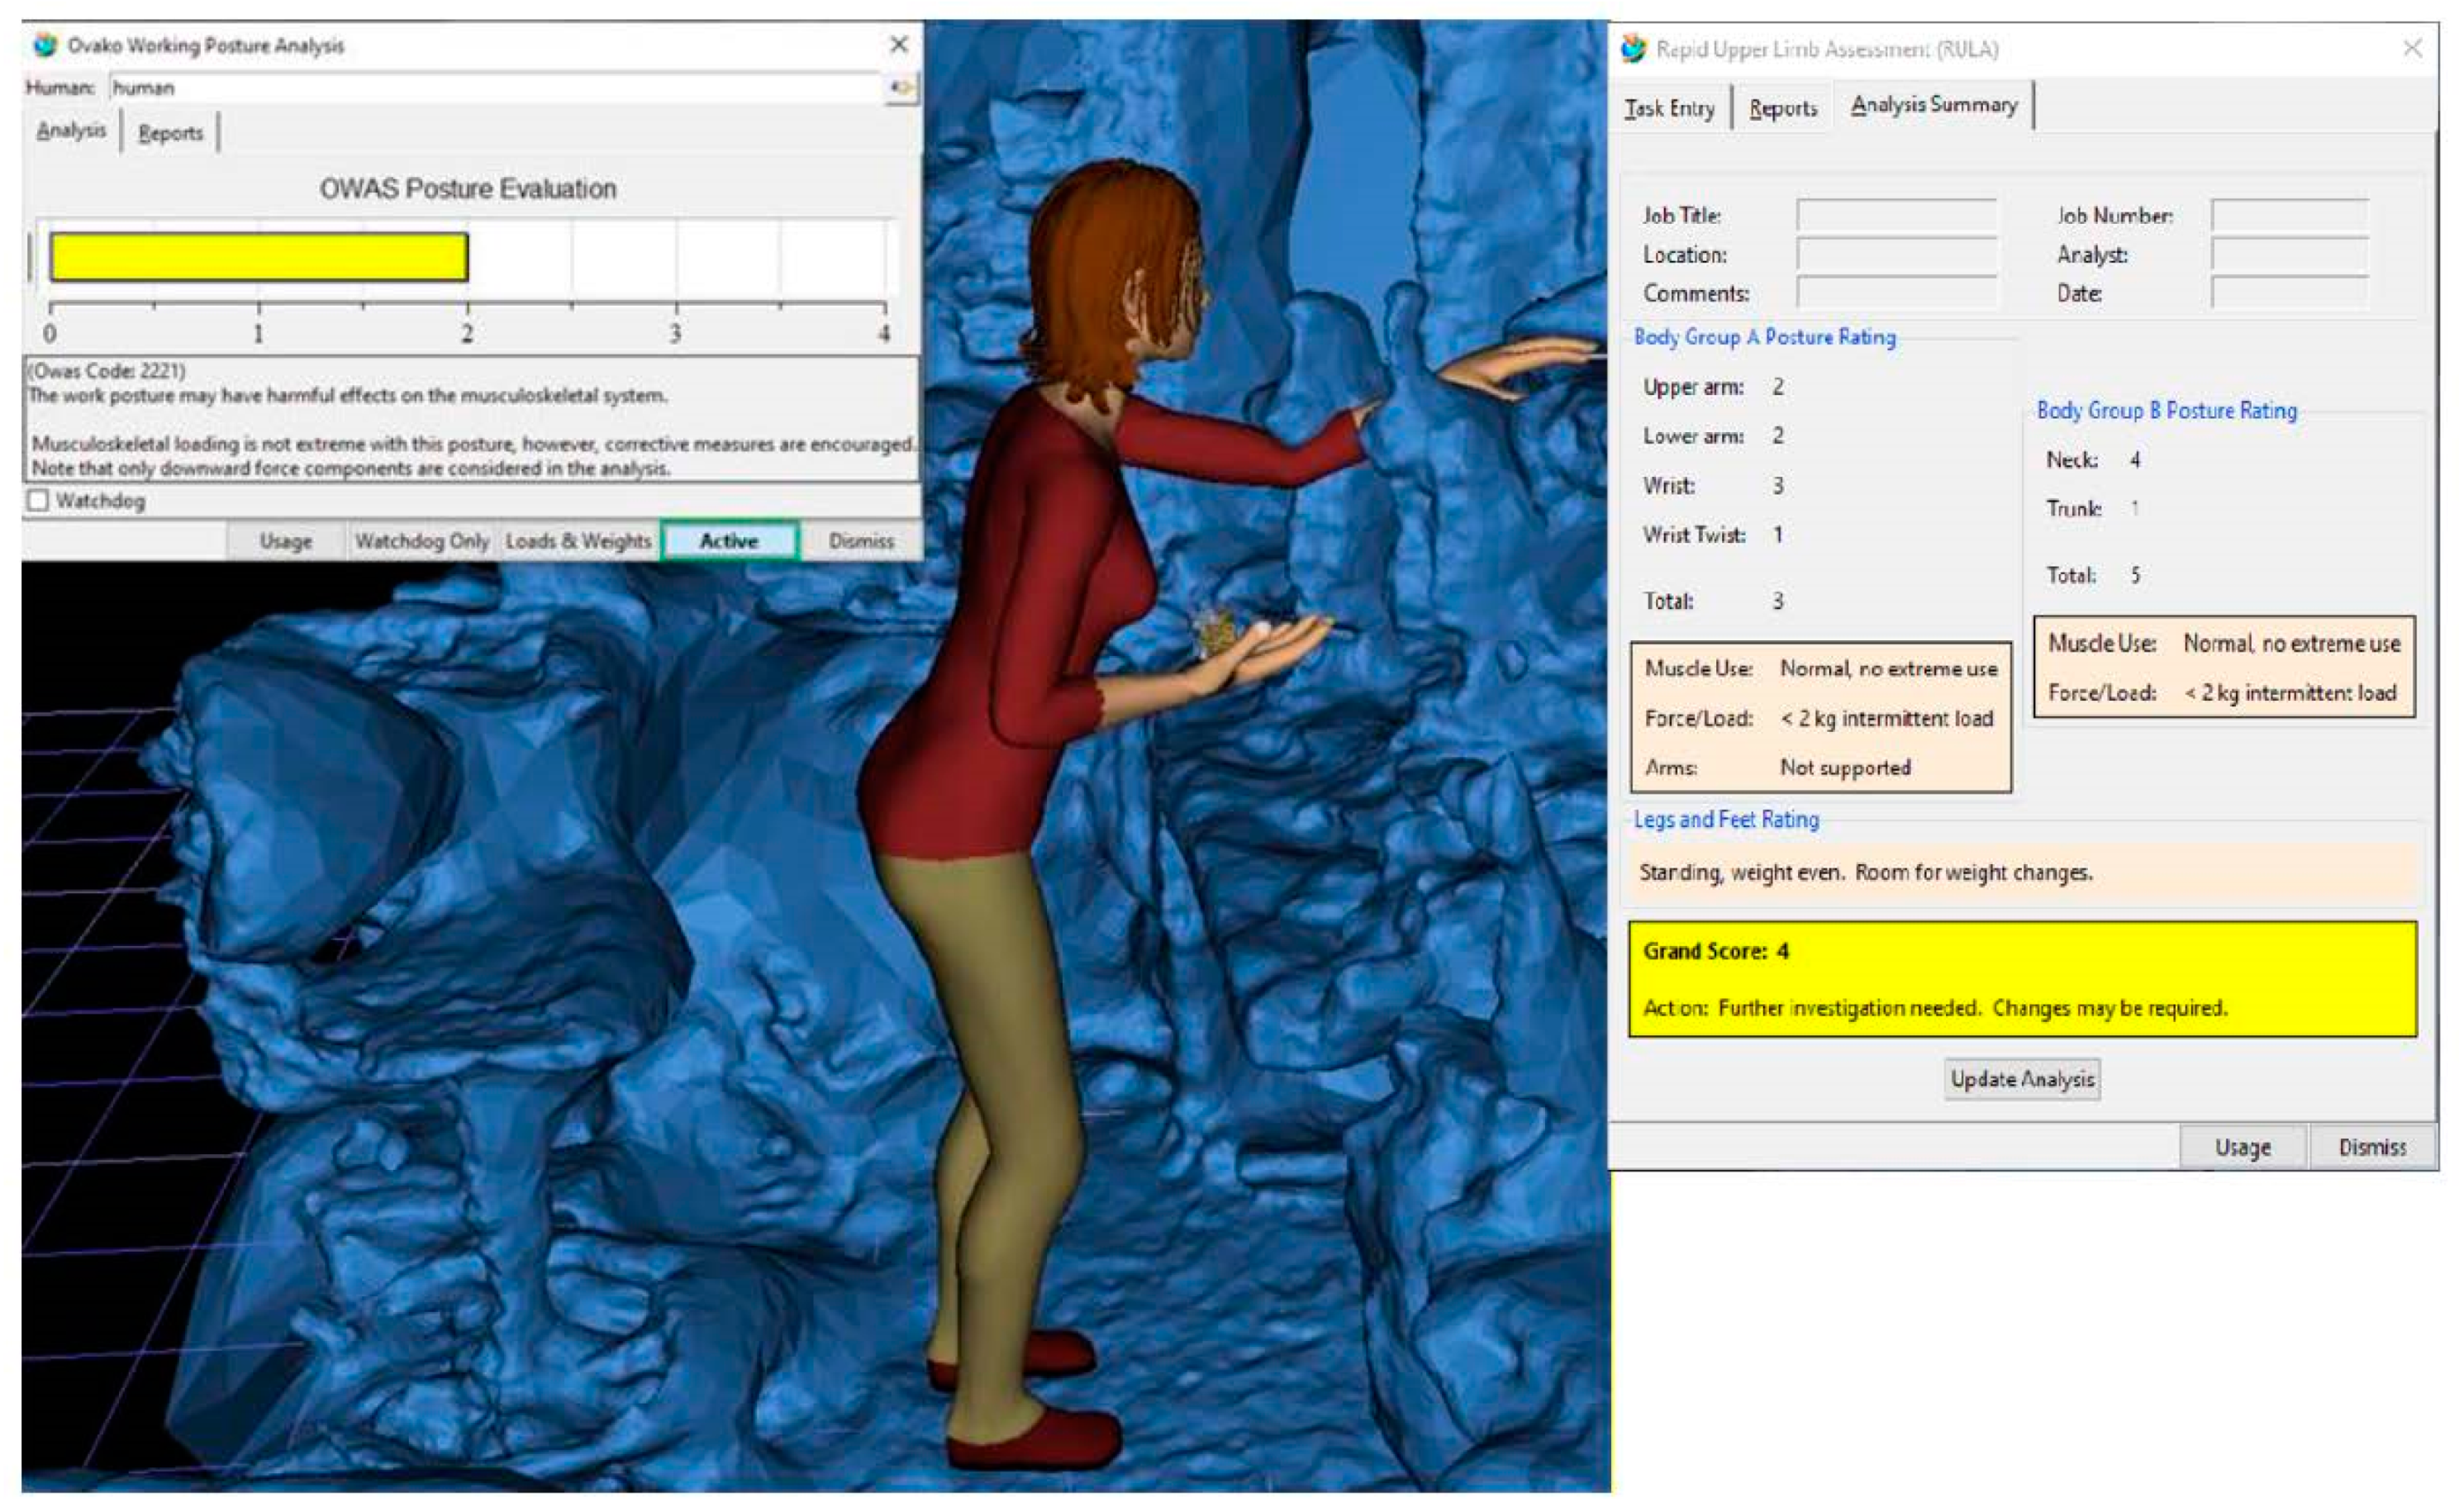
As we expected, the results of the performed RULA analysis were slightly worse than the results gained with OWAS. The worker repeats movements with the upper limbs constantly, and the majority of movements is made with the wrist. There is also a constant bend in the neck for suitability of parts’ assembly. The RULA score during the working process is constantly 3–4. This is the value of first warnings, and it means that the problem should be investigated further, as shown in
Figure 9 (right window). The solution of this problem is questionable, because changes in the assembly area (different positions of hands and wrists) can cause changes in neck positions. Probably the most effective solution for this problem would be process automatization, as proposed in the S
2 evaluation, the introduction of a collaborative workplace.
5. Discussion and Conclusions
In the manuscript, we present a new innovative way of using visual computing methods and data-driven simulation models for the investigation of manufacturing capacities, costs, and ergonomic analyses of workplaces. The main aim is to evaluate workplaces in terms of faster, cheaper, and more ergonomic processes, which was presented with the proposed approaches. The presented use of the economically accessible spherical camera for capturing static images and video recordings enabled the construction of a detailed three-dimensional model of the workplace and the acquisition of real-world parameters’ values captured directly from the manufacturing process. The static images used to construct the three-dimensional model were supplemented by video data concerning realistic quantitative and terminological data. The use of a spherical camera, static images and video to create data-driven simulation models represents a completely new approach to the evaluation of manufacturing systems in Industry 4.0. Since the validation was carried out with the simulation scenario method, in which the reference scenario was extended by two additional proposals for research problem solutions, the simulation results represent advantages and limitations when using different optimization solutions. The optimization approaches in S1 and S2 define the enhancement or reorganization of the workplace with an additional manual assembly workplace, or with the introduction of a cooperative robot. To examine the suitability of the workplace from the point of ergonomic justification, a three-dimensional model taken with a spherical camera and appropriately computed visual was used and transferred to a software environment for carrying out ergonomic analyses. The RULA and OWAS methods used showed the possibilities for improving the manual assembly workplace and, at the same time, demonstrated clearly the high degree of justification for the introduction of a collaborative workplace.
The main scientific contribution of the article refers to a new approach for the use of spherical cameras to collect data from real-world manufacturing systems. The captured data were used for workplace validation, the construction of a data-driven simulation model, as well as for ergonomic workplace analysis. The results prove that the presented evaluation approach allows a fast, efficient, and satisfactorily accurate application of visual computing methods in the comprehensive consideration of the investigation of performance and justification of manufacturing processes. Such an evaluation approach has not been proposed in the literature so far. Other researchers have been concentrating on the investigation of individual methods [
1,
2,
24] but have not used them in the way presented in the manuscript.
The limitations of the presented research are related to ensuring the accuracy of the recorded spherical camera data. According to the literature, the accuracy of data acquisition is approximately 2 mm, and this accuracy depends on the illuminance of the evaluated object and the distance between the camera and the acquired objects. A higher data accuracy can be achieved by using professional three-dimensional scanners or by increasing a constantly high illumination level of the scanned object. In the presented manuscript, we have not examined the accuracy of the data of the captured object compared to the real-world object, because the model for performing the evaluation is satisfactory, and the terminological and quantitative values are completely realistic. However, when performing more detailed analyses, it would be useful to examine the accuracy of the data. It would also be useful to focus further research on the development of a software environment that would allow real-time communication between the data collected by a spherical camera and a data-drive simulation model. With the current camera software, communication via the internet can only take place via a commercial, public platform for publishing video content. An appropriately protected open source information protocol would be a suitable extension of the presented data acquisition and usage. The presented research deals with one real-world problem, but one of the main usability is the portability of a spherical camera, the availability of simulation tools and visual computing software, which together allow a broad applicability of the presented evaluation approach. Limitations of the S2 (introduction of a collaborative robot), in which the service of the workplace is provided by the equivalent equipment of the actual state, arise when the simulation model assumes that raw materials and finished products are always available on time or are transported to the warehouse. In the present case, the company uses computer-aided monitoring of the stocks state and completed orders to ensure the smooth operation of the manufacturing process. In the S2 for the correctness of the operation, a manual control is carried out with the help of a worker who monitors three such workplaces, and monitoring time could be shortened assuming a high reliability of the robot. Further research will be based on the application of the proposed approach to capture, study, and optimize the entire manufacturing process and not just a single workplace. The feasibility of using a mobile robot platform designed for continuous data acquisition in the manufacturing process needs to be examined, or the installation of several spherical cameras connected to the industrial Internet and the establishment of a suitable communication protocol could also be tried. However, we can say with certainty that the presented results and findings allow a wide range of experimental and applied applications of the presented approach in Industry 4.0.
Author Contributions
Conceptualization, R.O. and N.V.H.; methodology, R.O. and N.V.H.; validation, B.B. and R.O.; formal analysis, N.V.H.; resources, B.B.; data curation, R.O. and N.V.H.; writing—original draft preparation, R.O. and N.V.H.; writing—review and editing, R.O. and B.B.; visualization, R.O. and N.V.H.; supervision, B.B.; funding acquisition, B.B. All authors have read and agreed to the published version of the manuscript.
Funding
This research was funded by the Slovenian Research Agency (ARRS), research core grant No. P2-0190.
Acknowledgments
We would like to express our very great appreciation to the Laboratory for Production and Operation Management at the University of Maribor for the possibility of carrying out our research work. We would like to thank all anonymous reviewers and the Editor for their comments. With the corrections, suggestions and comments made, the manuscript has gained in its scientific value.
Conflicts of Interest
The authors declare no conflict of interest. The funders had no role in the design of the study, in the collection, analyses, or interpretation of data, in the writing of the manuscript, or in the decision to publish the results.
References
- Posada, J.; Toro, C.; Barandiaran, I.; Oyarzun, D.; Stricker, D.; de Amicis, R.; Pinto, E.B.; Eisert, P.; Doller, J.; Vallarino, I. Visual computing as a key enabling technology for industrie 4.0 and industrial internet. IEEE Comput. Graph. Appl. 2015, 35, 26–40. [Google Scholar] [CrossRef] [PubMed]
- Lindskog, E.; Berglund, J.; Vallhagen, J.; Johansson, B. Visualization support for virtual redesign of manufacturing systems. Procedia CIRP 2013, 7, 419–424. [Google Scholar] [CrossRef][Green Version]
- Liu, P.; Zhang, Q.; Pannek, J. Development of operator theory in the capacity adjustment of job shop manufacturing systems. Appl. Sci. 2019, 9, 2249. [Google Scholar] [CrossRef]
- Wang, J.; Chang, Q.; Xiao, G.; Wang, N.; Li, S. Data driven production modeling and simulation of complex automobile general assembly plant. Comput. Ind. 2011, 62, 765–775. [Google Scholar] [CrossRef]
- Mejia-Parra, D.; Sanchez, J.R.; Ruiz-Salguero, O.; Alonsko, M.; Izaguirre, A.; Gil, E.; Palomar, J.; Posoda, J. In-line dimensional inspection of warm-die forged revolution workpieces using 3D mesh reconstruction. Appl. Sci. 2019, 9, 1069. [Google Scholar] [CrossRef]
- Pintore, G.; Ganovelli, F.; Villanueva, A.J.; Gobbetti, E. Automatic modeling of cluttered multi-room floor plans form panoramic images. Comput. Graph. Forum. 2019, 38, 347–358. [Google Scholar] [CrossRef]
- Ojstersek, R.; Acko, B.; Buchmeister, B. Simulation study of a flexible manufacturing system regarding sustainability. Int. J. Simul. Model. 2020, 19, 65–76. [Google Scholar] [CrossRef]
- Darema, F. Dynamic data driven applications systems: A new paradigm for application simulations and measurements. In Computational Science—ICCS 2004, Lecture Notes in Computer Science; Bubak, M., van Albada, G.D., Sloot, P.M.A., Dongarra, J., Eds.; Springer: Berlin/Heidelberg, German, 2004; Volume 3038, pp. 662–669. [Google Scholar] [CrossRef]
- Kück, M.; Ehm, J.; Hildebrandt, T.; Freitag, M.; Frazzon, E.M. Potential of data-driven simulation-based optimization for adaptive scheduling and control of dynamic manufacturing systems. In Proceedings of the 2016 Winter Simulation Conference, Arlington, VA, USA, 11–14 December 2016; pp. 2820–2831. [Google Scholar] [CrossRef]
- Jiang, C.; Xi, J.T. Dynamic scheduling in the engineer-to-order (ETO) assembly process by the combined immune algorithm and simulated annealing method. Adv. Prod. Eng. Manag. 2019, 14, 271–283. [Google Scholar] [CrossRef]
- Kocsi, B.; Matonya, M.M.; Pusztai, L.P.; Budai, I. Real-time decision-support system for high-mix low-volume production scheduling in industry 4.0. Processes 2020, 8, 912. [Google Scholar] [CrossRef]
- Zhou, L.; Zhang, L.; Ren, L.; Wang, J. Real-time scheduling of cloud manufacturing services based on dynamic data-driven simulation. IEEE Trans. Ind. Inform. 2019, 15, 5042–5051. [Google Scholar] [CrossRef]
- Sadati, N.; Chinnam, R.B.; Nezhad, M.Z. Observational data-driven modeling and optimization of manufacturing processes. Expert Syst. Appl. 2018, 93, 456–464. [Google Scholar] [CrossRef]
- Zou, J.; Chang, Q.; Arinez, J.; Xiao, G.; Lei, Y. Dynamic production system diagnosis and prognosis using model-based data-driven method. Expert Syst. Appl. 2017, 80, 200–209. [Google Scholar] [CrossRef]
- Li, Y.; Chang, Q.; Brundage, M.P.; Biller, S.; Arinez, J.; Xiao, G. Market demand oriented data-driven modeling for dynamic manufacturing system control. IEEE Trans. Syst. Man Cybern. Syst. 2014, 45, 109–121. [Google Scholar] [CrossRef]
- Tannock, J.; Cao, B.; Farr, R.; Byrne, M. Data-driven simulation of the supply-chain-insights from the aerospace sector. Int. J. Prod. Econ. 2007, 110, 70–84. [Google Scholar] [CrossRef]
- Cavalcante, I.M.; Frazzon, E.M.; Forcellini, F.A.; Ivanov, D. A supervised machine learning approach to data-driven simulation of resilient supplier selection in digital manufacturing. Int. J. Inf. Manage. 2019, 49, 86–97. [Google Scholar] [CrossRef]
- Goodall, P.; Sharpe, R.; West, A. A data-driven simulation to support remanufacturing operations. Comput. Ind. 2019, 105, 48–60. [Google Scholar] [CrossRef]
- Maman, Z.S.; Yazdi, M.A.A.; Cavuoto, L.A.; Megahed, F.M. A data-driven approach to modeling physical fatigue in the workplace using wearable sensors. Appl. Ergon. 2017, 65, 515–529. [Google Scholar] [CrossRef]
- Wy, J.; Jeong, S.; Kim, B.-I.; Park, J.; Shin, J.; Yoon, H.; Lee, S. A data-driven generic simulation model for logistics-embedded assembly manufacturing lines. Comput. Ind. Eng. 2011, 60, 138–147. [Google Scholar] [CrossRef]
- Ojstersek, R.; Buchmeister, B. Simulation Modeling Approach for Collaborative Workplaces’ Assessment in Sustainable Manufacturing. Sustainability 2020, 12, 4103. [Google Scholar] [CrossRef]
- Cabral, R.; Furukawa, Y. Piecewise planer and compact floorplan reconstruction form images. In Proceedings of the 2014 IEEE Conference on Computer Vision and Pattern Recognition, Columbus, OH, USA, 23–28 June 2014. [Google Scholar] [CrossRef]
- Gajsek, B.; Marolt, J.; Rupnik, B.; Lerher, T.; Sternad, M. Using maturity model and discrete-event simulation for Industry 4.0 implementation. Int. J. Simul. Model. 2019, 18, 488–499. [Google Scholar] [CrossRef]
- Barazzetti, L.; Previtali, M.; Roncoroni, F. Can we use low-cost 360 degree cameras to create accurate 3D models? Int. Arch. Photogramm. Remote Sens. Spat. Inf. Sci. 2018, 42, 69–75. [Google Scholar] [CrossRef]
- Jebur, A.; Abed, F.; Mohammed, M. Assessing the performance of commercial Agisoft PhotoScan software to deliver reliable data for accurate3D modelling. In Proceedings of the 3rd International Conference on Buildings, Cosntruction and Environmental Engineering, Sharm el-Shiekh, Egypt, 23–25 October 2017. [Google Scholar] [CrossRef]
- Vujica Herzog, N.; Harih, G. Decision support system for designing and assigning ergonomic workplaces to workers with disabilities. Ergonomics 2020, 63, 225–236. [Google Scholar] [CrossRef] [PubMed]
- Zhang, Y.; Wu, X.; Gao, J.; Chen, J.; Xv, X. Simulation and ergonomic evaluation of welders’ standing posture using Jack software. Int. J. Environ. Res. Public Health 2019, 16, 4354. [Google Scholar] [CrossRef] [PubMed]
- Kee, D.; Karwowski, W. A comparison of three observational techniques for assessing postural loads in industry. Int. J. Occup. Saf. Ergon. 2007, 13, 3–14. [Google Scholar] [CrossRef] [PubMed]
- McAtamney, L.; Corlett, E.N. RULA: A survey method for the investigation of work-related upper limb disorders. Appl. Ergon. 1993, 24, 91–99. [Google Scholar] [CrossRef]
© 2020 by the authors. Licensee MDPI, Basel, Switzerland. This article is an open access article distributed under the terms and conditions of the Creative Commons Attribution (CC BY) license (http://creativecommons.org/licenses/by/4.0/).


