Article

The Influence of Radial Stress on Mechanical Properties of Anchorage Structure

Colellege of Resources, Shandong University of Science and Technology, Tai’an 271019, China
*
Author to whom correspondence should be addressed.
Appl. Sci. 2020, 10(20), 7029; https://doi.org/10.3390/app10207029
Submission received: 10 May 2020 / Revised: 26 September 2020 / Accepted: 9 October 2020 / Published: 10 October 2020
(This article belongs to the Section Civil Engineering)

Abstract

:
The research on the influence of radial stress on the mechanical properties of an anchorage structure has important theoretical and practical significance for optimizing the design of anchorage structures and saving support cost. Firstly, based on the phenomenon of concrete splitting found in the laboratory model test, the influence of radial stress on the mechanical properties of an anchorage structure is analyzed. Secondly, using the criterion of maximum tensile stress and the Mohr–Coulomb criterion, the influence of radial stress on the mechanical properties of rock around the borehole is analyzed. Finally, the influence of radial stress on the shear stress at interface and the ultimate bearing capacity of the anchorage structure is studied by numerical simulation. The results show that the existence of radial stress in the anchorage section greatly improves the bearing capacity of the anchorage structure. With the increase of confining pressure, the maximum value of interfacial shear stress increases obviously. The larger the confining pressure is, the faster the convergence speed of the finite element method (FEM) program is, which shows that the mechanical properties of the anchorage structure are improved obviously. With the increasing confining pressure, the adaptability of the anchorage structure to deformation is stronger and the anchorage structure is less likely to fail. The ultimate bearing capacity of the anchorage structure increases linearly with the increase of confining pressure, and the effect of confining pressure on the ultimate bearing capacity is very significant.

1. Introduction

Since the 1960s, anchorage structure, as a temporary and permanent reinforcement component, has been widely used in civil engineering and mining engineering [1,2,3,4,5,6]. The main components of an anchorage system are the tendon, an anchorage head assembly, and the grouting body. The tendon is generally made of steel, while the grouting body is usually made of resin or cement mixture [7]. The tensile anchorage structure mainly provides the anchorage force needed in the engineering support through the shear stress between the bolt and grouting body, as well as between the grouting body and surrounding rock mass. The schematic diagram of the anchorage system is shown in Figure 1. Therefore, most of the observed anchoring failures in practice occur at one of the two interfaces: Bolt-grout and rock-grout interfaces [8,9,10]. In the design of the tensile anchorage structure, the determination of the anchorage length is one of the most critical problems in anchorage design. However, the determination of anchorage length is mainly controlled by the shear stress of these two interfaces. How to determine the anchorage length of the anchorage structure is a challenge for designers. The key to solve this problem is how to obtain the distribution of interfacial shear stress. Since the anchorage structure has been used in engineering, many scholars have carried out relevant research works in this field. There is no doubt that the material properties and surface shape of a bolt, the mechanical properties of the grouting body and rock, and the size and roughness of a borehole have a great influence on the shear stress distribution at the interfaces of anchorage structure [10,11,12,13,14,15,16,17,18,19,20,21,22]. However, it is undeniable that the radial stress of the interface has a significant effect on the interfacial shear stress because at the bolt-grout and grout-rock interfaces, the initiation and growth of debonding involves frictional sliding. Kaiser P.K. et al. [23] also believed that the bond strength of fully grouted cable bolts was primarily frictional, which depended on the pressure at the cable-grout interface. Similarly, many scholars have reached the same conclusion [1,14,24].
In specific engineering practice, the current design codes have a minimum requirement for the buried depth of the anchorage section of an anchorage structure. For example, according to the “Technical Code for Building Slope Engineering” [11], the thickness of the overburden soil layer of anchorage section should not be less than 4 m, and the thickness of the overburden rock should not be less than 2 m and the “Technical Specification for Retaining and Protection of Building Foundation Excavations” [25] also stipulates that the thickness of the overburden soil layer of anchorage section should not be less than 4 m, while in the “Technical Specification for Ground Anchors” [26], the value should not be less than 4.5 m. The purpose of the above codes to limit the minimum thickness of overburden layer is to ensure that there is enough confining pressure around the anchorage section, which is the premise that the interface of anchorage structure can provide the anchorage force. In the specific design of the anchorage structure, it is difficult to quantitatively consider the beneficial effect of confining pressure caused by the thickness of the overburden layer, which may lead to a relatively conservative design.
In conclusion, the radial stress acting on the interface of anchorage section has a significant effect on the interfacial shear stress. Surprisingly, there are relatively few studies on this aspect. In this study, according to the phenomenon of the splitting failure of samples found in the laboratory test, the influence of radial stress on the mechanical properties of the anchorage structure is studied by theoretical analysis and numerical simulation. The results show that the radial stress can improve the mechanical properties of the anchorage structure and the overall bearing capacity of the anchorage system. This study may provide a practical reference for optimizing the design of the anchorage structure and save on the support cost.

2. Experimental Programs

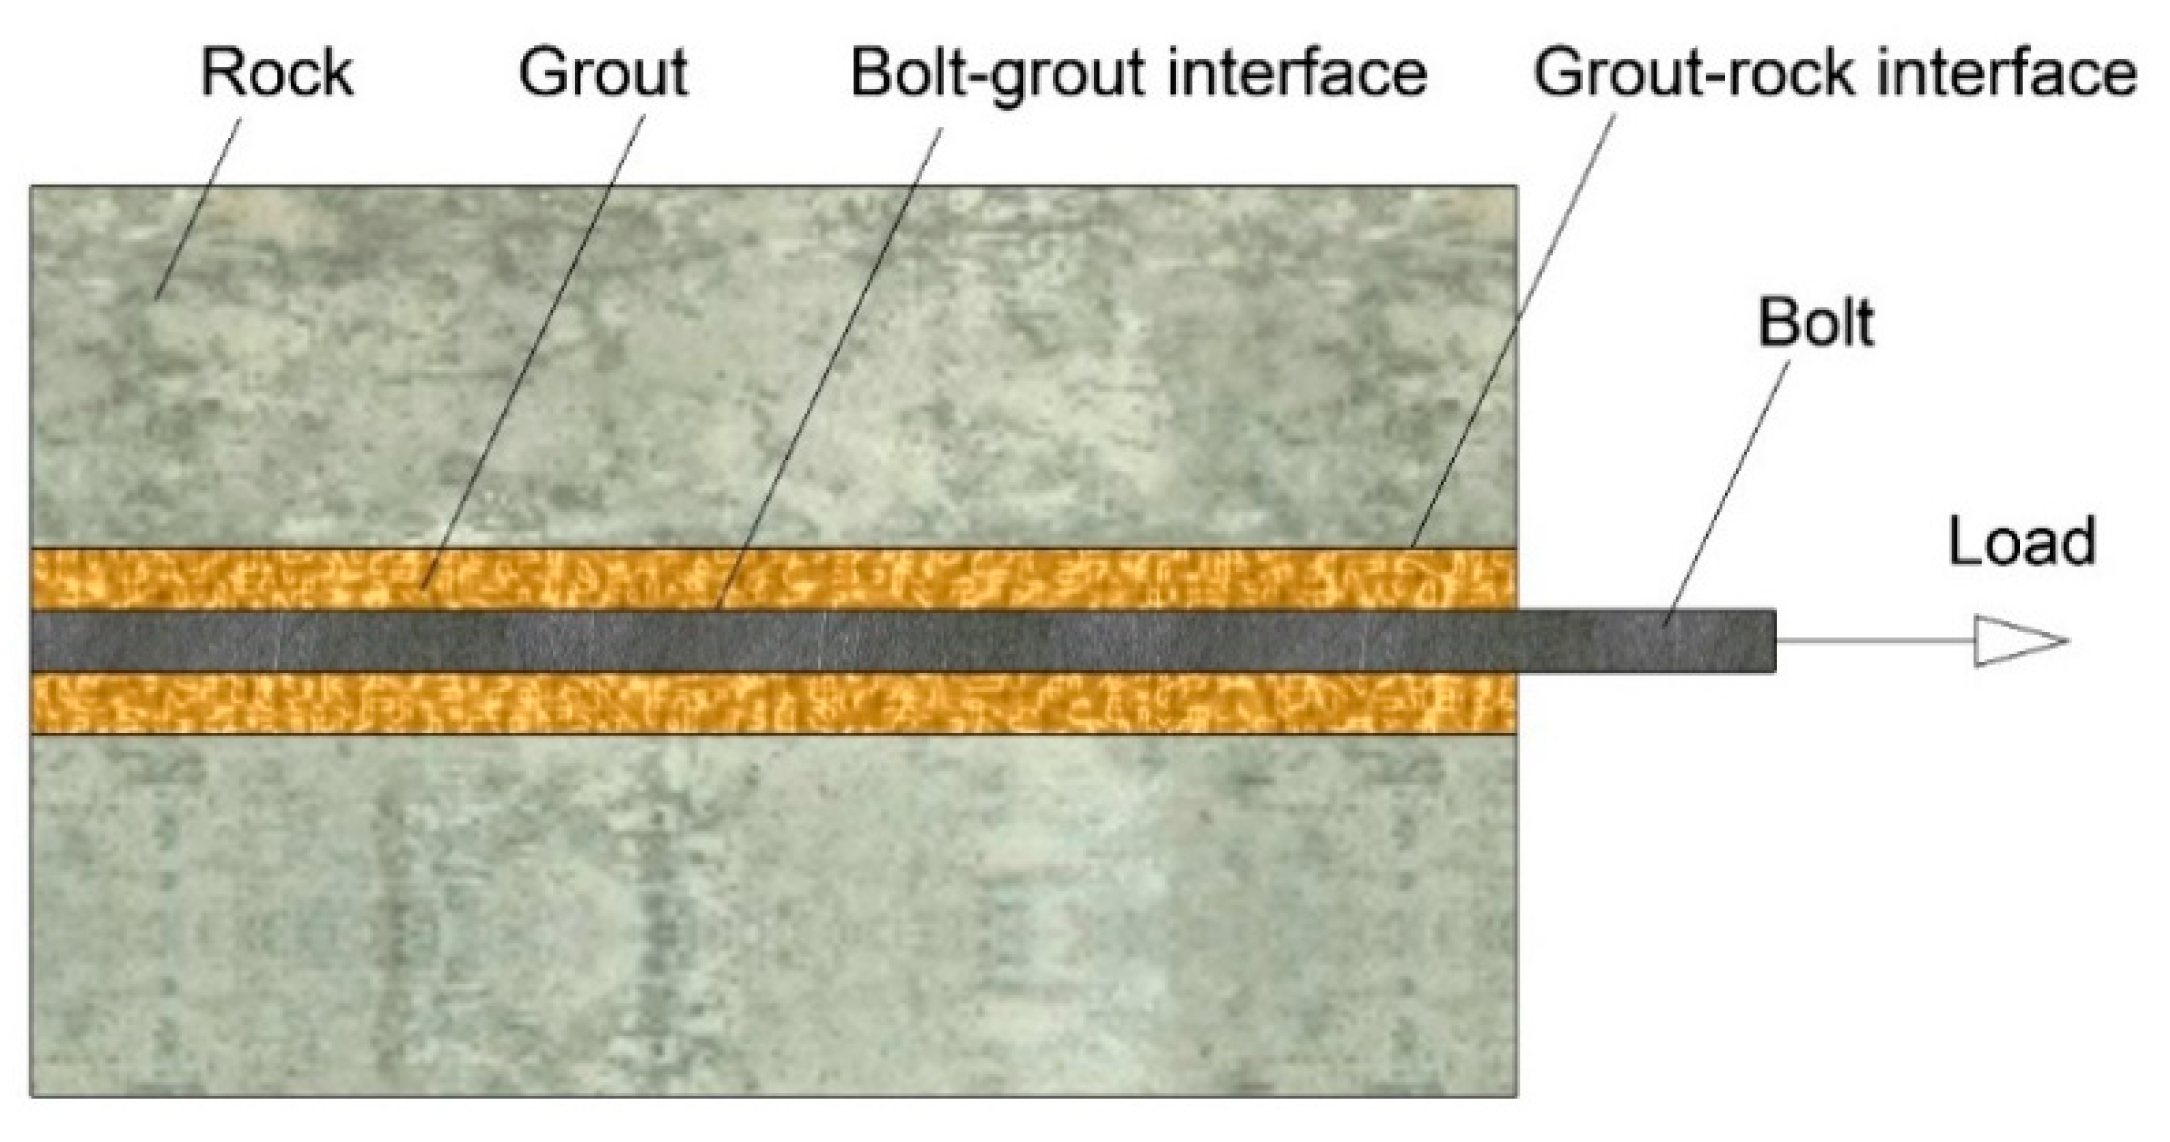
2.1. Samples Preparation

In this study, a new set of mold was developed to make samples, as shown in Figure 2a. Two thin-walled cylinders were assembled together with two sets of jointed bolts to form a cylinder. A galvanized steel tube was placed in the center of the cylinder, which was used to reserve drilling hole when pouring concrete. Three M16 rods were embedded in the concrete sample, which were connected with the steel plate at the bottom. A pull rod was welded at the center of the steel plate, and the pull rod was on the same axis with the rockbolt anchored in the sample. Concrete was used to model the rock and the sample after pouring, as shown in Figure 2b. Concrete cylinders of 200 mm in diameter and 300 mm, 250 mm, 200 mm and 150 mm respectively in length containing a 40 mm diameter borehole were used. The same batch of concrete was also poured with 150 mm×150 mm×150 mm cube test pieces, and the mechanical parameters of the concrete measured after 28 days of curing are shown in Table 1. The grouting material used in this test was cement mortar with a cement-sand ratio of 1:0, 1:1, and 1:3, respectively. The cement was ordinary Portland cement and the sand was fine quartz sand. The bolt was simulated with steel bar HRB335 with a diameter of 16 mm. Each sample was numbered according to anchorage length and cement-sand ratio, as shown in Table 2. Only 1 test for each condition was performed in the test.

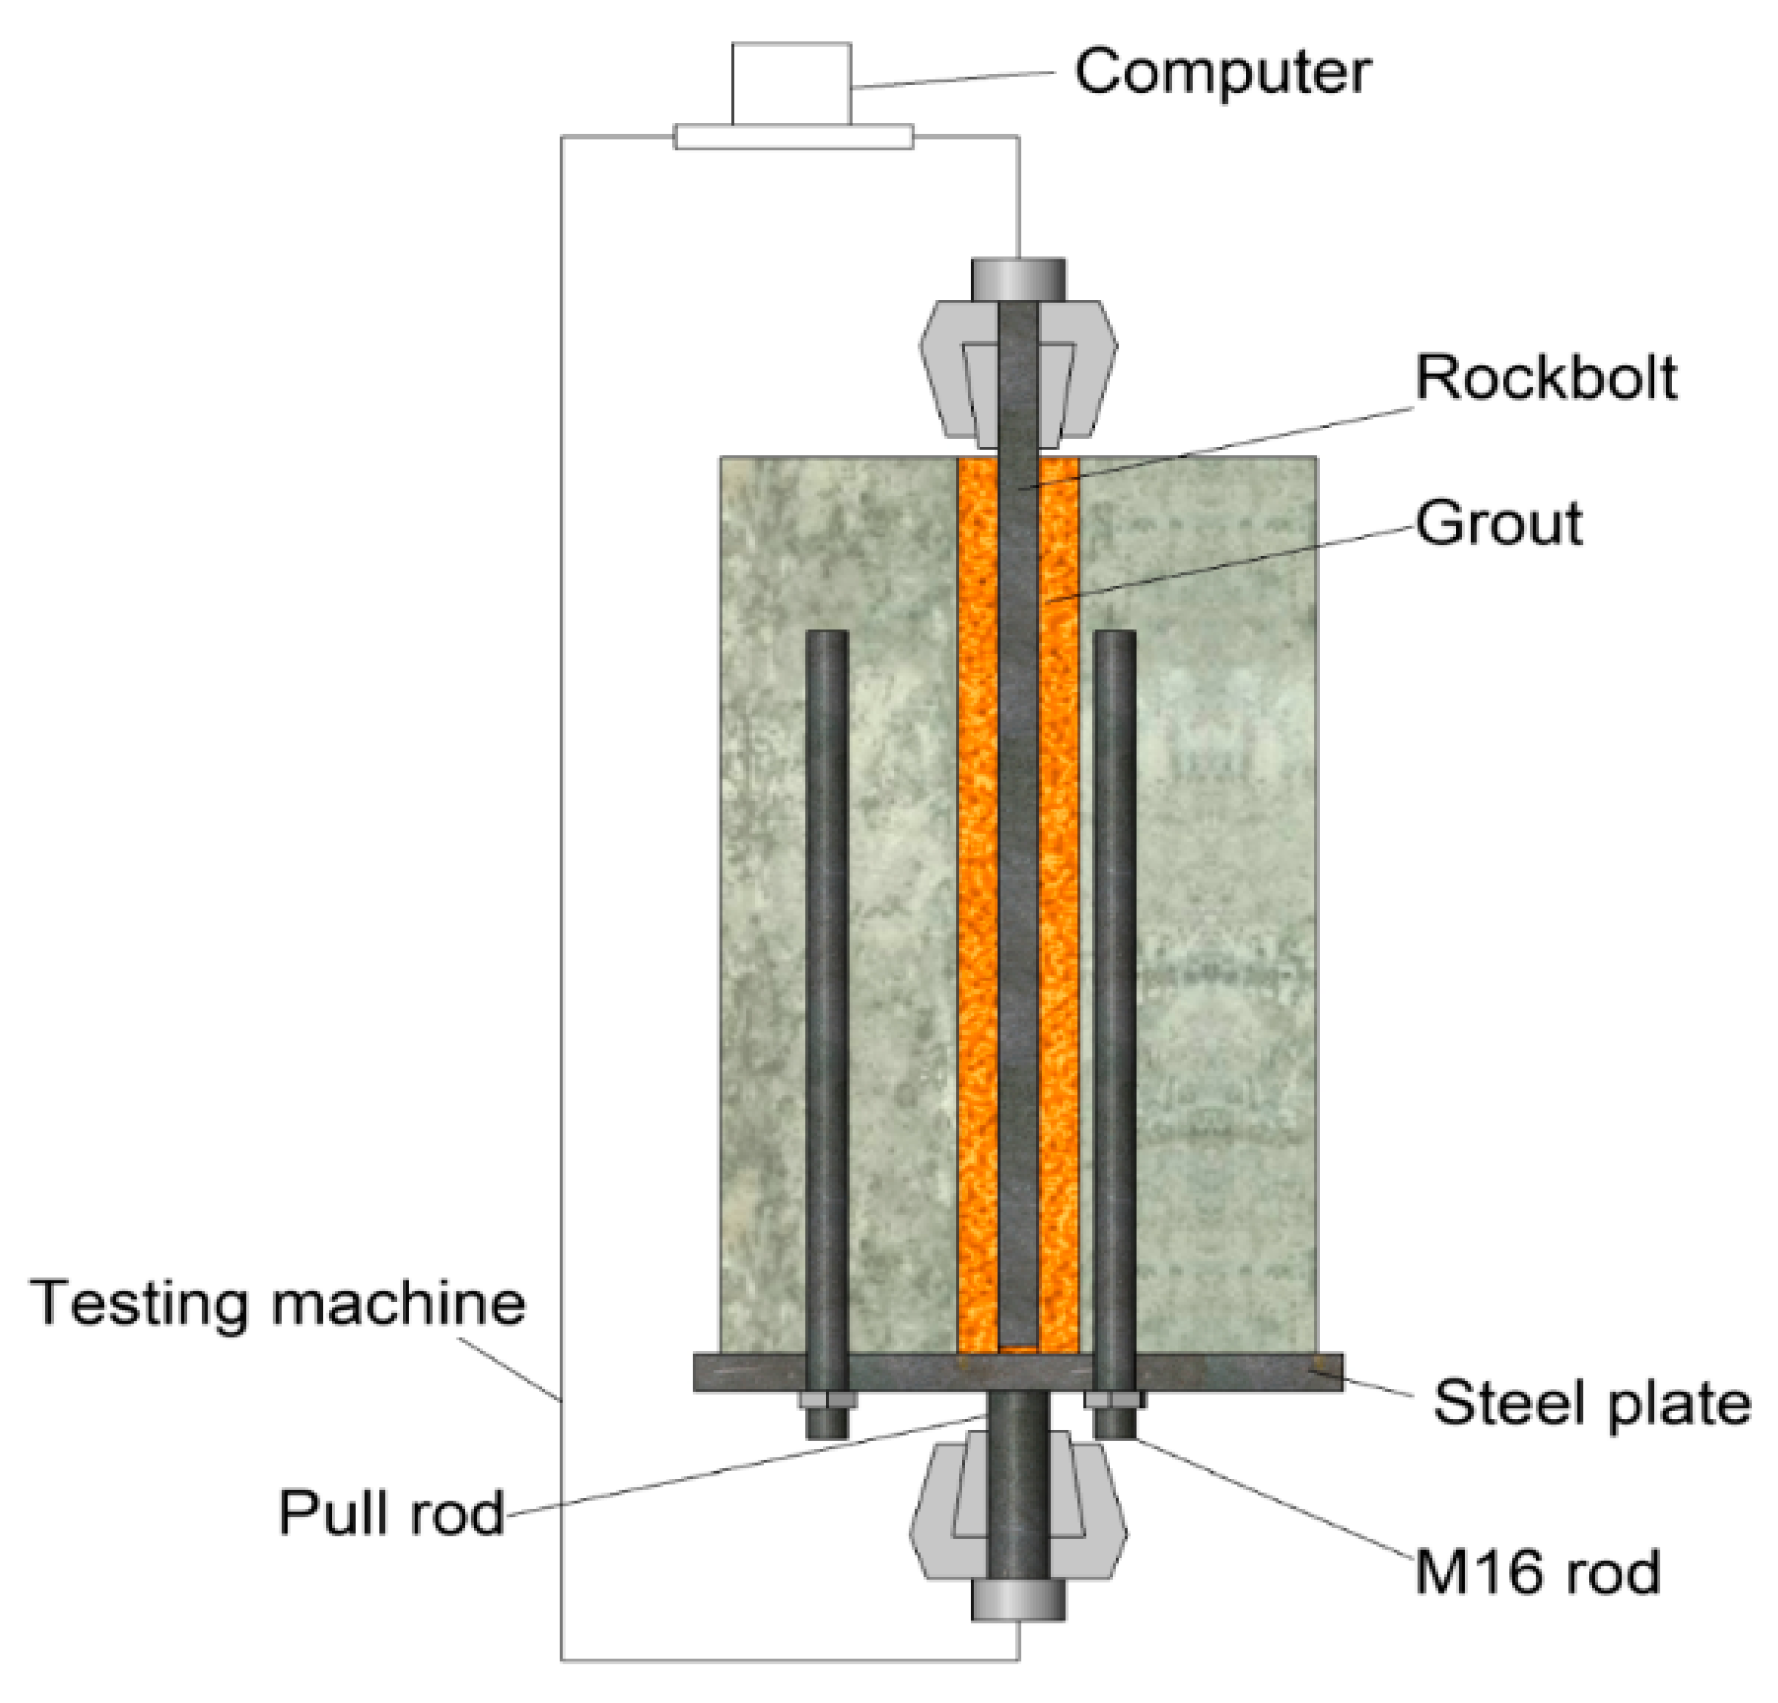
2.2. Testing Procedure

This test was carried out using an electronic universal-testing machine (WDW-100A) produced by Jinan Time Shijin Testing Machine Group Co., Ltd., Jinan, China. The load and deformation measurement system of the MTS company was used in the test system. The principal components of a pullout test are shown in Figure 3. During the pullout test, the computer automatically monitors and records the axial load and axial displacement in order to utilize the test results.

2.3. Results of the Tests

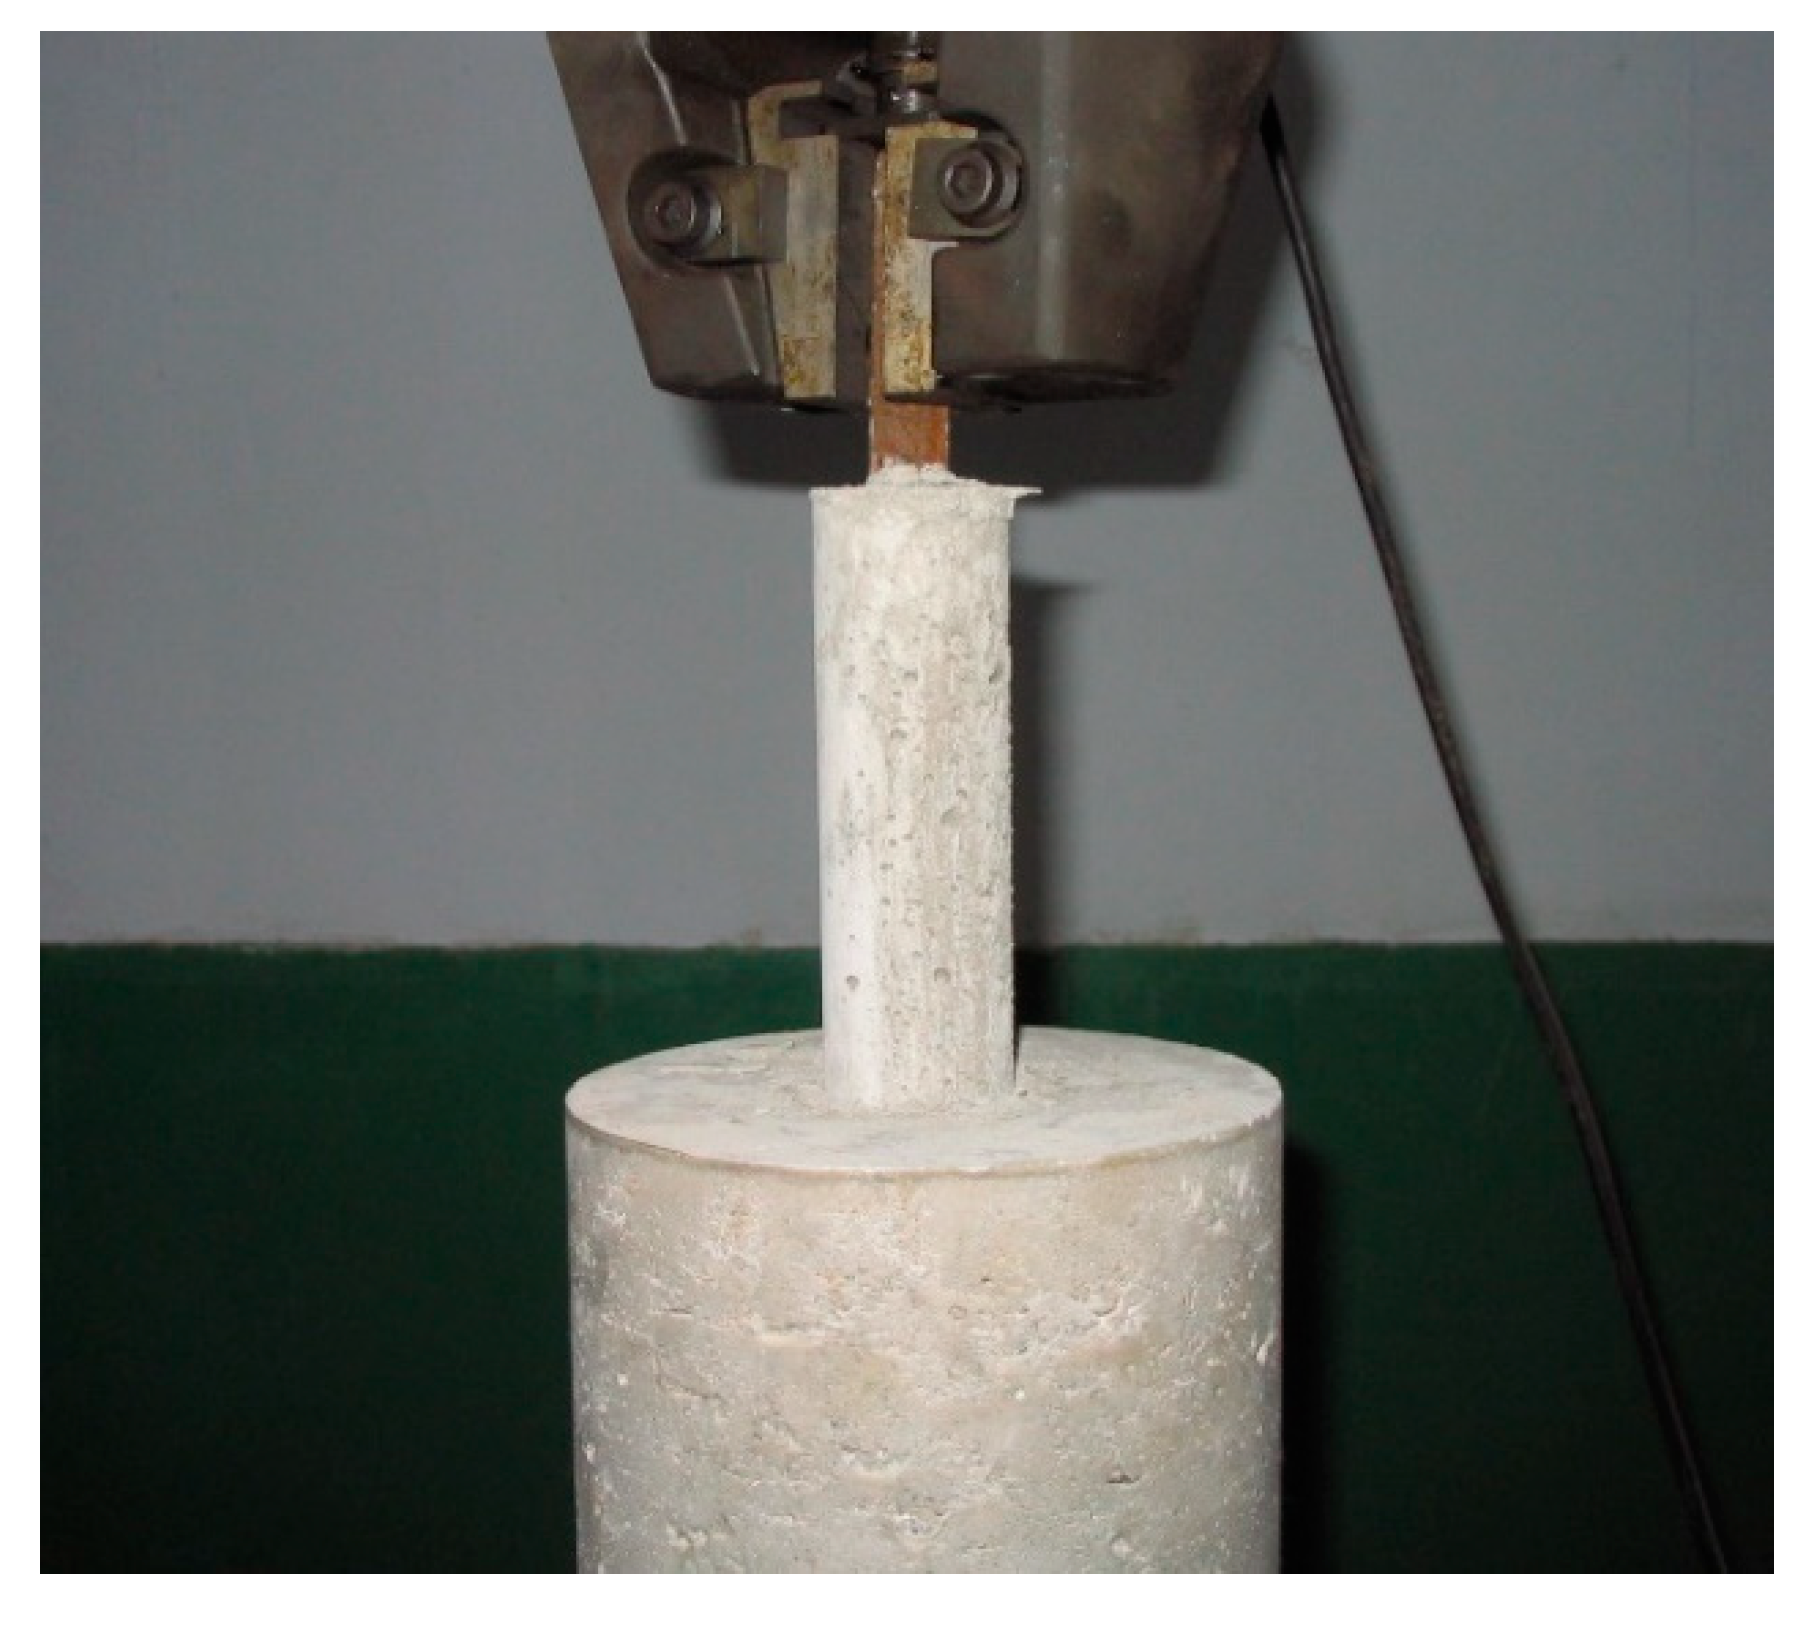
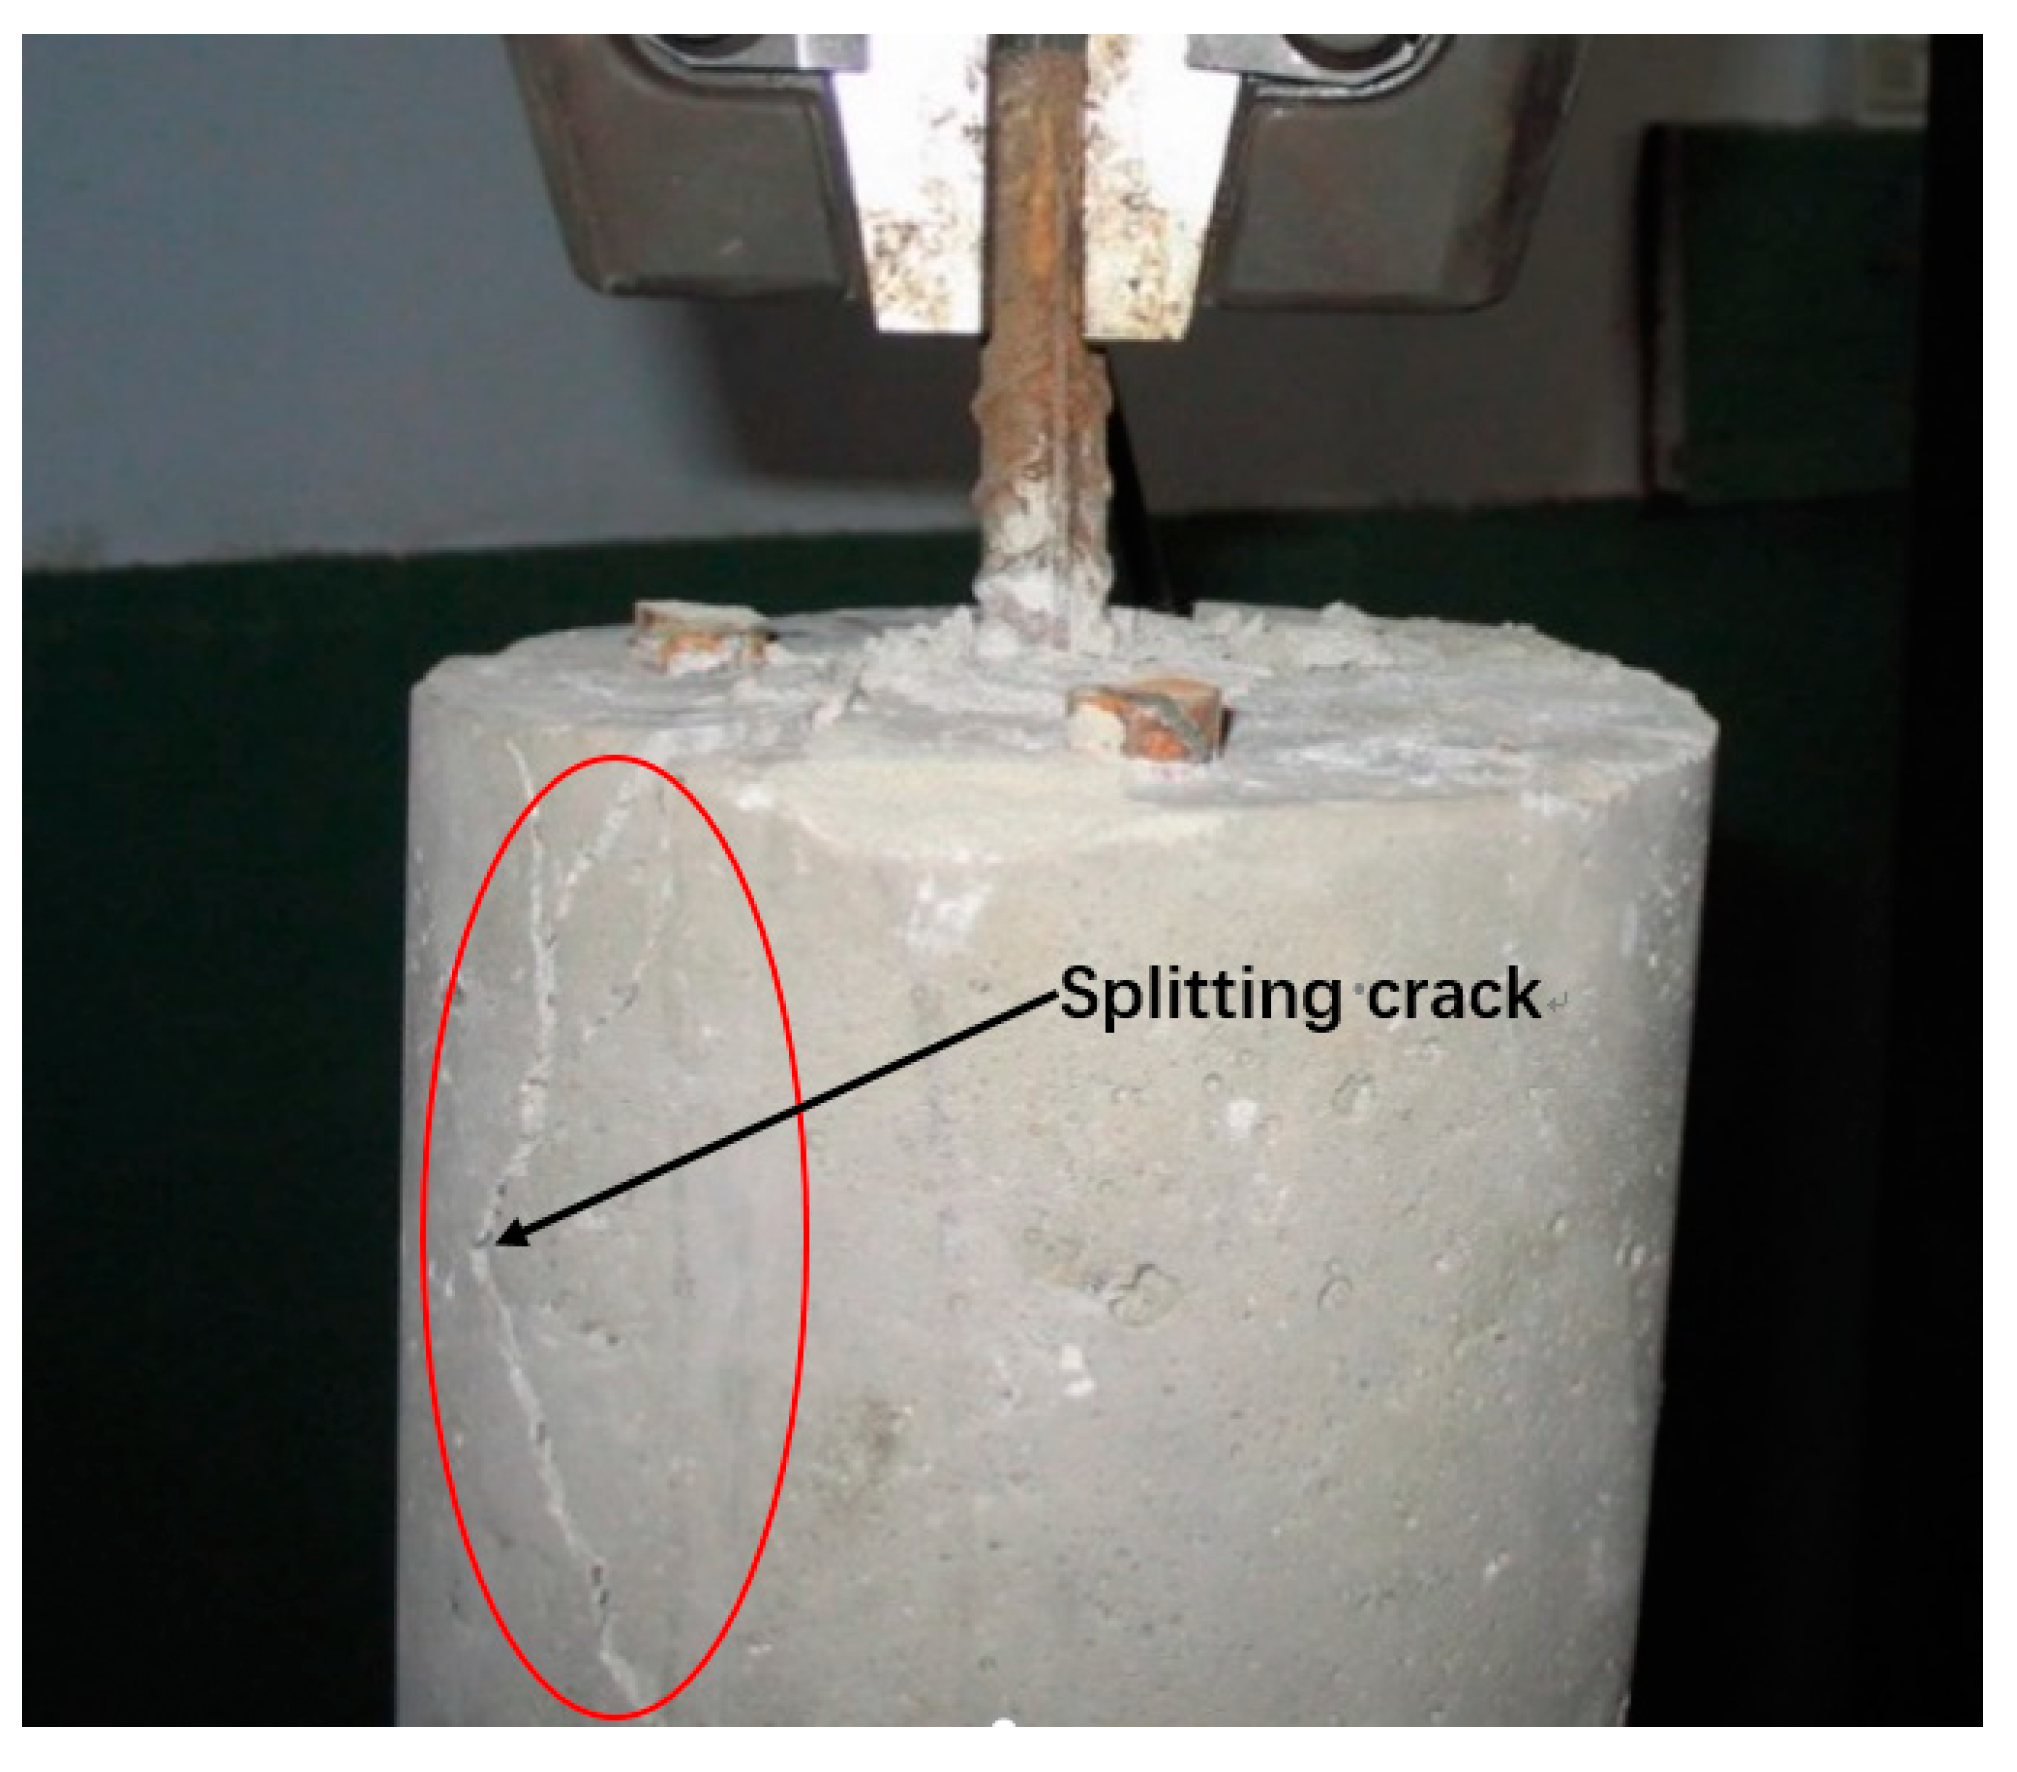
2.3.1. The Failure Modes of Samples

The failure modes of all samples in the test are listed in Table 3. Under the condition of this test, there are only two failure modes, one is the debonding failure between the grouting body and concrete, the other is the splitting of the concrete. Debonding failure refers to the bolt and grouting body as a whole are pulled out from the concrete (as shown in Figure 4). Splitting failure refers to the cracking of the concrete before the bolt and grouting body are pulled out (as shown in Figure 5), and the whole anchorage structure loses its bearing capacity.

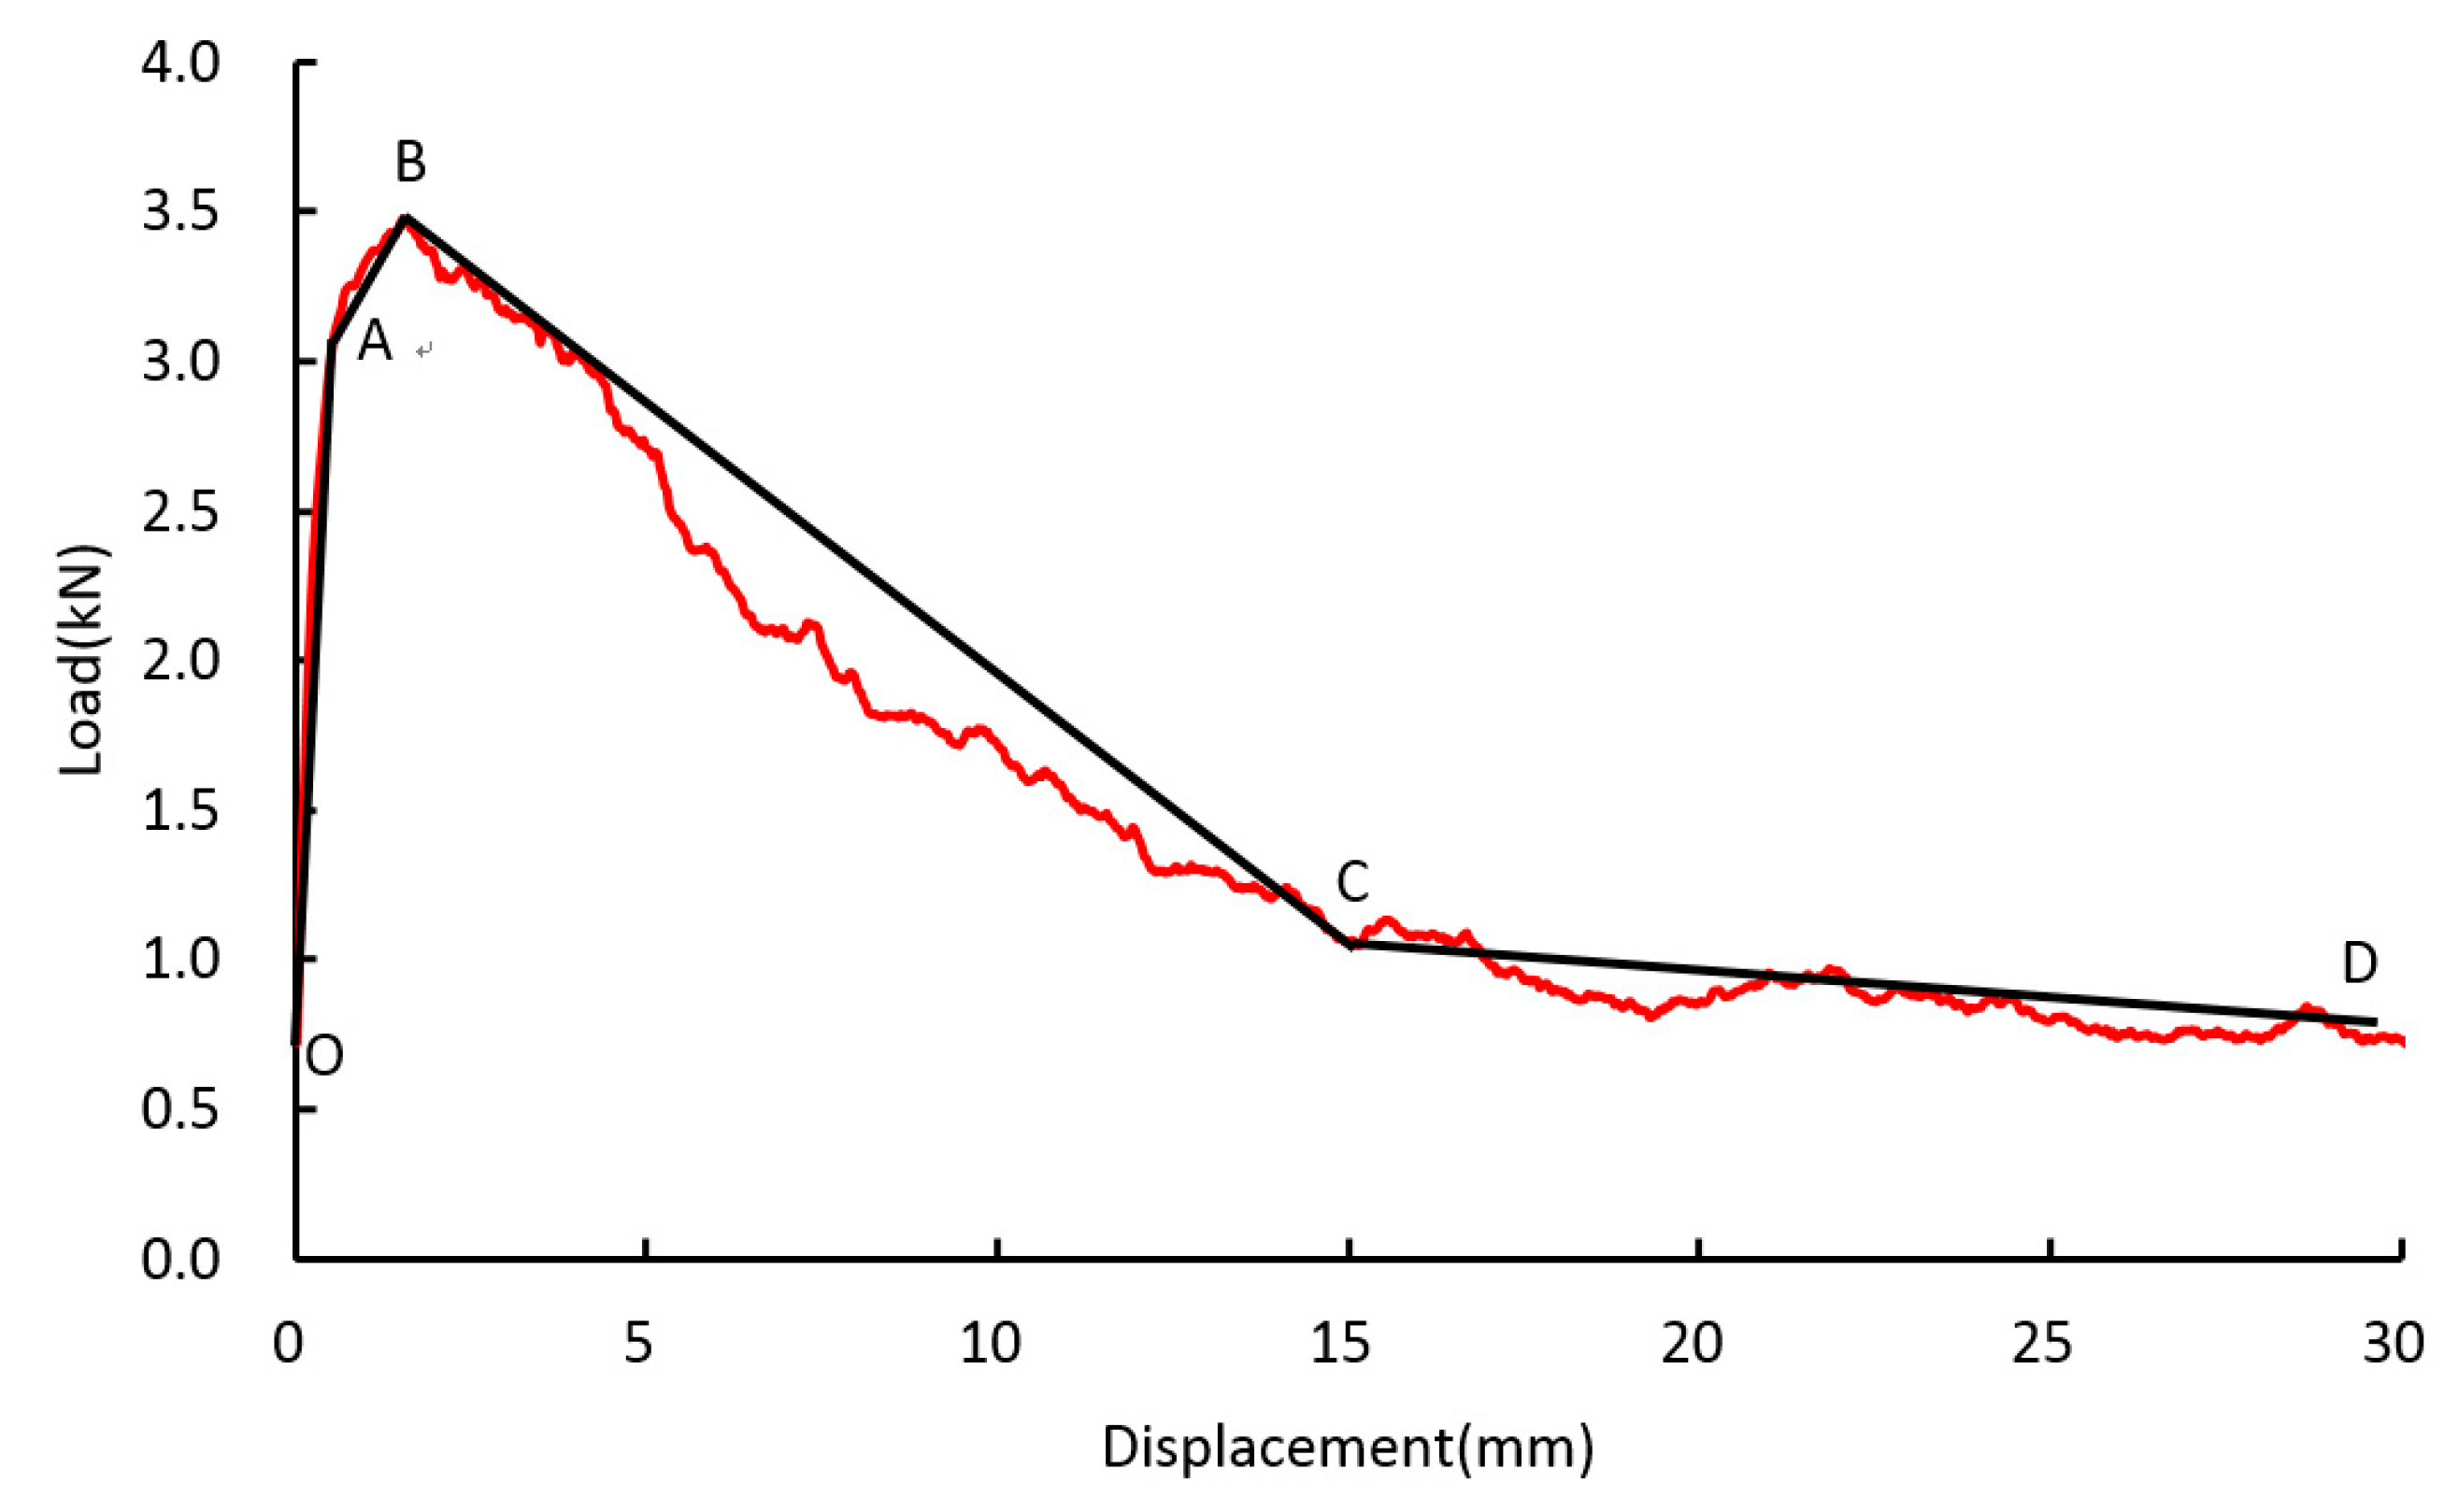
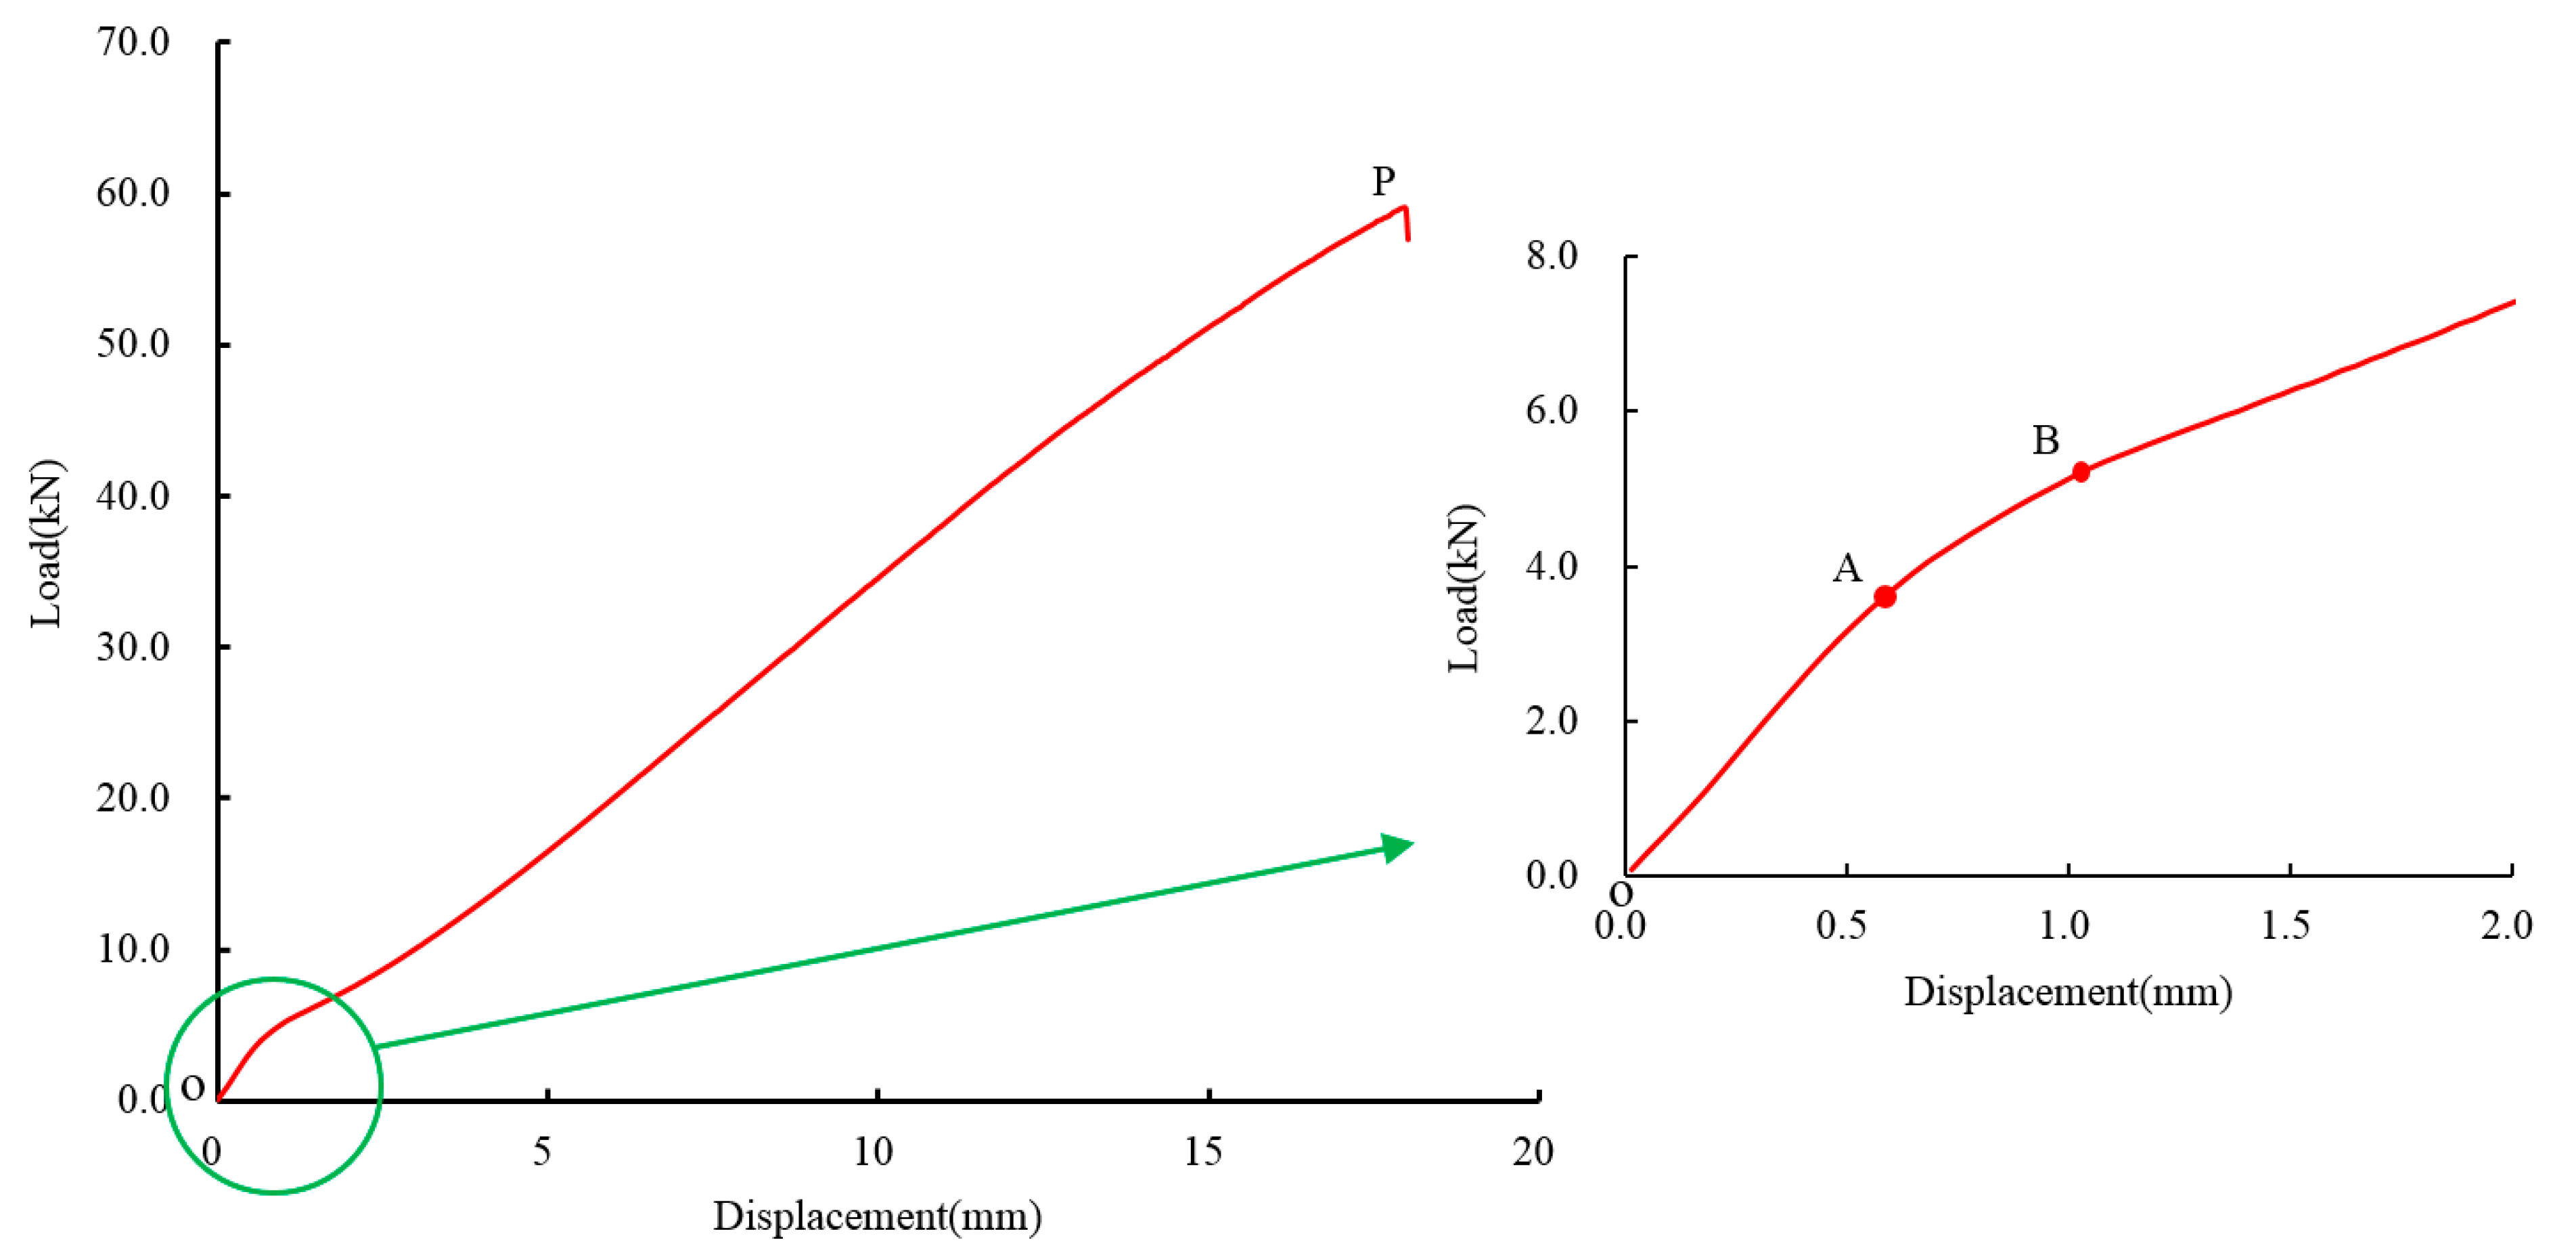
2.3.2. Typical Load-Displacement Curves

As seen from Figure 6, the typical load-displacement curve of debonding failure goes through four stages: Linear stage (OA), hardening stage (AB), softening stage (BC), and frictional force stage (CD).
Figure 7 shows the typical load-displacement curve of splitting failure (sample 2-3). Comparing that with Figure 6, it can be seen that the trend of the two is similar before point B, and the corresponding loads of points A and B are also close. From point B, the interface between the grouting body and concrete begins to appear debonding. The curve of splitting failure does not soften like the curve of debonding failure, but with the increase of displacement, the load continues to increase until the peak point P. At this time, the pullout load of anchorage structure reaches 59 kN, which is more than ten times larger than the ultimate load of 3.5 kN when the interface is debonding in Figure 6.
Figure 6 and Figure 7 are load-displacement curves of sample 2-0 and sample 2-3 respectively. There is no difference between them except the sand content of grouting materials. However, the failure modes of the two are different and the difference of their ultimate loads is more than expected. After further analysis of the failure mode of the samples, it is found that the majority of the samples with splitting failure are those with more sand content in the cement mortar. The main reason for this phenomenon is that interface debonding begins to appear between the grouting body and concrete and the relative sliding occurs with the increase of the pullout load. At this time, the dilatancy effect will occur at the interface between the grouting body and concrete. As the interface roughness of the grouting body with sand content is higher, the dilatancy effect is more obvious. The interface between the grouting body with high sand content and the concrete produces a larger dilatancy in the radial direction of anchorage section, which directly leads to the increase of normal stress at the interface. The increase of normal stress directly improves the shear strength of the interface, which will greatly improve the ultimate bearing capacity of the anchorage structure. Under these test conditions, there is no radial confining pressure or restraint around the concrete. When the tensile stress caused by the radial stress around the borehole exceeds the tensile strength of the concrete, the concrete is split. It is not difficult to see from the load-displacement curves of the failure samples that when the stress reaches the peak value, the anchorage structure “suddenly collapses” due to the splitting failure of the concrete, which completely loses the bearing capacity.
Table 4 shows the failure loads of samples with 1:0 and 1:3 cement-sand ratio under the same anchorage length. From the above failure modes and test data, it is not difficult to find out that the higher the sand content in the grouting body under the same conditions, the greater the failure load of the sample. On the face of it, all the differences are affected by the sand content in the grouting body. In fact, the interface roughness of the grouting body with high sand content is high, which makes the radial stress on the interface due to dilatancy increase significantly. It is conceivable that if a certain confining pressure is applied around the sample, the ultimate bearing capacity of the entire anchorage structure will be higher.
In conclusion, the existence of radial stress in the anchorage section can significantly improve the bearing capacity of anchorage structure. Similar phenomena have been reported in the experimental studies conducted by other scholars. Rong et al. [27] pointed out that there are compression, dilatancy, and shear failure at the bolt-grout interface and bond strength is enhanced significantly, which is the reason why the bond strength of thread steel bolt is higher. A large number of studies show that the radial confining pressure increases with the increase of applied load because of the lateral deformation resistance provided by the surrounding rock stiffness [1,14]. The soft rock with low radial stiffness will not produce enough radial constraint, which will lead to the development of radial crack. On the contrary, the hard rock will produce relatively high radial stiffness, thus inhibiting the development of radial crack, which will significantly improve the bearing capacity of anchorage structure [7]. Based on the above analysis, it is not difficult to find that the radial stress has a significant impact on the bearing capacity of anchorage structure, and its improvement on the bearing capacity of anchorage structure should not be neglected in practical engineering applications.

3. Theoretical Methods

The stress characteristics of the rock around the borehole in the anchorage structure are the same as those of the thick-walled cylinder. The thick-walled cylinder can be used to simulate the stress characteristics of the rocks around the borehole, as shown in Figure 8. According to the elastic theory, the tangential stress σ θ and radial stress σ r of the thick-walled cylinder are respectively (it should be pointed out that the compressive stress is positive in the following Equations):
σ θ = P 2 R 2 2 P 1 R 1 2 R 2 2 R 1 2 + ( P 2 P 1 ) R 2 2 R 1 2 r 2 ( R 2 2 R 1 2 ) ,
σ r = P 2 R 2 2 P 1 R 1 2 R 2 2 R 1 2 ( P 2 P 1 ) R 2 2 R 1 2 r 2 ( R 2 2 R 1 2 ) ,
where, r is the radial distance, m; P 1 and P 2 are the inner and external wall pressure acting on the thick-walled cylinder respectively, MPa; and R 1 and R 2 are the inner and outer diameters of the thick-walled cylinder respectively, m. According to Equations (1) and (2), the radial stress and tangential stress of thick-walled cylinder in elastic state are both functions of r , independent of mechanical parameters such as the elastic modulus and Poisson’s ratio of materials. The radial stress σ r increases with the increase of r , while the tangential stress σ θ decreases with the increase of r .

3.1. Analysis Using the Criteria of Maximum Tensile Stress

In this section, according to Equations (1) and (2), the stress on the inner wall of the borehole is analyzed and the influence of the confining pressure of the anchorage section on the mechanical properties of the rock around the borehole ( r = R 1 ) is discussed. According to the boundary conditions, since the radial stress on the borehole wall is always in equilibrium with P 1 , and σ r = P 1 at the borehole wall ( r = R 1 ) is always unchanged.
(1) Assuming P 2 = 0 , that is to say, the inner wall of the borehole is only affected by the radial stress P 1 caused by dilation. According to Equations (1) and (2), the following Equation can be obtained:
σ θ = P 1 R 2 2 + R 1 2 R 2 2 R 1 2 .
The radial and tangential stresses around the borehole are shown in Figure 9. As can be seen from the Figure, when the effect of confining pressure P 2 is not considered around the anchorage section and the inner wall of the borehole is only subjected to the radial stress, the tangential stress σ θ < 0 . That is to say, the stress on the rock of the borehole wall is the tensile stress. When the tangential stress caused by dilatation on the borehole wall exceeds the tensile strength σ t of the rock, i.e., P 1 R 2 2 + R 1 2 R 2 2 R 1 2 > R t , the rock will be fractured.
(2) When the confining pressure of anchorage section is P 2 0 , the tangential stress at the borehole wall can be obtained according to Equation (1):
σ θ = P 1 R 2 2 + R 1 2 R 2 2 R 1 2 + 2 P 2 R 2 2 R 2 2 R 1 2 .
Compared with Equations (3) and (4), when P 2 0 , the tangential stress on the rock of borehole wall increases 2 P 2 R 2 2 R 2 2 R 1 2 . In this case, the tensile stress of the rock is reduced, which is undoubtedly beneficial for rock materials with tensile strength far less than compressive strength. When the confining pressure P 2 increases to a certain value and reaches σ θ > 0 , the tangential stress of the rock around the borehole changes from tensile stress to compressive stress. Obviously, this will greatly improve the mechanical properties of the rock, the probability of rock splitting failure is greatly reduced, and the bearing capacity of anchorage structure will be greatly improved.

3.2. Analysis Using the Mohr–Coulomb Criterion

Mohr–Coulomb strength theory can also be used to analyze the improvement of the mechanical properties of the rock around the borehole caused by confining pressure. Equation (5) is the Mohr–Coulomb formula, as shown in Figure 9.
τ = σ tan φ + c ,
where, τ is shear stress, MPa; σ is normal stress, MPa; φ is the internal friction angle, degree; and c is the cohesion, MPa.
  • When P 2 = 0 , P 1 0 , the radial stress σ r and tangential stress σ θ of the rock are shown in Figure 9 at the inner wall of the borehole. Since there is no shear stress, σ r is the first principal stress, i.e., σ 1 = σ r = P 1 , and σ θ is the third principal stress, i.e., σ 3 = σ θ = P 1 R 2 2 + R 1 2 R 2 2 R 1 2 . And then the Mohr’s circle M 1 corresponding to σ 1 and σ 3 can be drawn in the σ τ coordinate system. The relative relationship between the Mohr’s circle M 1 and the Mohr–Coulomb strength line is shown in Figure 9. Under the conditions of P 2 = 0 and P 1 0 , if the rock strength is good, Mohr’s circle is neither tangent to nor intersecting with the strength line, indicating that the rock has not been damaged. If the rock is of low strength, the Mohr’s circle may be tangent to or intersect with the strength line under this condition, and the rock will break down.
  • If a certain confining pressure is applied to the anchorage section, that is, P 2 0 and P 1 0 . According to Equations (2) and (4), σ 1 = σ r 2 = P 1 , σ 3 = σ θ 2 = P 1 R 2 2 + R 1 2 R 2 2 R 1 2 + 2 P 2 R 2 3 R 2 2 R 1 2 , and the Mohr’s circle under this condition is M 2 , as shown in Figure 9. Compared with M 1 , the position of σ 1 is fixed, the value of σ 3 moves to the positive direction of σ axis, and the diameter of M 2 decreases obviously. Therefore, the Mohr’s circle M 2 is gradually away from the strength line of the rock. In this case, compared with the stress state of Mohr’s circle M 1 , the rock is less likely to be damaged.
  • Continue to increase the confining pressure P 2 of anchorage section, when P 2 increases to a value that makes P 1 R 2 2 + R 1 2 R 2 2 R 1 2 < 2 P 2 R 2 2 R 2 2 R 1 2 . According to Equation (4), σ 3 = σ θ 3 = P 1 R 2 2 + R 1 2 R 2 2 R 1 2 + 2 P 2 R 2 3 R 2 2 R 1 2 > 0 , σ 1 = σ r 3 = P 1 . In this stress state, since both principal stresses are greater than zero, the Mohr’s circle M3 as a whole has been in the positive axis range of the σ -axis. In this case, the Mohr’s circle M3 is far away from the rock strength line, the two main stresses on the rock around the borehole wall are all compressive stresses. The mechanical properties of the rock are obviously improved, and it is more difficult to damage.
In conclusion, through the analysis of the maximum tensile stress theory and the Mohr–Coulomb strength theory, it is shown that with the increase of the confining pressure of the anchorage section, the stress state of the rock around the borehole is significantly improved. The larger the confining pressure of anchorage section, the less likely the rock is to be damaged under the same conditions. It can be seen that the confining pressure of anchorage section can improve the bearing capacity of anchorage structure mainly in the following two aspects:
  • The confining pressure acting on the anchorage section can be transferred to the interface of anchorage structure. The increase of normal stress will inevitably greatly improve the interfacial shear stress, which will definitely increase the bearing capacity of anchorage structure;
  • The existence of the confining pressure in the anchorage section improves the mechanical properties of the rock around the borehole obviously. When the dilatancy occurs at the interface of anchorage structure, the rock is not easy to split. The radial stress produced by the shear expansion acts directly on the normal direction of the interface, which greatly improves the shear stress strength of the interface, thus greatly improving the ultimate bearing capacity of anchorage structure.

4. Numerical Simulation

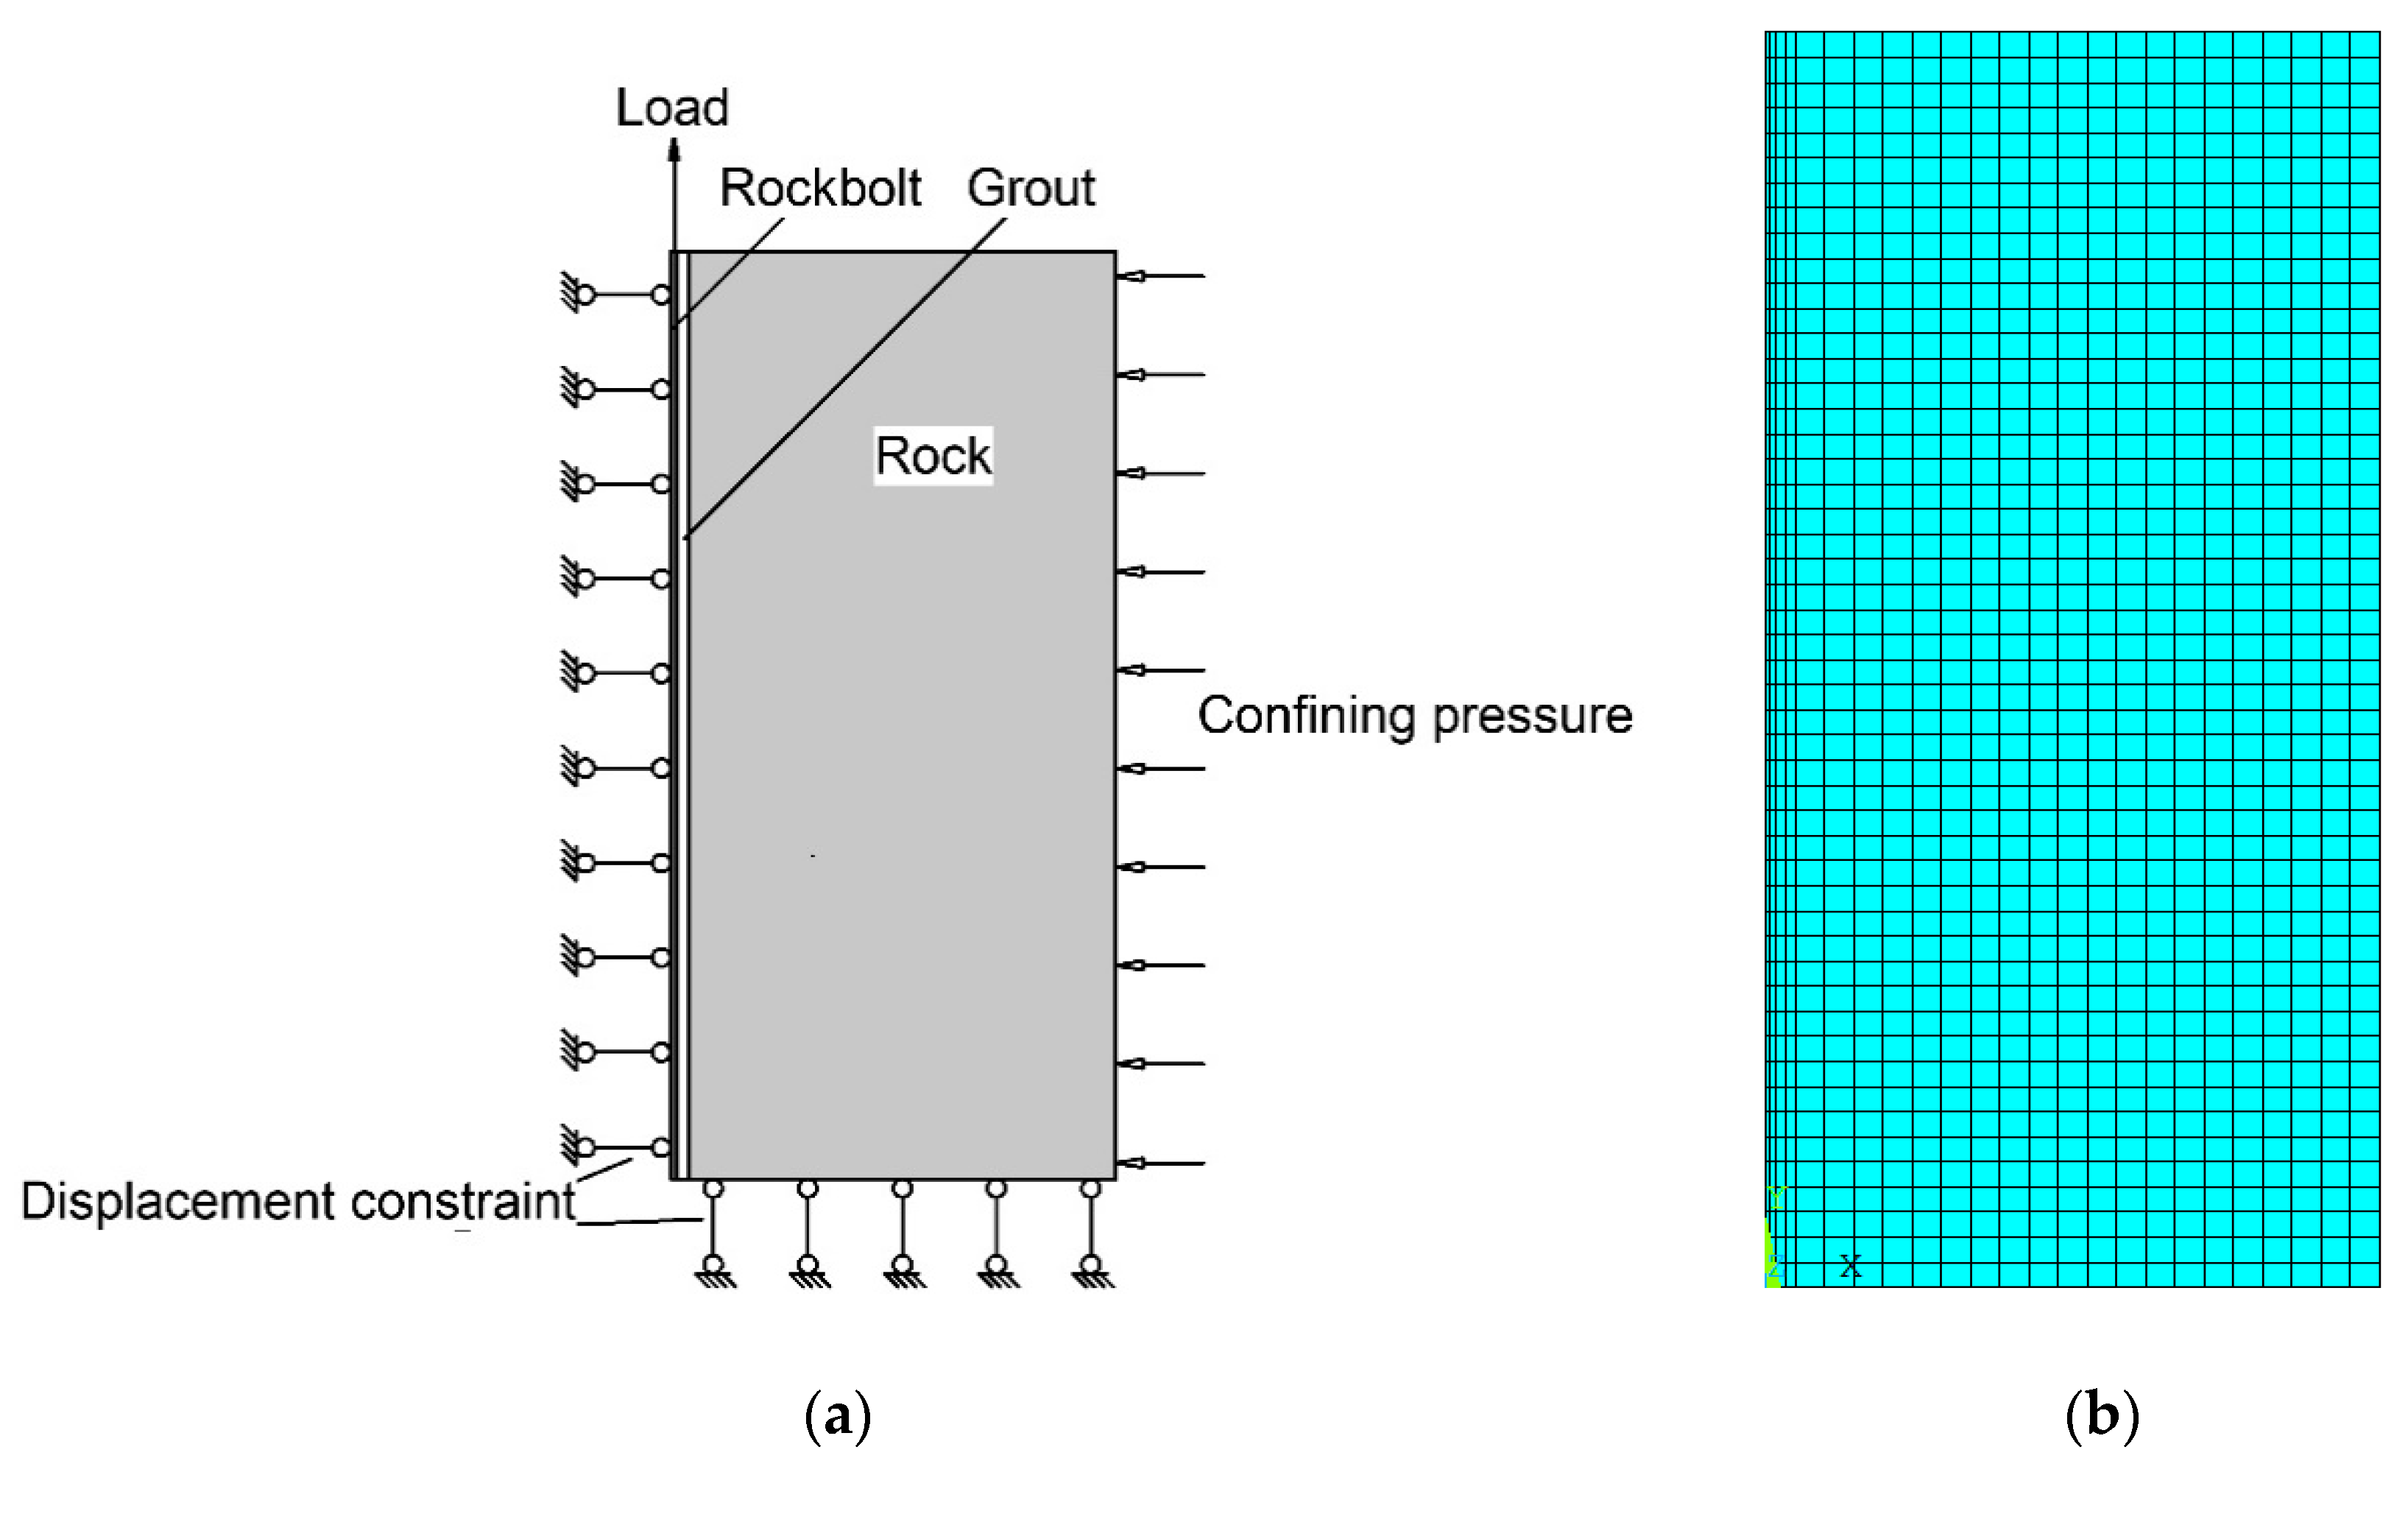
4.1. Numerical Model

The problem studied in this section meets the condition of axisymmetry. In order to save the calculation time and convenience of analysis, the calculation model is simplified as an axisymmetric problem. During analysis, the dead weight of the bolt, grouting body, and rock is not considered. The bottom boundary of the model is constrained by vertical displacement, while the vertical boundary is constrained by horizontal direction, as shown in Figure 10a. In the finite element model, the bolt diameter is 32 mm, the borehole diameter is 60 mm, the anchorage length is 2000 mm, and the distance between the rock boundary and borehole center is 900 mm. The interface model between materials is not considered in this simulation.
PLANE182 element of ANSYS library is used to analyze the bolt, grouting material, and rock. PLANE182 is used for the 2-D modeling of solid structures. The size of the mesh elements is chosen appropriately to obtain better convergence, without high computation time. Concentrated load is applied to the bolt and detail of the finite element mesh is shown in the Figure 10b.

4.2. Material Modeling

The Drucker–Prager material model is suitable for granular (friction) materials such as soil, rock, and concrete. In this numerical simulation analysis, the Drucker–Prager model was used for both grout and rock, except for the bolt which was simulated with isotropic material. All the material properties are listed in Table 5.

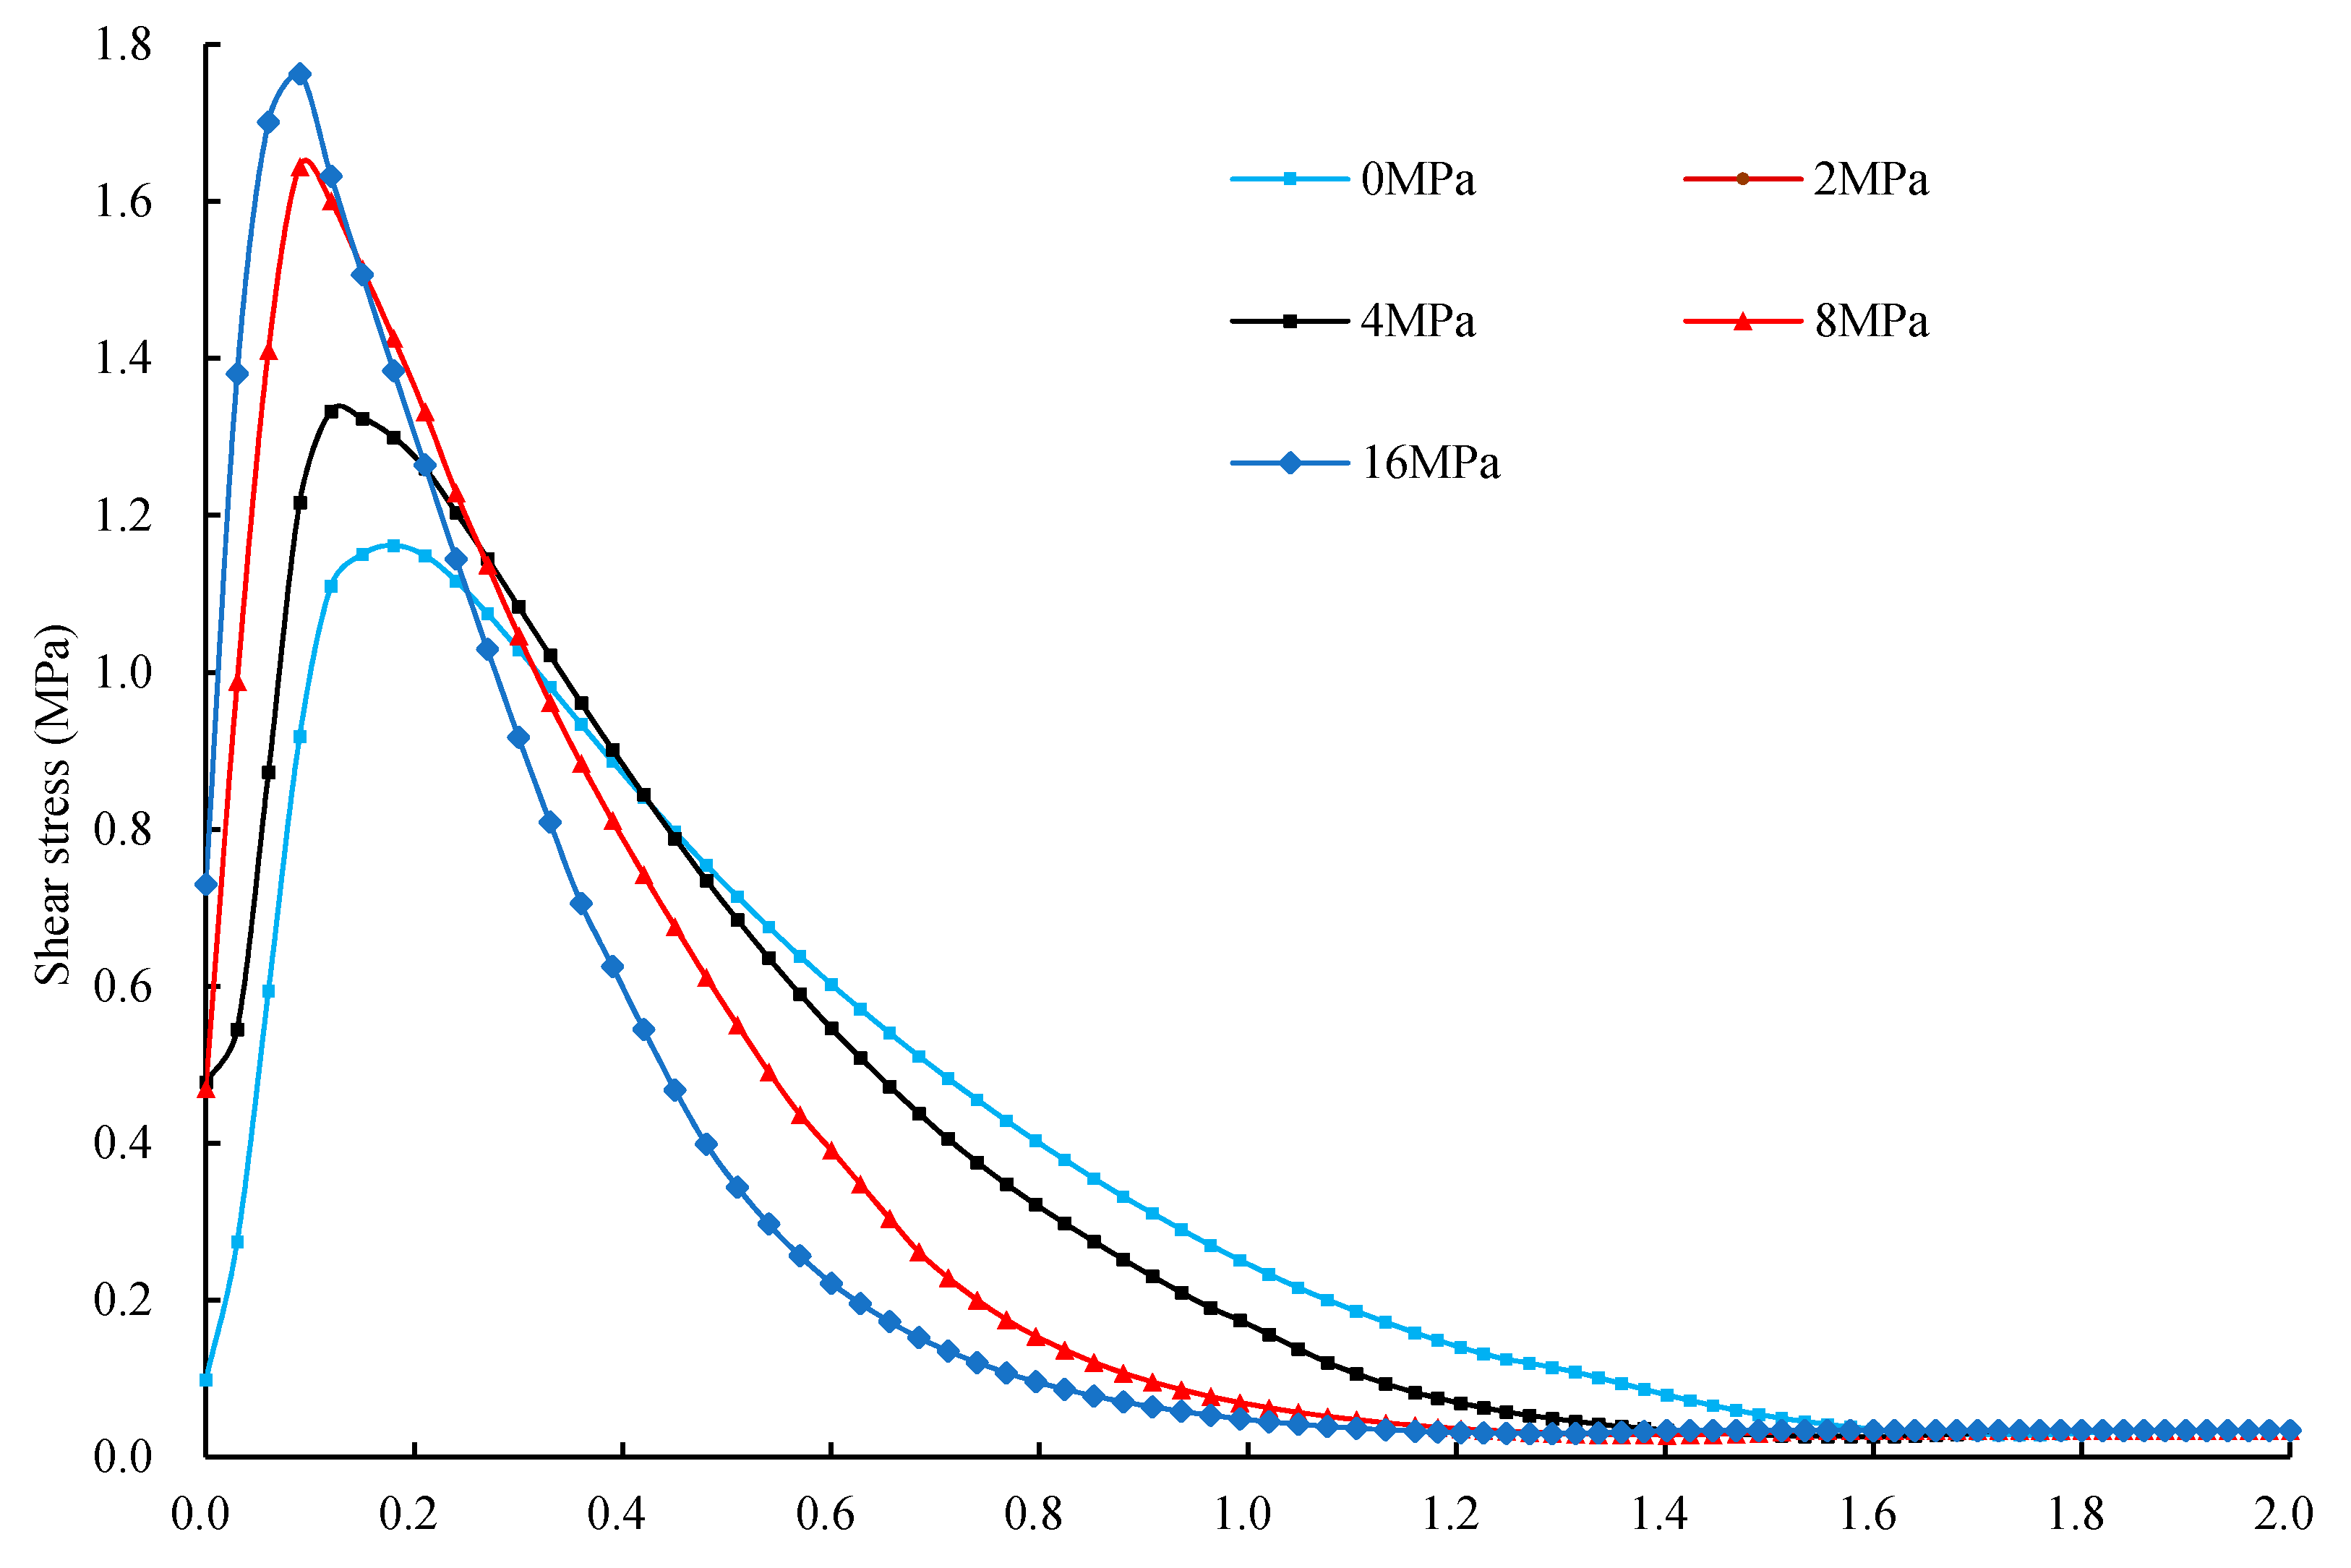
4.3. Influence of Different Confining Pressure on the Interfacial Shear Stress

A large number of studies have shown that, although the shear stress on the two interfaces of anchorage structure is different, the distribution rule of shear stress is the same. Therefore, this numerical simulation takes the interface between grout and rock as the research object to study the influence of confining pressure on the shear stress distribution at the interface.
A pullout force of 160 kN is applied to the bolt, and confining pressures of 0 MPa, 1 MPa, 2 MPa, 4 MPa, 8 MPa, and 16 MPa are applied to the model respectively. After calculation, the distribution curves of interfacial shear stress between the grouting body and rock are extracted. Under different confining pressures, the distribution curves of shear stress are shown in Figure 11. It is not difficult to see from the figure that the confining pressure has little influence on the distribution form of interfacial shear stress, but it has an obvious influence on the size of interfacial shear stress. With the increase of confining pressure, the peak of interfacial shear stress increases. When there is no confining pressure, the maximum value of interfacial shear stress is 1.16 MPa, and when the confining pressure increases to 16 MPa, the interfacial shear stress increases to 1.72 MPa. Obviously, the confining pressure has an effect on the maximum value of interfacial shear stress. In this study, the maximum value of interfacial shear stress at the confining pressure of 16 MPa increased by nearly 50% compared with that without confining pressure and the influence of confining pressure on the maximum value of interfacial shear stress is obvious.

4.4. Ultimate Anchorage Force under Different Confining Pressures

Concentrated load is applied to the rockbolt. When the grouting material has large shear plastic strain, the anchorage structure cannot continue to bear the load. The ultimate bearing capacity and the maximum displacement of anchorage structure under different confining pressures are calculated respectively. The calculation results are shown in Table 6. Figure 12 shows the scatter diagram of confining pressure and the ultimate bearing capacity of anchorage structure and the fitting curve of the relationship between them.
The following conclusions can be drawn from Table 6 and Figure 12:
  • With the increasing of confining pressure in the anchorage section of the anchorage structure, the maximum displacement of anchorage structure is increasing, which indicates that the anchorage structure will not be damaged even if it has a large deformation under the action of high confining pressure;
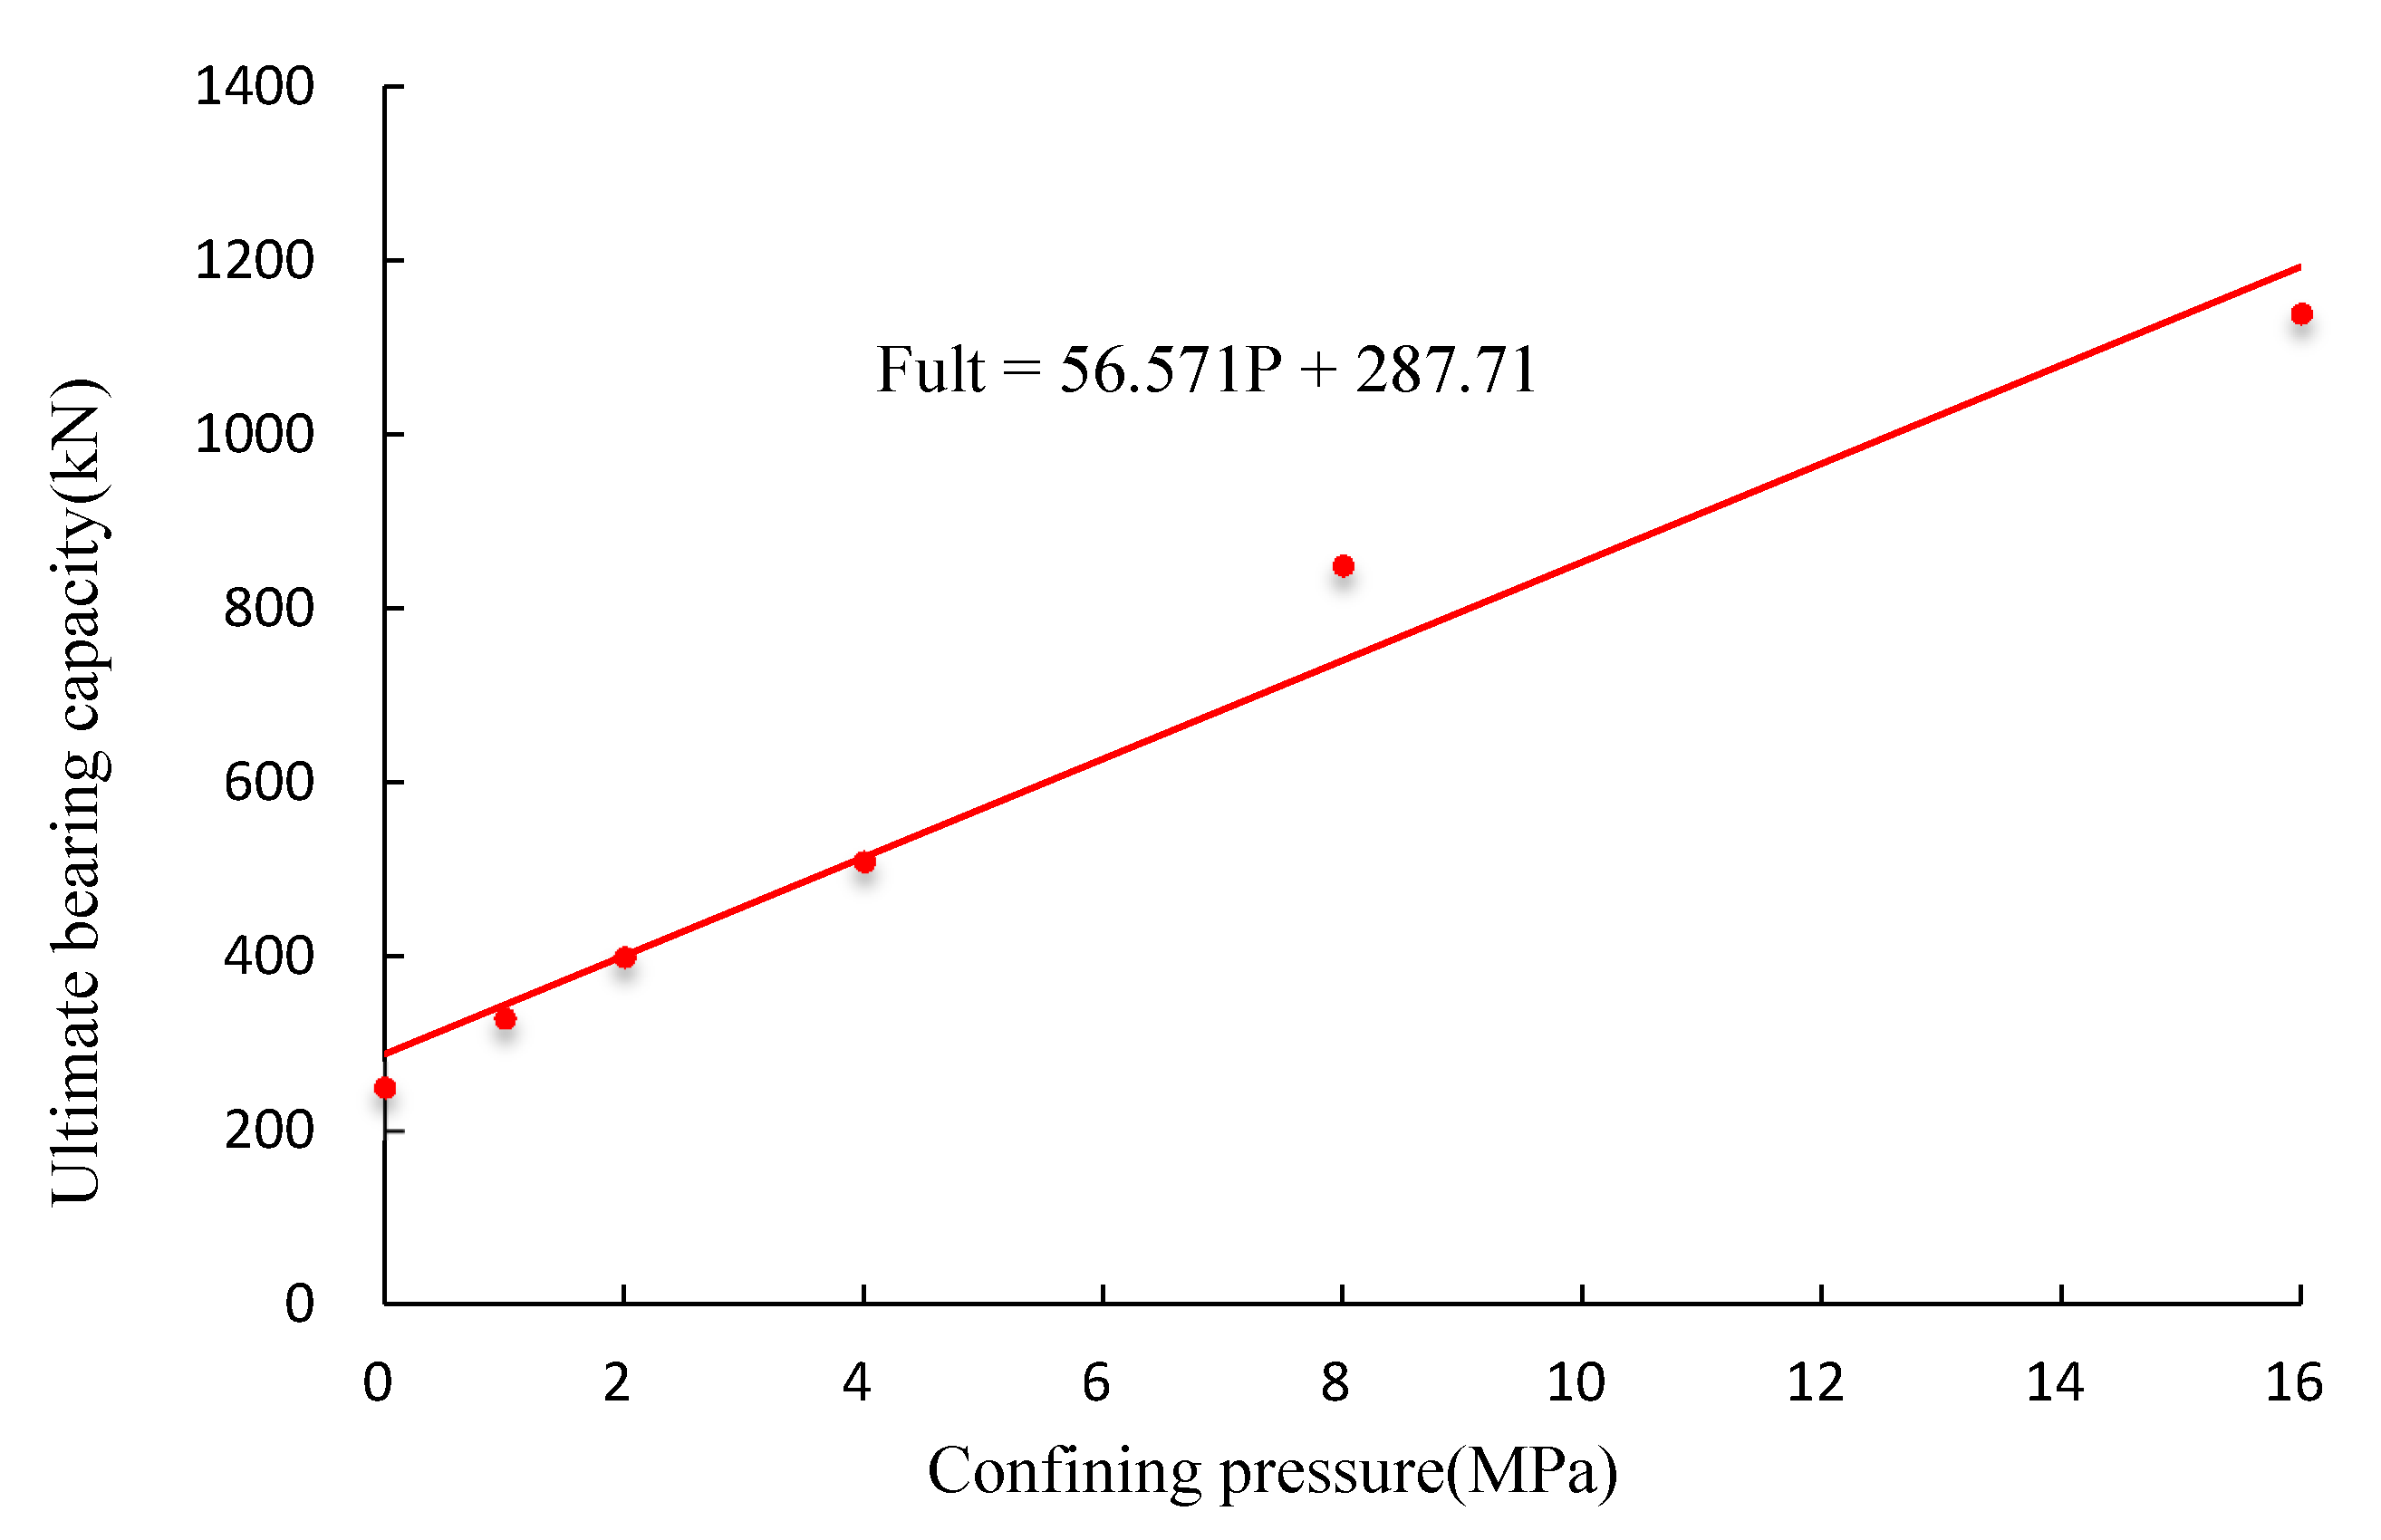
  • By analyzing the relationship between confining pressure and ultimate bearing capacity, the ultimate bearing capacity increases linearly with the increase of confining pressure. Through the curve fitting method, the linear relationship between the confining pressure of the anchorage section and ultimate bearing capacity of anchorage structure is obtained, as shown in Equation (6). In this paper, when there is no confining pressure, the ultimate bearing capacity of the anchorage structure is 250 kN. When the confining pressure increases to 4 MPa, the ultimate bearing capacity reaches 510 kN, increasing by more than one time. When the confining pressure increased to 16 MPa, the ultimate bearing capacity of the anchorage structure reached 1140 kN, and the increasing range of the ultimate bearing capacity is amazing. This is clearly shows that the influence of confining pressure on the ultimate bearing capacity of anchorage structure is significant.
    F u l t = 56.571 P + 287.71 ,
    where, F u l t is the ultimate bearing capacity of anchorage structure, kN; P is the confining pressure of the anchorage section, MPa.

5. Conclusions

In this paper, according to the phenomenon of radial splitting of the samples found in the laboratory model test, the effects of radial stress on the mechanical properties of the anchorage structure and the rock around the borehole were analyzed by using the maximum tensile stress criterion and the Mohr–Coulomb criterion. The main conclusions are as follows:
  • The radial stress of anchorage section had a significant effect on the mechanical properties of anchorage structure, and the influence on the mechanical properties of the rock around the borehole cannot be ignored;
  • The confining pressure had little effect on the distribution of interfacial shear stress, but with the increase of confining pressure, the maximum value of interfacial shear stress increased obviously;
  • With the increasing of confining pressure, the anchorage structure was more adaptable to deformation and less prone to failure. The ultimate bearing capacity of anchorage structure increased linearly with the increase of confining pressure, and the effect of confining pressure on the ultimate bearing capacity was very significant;
  • According to the results of numerical analysis, the relationship between the confining pressure and the ultimate bearing capacity of anchorage structure was obtained. Although the specific values in the fitting curve needed to be further studied, it could be seen from the relationship between the two that the confining pressure on the anchorage section had a significant impact on the mechanical properties of anchorage structure.
In this laboratory test, there was no confining pressure around the samples, which is different from the actual situation. However, many samples were split in the test, which further shows the influence of radial stress on the bearing capacity of anchorage structure was very significant. Therefore, this laboratory test is very valuable. In the follow-up research, we should develop a test method which can accurately reflect the influence of radial stress on the mechanical properties of anchorage structure, so as to further study the relationship between the two. These research work will provide theoretical basis for fully tapping the bearing capacity potential of an anchorage structure, saving support cost and promoting the development of anchorage theory.

Author Contributions

Conceptualization: Y.Z.; project administration: Y.Z.; methodology, Y.Z. and P.Z.; software, H.W.; validation, Y.Z. and H.W.; formal analysis, Y.Z.; investigation, H.W.; writing—original draft preparation, Y.Z.; writing—review and editing, Y.Z.; funding acquisition, Q.W. All authors have read and agreed to the published version of the manuscript.

Funding

This research was funded by the National Natural Science Foundation of China (51804182) and the SDUST Research Fund (No. 2018TDJH101).

Conflicts of Interest

The authors declare no conflict of interest.

References

  1. Martín, L.B.; Tijani, M.; Hadj-Hassen, F.; Noiret, A. Assessment of the bolt-grout interface behaviour of fully grouted rockbolts from laboratory experiments under axial loads. Int. J. Rock Mech. Min. Sci. 2013, 63, 50–61. [Google Scholar] [CrossRef]
  2. Teymen, A.; Kilic, A. Effect of grout strength on the stress distribution (tensile) of fully-grouted rockbolts. Tunn. Undergr. Space Technol. 2018, 77, 280–287. [Google Scholar] [CrossRef]
  3. Li, C.C.; Kristjansson, G.; Høien, A.H. Critical embedment length and bond strength of fully encapsulated rebar rockbolts. Tunn. Undergr. Space Technol. 2016, 59, 16–23. [Google Scholar] [CrossRef] [Green Version]
  4. Kilic, A.; Yasar, E.; Celik, A.G. Effect of grout properties on the pull-out load capacity of fully grouted rock bolt. Tunn. Undergr. Space Technol. 2002, 17, 355–362. [Google Scholar] [CrossRef]
  5. Wang, H.T.; Li, S.C.; Wang, Q.; Wang, D.C.; Li, W.T.; Liu, P.; Li, X.J.; Chen, Y.J. Investigating the supporting effect of rock bolts in varying anchoring methods in a tunnel. Geomech. Eng. 2019, 19, 485–498. [Google Scholar] [CrossRef]
  6. Wang, H.; Jiang, C.; Zheng, P.Q.; Zhao, W.J.; Li, N. A combined supporting system based on filled-wall method for semi coal-rock roadways with large deformations. Tunn. Undergr. Space Technol. 2020, 99, 103382. [Google Scholar] [CrossRef]
  7. Akisanya, A.R.; Ivanović, A. Debonding along the fixed anchor length of a ground anchorage. Build. Struct. 2014, 74, 23–31. [Google Scholar] [CrossRef] [Green Version]
  8. Durham, R.K. Anchorage tests on strain gauged resin bonded bolts. Tunn. Tunn. 1976, 8, 73–76. [Google Scholar]
  9. Yap, L.P.; Rodger, A.A. A study of the behaviour of vertical rock anchors using the finite element method. Int. J. Rock Mech. Min. Sci. 1984, 21, 47–61. [Google Scholar] [CrossRef]
  10. Benmokrane, B.; Chennouf, A.; Mitri, H.S. Laboratory evaluation of cement-based grouts and grouted rock anchors. Int. J. Rock Mech. Min. Sci. Geomech. Abstr. 1995, 32, 633–642. [Google Scholar] [CrossRef]
  11. Ministry of Housing and Urban-Rural Development of the People’s Republic of China and the State Administration for Market Regulation. Technical Code for Building Slope Engineering; Architecture & Building Press: Beijing, China, 2013.
  12. Ministry of Railways of the People’s Republic of China. Code for Design of Retaining Structures of Railway Earthworks; Railway Press Co., Ltd.: Beijing, China, 2019.
  13. Freeman, T.J. The behaviour of fully-bonded rock bolts in the Kielder experimental tunnel. Tunn. Tunn. 1978, 10, 37–40. [Google Scholar]
  14. Moosavi, M.; Jafari, A.; Khosravi, A. Bond of cement grouted reinforcing bars under constant radial pressure. Cem. Concr. Compos. 2005, 27, 103–109. [Google Scholar] [CrossRef]
  15. Ivanović, A.; Neilson, R.D. Modelling of debonding along the fixed anchor length. Int. J. Rock Mech. Min. Sci. 2009, 46, 699–707. [Google Scholar] [CrossRef]
  16. Ren, F.F.; Yang, Z.J.; Chen, J.F.; Chen, W.W. An analytical analysis of the full-range behaviour of grouted rockbolts based on a tri-linear bond-slip model. Constr. Build. Mater. 2010, 24, 361–370. [Google Scholar] [CrossRef]
  17. Li, C.; Stillborg, B. Analytical models for rock bolts. Int. J. Rock Mech. Min. Sci. 1999, 36, 1013–1029. [Google Scholar] [CrossRef]
  18. Szu, W.; Fragaszy, R.J. Uplift testing of model anchors. J. Geotech. Eng. 1988, 114, 961–983. [Google Scholar]
  19. Yazici, S.; Kaiser, P.K. Bond strength of grouted cable bolts. Int. J. Rock Mech. Min. Sci. Geomech. Abstr. 1992, 29, 279–292. [Google Scholar] [CrossRef]
  20. Bazant, Z.P.; Sener, S. Size effect in pull out tests. ACI Mater. J. 1988, 85, 347–351. [Google Scholar]
  21. Akisanya, A.R.; Meng, C.S. Initiation of fracture at the interface corner of bi-material joints. J. Mech. Phys. Solids 2003, 51, 27–46. [Google Scholar] [CrossRef]
  22. Suzuki, Y. Adhesive tensile strength of scarf and butt joints of steel plates. Int. J. JSME Ser. A 1987, 30, 1042–1051. [Google Scholar] [CrossRef] [Green Version]
  23. Kaiser, P.K.; Yazici, S.; Nosé, J. Effect of stress change on the bond strength of fully grouted cables. Int. J. Rock Mech. Min. Sci. Geomech. Abstr. 1992, 29, 293–306. [Google Scholar] [CrossRef]
  24. Martin, L.B.; Tijani, M.; Hadj-Hassen, F. A new analytical solution to the mechanical behaviour of fully grouted rockbolts subjected to pull-out tests. Constr. Build. Mater. 2011, 25, 749–755. [Google Scholar] [CrossRef] [Green Version]
  25. Ministry of Housing and Urban-Rural Development of the People’s Republic of China. Technical Specification for Retaining and Protection of Building Foundation Excavations; China Architecture & Building Press: Beijing, China, 2012.
  26. China Association for Engineering Construction Standardization. Technical Specification for Ground Anchors; China Planning Press: Beijing, China, 2005. [Google Scholar]
  27. Rong, G.; Zhu, H.; Zhou, C. Testing study on working mechanism of fully grouted bolts of thread steel and smooth steel. Chin. J. Rock Mech. Eng. 2004, 23, 469–475. [Google Scholar]
Figure 1. Schematic diagram of anchorage system.
Applsci 10 07029 g001
Figure 2. (a) The mold used for casting the concrete and (b) the testing sample after pouring.
Applsci 10 07029 g002
Figure 3. Cutaway section of the pullout bench.
Applsci 10 07029 g003
Figure 4. Debonding failure.
Applsci 10 07029 g004
Figure 5. Splitting failure.
Applsci 10 07029 g005
Figure 6. Typical load-displacement curve of debonding failure (sample 2-0).
Applsci 10 07029 g006
Figure 7. Typical load-displacement curve of splitting failure (sample 2-3).
Applsci 10 07029 g007
Figure 8. Stress analysis of thick-walled cylinder.
Applsci 10 07029 g008
Figure 9. Elastic analytical solution of stress distribution in thick-walled cylinders.
Applsci 10 07029 g009
Figure 10. (a) Overview of the model and (b) mesh for the numerical model.
Applsci 10 07029 g010
Figure 11. Distribution of shear stress under different confining pressures.
Applsci 10 07029 g011
Figure 12. Relationship between confining pressure and ultimate bearing capacity of anchorage structure.
Applsci 10 07029 g012
Table 1. Material parameters of concrete.
Compressive Strength (MPa)Elastic Modulus (GPa)Poisson’s Ratio
45.335.60.23
Table 2. Sample number, cement-sand ratio, and anchorage length.
Sample Number1-02-03-04-01-12-13-14-11-32-33-34-3
Cement-Sand Ratio1:01:01:01:01:11:11:11:11:31:31:31:3
Anchorage Length (mm)300250200150300250200150300250200150
Table 3. Failure modes of samples.
Failure ModesDebonding FailureSplitting Failure
Sample number1-0, 2-0, 3-0, 4-0,
2-1, 3-1, 4-1, 4-3
1-1, 1-3, 2-3, 3-3
Table 4. Failure loads of samples (kN).
Anchorage Length (Mm)300200150
Cement-Sand Ratio
1:014.08.14.7
1:120.49.812.0
1:348.941.921.9
Table 5. Mechanical parameters of materials.
Materials E (GPa) μ c (MPa) φ (°) ψ (°)
Bolt2000.3
Grout260.2413520
Rock50.322.56035
Where E is elastic modulus; μ is Poisson’s ratio; c is cohesion; φ is friction angle; ψ is dilatancy angle.
Table 6. The ultimate bearing capacity and maximum displacement under different confining pressures.
Confining pressures (MPa)0124816
Ultimate bearing capacity (kN)2503304005108501140
Maximum displacement (mm)4.214.718.523.538.751.5

