Article

Image Denoising Using Non-Local Means (NLM) Approach in Magnetic Resonance (MR) Imaging: A Systematic Review

1
Department of Radiological Science, Eulji University, 553, Sanseong-daero, Sujeong-gu, Seongnam-si, Gyeonggi-do 13135, Korea
2
Department of Radiation Convergence Engineering, Yonsei University, 1, Yonseidae-gil, Wonju-si, Gangwon-do 26493, Korea
3
Department of Radiological Science, Gachon University, 191, Hambakmoero, Yeonsu-gu, Incheon 21936, Korea
*
Authors to whom correspondence should be addressed.
Appl. Sci. 2020, 10(20), 7028; https://doi.org/10.3390/app10207028
Submission received: 9 September 2020 / Revised: 4 October 2020 / Accepted: 4 October 2020 / Published: 10 October 2020
(This article belongs to the Section Applied Physics General)

Abstract

:
The non-local means (NLM) noise reduction algorithm is well known as an excellent technique for removing noise from a magnetic resonance (MR) image to improve the diagnostic accuracy. In this study, we undertook a systematic review to determine the effectiveness of the NLM noise reduction algorithm in MR imaging. A systematic literature search was conducted of three databases of publications dating from January 2000 to March 2020; of the 82 publications reviewed, 25 were included in this study. The subjects were categorized into four major frameworks and analyzed for each research result. Research in NLM noise reduction for MR images has been increasing worldwide; however, it was found to have slightly decreased since 2016. It was found that the NLM technique was most frequently used on brain images taken using the general MR imaging technique; these were most frequently performed during simultaneous real and simulated experimental studies. In particular, comparison parameters were frequently used to evaluate the effectiveness of the algorithm on MR images. The ultimate goal is to provide an accurate method for the diagnosis of disease, and our conclusion is that the NLM noise reduction algorithm is a promising method of achieving this goal.

1. Introduction

Magnetic resonance (MR) imaging is the most widely used technique in the field of medical diagnostics [1,2]. In particular, MR imaging, using radio-frequency (RF) pulses, is able to non-invasively image the internal structure of the human body and is known to have a very high diagnostic accuracy [3,4,5]. In addition to the original general MR imaging techniques such as T1 weighted imaging [6], T2 weighted imaging [7], and proton density (PD) weighted imaging [8], more modern specialized techniques such as diffusion weighted imaging (DWI) [9,10,11], diffusion tensor imaging (DTI) [12,13,14], magnetic resonance angiography (MRA) [15,16], functional MR imaging (fMRI) [17,18], and MR spectroscopy (MRS) [19] are actively used to achieve a relatively high disease detection accuracy. Recently, an ultra-high field MR imaging system was developed and applied in numerous studies to improve the signal to noise ratio (SNR) [20,21,22]. In particular, Kim et al. and Seo et al. proposed newly designed RF coils to improve the SNR and to achieve a highly homogeneous B1-field [20,21].
However, MR images include various sources of noise, including limitations in acquisition time, patient movement, susceptibility differences between different tissues, external signals, and the mechanical defects of the device [23,24]. In particular, because the intensity of the MR signal is low, the MR image contains a significant amount of noise, which degrades the image quality. Generally, the noise in the MR image forms a Gaussian and Rician distribution, and the basic formula can be written as follows [25,26]:
P ( M | S , σ ) = M σ 2 e ( M 2 + S 2 ) 2 σ 2 γ 0 ( M S σ 2 ) , M > 0 ,
where | M | is the Rician distribution, S is the original MR image, σ is the standard deviation or equivalently the noise variance for the Gaussian distribution, γ 0 is the modified Bessel function, and M is the observed MR image.
Additionally, the data from clinical MR imaging is corrupted by noise from the acquisition process and this noise degrades the SNR, which is a key factor in MR image quality evaluation [23]. Therefore, noise reduction is a very important part of MR imaging and the methods of removing such noise can be roughly divided into two types: (1) the improvement of hardware and (2) the use of software (image processing algorithm). While using an ultra-high field magnet or developing a high-performance coil can reduce noise, there is an associated problematic increase in cost. To mitigate the high price of hardware development, noise reduction algorithms are actively being studied by many researchers [2,27,28,29]. Various filtering methods have been proposed to remove different components of noise. Filters can be divided into two types according to their regional characteristics: (1) local filters and (2) non-local filters. Local filters use the average or median value based on the relationship between noisy pixels and neighboring pixels. On the contrary, non-local filters compare the area containing the noisy pixel and the neighboring area to obtain a weight, and subsequently filters using a Gaussian kernel and an average value. Among the noise reduction algorithms using the non-local filter method, the total variation-based method and non-local means (NLM) method were introduced and they are widely used in the field of MR imaging [30,31,32]. In particular, the NLM noise reduction algorithm was proposed to minimize the loss of the inherent information in the image and to selectively remove only the noise. This algorithm measures the similarity of the intensity and edge information in an image after setting areas with the same sized mask located around the region of interest (ROI). Additionally, the higher the degree of similarity, the higher the assigned weight used during the image processing. The basic equation of the NLM method is represented as [32]:
N L M | I ( m ) | = n N m w ( N m , N n ) I ( n )   ( w ( N m , N n ) = 1 Z ( m ) e d h 2 ) ,
where I ( n ) is the intensity of the noise component of the nth pixel, N m is the neighborhood of mth pixel, w ( N m , N n ) is a function based on the weighted similarity (sum of the difference between the target pixel and its surrounding pixels), Z ( m ) is the normalization constant, and d is the Euclidean distance. Various types of NLM noise reduction techniques, based on the basic equation (Equation (2)), are employed in MR imaging. The four types of NLM noise reduction algorithms for use in MR images are presented in Figure 1 [30,31,32]. The first type is an algorithm that was optimized by adding a term that is able to perform fast operations to calculate the NLM equation. The second type is a method that is able to adjust the window size or patch size using an adaptive NLM algorithm according to the given situation. The third type is a framework that reflects the intrinsic performance of the MR image using a transform domain. Finally, the fourth type is an algorithm that is modeled based on statistical properties.
When analyzing the previous review papers, the focus was the general review of the usefulness of the noise reduction algorithm in the field of general medical imaging [33,34]. In particular, studies conducted by Sagheer et al. well classified different noise reduction techniques in ultrasound, MR imaging, computed tomography, and positron emission tomography imaging [33]. In addition, in the study of Anitha et al., the median filter and the Wiener filter used in MR imaging were briefly reviewed, and in the study of Kaur et al. and Nagendran et al., the medical imaging application of the noise reduction method using a machine learning-based approach was reviewed [35,36,37]. However, there are few review and systematic review papers for the above-mentioned NLM-based noise reduction algorithm. The aim of this study is to perform a systematic review of the available literature on the use and effectiveness of NLM noise reduction algorithms for MR imaging, including the aforementioned types. This study is intended to be a clearly reviewed process with a formulated question and explicit method.

2. Materials and Methods

2.1. Design of Study

Our systematic review of the effectiveness of the NLM noise reduction algorithm in MR imaging followed the preferred reporting items for systematic reviews and meta-analysis *(PRISMA) guidelines [38].

2.2. Data Source and Search Strategy

A systematic search was conducted, with an academic librarian, of the EMBASE, MEDLINE EBSCO, and Cochrane databases. The search included publications dating from January 2000 to March 2020 in order to identify the relevant papers on the effectiveness of the NLM noise reduction algorithm in MR imaging. The strategies for the paper search followed guidelines and included terms for research related words with English articles. Table 1 shows an overview of the search strategies employed in this study.

2.3. Descriptive Analysis

All authors (Heo, Y.C.; Kim, K.; and Lee, Y.) screened titles and abstracts searching for valid papers, while two authors (Kim, K. and Lee, Y.) reviewed and categorized all of the papers, including a verification of all data.
For a descriptive analysis of the study, the research was classified into general MR imaging techniques and special MR imaging techniques. Additionally, we classified the studies according to the target organ for MR imaging and further classified the studies as real or simulated experimental studies (the simulated studies were even further classified according to which phantom or program was used). Finally, they were classified according to the measurement method to demonstrate the efficiency of the noise reduction algorithm.

3. Results and Discussion

From the searches of the EMBASE, MEDLINE EBSCO, and Cochrane databases, we identified 82 studies; a total of 57 papers (count after duplicates removed) were initially included. When we searched for papers, we set the search fields as the abstract, title, and keywords, and in the MEDLINE-EBSCO engine, we searched the abstract and title separately using “OR”. These papers were then screened based on the inclusion and exclusion criteria. After this screening, the following papers were excluded: conference papers (n = 9); papers with a title and abstract that are inappropriate, including papers on segmentation, registration, computed tomography, positron emission tomography, dictionary learning processing, or a different algorithm (n = 6); a review paper (n = 1); a paper not including an image (n = 1); papers that did not express the MR imaging technique (n = 4); and papers that did not include a noise or quantitative evaluation (n = 6). Finally, of the 57 unique papers 25 were then investigated using their full text and had their common data sections organized [39,40,41,42,43,44,45,46,47,48,49,50,51,52,53,54,55,56,57,58,59,60,61,62,63]. The specific flowchart of the method used is presented in Figure 2.
Figure 3 shows the total number of papers that quantitatively analyze the use and effectiveness of the NLM noise reduction algorithm in MR images by publication year. The graph shows the overall Gaussian distribution over time after a polynomial fitting function (r-square (COD) = 0.131 and standard deviation = 1.283) was used. In addition, the number of publications of related papers tended to increase as the year increased; the highest number of publications per year was four, occurring three times, in 2010, 2015, and 2016 (orange lines in Figure 3).

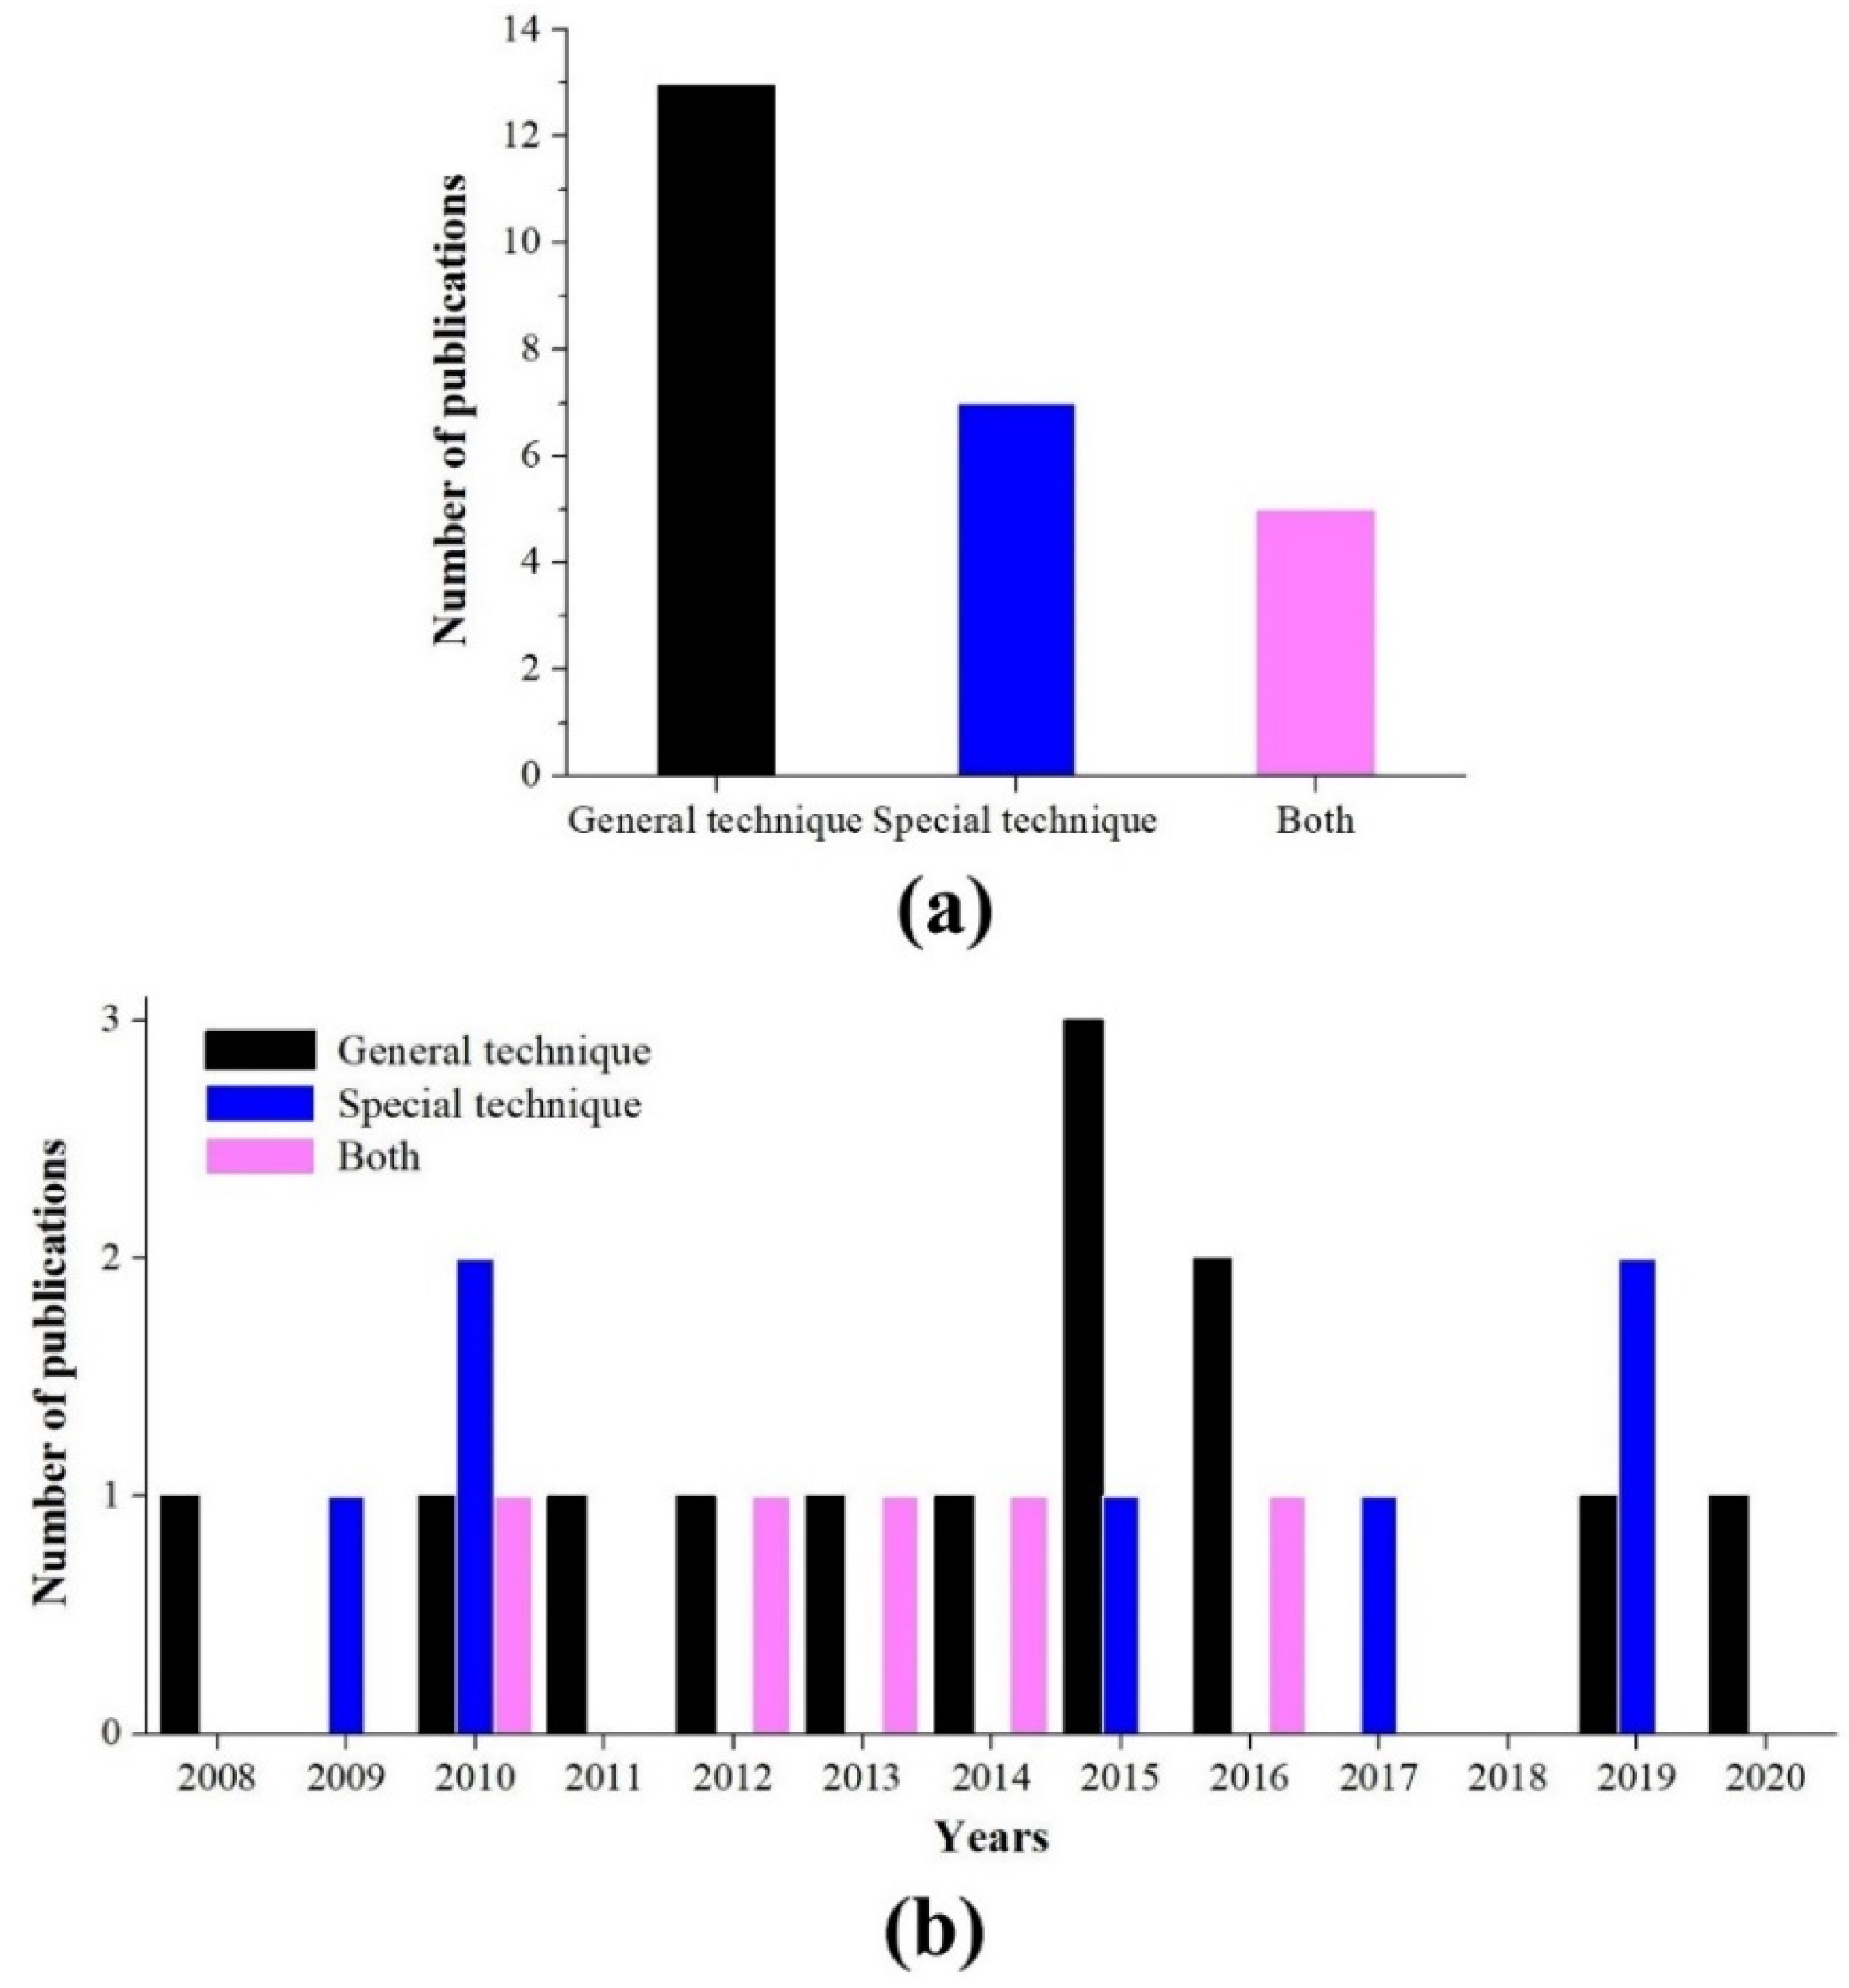
3.1. MR Imaging Techniques: General or Special Method

Papers on related MR image acquisition techniques were classified into three types for systematic review: general, special, and including “both” techniques. For papers on general techniques, the results of the application of the NLM noise reduction algorithm to T1 weighted, T2 weighted, and PD weighted images were classified. For papers on special techniques, the results from the use of other techniques, not classified as general techniques, were summarized. Figure 4 presents the overall publication numbers for each type of MR imaging technique using the NLM noise reduction algorithm. Table 2 describes the characteristics for MR imaging techniques of the 25 included studies.
Of the 25 papers identified, the general technique category had the largest number of papers (n = 13) [39,43,45,46,48,50,53,54,55,56,58,62,63], followed by the special technique category (n = 7) [40,41,42,52,59,60,61], and then the category of “both” techniques (n = 5) [44,47,49,51,57]. Papers related to the application of the NLM noise reduction algorithm in conjunction with general MR imaging acquisition techniques were first published in 2008.
Among papers on the general techniques, the results from simultaneously studying the T1, T2, and PD weighted images were the most frequent (n = 7), followed by the results from the application of only the T1 weighted image (n = 4), and finally the results from simultaneously studying the T1 and T2 weighted images (n = 2). Additionally, of the special techniques, results from studying DWI (n = 2) or dynamic contrast enhance (n = 2) were the most frequent, and various application fields were derived from “both.” The results from the majority of the studies included in the “both” category applied the algorithm to both the “general techniques” and “DWI or DTI”. The basic weighted image techniques generally showed a tendency to preferentially analyze the effects of the image processing algorithm. Numerous results have been reached from the analysis of diffusion images, in which noise characteristics are very important.
The development of MR imaging technology, including DWI using an echo planar imaging (EPI) pulse sequence, has changed the paradigm of diagnosis and treatment of cerebral infarctions. DWI is a method of imaging the degree of diffusion of water molecules in the human body using MR imaging. In the case of acute cerebral infarctions, the MR imaging shows a decrease in the apparent diffusion coefficient and shows a higher signal intensity than for normal brain parenchyma. DWI has been verified as an excellent technique to detect the infarction region in the brain, and it was found that the majority of research is focused on increasing the efficiency of infarction diagnosis by removing noise [47,49,51,60,61].
After analyzing the number of publications by year, it was determined that all three techniques showed a tendency to remain largely unchanged.

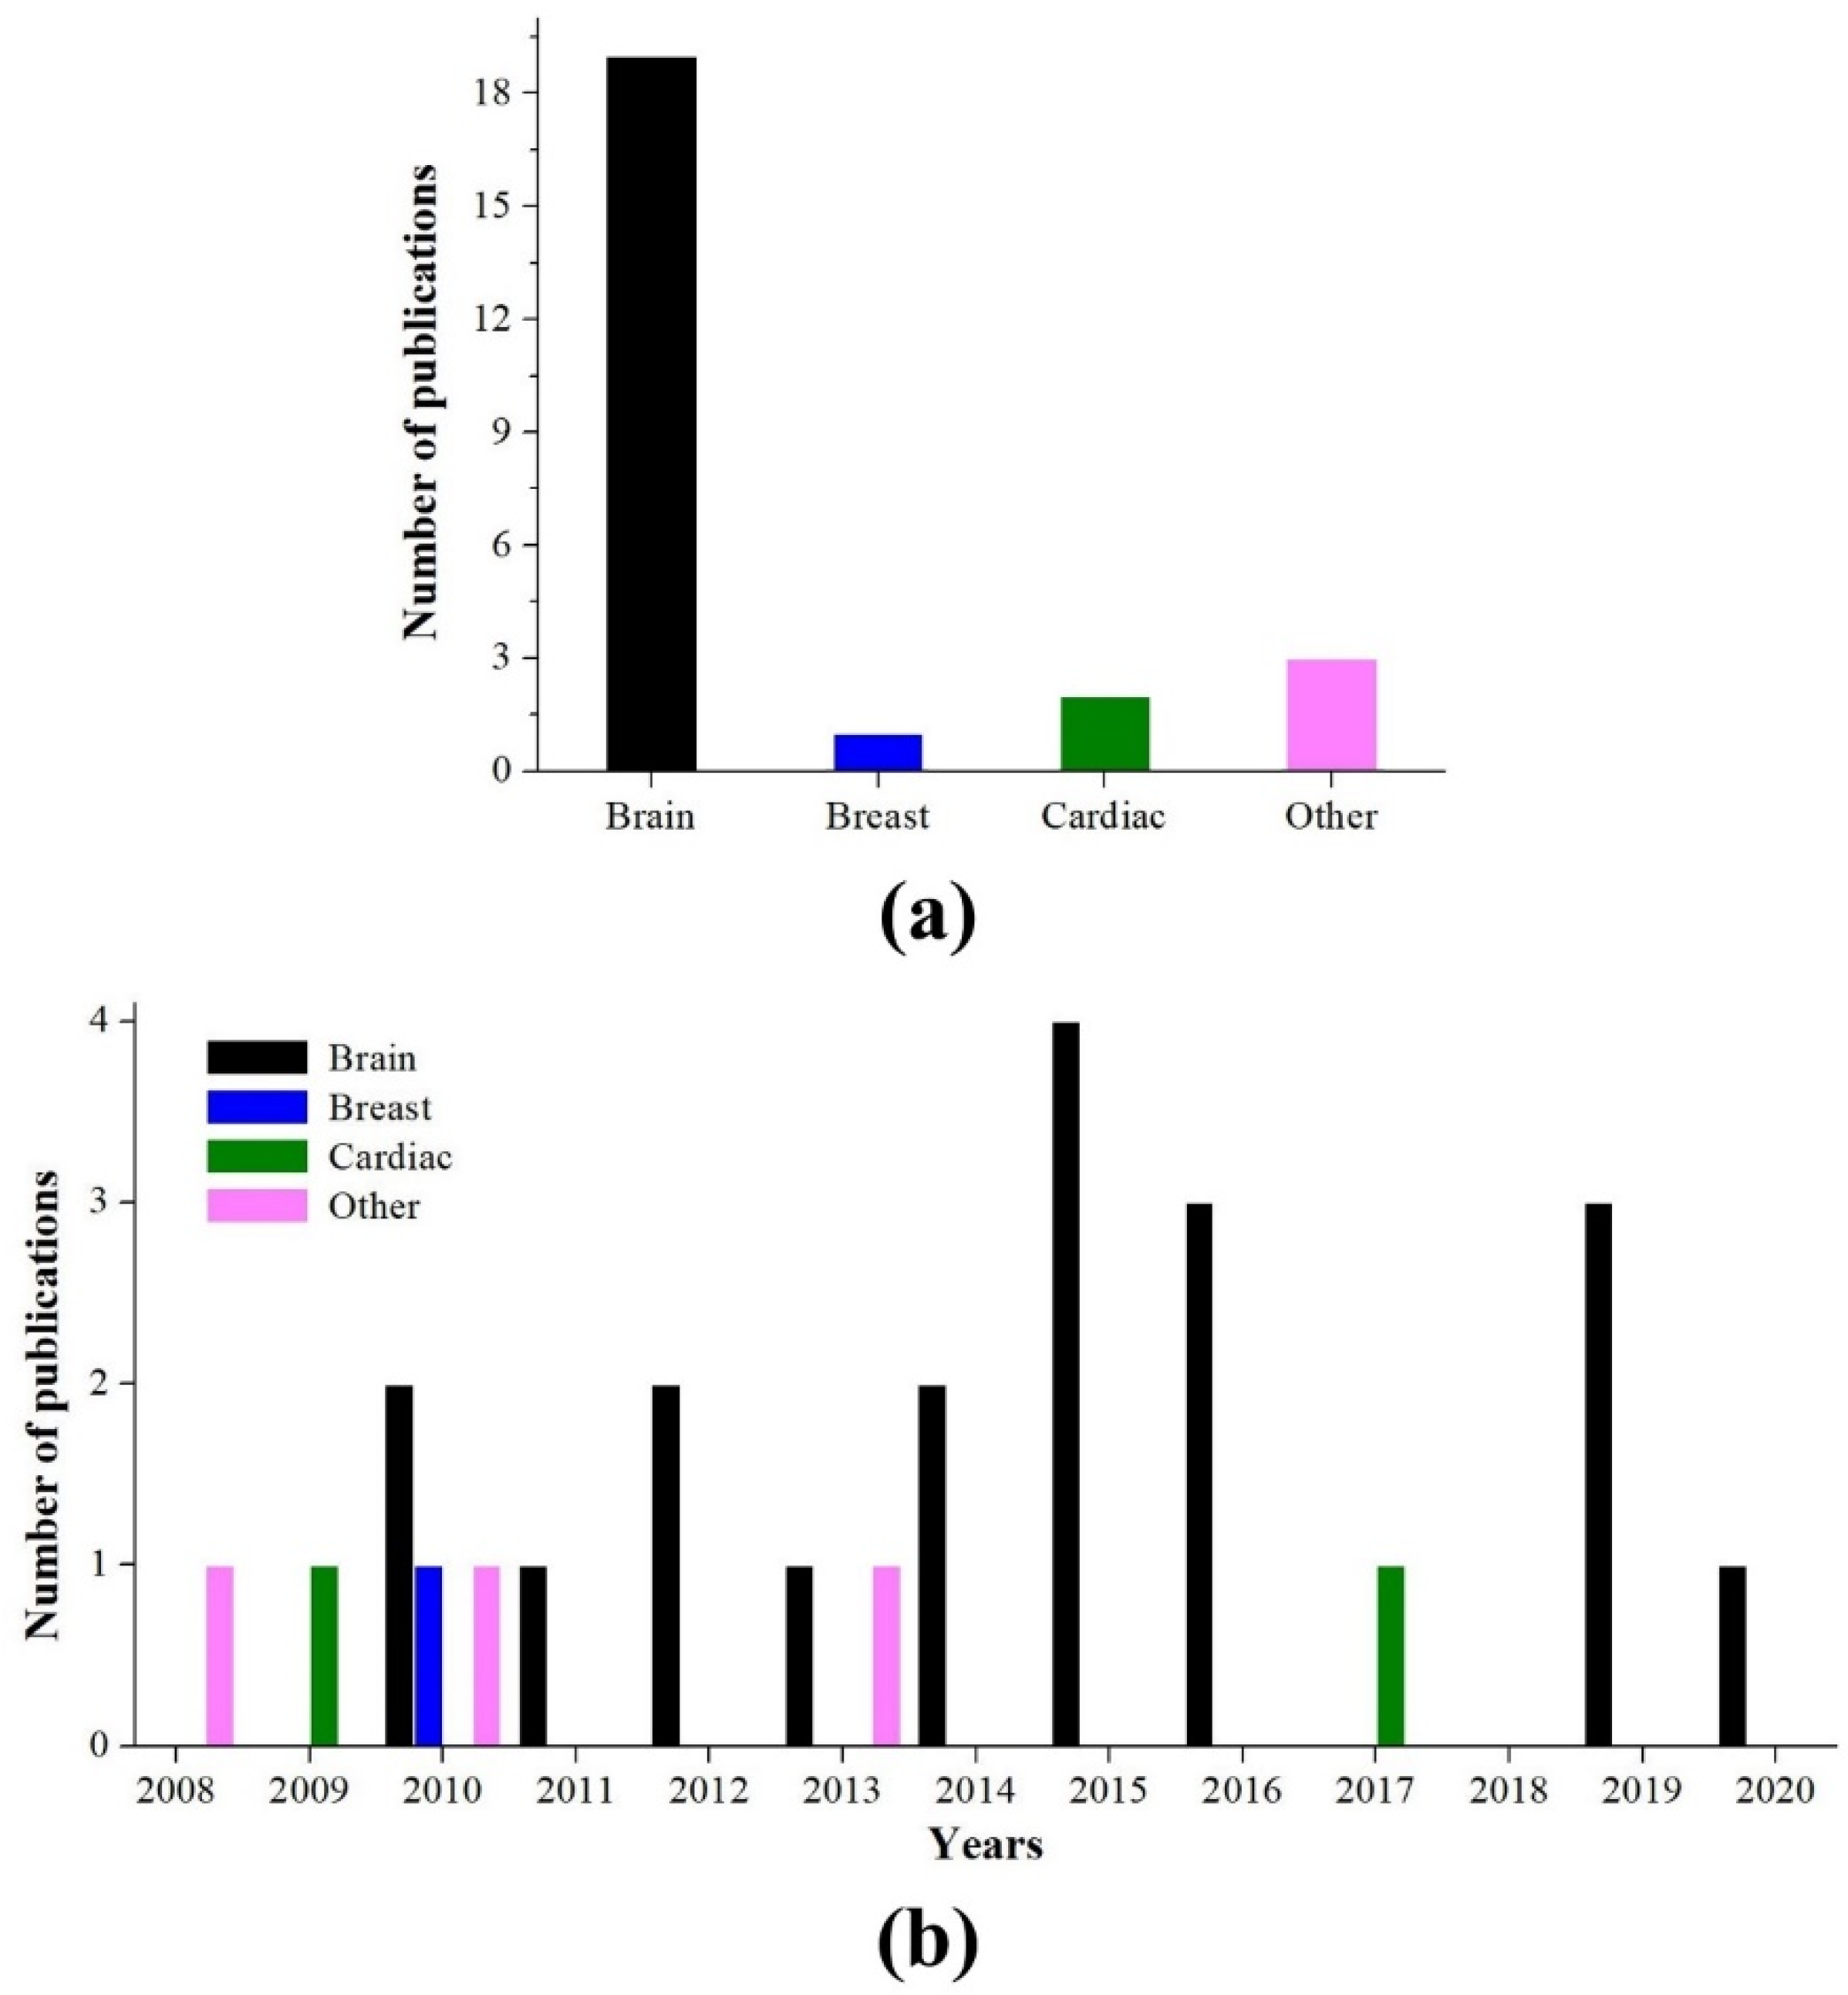
3.2. Target Organs of MR Imaging

This review analyzed the target organ of the MR imaging scan to which the NLM noise reduction algorithm was applied. The papers were classified into four types: brain, breast, cardiac, and “other”. Figure 5 shows the overall publication numbers with respect to the target organ of the MR imaging scan, to which the NLM noise reduction algorithm was applied. Table 3 describes the characteristics for target organs of MR imaging, for the 25 included studies.
The majority of the studies published the results from the application of the NLM noise reduction algorithm to MR images of the brain (n = 19) [43,44,45,46,47,49,50,51,52,53,54,55,56,57,58,60,61,62,63], followed by studies in the “other” category (n = 3), which all acquired MR images of two target organs (brain + knee, brain + breast, and brain + abdomen) [39,41,48], followed next by cardiac MR imaging studies (n = 2) [40,59], and finally by studies of breast MR images (n = 1) [42]. Papers related to the application of the NLM noise reduction algorithm in brain MR imaging were first published in 2008.
Additionally, 22 out of the 25 papers were the results of the application of the NLM noise reduction algorithm to MR images of the brain, and only three papers targeted other singular organs in isolation. The brain is one of the most frequently imaged areas in MR imaging, and the reduction of noise is critical for both general and special techniques. In particular, the failure to accurately predict or diagnose brain tumors, cerebral infarctions, and brain hemorrhages due to the noise in the MR images of the brain, can cause serious problems for patients. The NLM noise reduction algorithm has been verified as an excellent method to address the deterioration in the accuracy of the diagnosis of these diseases, until deep learning-based algorithms have been developed and are available.
After analyzing the number of publications by year, it was determined that in the early stages, the results of studies on organs other than the brain were published frequently; however, since 2011, the majority of studies published have examined the brain.

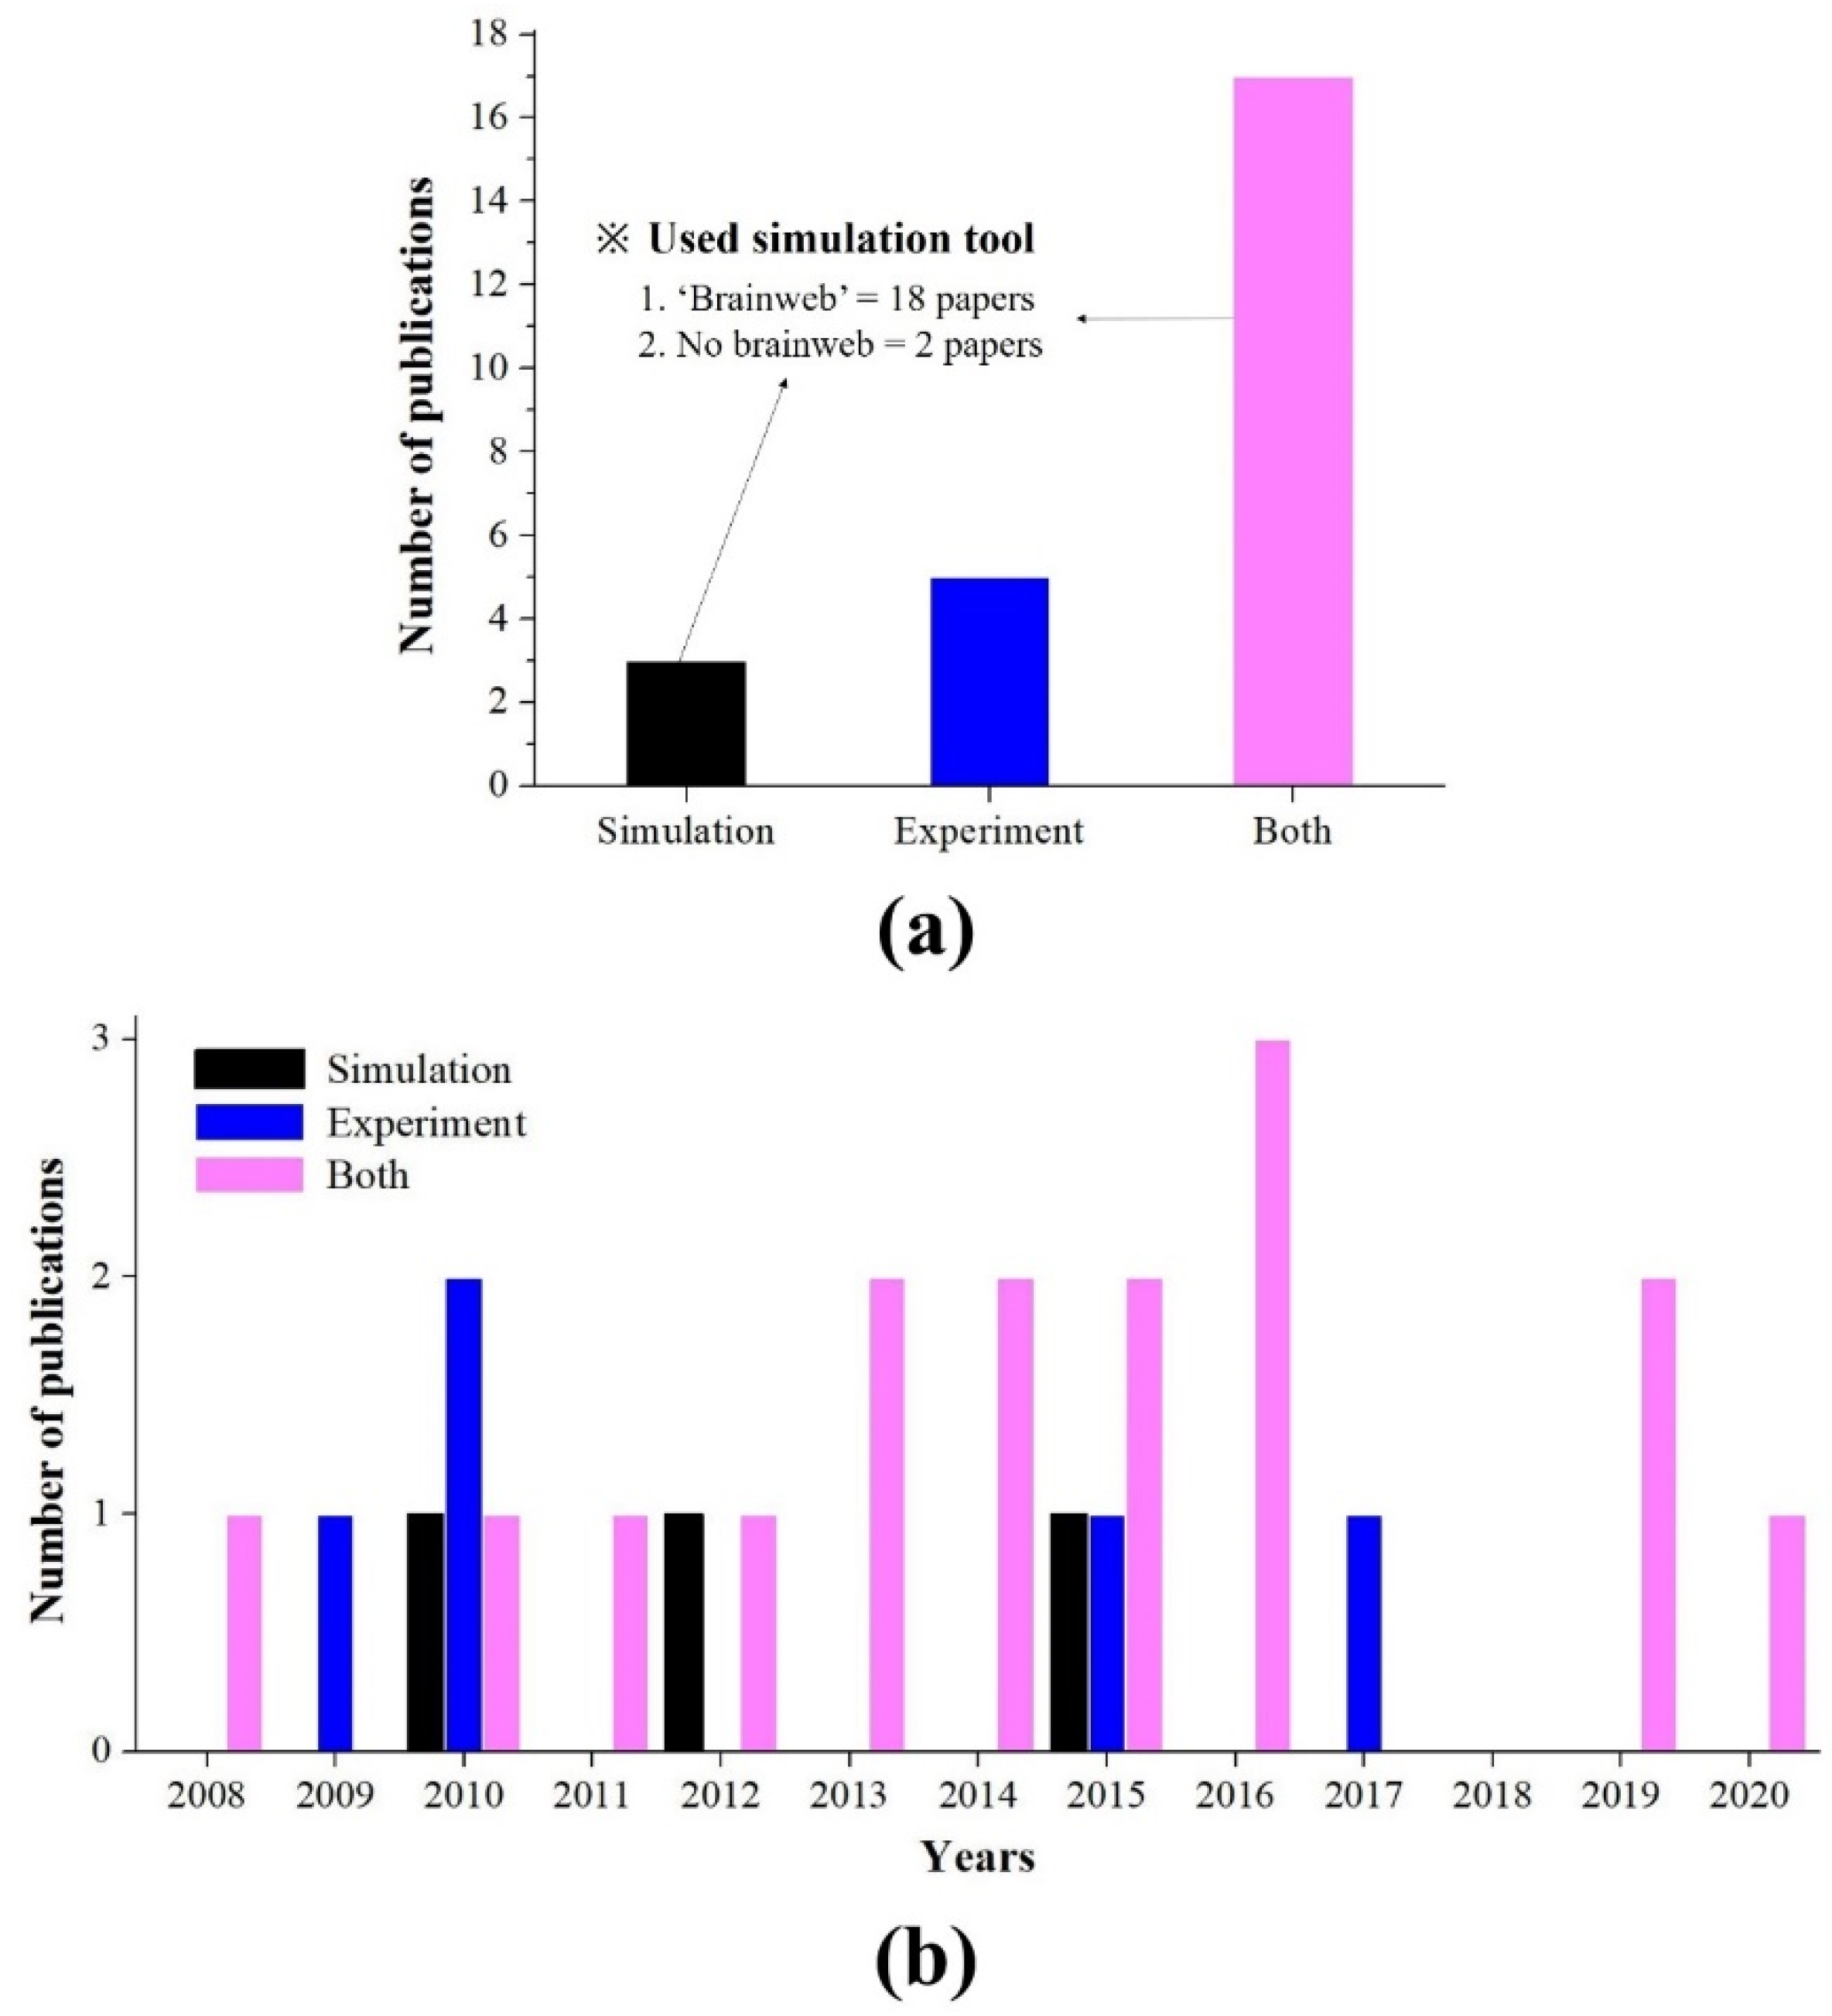
3.3. Types of Study: Simulaiton or Real Experiment

Over the past few decades, a wide variety of highly accurate and effective MR imaging simulation tools have been developed and implemented, such as the BrainWeb Simulated Brain Database (SBD) [64]. Since the development of these tools, the study of image processing algorithms, including noise reduction technology, has begun to proceed simultaneously with simulated and real experiments. Therefore, for this systematic review, we analyzed the study type on the application of the NLM noise reduction algorithm to MR images. Figure 6 shows the overall publication numbers with respect to the types of study (real, simulated, or both). Table 4 describes the characteristics for the types of study of the 25 included papers.
Of the 25 papers identified, the “both” category, based on simulation and experiment, represented the largest number of studies (n = 17) [39,44,45,47,48,49,50,51,53,54,56,57,58,60,61,62,63], followed by the solely experimental category (n = 5) [40,41,42,52,59], and finally the solely simulation category (n = 3) [43,46,55]. Papers related to the application of the NLM noise reduction algorithm in both simulation and experimental studies were first published in 2008.
After analyzing the number of publications by year, it was determined that while experiment-based research has been conducted since the early stages in 2008, research that includes simulations has been actively increasing over the years.
One of the major benefits of simulation studies is the ability to verify the accuracy and effectiveness of a given developed tool. As shown in Figure 6a, the most widely used simulation tool is BrainWeb, developed with a well-validated process using images acquired in-vivo and using ground truth data [64]. This tool has the advantage of being able to set the modality and noise levels in a user-friendly fashion based on the SBD and acquired 3D images. BrainWeb is used as the gold standard for research on the application of image processing algorithms to MR images of the brain. As a result, 18 of the 25 total included papers used the BrainWeb tool.
Recently, MR imaging simulation tools with improved computational speed have been developed; a representative example is MRiLab [65]. This tool was developed to improve speed and to make use of various image acquisition parameters based on the available graphic processing units (GPUs). It is expected that these developments will enable various pulse sequence models, coil designs, and various simulation studies.

3.4. Evaluation Method of NLM Noise Reduction Algorithm in MR Imaging

The methods for evaluating the effectiveness of the noise reduction algorithm can be divided into comparison evaluation and quantitative evaluation parameters. The comparison evaluation parameter analyzes the similarities and differences of two images, including: peak signal to noise ratio (PSNR), root mean square error (RMSE), and structural similarity (SSIM). The quantitative evaluation parameter is a method of numerically representing information about the noise included in each MR image, and is generally calculated with the image quality factor (signal or contrast): signal to noise ratio (SNR) and contrast to noise ratio (CNR). Figure 7 shows the overall summary for publication numbers with respect to the evaluation method. Table 5 describes the characteristics for the evaluation method of NLM noise reduction algorithm in MR imaging of the 25 included papers.
Of the 25 papers identified, the comparison evaluation parameter category represented the largest number of studies (n = 18) [39,42,43,44,46,47,48,49,51,54,55,56,57,58,60,61,62,63], followed by the quantitative evaluation parameter category (n = 4) [40,41,52,59], and finally the category containing “both” parameters (n = 3) [45,50,53]. Papers related to the application of the NLM noise reduction algorithm to MR images using the comparison evaluation parameter with RMSE were first published in 2008.
Among the comparison evaluation parameters, the most frequently published results were from studies using only PSNR (n = 7). Additionally, eight papers were published as a result of evaluations using other factors along with the PSNR parameter. PSNR is a numerical representation of the power of the noise relative to the maximum power a signal can represent and is mainly used when evaluating the loss of an image, including the diagnostic field. In particular, the reason why it is so frequently used for noise evaluation in MR images is that PSNR is able to estimate the mean square error (MSE) value and the maximum signal value simultaneously, thereby confirming the overall noise distribution. PSNR is able to accurately measure the loss rate through the comparison of images, where the larger the value, the better the result. SSIM is used as a comparison evaluation parameter in the order of PSNR and is a factor that evaluates the similarity of the original image to the distortion of the image, where values closer to 1 represent better results. However, the results from only one study evaluating SSIM was used, and it was mostly measured with PSNR and RMSE evaluation factors (n = 8) to confirm the effectiveness of the NLM noise reduction algorithm on MR images.
Among the quantitative evaluation parameters, the most frequent results were from studies using only SNR (n = 4). However, the evaluation ratio of SNR and CNR was almost the same, which means that there is no significant difference between the signal value and contrast value in the quantitative evaluation process.
There were only three results from the combination of simultaneous comparison and quantitative evaluation parameters. This means that the quantitative evaluation results are included in the factor for evaluating similarity.
After analyzing the number of publications by year, of all three types, no change was observed as time progressed. From our analysis, it is expected that comparison evaluation parameter should be considered first when evaluating images using the NLM noise reduction algorithm on MR images.

4. Conclusions

Noise reduction in MR images is critical because it greatly improves the early diagnosis rate of lesions and enables the acquisition of high-quality images. In particular, the NLM noise reduction algorithm is known for efficiently removing various types of MR imaging noise. This study conducted a systematic review to analyze the research trends related to the efficacy of this algorithm. Of approximately 82 potential candidates, 25 papers were ultimately selected to analyze the NLM algorithm. In conclusion, we found that the NLM noise reduction algorithm was most commonly used in MR imaging of the brain, using general acquisition techniques. Additionally, simulations and experiments were generally performed simultaneously to evaluate the efficiency, using most comparison evaluation parameters. In conclusion, this study demonstrated the usefulness of the NLM noise reduction algorithm in MR images. Improved methods based on fast or optimization terms and various functions are expected to yield more useful results. In the future, studies on improving the time resolution, one of the major disadvantages of the NLM algorithm, will hopefully be conducted.

Author Contributions

Conceptualization, Y.-C.H., K.K. and Y.L.; analysis and interpretation of the data, Y.-C.H., K.K. and Y.L.; writing—original draft, Y.-C.H. and K.K.; writing—review and editing, Y.L. All authors have read and agreed to the published version of the manuscript.

Funding

This paper was supported by Eulji University in 2020.

Conflicts of Interest

The authors declare no conflict of interest.

References

  1. Vijayalaxmi; Fatahi, M.; Speck, O. Magnetic resonance imaging (MRI): A review of genetic damage investigations. Mutat. Res. Mutat. Res. 2015, 764, 51–63. [Google Scholar] [CrossRef] [PubMed]
  2. Hong, J.-W.; Kim, K.; Lee, Y. Performance Evaluation of New Nonlocal Total Variation Noise Reduction Algorithm in Parallel Magnetic Resonance Imaging with Sensitivity Encoding Reconstruction. J. Magn. 2019, 24, 429–436. [Google Scholar] [CrossRef]
  3. Barisano, G.; Sepehrband, F.; Ma, S.; Jann, K.; Cabeen, R.P.; Wang, D.J.; Toga, A.W.; Law, M. Clinical 7 T MRI: Are we there yet? A review about magnetic resonance imaging at ultra-high field. Br. J. Radiol. 2019, 92, 91. [Google Scholar] [CrossRef]
  4. Alvarez-Linera, J. 3 T MRI: Advances in brain imaging. Europ. J. Radiolg. 2008, 67, 415–426. [Google Scholar] [CrossRef] [PubMed]
  5. Winter, J.D.; Dorner, S.; Lukovic, J.; Fisher, J.A.; Lawrence, K.S.S.; Kassner, A. Noninvasive MRI Measures of Microstructural and Cerebrovascular Changes During Normal Swine Brain Development. Pediatr. Res. 2011, 69, 418–424. [Google Scholar] [CrossRef] [Green Version]
  6. Qian, Y.-F.; Yu, C.-L.; Zhang, C.; Yu, Y.-Q. MR T1-Weighted Inversion Recovery Imaging in Detecting Brain Metastases: Could It Replace T1-Weighted Spin-Echo Imaging? Am. J. Neuroradiol. 2008, 29, 701–704. [Google Scholar] [CrossRef] [Green Version]
  7. Ream, J.M.; Rosenkrantz, A.B. Advances in T1-Weighted and T2-Weighted Imaging in the Abdomen and Pelvis. Radiol. Clin. North. Am. 2015, 53, 583–598. [Google Scholar] [CrossRef]
  8. Sonin, A.H.; Pensy, R.A.; Mulligan, M.E.; Hatem, S. Grading Articular Cartilage of the Knee Using Fast Spin-Echo Proton Density-Weighted MR Imaging Without Fat Suppression. Am. J. Roentgenol. 2002, 179, 1159–1166. [Google Scholar] [CrossRef]
  9. Han, Y. An adaptive diffusion-weighted whole-body magnetic resonance imaging scheme using the multistation approach. J. Korean Phys. Soc. 2016, 68, 467–473. [Google Scholar] [CrossRef]
  10. Baliyan, V.; Das, C.J.; Sharma, R.; Gupta, A.K. Diffusion weighted imaging: Technique and applications. World J. Radiol. 2016, 8, 785–798. [Google Scholar] [CrossRef]
  11. Koh, D.-M.; Collins, D.J. Diffusion-Weighted MRI in the Body: Applications and Challenges in Oncology. Am. J. Roentgenol. 2007, 188, 1622–1635. [Google Scholar] [CrossRef] [PubMed] [Green Version]
  12. Shim, J.-H.; Im, S.-J.; Kim, A.-Y.; Kim, Y.-T.; Kim, E.B.; Baek, H.-M. Generation of Mouse Basal Ganglia Diffusion Tractography Using 9.4T MRI. Exp. Neurobiol. 2019, 28, 300–310. [Google Scholar] [CrossRef] [PubMed]
  13. O’Donnell, L.J.; Westin, C.-F. An Introduction to Diffusion Tensor Image Analysis. Neurosurg. Clin. North. Am. 2011, 22, 185–196. [Google Scholar] [CrossRef] [PubMed] [Green Version]
  14. Lama, R.K.; Lee, S.-W. White Matter Network Alterations in Alzheimer’s Disease Patients. Appl. Sci. 2020, 10, 919. [Google Scholar] [CrossRef] [Green Version]
  15. Jang, S.-R.; Park, C.-A.; Lee, K.-J.; Lee, Y.-B.; Kim, H.-K.; Kang, C.-K. Assessing Vascular Changes Associated with Healthy Aging using 7T Magnetic Resonance Angiography. J. Magn. 2018, 23, 61–67. [Google Scholar] [CrossRef]
  16. Park, C.-A.; Kang, C.-K.; Kim, Y.-B.; Cho, Z.-H. Advances in MR angiography with 7T MRI: From microvascular imaging to functional angiography. NeuroImage 2018, 168, 269–278. [Google Scholar] [CrossRef]
  17. Park, C.-A.; Yang, S.-B.; Lee, K.-J.; Lee, Y.B.; Kim, H.-K.; Kang, C.-K. Signal Changes in Hippocampal Subfields during Controlled Breathing Patterns by Using Functional MRI. J. Korean Phys. Soc. 2019, 74, 718–723. [Google Scholar] [CrossRef]
  18. Son, Y.-D.; Kang, J.M.; Cho, S.-J.; Lee, J.-S.; Hwang, H.Y.; Kang, S.-G. fMRI brain activation in patients with insomnia disorder during a working memory task. Sleep Breath. 2017, 22, 487–493. [Google Scholar] [CrossRef]
  19. Han, S.-D.; Song, J.; Hernandez, D.; Kim, K.-N. Dual-Tuned Monopole/Loop Coil Array for Concurrent RF Excitation and Reception Capability for MRI. J. Korean Phys. Soc. 2019, 75, 610–616. [Google Scholar] [CrossRef]
  20. Kim, H.-J.; Heo, P.; Han, S.-D.; Kim, N.; Song, H.; Kim, K.-N. Improvements in radio-frequency transmission for ultra-high field magnetic resonance imaging through a bilateral monopole antenna. Electromagnetics 2018, 38, 283–290. [Google Scholar] [CrossRef]
  21. Seo, J.-H.; Song, H.; Kim, H.J.; Han, S.-D.; Heo, P.; Kim, D.; Ryu, Y.; Kim, K.-N. Helmholtz transceiver array for improving the |B 1|-field homogeneity at 7-T magnetic resonance imaging. Phys. Wave Phenom. 2017, 25, 147–150. [Google Scholar] [CrossRef]
  22. Heo, P.; Seo, J.-H.; Han, S.-D.; Ryu, Y.; Byun, J.-D.; Kim, K.-N.; Lee, J.H. Multi-port-driven birdcage coil for multiple-mouse MR imaging at 7 T. Scanning 2016, 38, 747–756. [Google Scholar] [CrossRef] [PubMed] [Green Version]
  23. Vaishali, S.; Rao, K.K.; Rao, G.V.S. A review on noise reduction methods for brain MRI images. In Proceedings of the 2015 International Conference on Signal Processing and Communication Engineering Systems, Guntur, India, 2–3 January 2015; pp. 363–365. [Google Scholar]
  24. Garnier, S.J.; Bilbro, G.L.; Snyder, W.E.; Gault, J.W. Noise removal from multiple MRI images. J. Digit. Imaging 1994, 7, 183–188. [Google Scholar] [CrossRef] [Green Version]
  25. Henkelman, R.M. Measurement of signal intensities in the presence of noise in MR images. Med. Phys. 1985, 12, 232–233. [Google Scholar] [CrossRef] [PubMed]
  26. Nowak, R. Wavelet-based Rician noise removal for magnetic resonance imaging. IEEE Trans. Image Process. 1999, 8, 1408–1419. [Google Scholar] [CrossRef] [Green Version]
  27. Seetha, J.; Raja, S.S. Denoising of MRI images using filtering methods. In Proceedings of the 2016 International Conference on Wireless Communications, Signal Processing and Networking (WiSPNET); Institute of Electrical and Electronics Engineers (IEEE), Chennai, India, 23–25 March 2016; pp. 765–769. [Google Scholar]
  28. Pizurica, A.; Wink, A.; Vansteenkiste, E.; Philips, W.; Roerdink, B. A Review of Wavelet Denoising in MRI and Ultrasound Brain Imaging. Curr. Med. Imaging 2006, 2, 247–260. [Google Scholar] [CrossRef]
  29. Saladi, S.; Prabha, N.A. Analysis of denoising filters on MRI brain images. Int. J. Imaging Syst. Technol. 2017, 27, 201–208. [Google Scholar] [CrossRef]
  30. Rudin, L.I.; Osher, S.; Fatemi, E. Nonlinear total variation based noise removal algorithms. Phys. D Nonlinear Phenom. 1992, 60, 259–268. [Google Scholar] [CrossRef]
  31. Bhujle, H.V.; Vadavadagi, B.H. NLM based magnetic resonance image denoising—A review. Biomed. Sign. Process. Control 2019, 47, 252–261. [Google Scholar] [CrossRef]
  32. Buades, A.; Coll, B.; Morel, J.-M. A Non-Local Algorithm for Image Denoising. IEEE Comp. Soc. Conf. Comp. Vis. Pattrn. Recog. 2005, 2, 60–65. [Google Scholar] [CrossRef]
  33. Sagheer, S.V.M.; George, S.N. A review on medical image denoising algorithms. Biomed. Signal. Process. Control 2020, 61, 102036. [Google Scholar] [CrossRef]
  34. Mredhula, L.; Dorairangasamy, M.A. An Extensive Review of Significant Researches on Medical Image Denoising Techniques. Int. J. Comput. Appl. 2013, 64, 1–12. [Google Scholar] [CrossRef]
  35. Anitha, S.; Kola, L.; Sushma, P.; Archana, S. Analysis of filtering and novel technique for noise removal in MRI and CT images. In Proceedings of the 2017 International Conference on Electrical, Electronics, Communication, Computer, and Optimization Techniques (ICEECCOT), Mysuru, India, 15–16 December 2017; pp. 1–3. [Google Scholar]
  36. Kaur, P.; Singh, G.; Kaur, P. A Review of Denoising Medical Images Using Machine Learning Approaches. Curr. Med. Imaging 2018, 14, 675–685. [Google Scholar] [CrossRef]
  37. Nagendran, M.; Chen, Y.; Lovejoy, C.A.; Gordon, A.C.; Komorowski, M.; Harvey, H.; Topol, E.J.; Ioannidis, J.P.A.; Collins, G.S.; Maruthappu, M. Artificial intelligence versus clinicians: Systematic review of design, reporting standards, and claims of deep learning studies. BMJ 2020, 368, m689. [Google Scholar] [CrossRef] [PubMed] [Green Version]
  38. Moher, D.; Liberati, A.; Tetzlaff, J.; Altman, D.G. Preferred reporting items for systematic reviews and meta-analyses: The PRISMA statement. J. Clin. Epidemiol. 2009, 62, 1006–1012. [Google Scholar] [CrossRef] [PubMed]
  39. Manjón, J.V.; Carbonell-Caballero, J.; Lull, J.J.; García-Martí, G.; Martí-Bonmatí, L.; Robles, M. MRI denoising using Non-Local Means. Med. Image Anal. 2008, 12, 514–523. [Google Scholar] [CrossRef] [PubMed]
  40. Naegel, B.; Cernicanu, A.; Hyacinthe, J.-N.; Tognolini, M.; Vallée, J.-P. SNR enhancement of highly-accelerated real-time cardiac MRI acquisitions based on non-local means algorithm. Med. Image Anal. 2009, 13, 598–608. [Google Scholar] [CrossRef] [PubMed]
  41. Adluru, G.; Tasdizen, T.; Schabel, M.C.; DiBella, E. Reconstruction of 3D dynamic contrast-enhanced magnetic resonance imaging using nonlocal means. J. Magn. Reson. Imaging 2010, 32, 1217–1227. [Google Scholar] [CrossRef]
  42. Gal, Y.; Mehnert, A.; Bradley, A.P.; McMahon, K.; Kennedy, D.; Crozier, S. Denoising of Dynamic Contrast-Enhanced MR Images Using Dynamic Nonlocal Means. IEEE Trans. Med. Imaging 2009, 29, 302–310. [Google Scholar] [CrossRef]
  43. Liu, H.; Yang, C.; Pan, N.; Song, E.; Green, R. Denoising 3D MR images by the enhanced non-local means filter for Rician noise. Magn. Reson. Imaging 2010, 28, 1485–1496. [Google Scholar] [CrossRef]
  44. Manjón, J.V.; Coupé, P.; Martí-Bonmatí, L.; Collins, D.L.; Robles, M. Adaptive non-local means denoising of MR images with spatially varying noise levels. J. Magn. Reson. Imaging 2009, 31, 192–203. [Google Scholar] [CrossRef] [PubMed] [Green Version]
  45. Wong, A.; Mishra, A.K. Quasi-Monte Carlo Estimation Approach for Denoising MRI Data Based on Regional Statistics. IEEE Trans. Biomed. Eng. 2011, 58, 1076–1083. [Google Scholar] [CrossRef] [PubMed]
  46. Hu, J.; Pu, Y.; Wu, X.; Zhang, Y.; Zhou, J. Improved DCT-Based Nonlocal Means Filter for MR Images Denoising. Comput. Math. Methods Med. 2012, 2012, 1–14. [Google Scholar] [CrossRef] [PubMed]
  47. Tristán-Vega, A.; García-Pérez, V.; Aja-Fernández, S.; Westin, C.-F. Efficient and robust nonlocal means denoising of MR data based on salient features matching. Comput. Methods Programs Biomed. 2012, 105, 131–144. [Google Scholar] [CrossRef] [Green Version]
  48. Bhujle, H.V.; Chaudhuri, S. Laplacian based non-local means denoising of MR images with Rician noise. Magn. Reson. Imaging 2013, 31, 1599–1610. [Google Scholar] [CrossRef]
  49. Wu, X.; Liu, S.; Wu, M.; Sun, H.; Zhou, J.; Qiyong, G.; Ding, Z. Nonlocal denoising using anisotropic structure tensor for 3D MRI. Med. Phys. 2013, 40, 101904. [Google Scholar] [CrossRef]
  50. Mizukuchi, T.; Fujii, M.; Hayashi, Y.; Tsuzaka, M. Adapting non-local means of de-noising in intraoperative magnetic resonance imaging for brain tumor surgery. Radiol. Phys. Technol. 2013, 7, 124–132. [Google Scholar] [CrossRef]
  51. Zhang, X.; Hou, G.; Ma, J.; Yang, W.; Lin, B.; Xu, Y.; Chen, W.; Feng, Y. Denoising MR Images Using Non-Local Means Filter with Combined Patch and Pixel Similarity. PLoS ONE 2014, 9, e100240. [Google Scholar] [CrossRef] [Green Version]
  52. Borrelli, P.; Palma, G.; Tedeschi, E.; Cocozza, S.; Comerci, M.; Alfano, B.; Haacke, E.M.; Salvatore, M. Improving Signal-to-Noise Ratio in Susceptibility Weighted Imaging: A Novel Multicomponent Non-Local Approach. PLoS ONE 2015, 10, e0126835. [Google Scholar] [CrossRef] [Green Version]
  53. Liu, C.; ChaoBang, G.; Xi, Y. A MRI Denoising Method Based on 3D Nonlocal Means and Multidimensional PCA. Comput. Math. Methods Med. 2015, 2015, 1–11. [Google Scholar] [CrossRef] [Green Version]
  54. Manjón, J.V.; Coupé, P.; Buades, A. MRI noise estimation and denoising using non-local PCA. Med. Image Anal. 2015, 22, 35–47. [Google Scholar] [CrossRef] [PubMed]
  55. Yang, J.; Fan, J.; Ai, D.; Zhou, S.; Tang, S.; Wang, Y. Brain MR image denoising for Rician noise using pre-smooth non-local means filter. Biomed. Eng. Online 2015, 14, 2. [Google Scholar] [CrossRef] [PubMed] [Green Version]
  56. Chen, G.; Zhang, P.; Wu, Y.; Shen, D.; Yap, P.-T. Denoising magnetic resonance images using collaborative non-local means. Neurocomputing 2016, 177, 215–227. [Google Scholar] [CrossRef] [PubMed] [Green Version]
  57. Hu, J.; Zhou, J.; Wu, X. Non-local MRI denoising using random sampling. Magn. Reson. Imaging 2016, 34, 990–999. [Google Scholar] [CrossRef]
  58. Singh, C.; Ranade, S.K.; Singh, K. Invariant moments and transform-based unbiased nonlocal means for denoising of MR images. Biomed. Signal. Process. Control. 2016, 30, 13–24. [Google Scholar] [CrossRef]
  59. Tricot, B.; Descoteaux, M.; Dumont, M.; Chagnon, F.; Tremblay, L.; Carpentier, A.C.; Lesur, O.; Lepage, M.; Lalande, A. Improving the evaluation of cardiac function in rats at 7T with denoising filters: A comparison study. BMC Med. Imaging 2017, 17, 62. [Google Scholar] [CrossRef] [Green Version]
  60. Chen, G.; Dong, B.; Zhang, Y.; Lin, W.; Shen, D.; Yap, P.-T. Denoising of Diffusion MRI Data via Graph Framelet Matching in x-q Space. IEEE Trans. Med. Imaging 2019, 38, 2838–2848. [Google Scholar] [CrossRef]
  61. Chen, G.; Wu, Y.; Shen, D.; Yap, P.-T. Noise reduction in diffusion MRI using non-local self-similar information in joint x−q space. Med. Image Anal. 2019, 53, 79–94. [Google Scholar] [CrossRef]
  62. Yu, H.; Ding, M.; Zhang, X. Laplacian Eigenmaps Network-Based Nonlocal Means Method for MR Image Denoising. Sensors 2019, 19, 2918. [Google Scholar] [CrossRef] [Green Version]
  63. Chen, K.; Lin, X.; Hu, X.; Wang, J.; Zhong, H.; Jiang, L. An enhanced adaptive non-local means algorithm for Rician noise reduction in magnetic resonance brain images. BMC Med. Imaging 2020, 20, 1–9. [Google Scholar] [CrossRef]
  64. Kwan, R.-S.; Evans, A.; Pike, G.B. MRI simulation-based evaluation of image-processing and classification methods. IEEE Trans. Med. Imaging 1999, 18, 1085–1097. [Google Scholar] [CrossRef] [PubMed]
  65. Liu, F.; Velikina, J.V.; Block, W.F.; Kijowski, R.; Samsonov, A.A. Fast Realistic MRI Simulations Based on Generalized Multi-Pool Exchange Tissue Model. IEEE Trans. Med. Imaging 2016, 36, 527–537. [Google Scholar] [CrossRef] [PubMed] [Green Version]
Figure 1. Types of non-local means (NLM)-based noise reduction techniques for magnetic resonance (MR) images.
Applsci 10 07028 g001
Figure 2. Flowchart of the method used for selection of publications. Through searches of three search databases, 52 papers were identified based on our criteria after removing duplicate articles.
Applsci 10 07028 g002
Figure 3. Graph of the number of publications per year, including the polynomial fitting curve.
Applsci 10 07028 g003
Figure 4. (a) Graph of the number of publications for the various MR image acquisition techniques using the NLM noise reduction algorithm. The final classification included 25 papers; of those, three major categories of techniques were investigated. (b) The total number of papers as a function of the publication year.
Applsci 10 07028 g004
Figure 5. (a) Graph of the number of publications for various target organs of MR imaging scans using the NLM noise reduction algorithm. The final classification included 25 papers; of those, four major categories of techniques were investigated. (b) The total number of papers as a function of the publication year.
Applsci 10 07028 g005
Figure 6. (a) Graph of the number of publications of MR imaging using the NLM noise reduction algorithm. The final classification included 25 papers; of those, three major categories of techniques were investigated (real, simulated, and both). Within the “both” category, studies were further classified depending on their use of BrainWeb. (b) The total number of papers as function of the publication year.
Applsci 10 07028 g006
Figure 7. (a) Graph of the number of publications using MR imaging with the NLM noise reduction algorithm for various evaluation parameters. The final classification included 25 papers; of those, three major categories of techniques were investigated. (b) The total number of papers as a function of the publication year.
Applsci 10 07028 g007
Table 1. Search strategies using the EMBASE, MEDILINE EBSCO, and Cochrane engines.
Search EngineSearch Strategies
EMBASEDenoising (candidate term) or Noise reduction (Emtree) or Noise removal
(AND)
Non-local means or NLM or Non local means
(AND)
Nuclear magnetic resonance imaging (Emtree) or MRI or Magnetic resonance imaging or MR image
MEDLINE EBSCODenoising or Noise Reduction or Noise removal
(AND)
Non-local means or NLM or Non local means
(AND)
Nuclear magnetic resonance imaging or MRI or Magnetic resonance imaging (MeSH term) or MR image
CochraneDenoising or Noise Reduction or Noise removal
(AND)
Non-local means or NLM or Non local means
(AND)
Nuclear magnetic resonance imaging or MRI or Magnetic resonance imaging (MeSH descriptor) or MR image
Table 2. Characteristics for MR imaging techniques from studies retrieved for systematic review.
StudyYearMR Imaging TechniqueUsed Specific Technique
Manjon et al. [39]2008General techniqueT1, T2, PD
Baegel et al. [40]2009Special techniqueParallel imaging
Adluru et al. [41]2010Special techniqueDynamic contrast enhanced technique
Gal et al. [42]2010Special techniqueDynamic contrast enhanced technique
Liu et al. [43]2010General techniqueT1, T2, PD
Manjon et al. [44]2010BothT1, T2, PD + GRAPPA, SENSE sequences
Wong et al. [45]2011General techniqueT1, T2, PD
Ha et al. [46]2012General techniqueT1, T2, PD
Tristan-Vega et al. [47]2012BothT1 + DWI, DTI
Bhujle et al. [48]2013General techniqueT1, T2
Wu et al. [49]2013BothT1, T2, PD + DWI, DTI
Mizukuchi et al. [50]2014General techniqueT1, T2
Zhang et al. [51]2014BothT1, T2, PD + DWI
Borrelli et al. [52]2015Special techniqueSusceptibility weighted imaging (SWI)
Chang et al. [53]2015General techniqueT1
Manjon et al. [54]2015General techniqueT1
Yang et al. [55]2015General techniqueT1, T2, PD
Chen et al. [56]2016General techniqueT1
Hu et al. [57]2016BothT1, T2, PD + Internet brain segmentation
Singh et al. [58]2016General techniqueT1, T2, PD
Tricot et al. [59]2017Special techniqueFLASH sequence
Chen et al. [60]2019Special techniqueDWI
Chen et al. [61]2019Special techniqueDWI
Yu et al. [62]2019General techniqueT1, T2, PD
Chen et al. [63]2020General techniqueT1
Table 3. Characteristics for target organs of MR imaging from studies retrieved for systematic review.
StudyYearTarget Organ
Manjon et al. [39]2008Other (Brain + Abdomen)
Baegel et al. [40]2009Cardiac
Adluru et al. [41]2010Other (Brain + Breast)
Gal et al. [42]2010Breast
Liu et al. [43]2010Brain
Manjon et al. [44]2010Brain
Wong et al. [45]2011Brain
Ha et al. [46]2012Brain
Tristan-Vega et al. [47]2012Brain
Bhujle et al. [48]2013Other (Brain + Knee)
Wu et al. [49]2013Brain
Mizukuchi et al. [50]2014Brain
Zhang et al. [51]2014Brain
Borrelli et al. [52]2015Brain
Chang et al. [53]2015Brain
Manjon et al. [54]2015Brain
Yang et al. [55]2015Brain
Chen et al. [56]2016Brain
Hu et al. [57]2016Brain
Singh et al. [58]2016Brain
Tricot et al. [59]2017Cardiac
Chen et al. [60]2019Brain
Chen et al. [61]2019Brain
Yu et al. [62]2019Brain
Chen et al. [63]2020Brain
Table 4. Characteristics for types of study from studies retrieved for systematic review.
StudyYearTypes of StudyUsed Simulation Program
Manjon et al. [39]2008BothBrainWeb simulation program
Baegel et al. [40]2009Experiment-
Adluru et al. [41]2010Experiment-
Gal et al. [42]2010Experiment-
Liu et al. [43]2010SimulationBrainWeb simulation program
Manjon et al. [44]2010BothBrainWeb simulation program
Wong et al. [45]2011BothBrainWeb simulation program
Ha et al. [46]2012SimulationBrainWeb simulation program
Tristan-Vega et al. [47]2012BothBrainWeb simulation program
Bhujle et al. [48]2013BothBrainWeb simulation program
Wu et al. [49]2013BothBrainWeb simulation program
Mizukuchi et al. [50]2014BothBrainWeb simulation program
Zhang et al. [51]2014BothBrainWeb simulation program
Borrelli et al. [52]2015Experiment-
Chang et al. [53]2015BothBrainWeb simulation program
Manjon et al. [54]2015BothBrainWeb simulation program
Yang et al. [55]2015SimulationBrainWeb simulation program
Chen et al. [56]2016BothBrainWeb simulation program
Hu et al. [57]2016BothBrainWeb simulation program
Singh et al. [58]2016BothBrainWeb simulation program
Tricot et al. [59]2017Experiment-
Chen et al. [60]2019BothNo BrainWeb
Chen et al. [61]2019BothNo BrainWeb
Yu et al. [62]2019BothBrainWeb simulation program
Chen et al. [63]2020BothBrainWeb simulation program
Table 5. Characteristics for the evaluation method of the NLM noise reduction algorithm in MR imaging, from studies retrieved for systematic review.
StudyYearEvaluation MethodUsed Specific Method
Manjon et al. [39]2008Comparison parameterRMSE
Baegel et al. [40]2009Quantitative parameterSNR
Adluru et al. [41]2010Quantitative parameterMean SI
Gal et al. [42]2010Comparison parameterRMSE (mean square error)
Liu et al. [43]2010Comparison parameterPSNR
Manjon et al. [44]2010Comparison parameterPSNR
Wong et al. [45]2011BothSSIM + SNR
Ha et al. [46]2012Comparison parameterPSNR
Tristan-Vega et al. [47]2012Comparison parameterRMSE, SSIM
Bhujle et al. [48]2013Comparison parameterPSNR, SSIM, UQI, BC (Bhattacharya coefficient)
Wu et al. [49]2013Comparison parameterPSNR, RMSE, SSIM
Mizukuchi et al. [50]2014BothPSNR + SNR
Zhang et al. [51]2014Comparison parameterPSNR, SSIM
Borrelli et al. [52]2015Quantitative parameterCNR
Chang et al. [53]2015BothPSNR, SSIM + SNR
Manjon et al. [54]2015Comparison parameterPSNR, SSIM
Yang et al. [55]2015Comparison parameterPSNR
Chen et al. [56]2016Comparison parameterPSNR
Hu et al. [57]2016Comparison parameterPSNR, SSIM
Singh et al. [58]2016Comparison parameterPSNR, RMSE, SSIM, BC
Tricot et al. [59]2017Quantitative parameterSNR, CNR
Chen et al. [60]2019Comparison parameterPSNR
Chen et al. [61]2019Comparison parameterPSNR
Yu et al. [62]2019Comparison parameterPSNR, SSIM
Chen et al. [63]2020Comparison parameterPSNR, SSIM

