An Experimental Strain-Based Study on the Working State of Husk Mortar Wallboards with Openings


Abstract
1. Introduction
2. HMES Wallboards and Testing Preparation
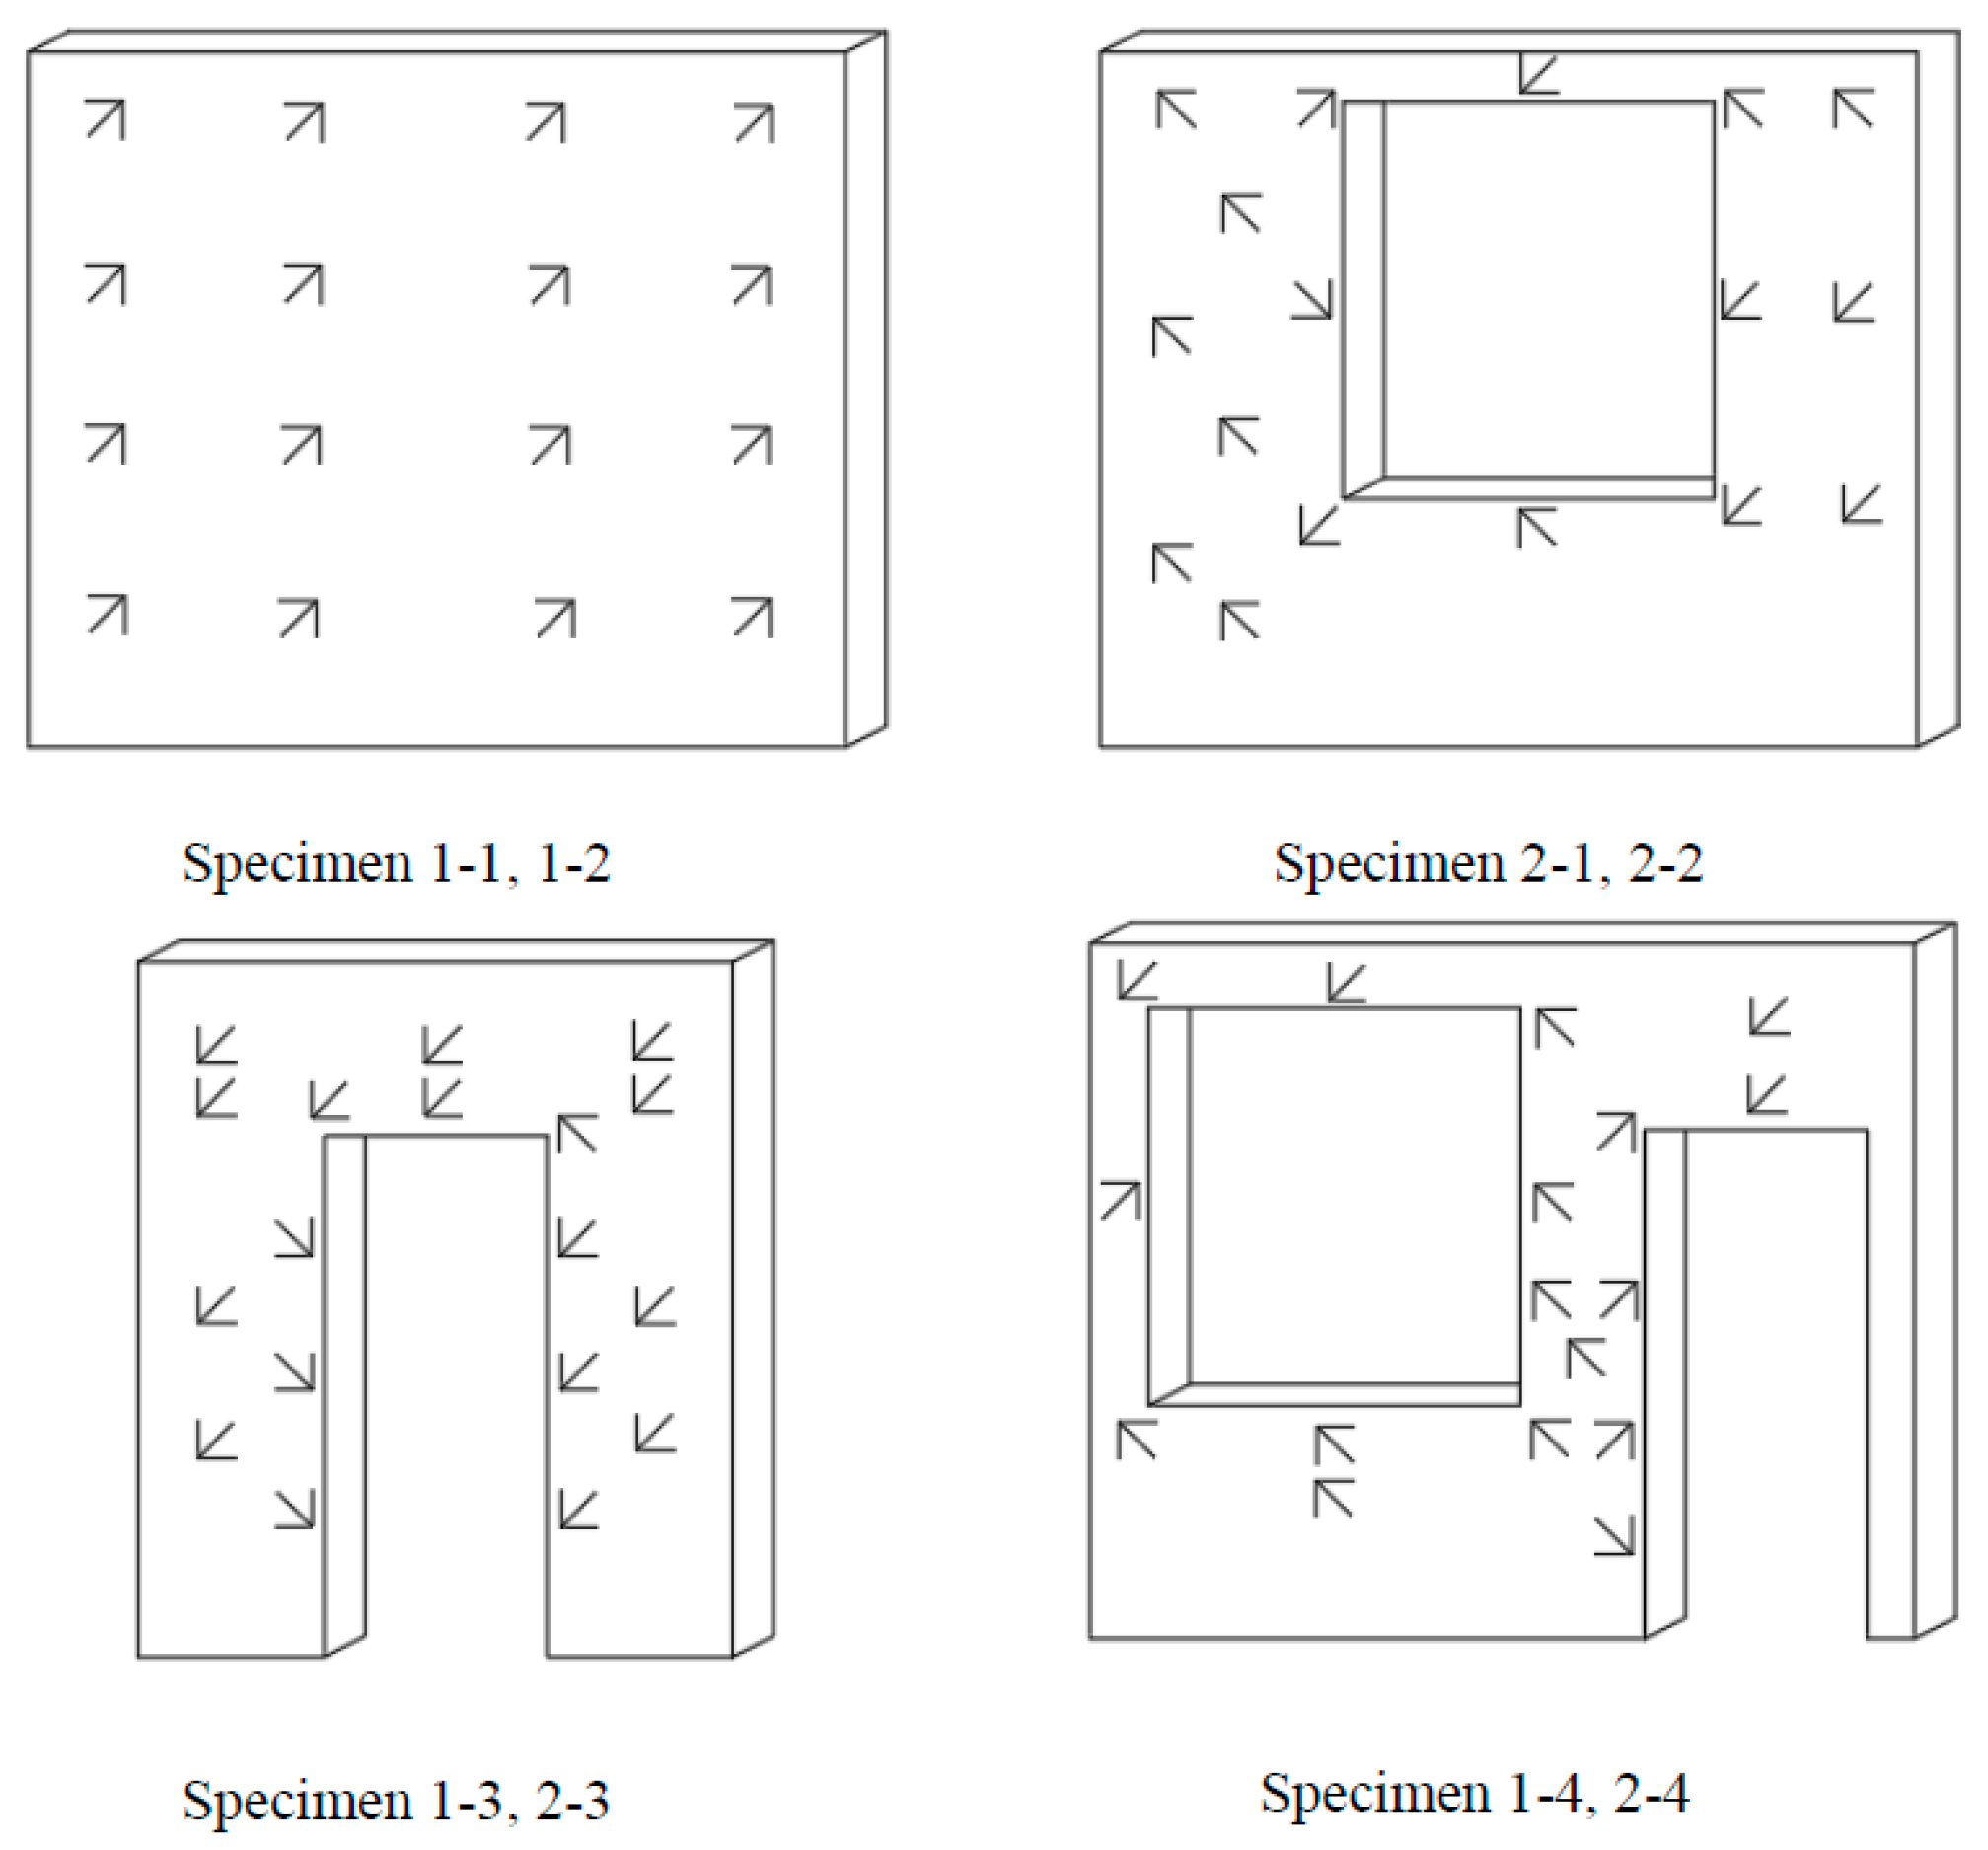
2.1. The Configuration and Size of the HMES Wallboards
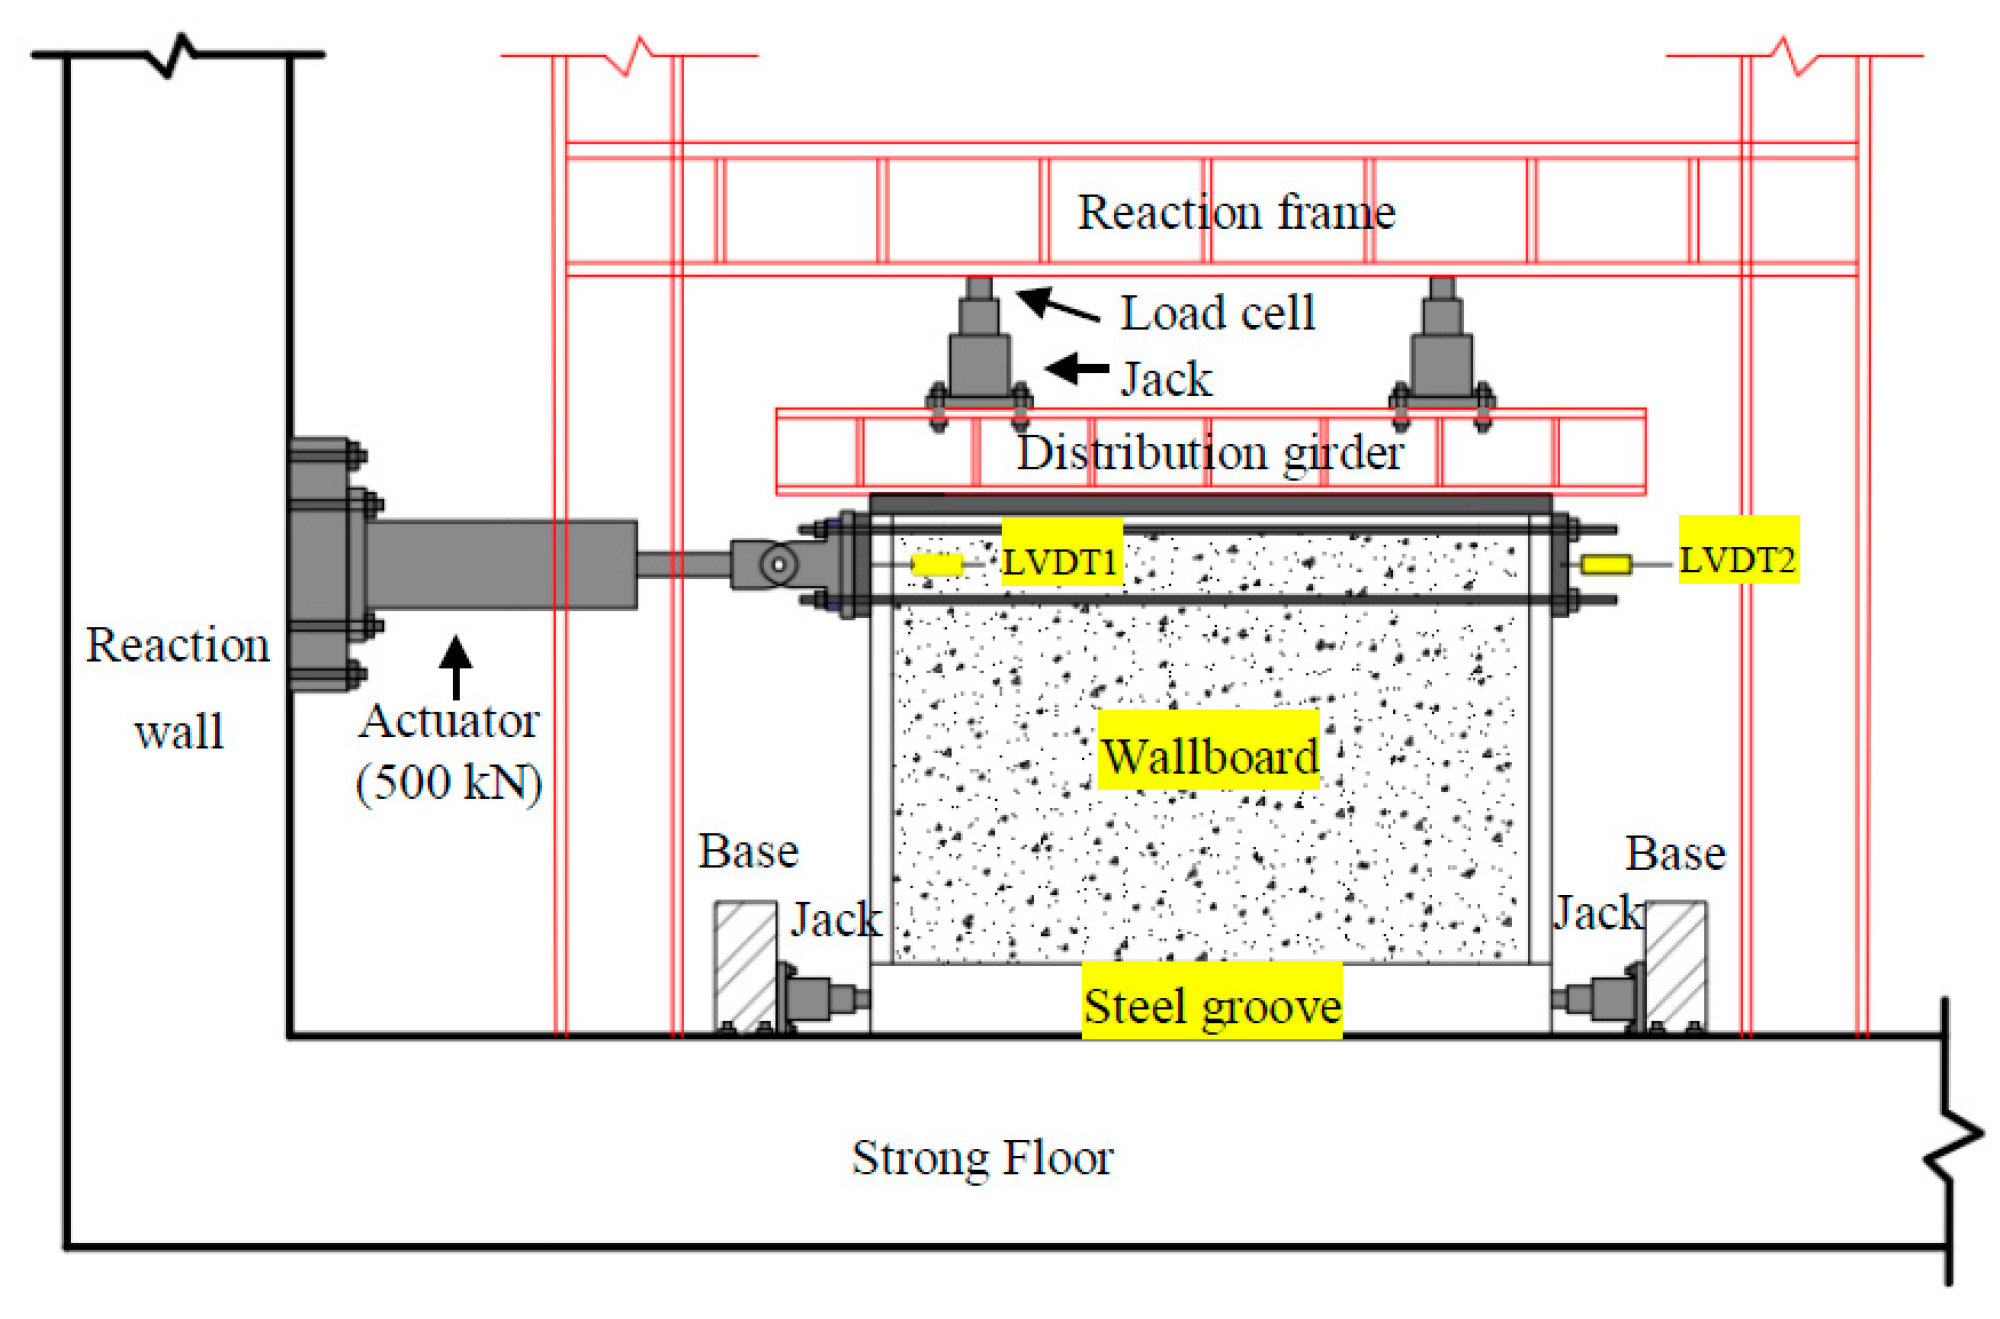
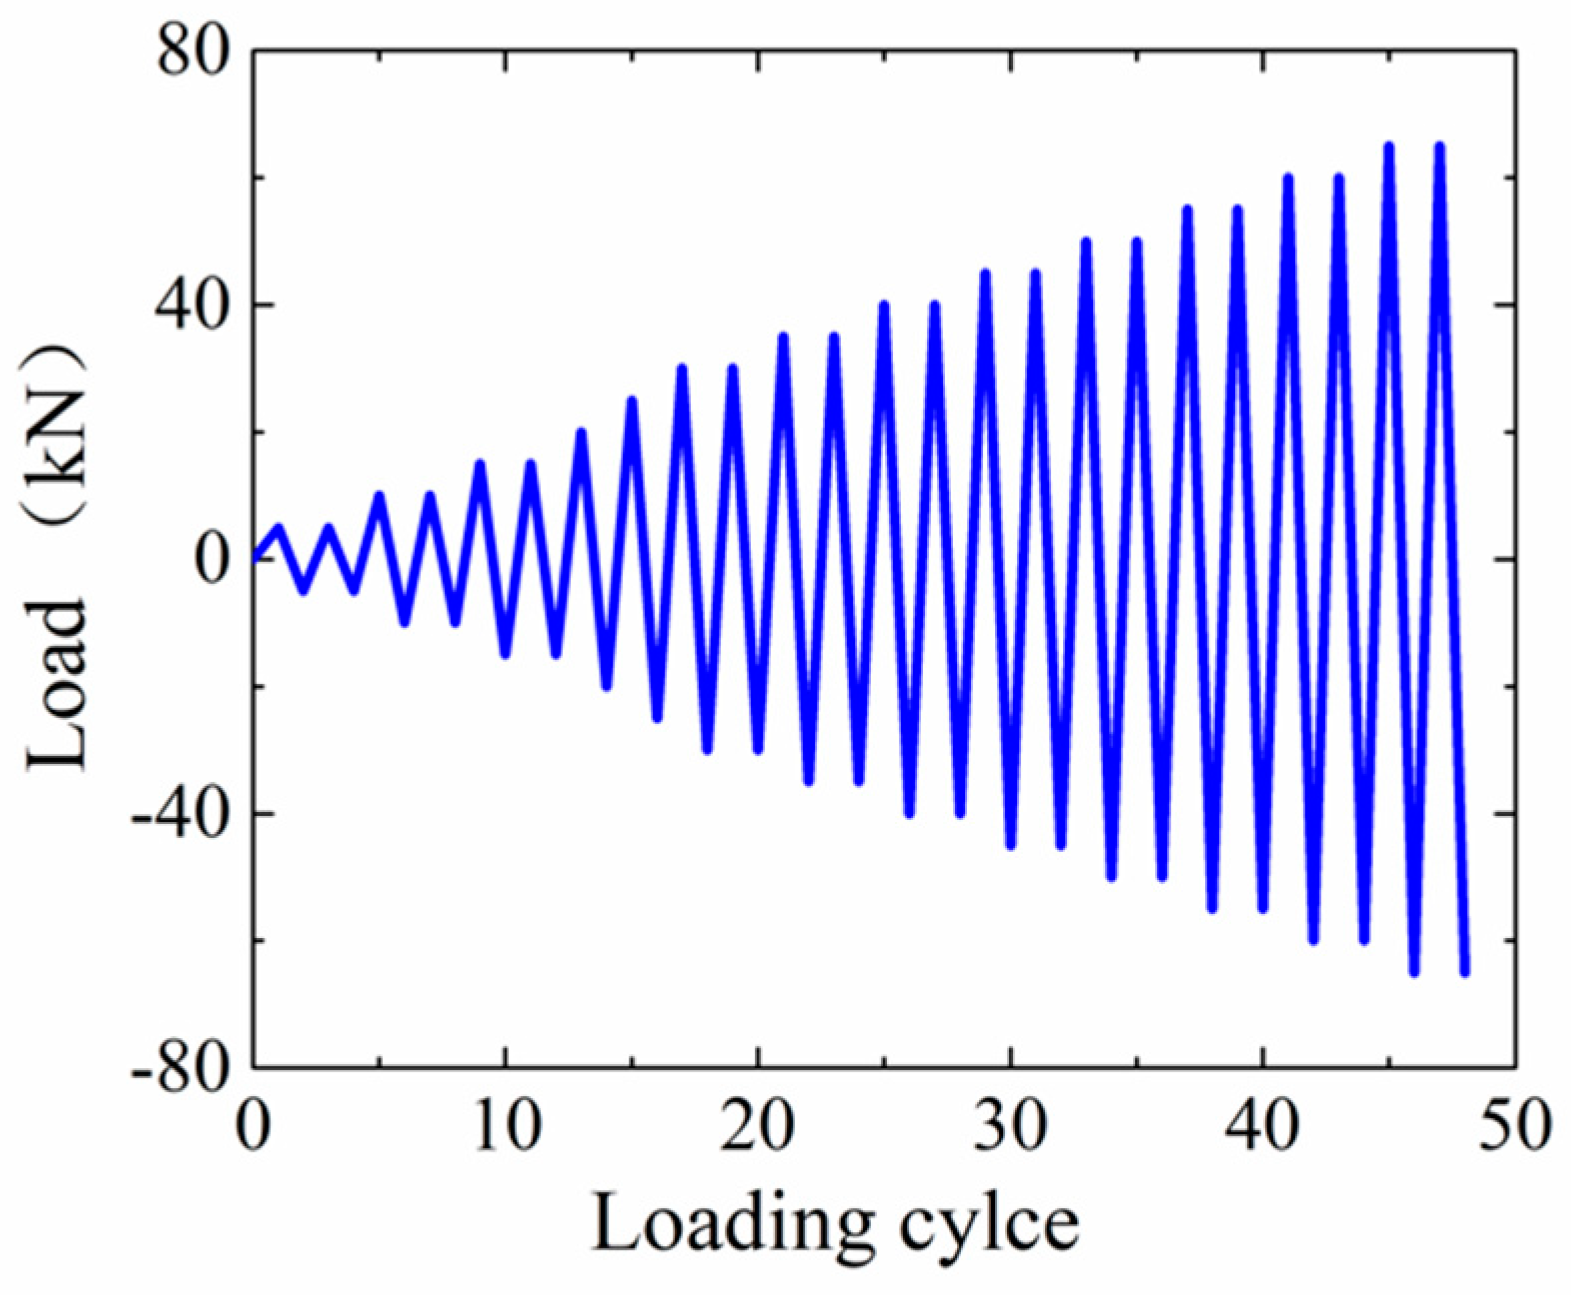
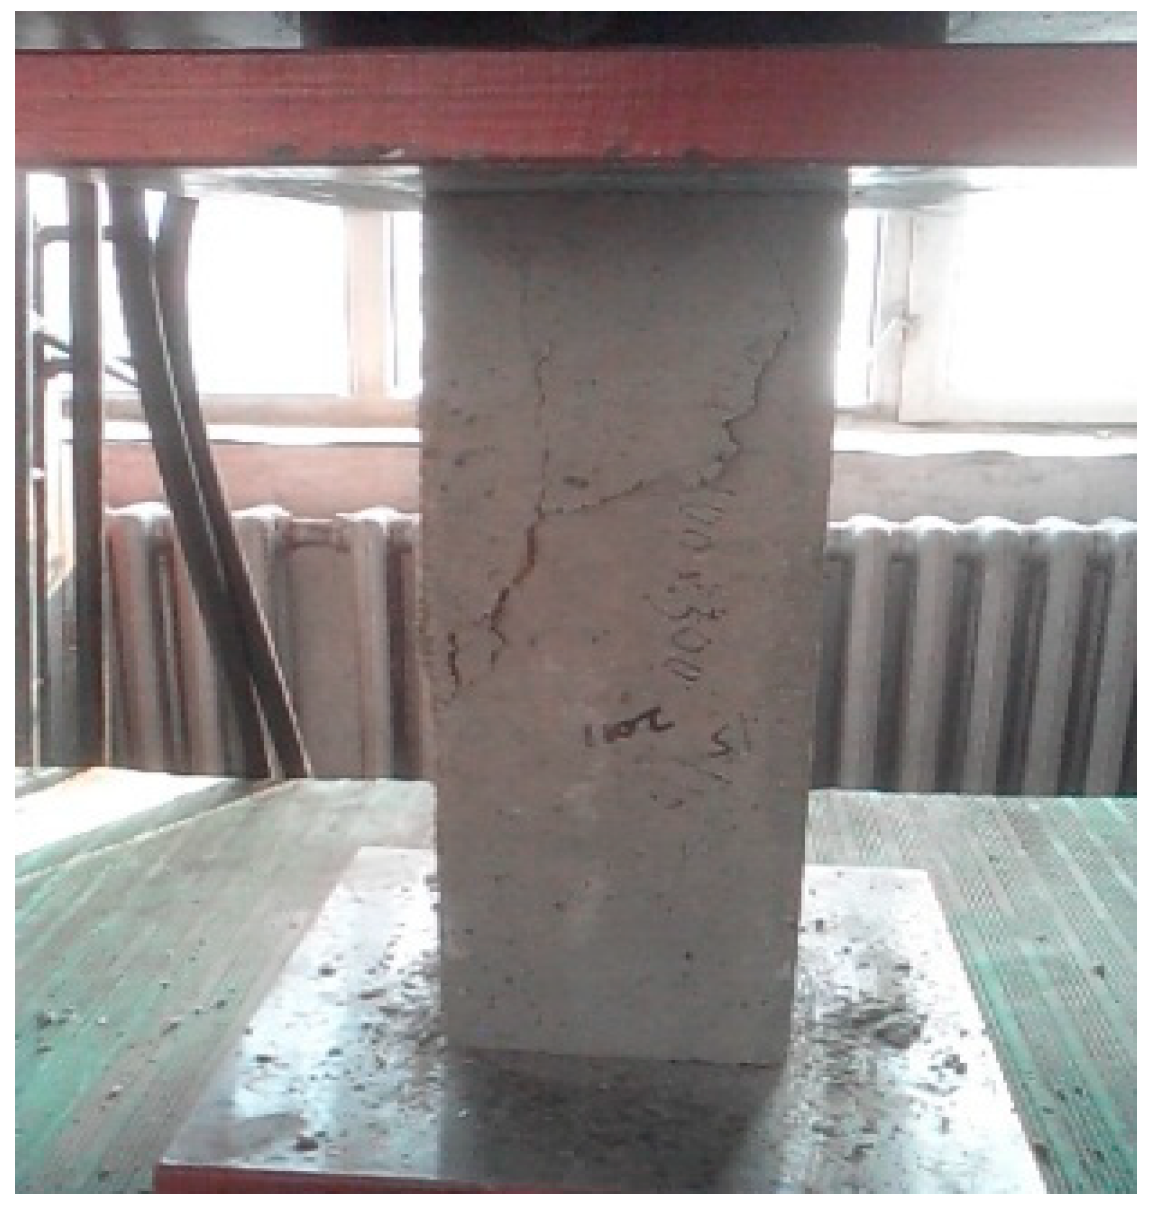
2.2. Experimental Device and Loading Scheme
2.3. Measuring Scheme
3. The Experimental Results
3.1. Test Results of Material Test
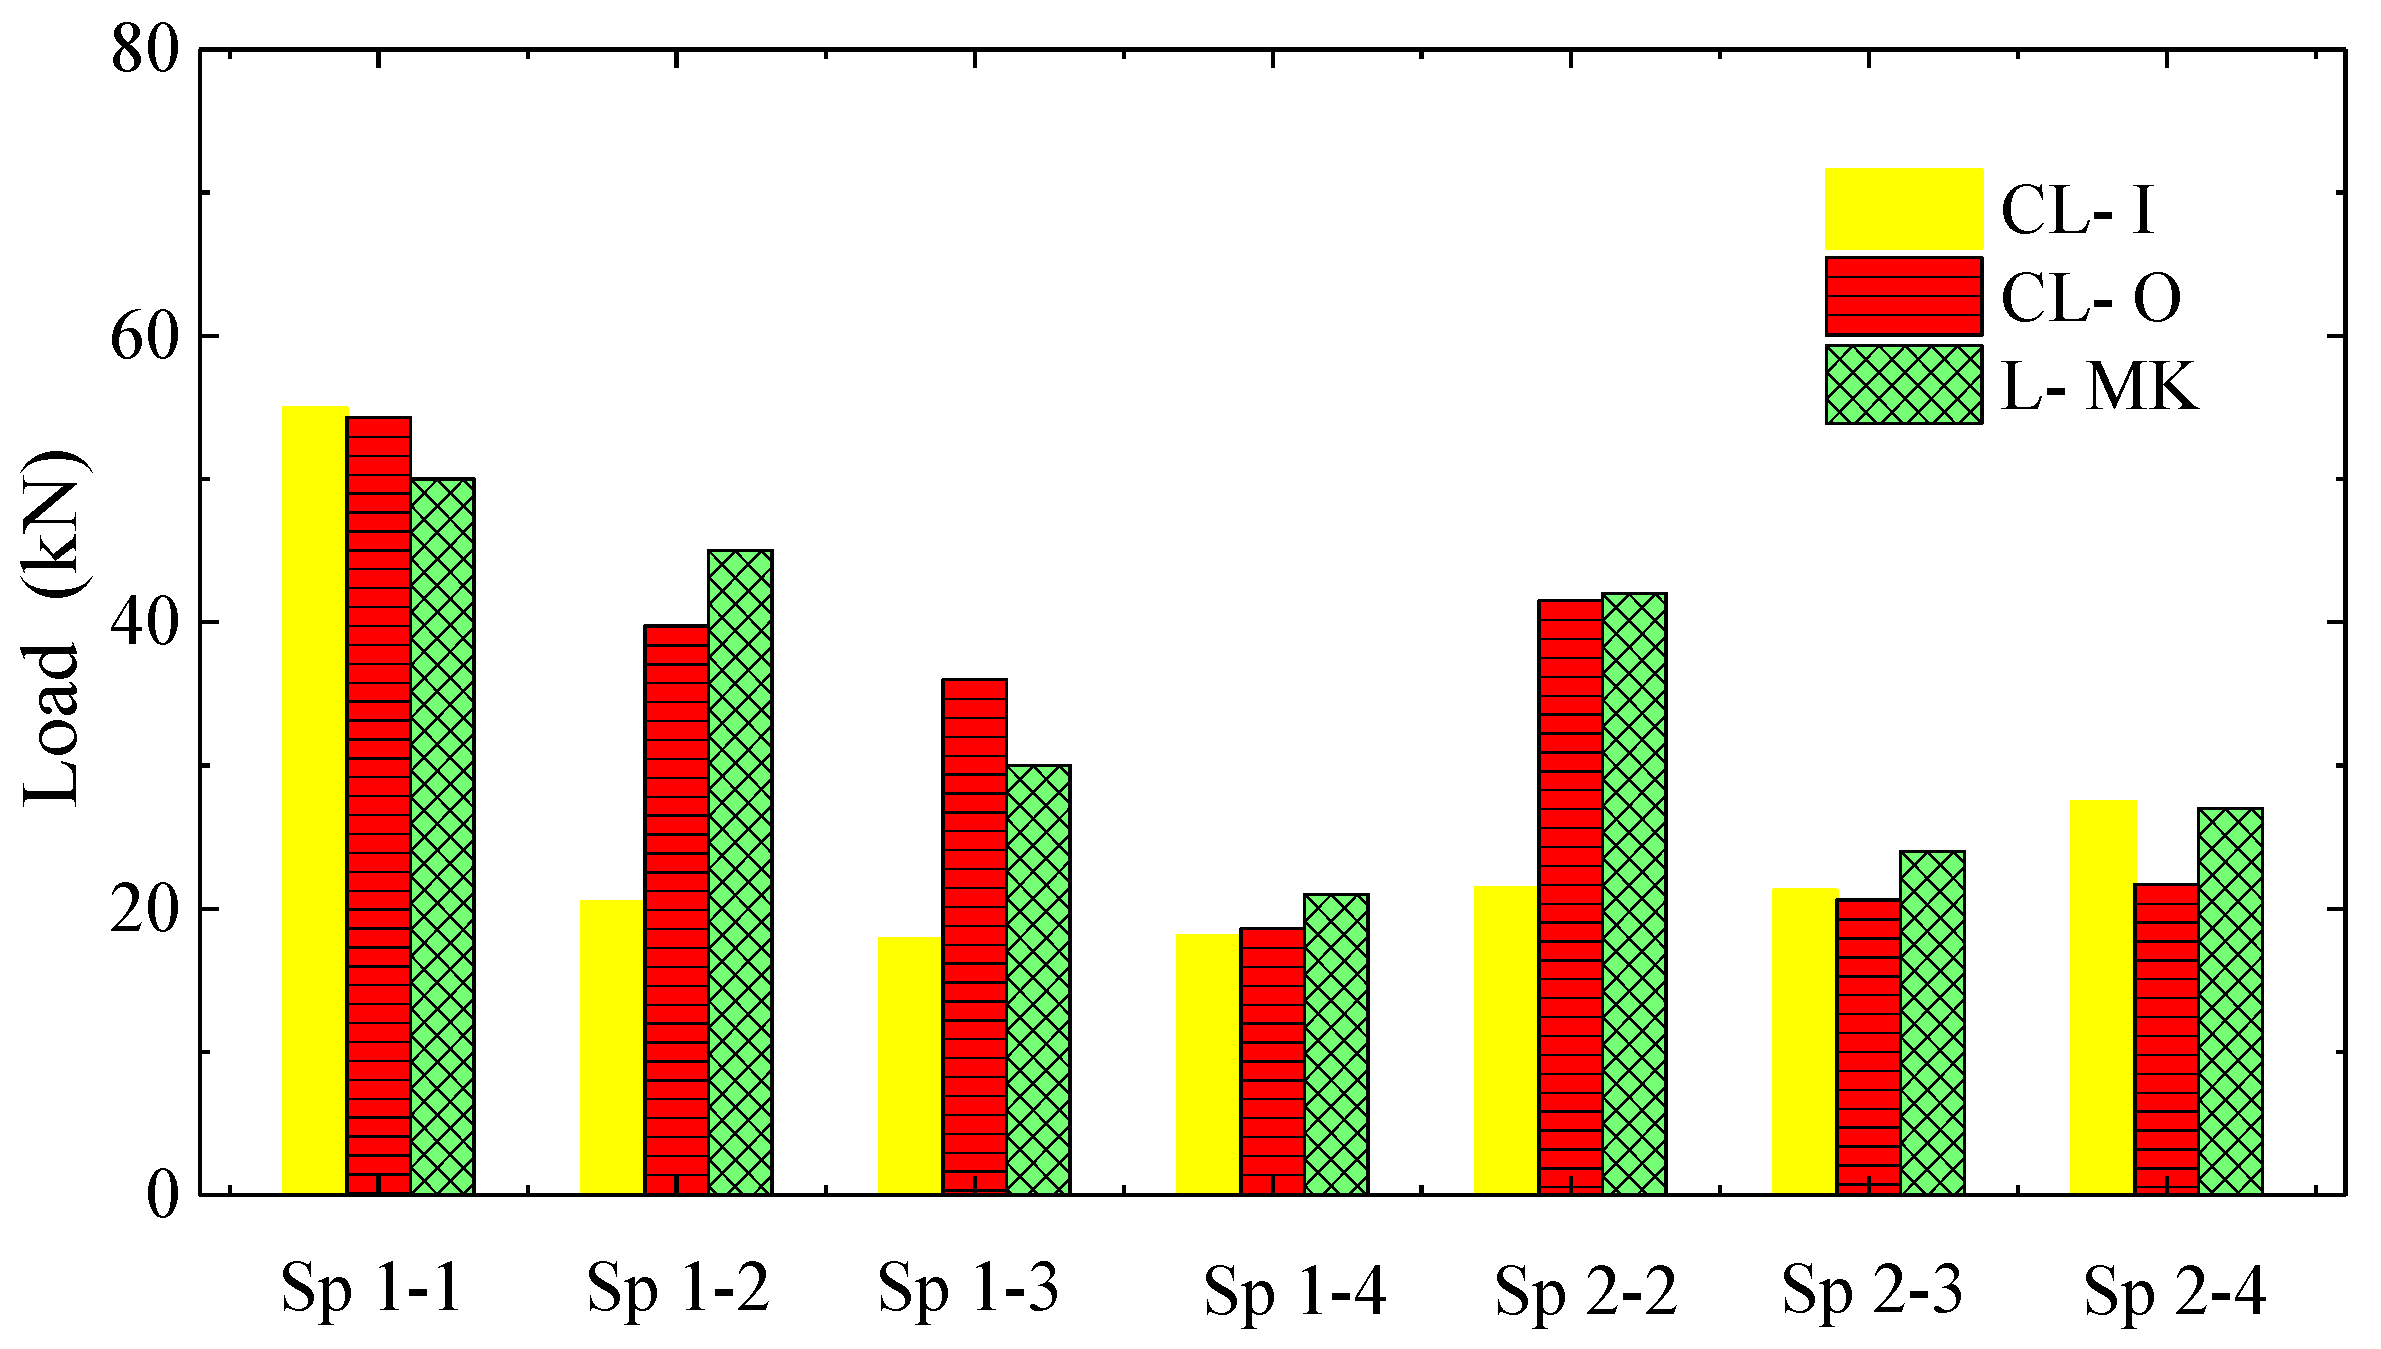
3.2. Test Results of HMES Wallboords
4. Data Analysis
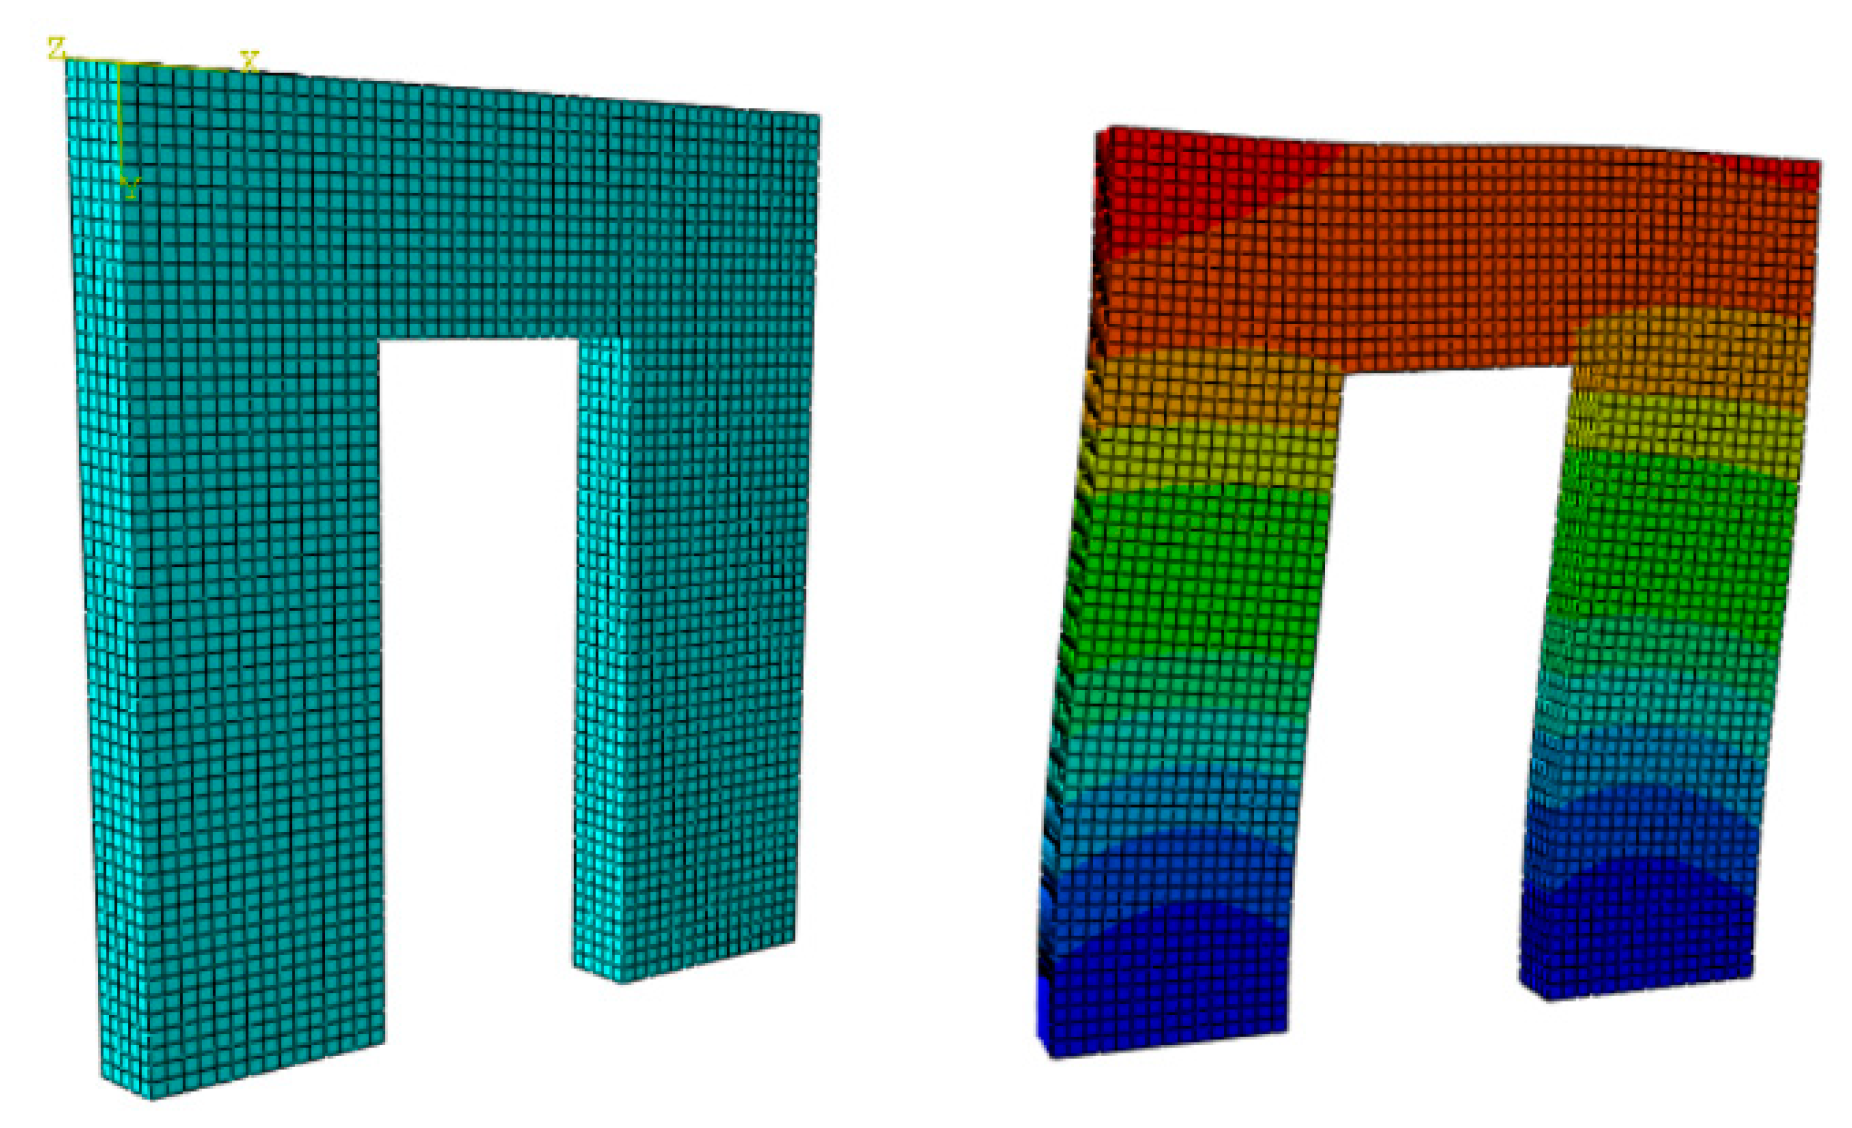
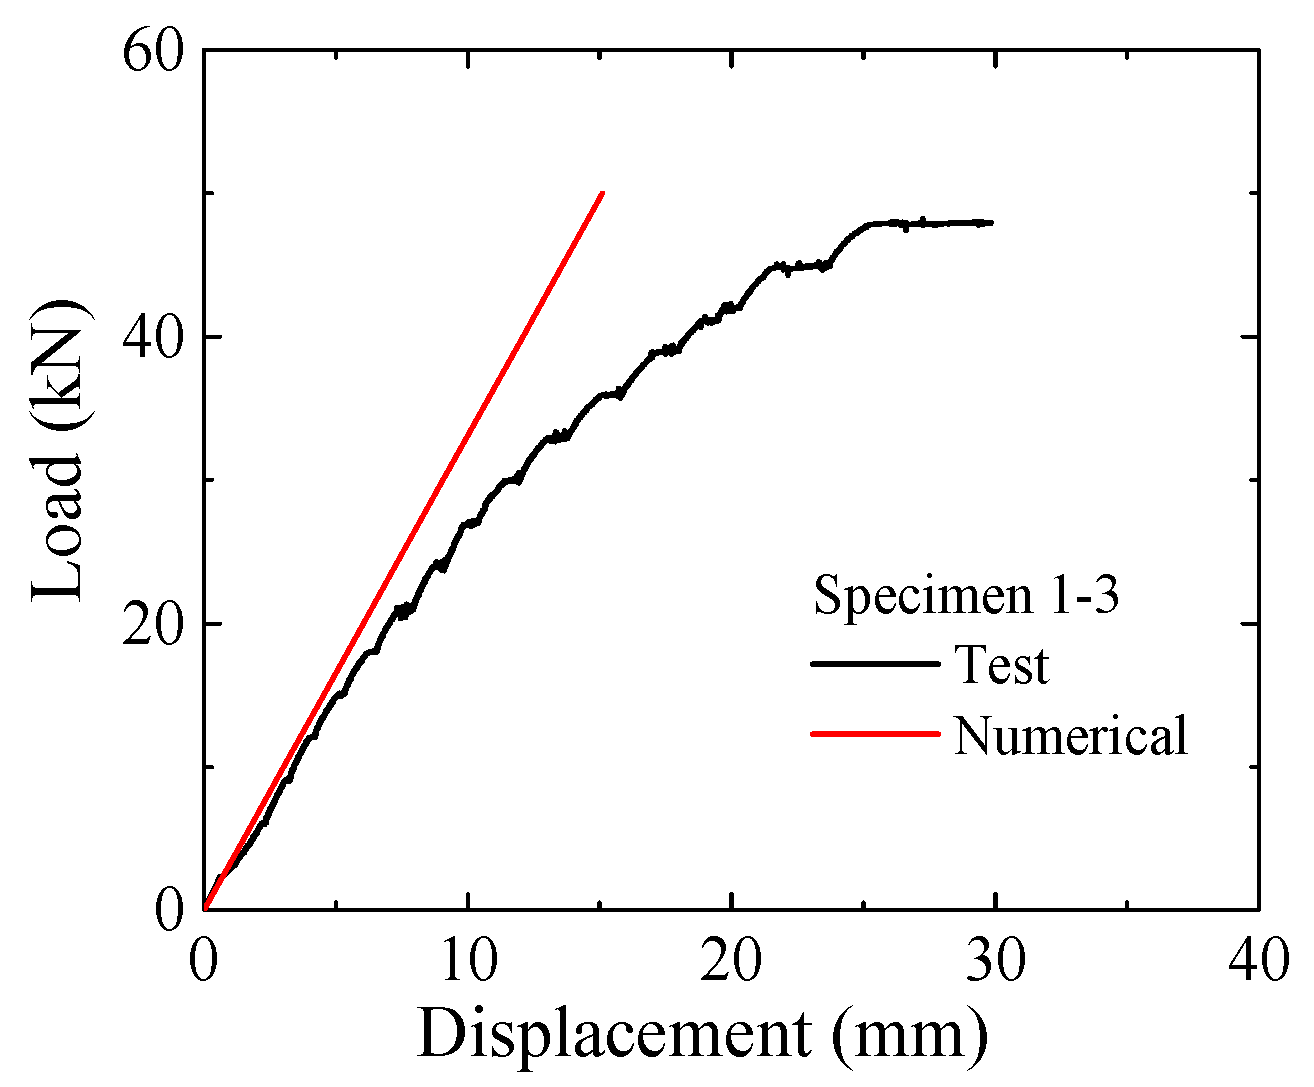
4.1. FE Model
4.2. The Characteristic Parameters
- (a)
- is just an approximate strain energy parameter of the wallboard since it is calculated using a limited number of experimental strain values. Furthermore, approximately reflects the global behavior of the wallboard under lateral load. However, might better reflect the real working behavior of the wallboard than conventional numerical simulation because of the direct application of experimental data.
- (b)
- At present, a large amount of experimental strain data has not been fully used in the field of structural analysis. Hence, the introduction of represents a methodological attempt to reflect some unseen global working behavior of the wallboard (it could be as a structure) by applying experimental strain values.
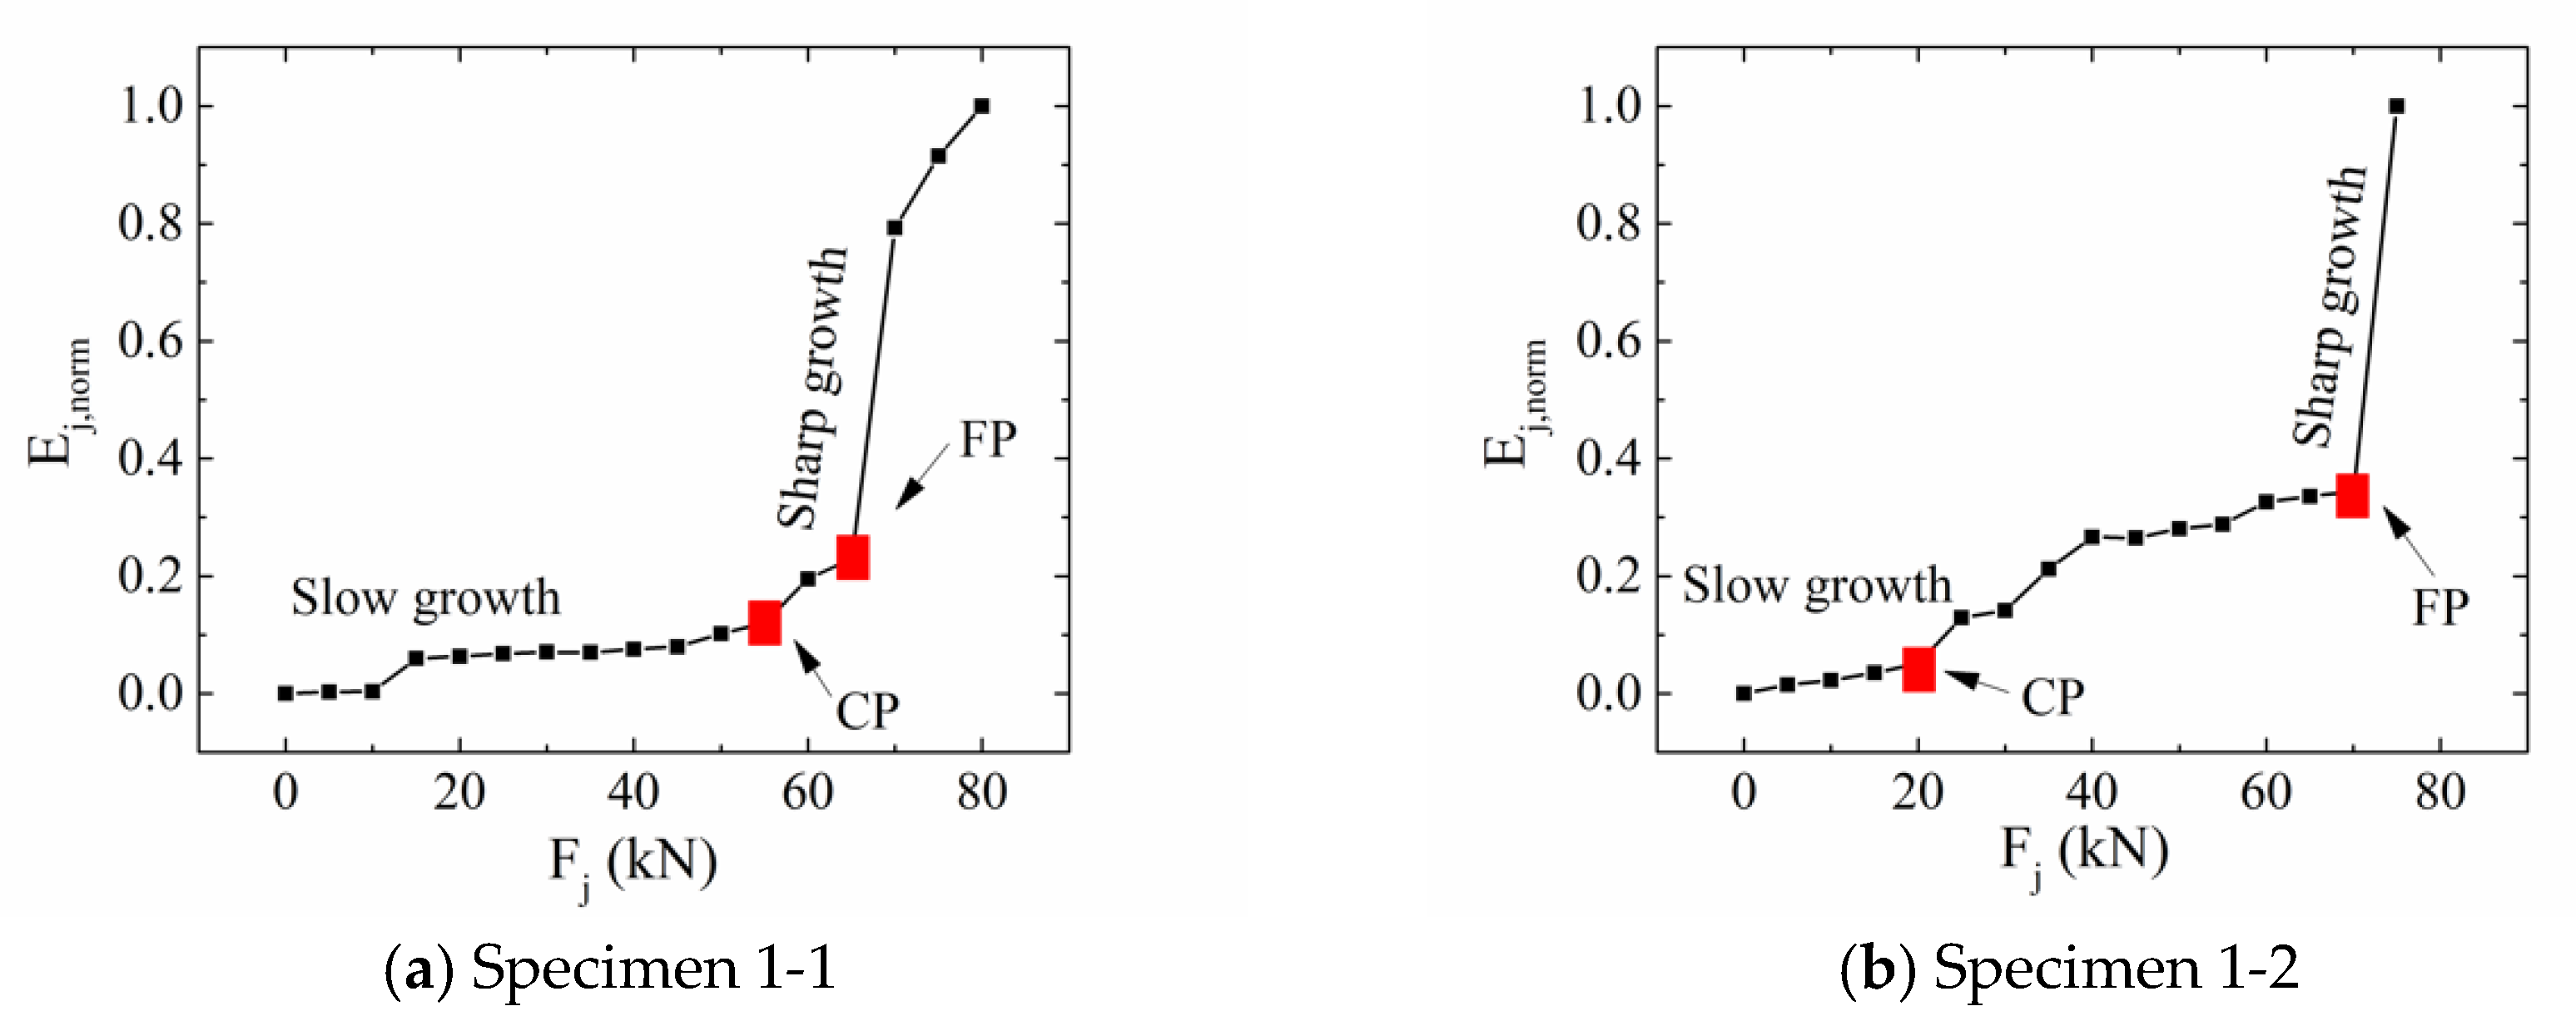
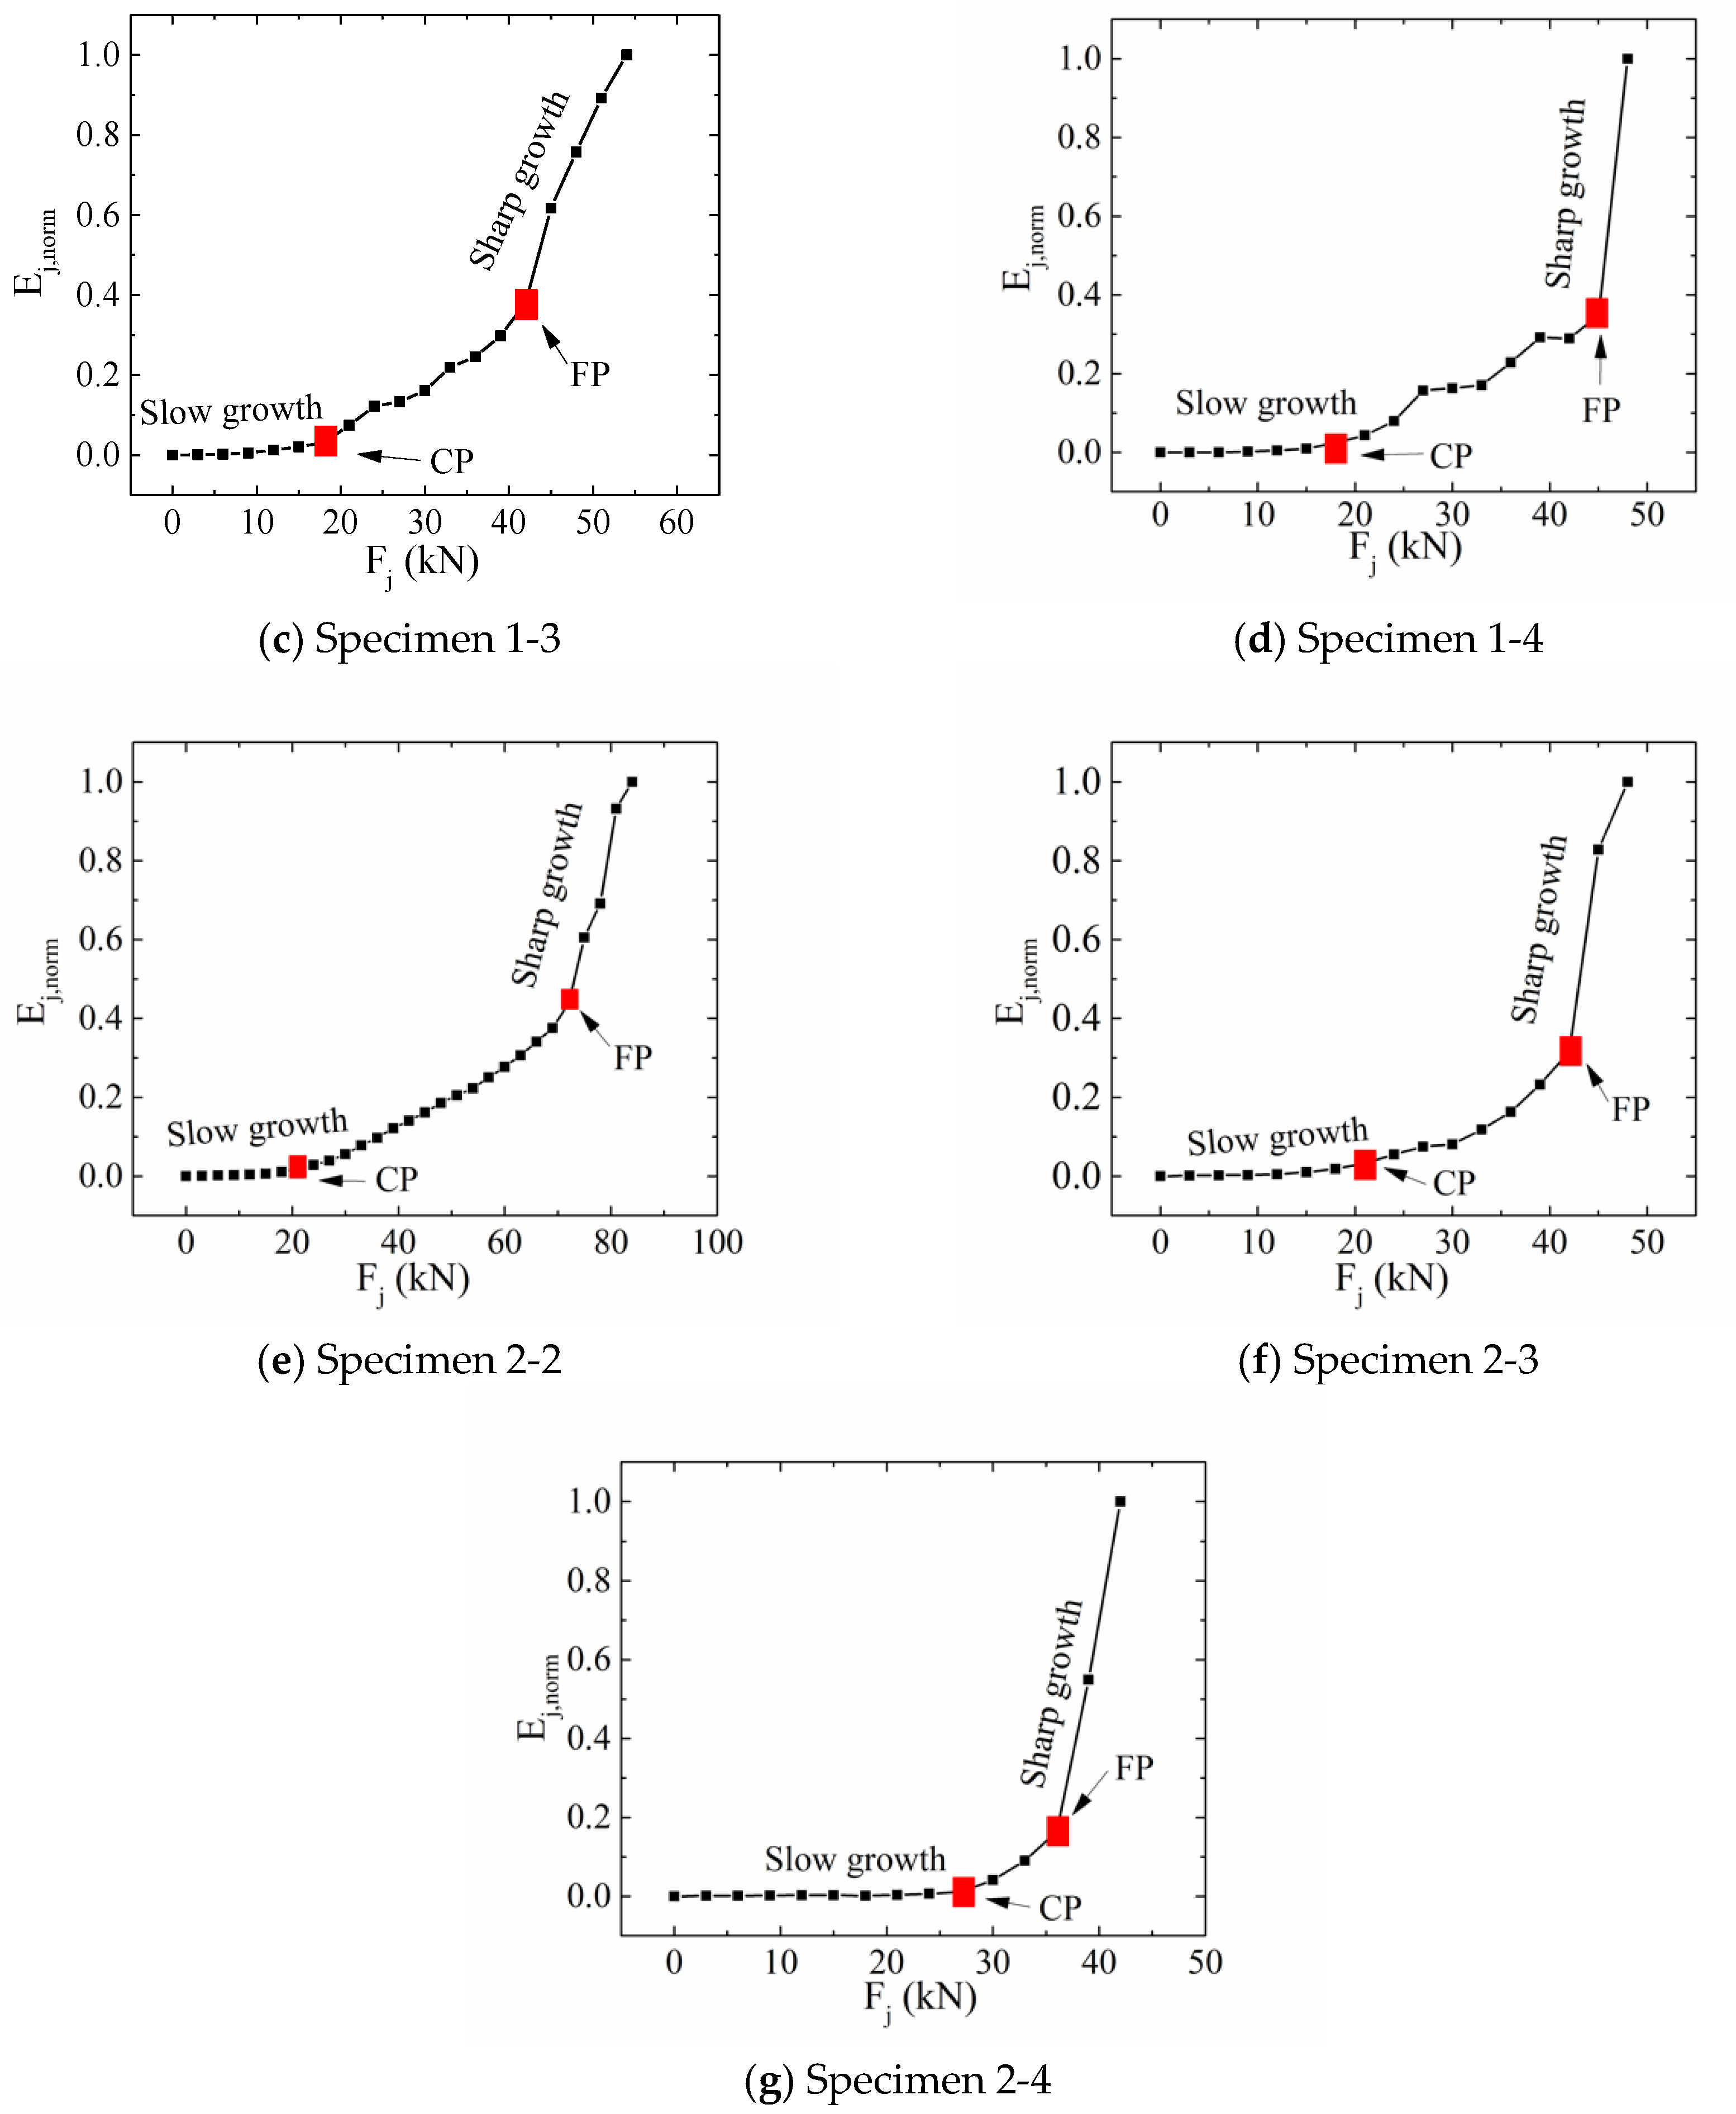
4.3. Characteristic Curve
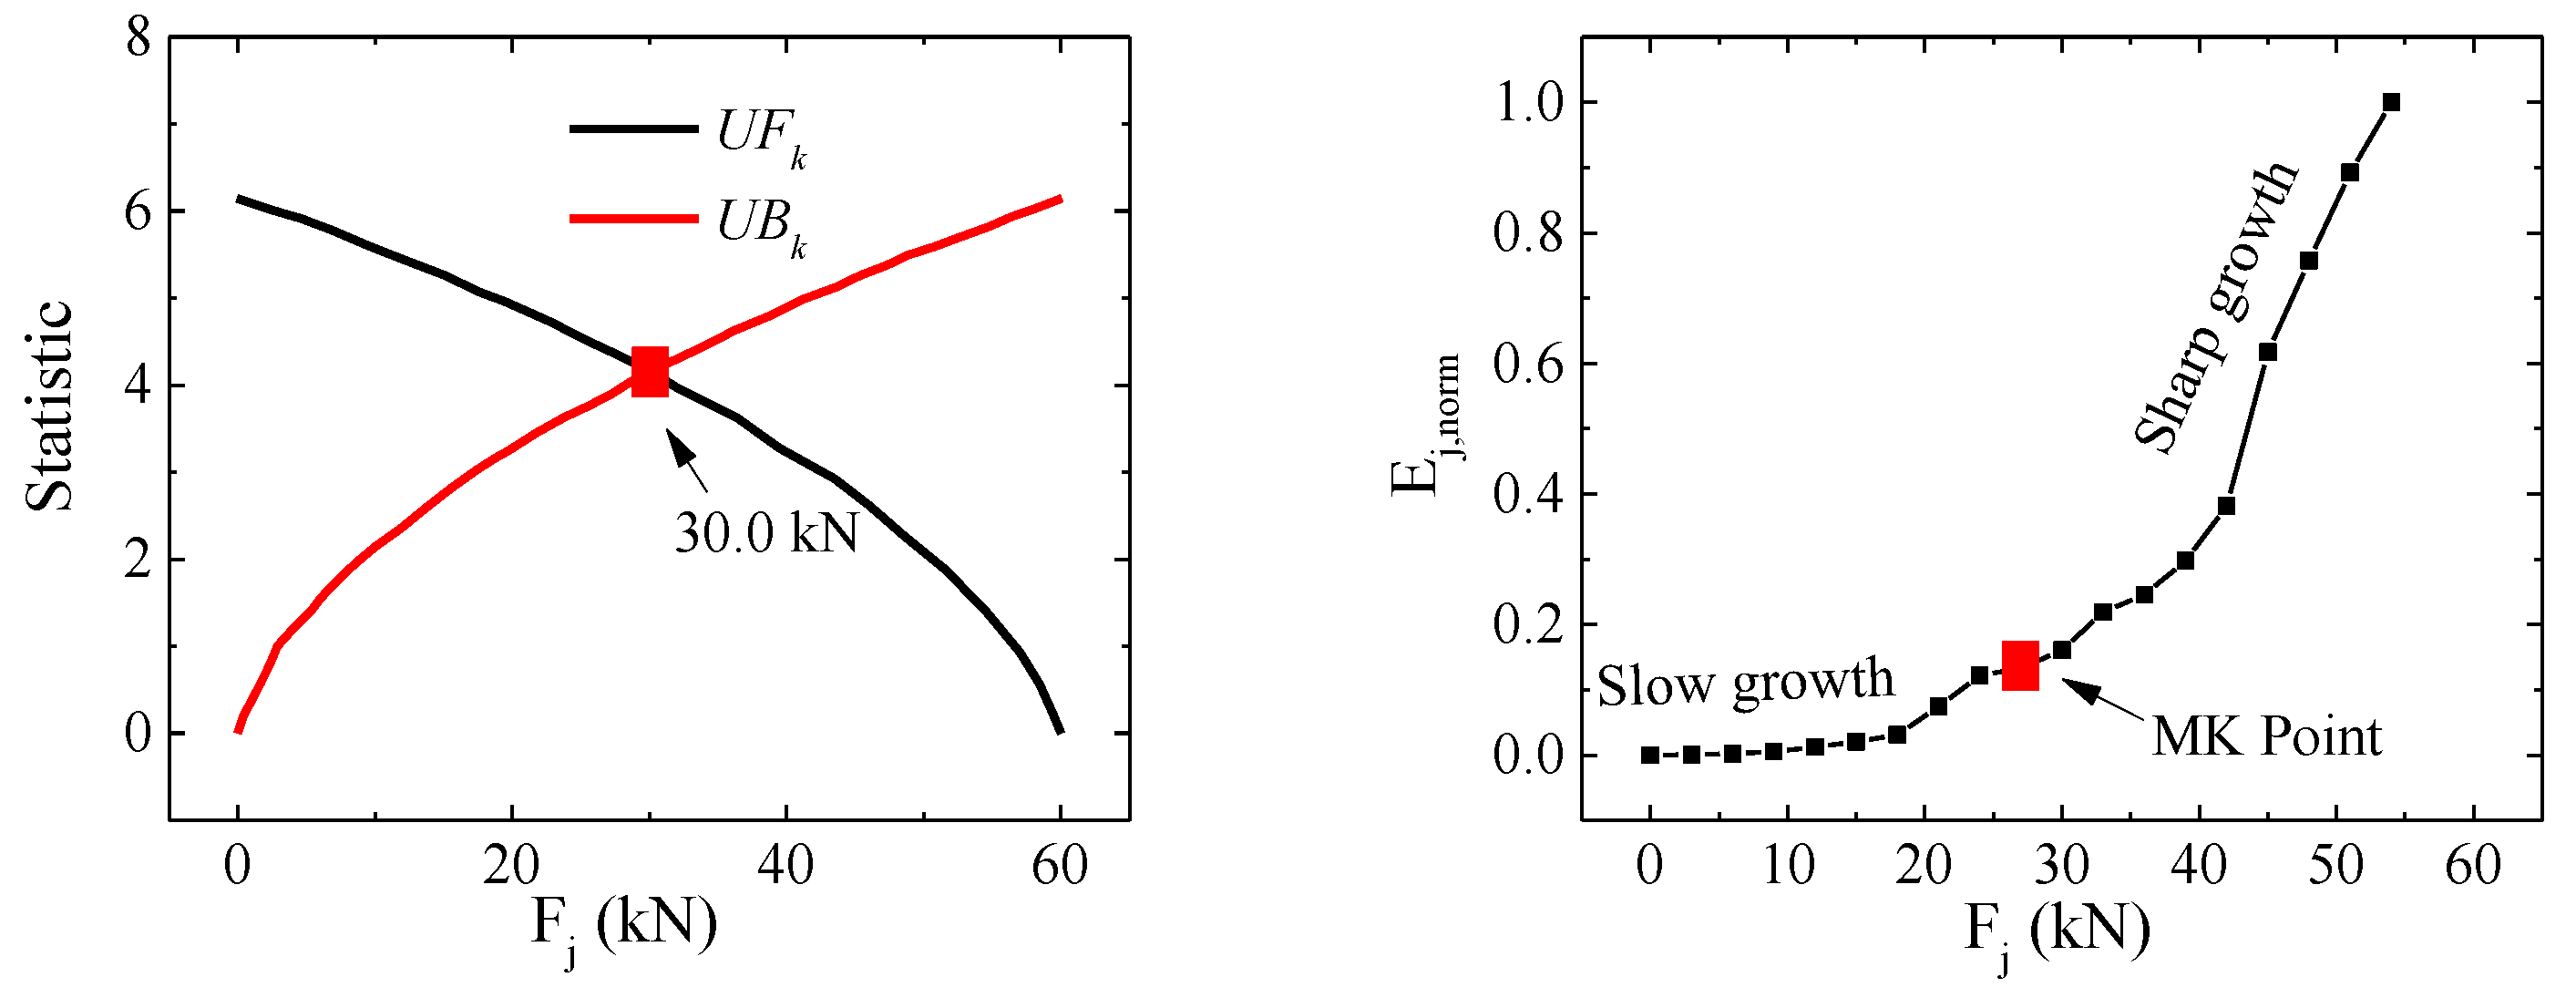
4.4. MK Criterion
4.5. Structural Stress State
5. Summary and Conclusions
Author Contributions
Funding
Conflicts of Interest
References
- Leslie, P.; Pearce, J.M.; Harrap, R.; Daniel, S. The application of smartphone technology to economic and environmental analysis of building energy conservation strategies. Int. J. Sustain. Energy 2012, 31, 295–311. [Google Scholar] [CrossRef]
- Chen, R. Research and Application of Rice-Hull Mortar Lightweight Composite Wall Panel; Harbin Institute of Technology: Harbin, China, 2010. [Google Scholar]
- Cai, X.S. In-Plane Mechanical Properties of New Energy-Saving Infill Walls; Harbin Institute of Technology: Harbin, China, 2014. [Google Scholar]
- Marques, R.; Lourenço P, B. Structural behaviour and design rules of confined masonry walls: Review and proposals. Constr. Build. Mater. 2019, 217, 137–155. [Google Scholar] [CrossRef]
- Lourenco, P.B.; Milani, G.; Tralli, A.; Zucchini, A. Analysis of masonry structures: Review of and recent trends in homogenization techniques. Can. J. Civ. Eng. 2007, 34, 1443–1457. [Google Scholar] [CrossRef]
- Ju, R.S.; Lee, H.J.; Chen, C.C.; Tao, C.C. Experimental Study on Separating Reinforced Concrete Infill Walls from Steel Moment Frames. Constr. Steel Res. 2012, 71, 119–128. [Google Scholar] [CrossRef]
- Gu, X.; Wang, L.; Zhang, W.; Cui, W. Cyclic behaviour of hinged steel frames enhanced by masonry columns and/or infill walls with/without CFRP. Struct. Infrastruct. Eng. 2018, 14, 1–16. [Google Scholar] [CrossRef]
- Jurko, Z.; Vladimir, S.; Ivica, G. Cyclic Testing of a Single Bay Reinforced Concrete Frames with Various Types of Masonry Infill. Earthq. Eng. 2013, 41, 1131–1149. [Google Scholar]
- Peng, B.; Wei, S.; Long, L.; Zheng, Q.; Ma, Y.; Chen, L. Experimental Investigation on the Performance of Historical Squat Masonry Walls Strengthened by UHPC and Reinforced Polymer Mortar Layers. Appl. Sci. 2019, 9, 2096. [Google Scholar] [CrossRef]
- Dong, K.; Sui, Z.-A.; Jiang, J.; Zhou, X. Experimental Study on Seismic Behavior of Masonry Walls Strengthened by Reinforced Mortar Cross Strips. Sustainability 2019, 11, 4866. [Google Scholar] [CrossRef]
- Chi, B.; Yang, X.; Wang, F.; Zhang, Z.; Quan, Y. Experimental Investigation into the Seismic Performance of Fully Grouted Concrete Masonry Walls Using New Prestressing Technology. Appl. Sci. 2019, 9, 4354. [Google Scholar] [CrossRef]
- Hashemi, A.; Mosalam, K.M. Shake-table Experiment on Reinforced Concrete Structure Containing Masonry Infill Wall. Earthquake Eng. Struct. Dyn. 2006, 35, 1827–1852. [Google Scholar] [CrossRef]
- Torelli, G.; D’Ayala, D.; Betti, M.; Bartoli, G. Analytical and numerical seismic assessment of heritage masonry towers. Bull. Earthq. Eng. 2019. [Google Scholar] [CrossRef]
- Orlando, M.; Betti, M.; Spinelli, P. Assessment of structural behaviour and seismic retrofitting for an Italian monumental masonry building. J. Build. Eng. 2019, 29, 101115. [Google Scholar]
- Betti, M.; Vignoli, A. Modelling and analysis of a Romanesque church under earthquake loading: Assessment of seismic resistance. Steel Constr. 2008, 30, 352–367. [Google Scholar] [CrossRef]
- Betti, M.; Orlando, M.; Vignoli, A. Static behaviour of an Italian Medieval Castle: Damage assessment by numerical modelling. Comput. Struct. 2011, 89, 1956–1970. [Google Scholar] [CrossRef]
- Betti, M.; Galano, L.; Vignoli, A. Finite Element Modelling for Seismic Assessment of Historic Masonry Buildings. In Earthquakes and Their Impact on Society; Springer: Cham, Germany, 2016; pp. 377–415. [Google Scholar]
- Bartoli, G.; Betti, M.; Vignoli, A. A numerical study on seismic risk assessment of historic masonry towers: A case study in San Gimignano. Bull. Earthq. Eng. 2016, 14, 1475–1518. [Google Scholar] [CrossRef]
- Ferrero, C.; Lourenço, P.B.; Calderini, C. Nonlinear modeling of unreinforced masonry structures under seismic actions: Validation using a building hit by the 2016 Central Italy earthquake. Frattura ed Integrità Strutturale 2020, 14, 92–114. [Google Scholar] [CrossRef]
- Zhou, G.; Pan, D.; Xu, X.; Rafiq, Y.M. An innovative technique for predicting failure/cracking load of masonry wall panel under lateral load. J. Comput. Civ. Eng. 2010, 24, 377–387. [Google Scholar] [CrossRef]
- Zhang, Y.; Zhou, G.C.; Xiong, Y.; Rafiq, M.Y. Techniques for predicting cracking pattern of masonry wallet using artificial neural networks and cellular automata. J. Comput. Civ. Eng. 2010, 24, 161–172. [Google Scholar] [CrossRef]
- Huang, Y.; Zhou, G.; Cui, L.; Zhang, K.; Zhang, M.; Huang, Q.A. Method for Predicting Failure Load of Masonry Wall Panel Based on Generalized Strain Energy Density. J. Eng. Mech. 2014, 140, 04014061. [Google Scholar] [CrossRef]
- Shi, J.; Shen, J.; Zhou, G.; Qin, F.; Li, P. Stressing state analysis of large curvature continuous prestressed concrete box-girder bridge model. J. Civ. Eng. Manag. 2019, 25, 411–421. [Google Scholar] [CrossRef]
- Shi, J.; Li, W.; Zheng, K.; Yang, K.; Zhou, G. Experimental Investigation into stressing state characteristics of large-curvature continuous steel box-girder bridge model. Constr. Build. Mater. 2018, 178, 574–583. [Google Scholar] [CrossRef]
- Shi, J.; Yang, K.; Zheng, K.; Shen, J.; Zhou, G.; Huang, Y. An Investigation into working behavior characteristics of parabolic CFST arches applying structural stressing state theory. J. Civ. Eng. Manag. 2019, 25, 215–227. [Google Scholar] [CrossRef]
- Sun, S.; Ma, D.; Zhou, G. Applications and Analysis of the Composite wall on Construction in Heilongjiang Province. Procedia Eng. 2015, 118, 160–168. [Google Scholar] [CrossRef]
- Ministry of Construction of China. Standard of Test Method of Mechanical Properties on Ordinary Concrete (GB/T50081-2002); Ministry of Construction of China: Beijing, China, 2002.
- Abaqus, G. Abaqus 6.11; Dassault Systemes Simulia Corporation: Johnston, RI, USA, 2011. [Google Scholar]
- Zhang, M.; Zhou, G.; Huang, Y.; Zhi, X.; Zhang, D.Y. An ESED Method for Investigating Seismic Behavior of Single-Layer Spherical Reticulated Shell. Earthq. Struct. 2017, 13, 455–464. [Google Scholar]
- Zhang, M.; Parke, G.; Tian, S.; Huang, Y.; Zhou, G. Criterion for Judging Seismic Failure of Suspen-dome Based on Strain Energy Density. Earthq. Struct. 2018, 15, 123–132. [Google Scholar]


| Configuration & Size Dimensions in mm | Group 1 | Group 2 | ||
|---|---|---|---|---|
| No. | Lateral Loading Case | No. | Lateral Loading Case | |
| Intact Wallboard | 1-1 | cyclic | 2-1 | monotonic |
| 3300 × 2800 × 250 | ||||
| Window opening: 1500 × 1600 | 1-2 | cyclic | 2-2 | monotonic |
| 3300 × 2800 × 250 | ||||
| Door opening: 900 × 2100 | 1-3 | monotonic | 2-3 | monotonic |
| 2400 × 2800 × 250 | ||||
| Window opening:1500 × 1600 | 1-4 | monotonic | 2-4 | monotonic |
| Door opening: 900 × 2100 | ||||
| 3300 × 2800 × 250 | ||||
| Cube Number | Compressive Strength | Density | Water Content | Thermal Conductivity | Elastic Modulus |
|---|---|---|---|---|---|
| MPa | kg/m3 | % | W/(m × k) | MPa | |
| A | 21.20 | 1733 | 3.1 | 0.394 | 4976 |
| B | 14.13 | 1467 | 3.5 | 0.233 | |
| C | 20.60 | 1633 | 3.4 | 0.380 |
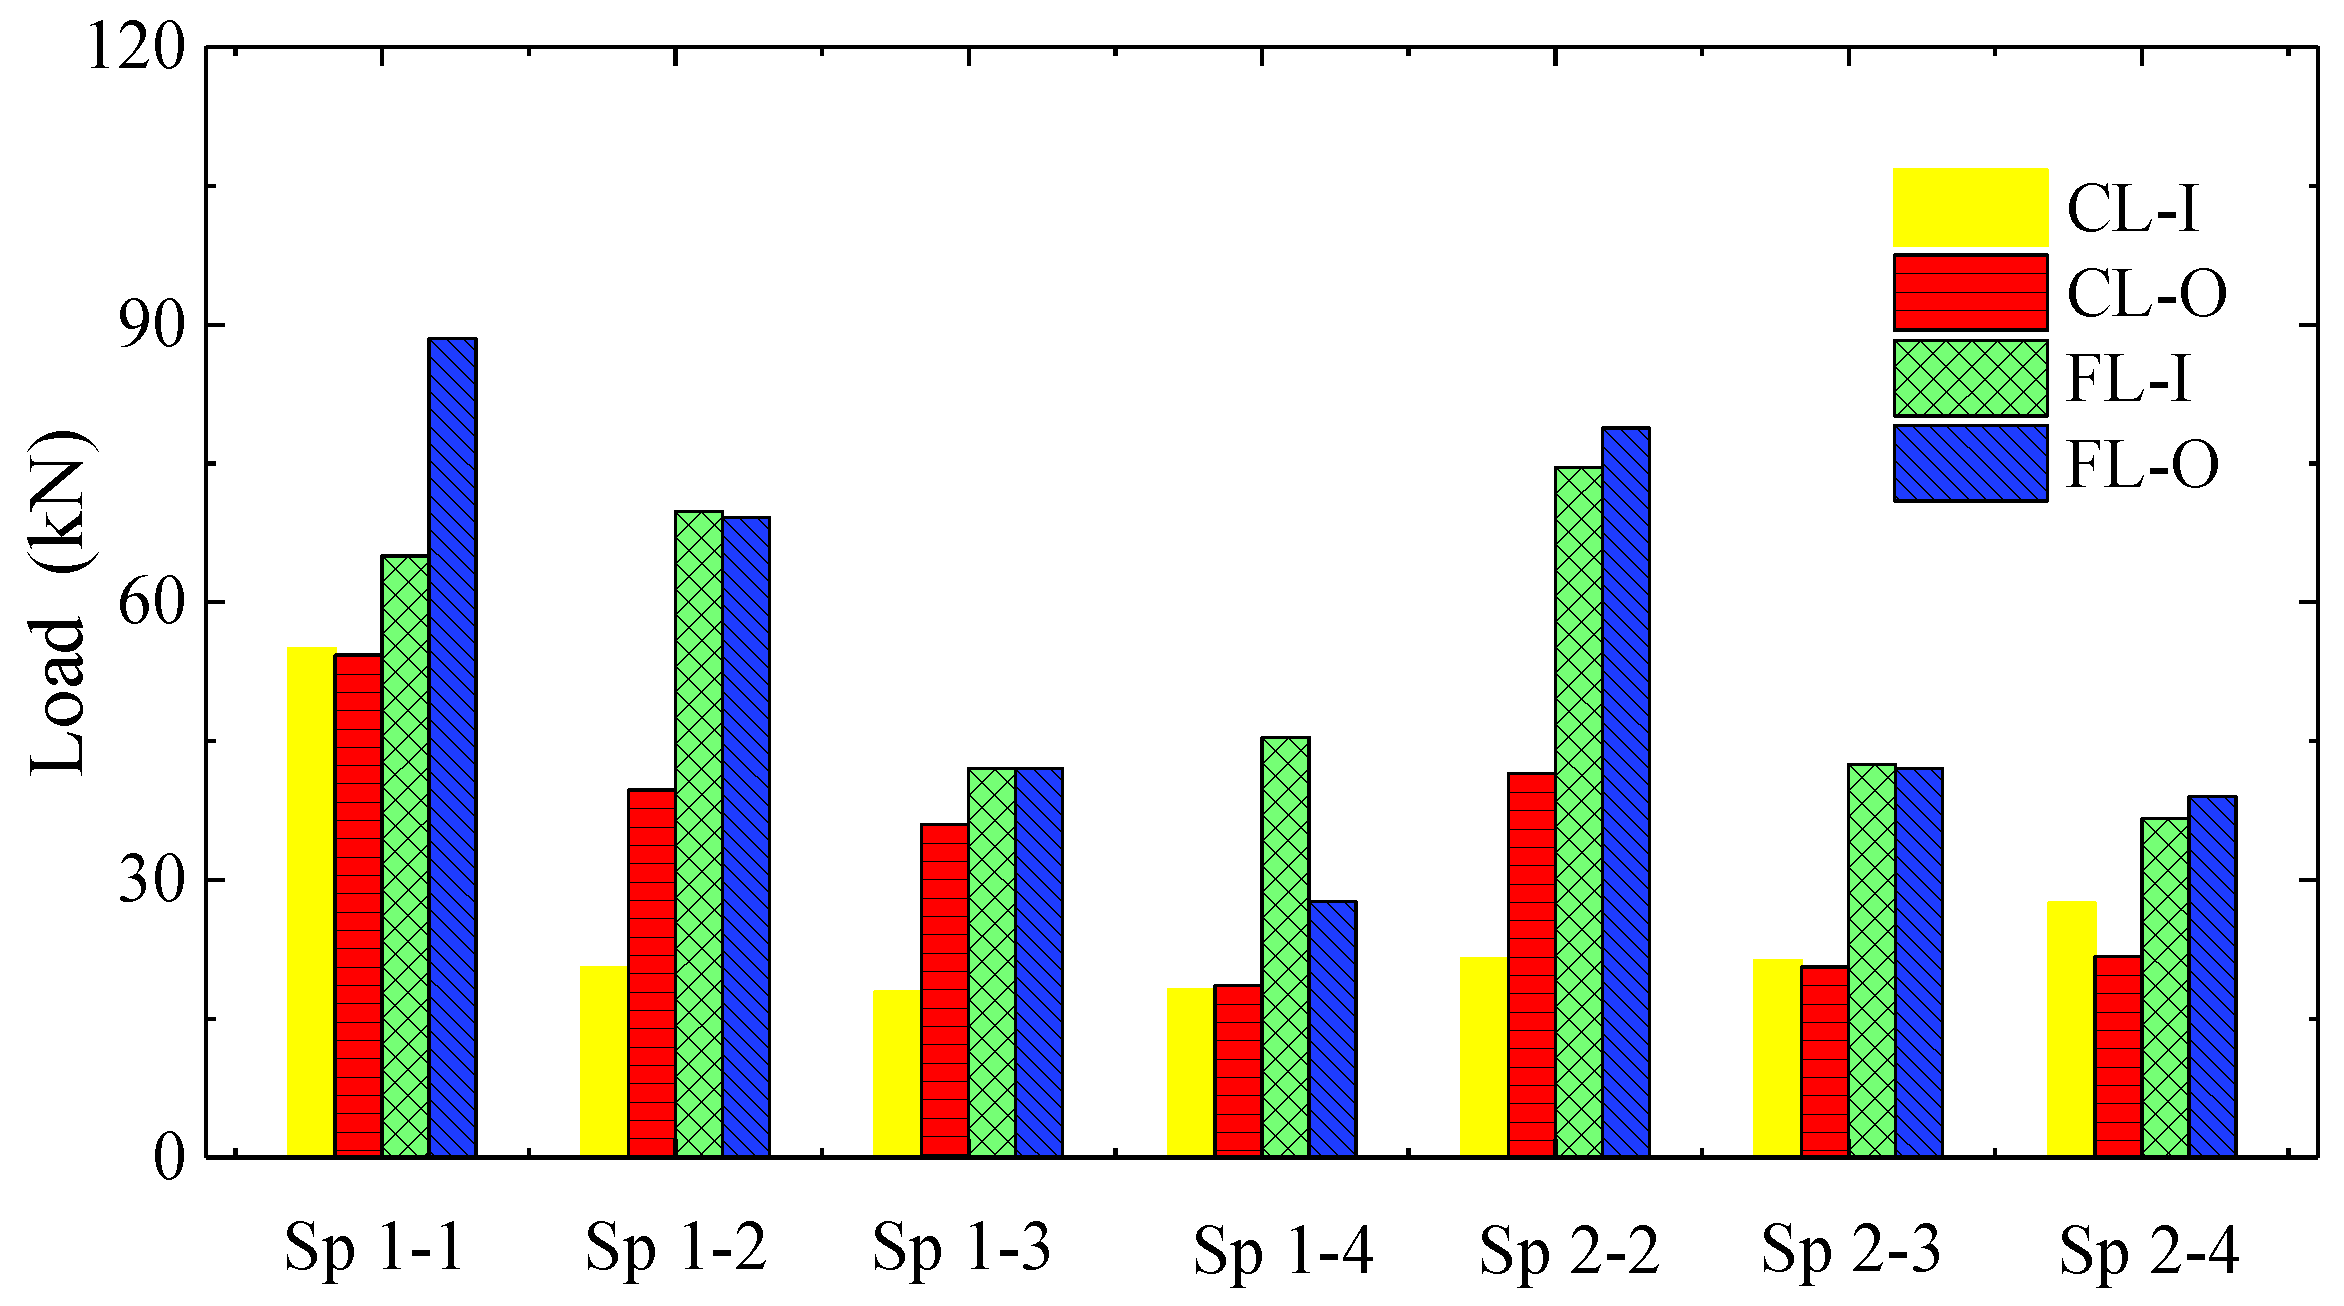
| Wallboard No. | Lateral Loading Condition | CL-O (kN) | FL-O (kN) | UL (kN) |
|---|---|---|---|---|
| 1-1 | cyclic | 54.29 | 88.48 | 93.20 |
| 1-2 | cyclic | 39.73 | 69.14 | 78.54 |
| 1-3 | monotonic | 36.00 | 42.00 | 62.31 |
| 1-4 | monotonic | 18.61 | 27.67 | 47.52 |
| 2-1 | monotonic | - | - | - |
| 2-2 | monotonic | 41.50 | 78.81 | 81.26 |
| 2-3 | monotonic | 20.60 | 42.00 | 47.55 |
| 2-4 | monotonic | 21.70 | 39.00 | 42.00 |
© 2020 by the authors. Licensee MDPI, Basel, Switzerland. This article is an open access article distributed under the terms and conditions of the Creative Commons Attribution (CC BY) license (http://creativecommons.org/licenses/by/4.0/).
Share and Cite
Cai, X.; Sun, S.; Zhou, G. An Experimental Strain-Based Study on the Working State of Husk Mortar Wallboards with Openings. Appl. Sci. 2020, 10, 710. https://doi.org/10.3390/app10020710
Cai X, Sun S, Zhou G. An Experimental Strain-Based Study on the Working State of Husk Mortar Wallboards with Openings. Applied Sciences. 2020; 10(2):710. https://doi.org/10.3390/app10020710
Chicago/Turabian StyleCai, Xuesong, Shijun Sun, and Guangchun Zhou. 2020. "An Experimental Strain-Based Study on the Working State of Husk Mortar Wallboards with Openings" Applied Sciences 10, no. 2: 710. https://doi.org/10.3390/app10020710
APA StyleCai, X., Sun, S., & Zhou, G. (2020). An Experimental Strain-Based Study on the Working State of Husk Mortar Wallboards with Openings. Applied Sciences, 10(2), 710. https://doi.org/10.3390/app10020710