Evaluation of Condition of Concrete Structures Using Ultrasonic Pulse Velocity Method

 ,
,
Abstract
1. Introduction
2. Literature Review
3. Ultrasonic Pulse Velocity Method
- : Velocity (m/s)
- : Constrained modulus (MPa)
- : Young’s modulus (MPa)
- : Density (kg/m3)
- : Poisson’s ratio
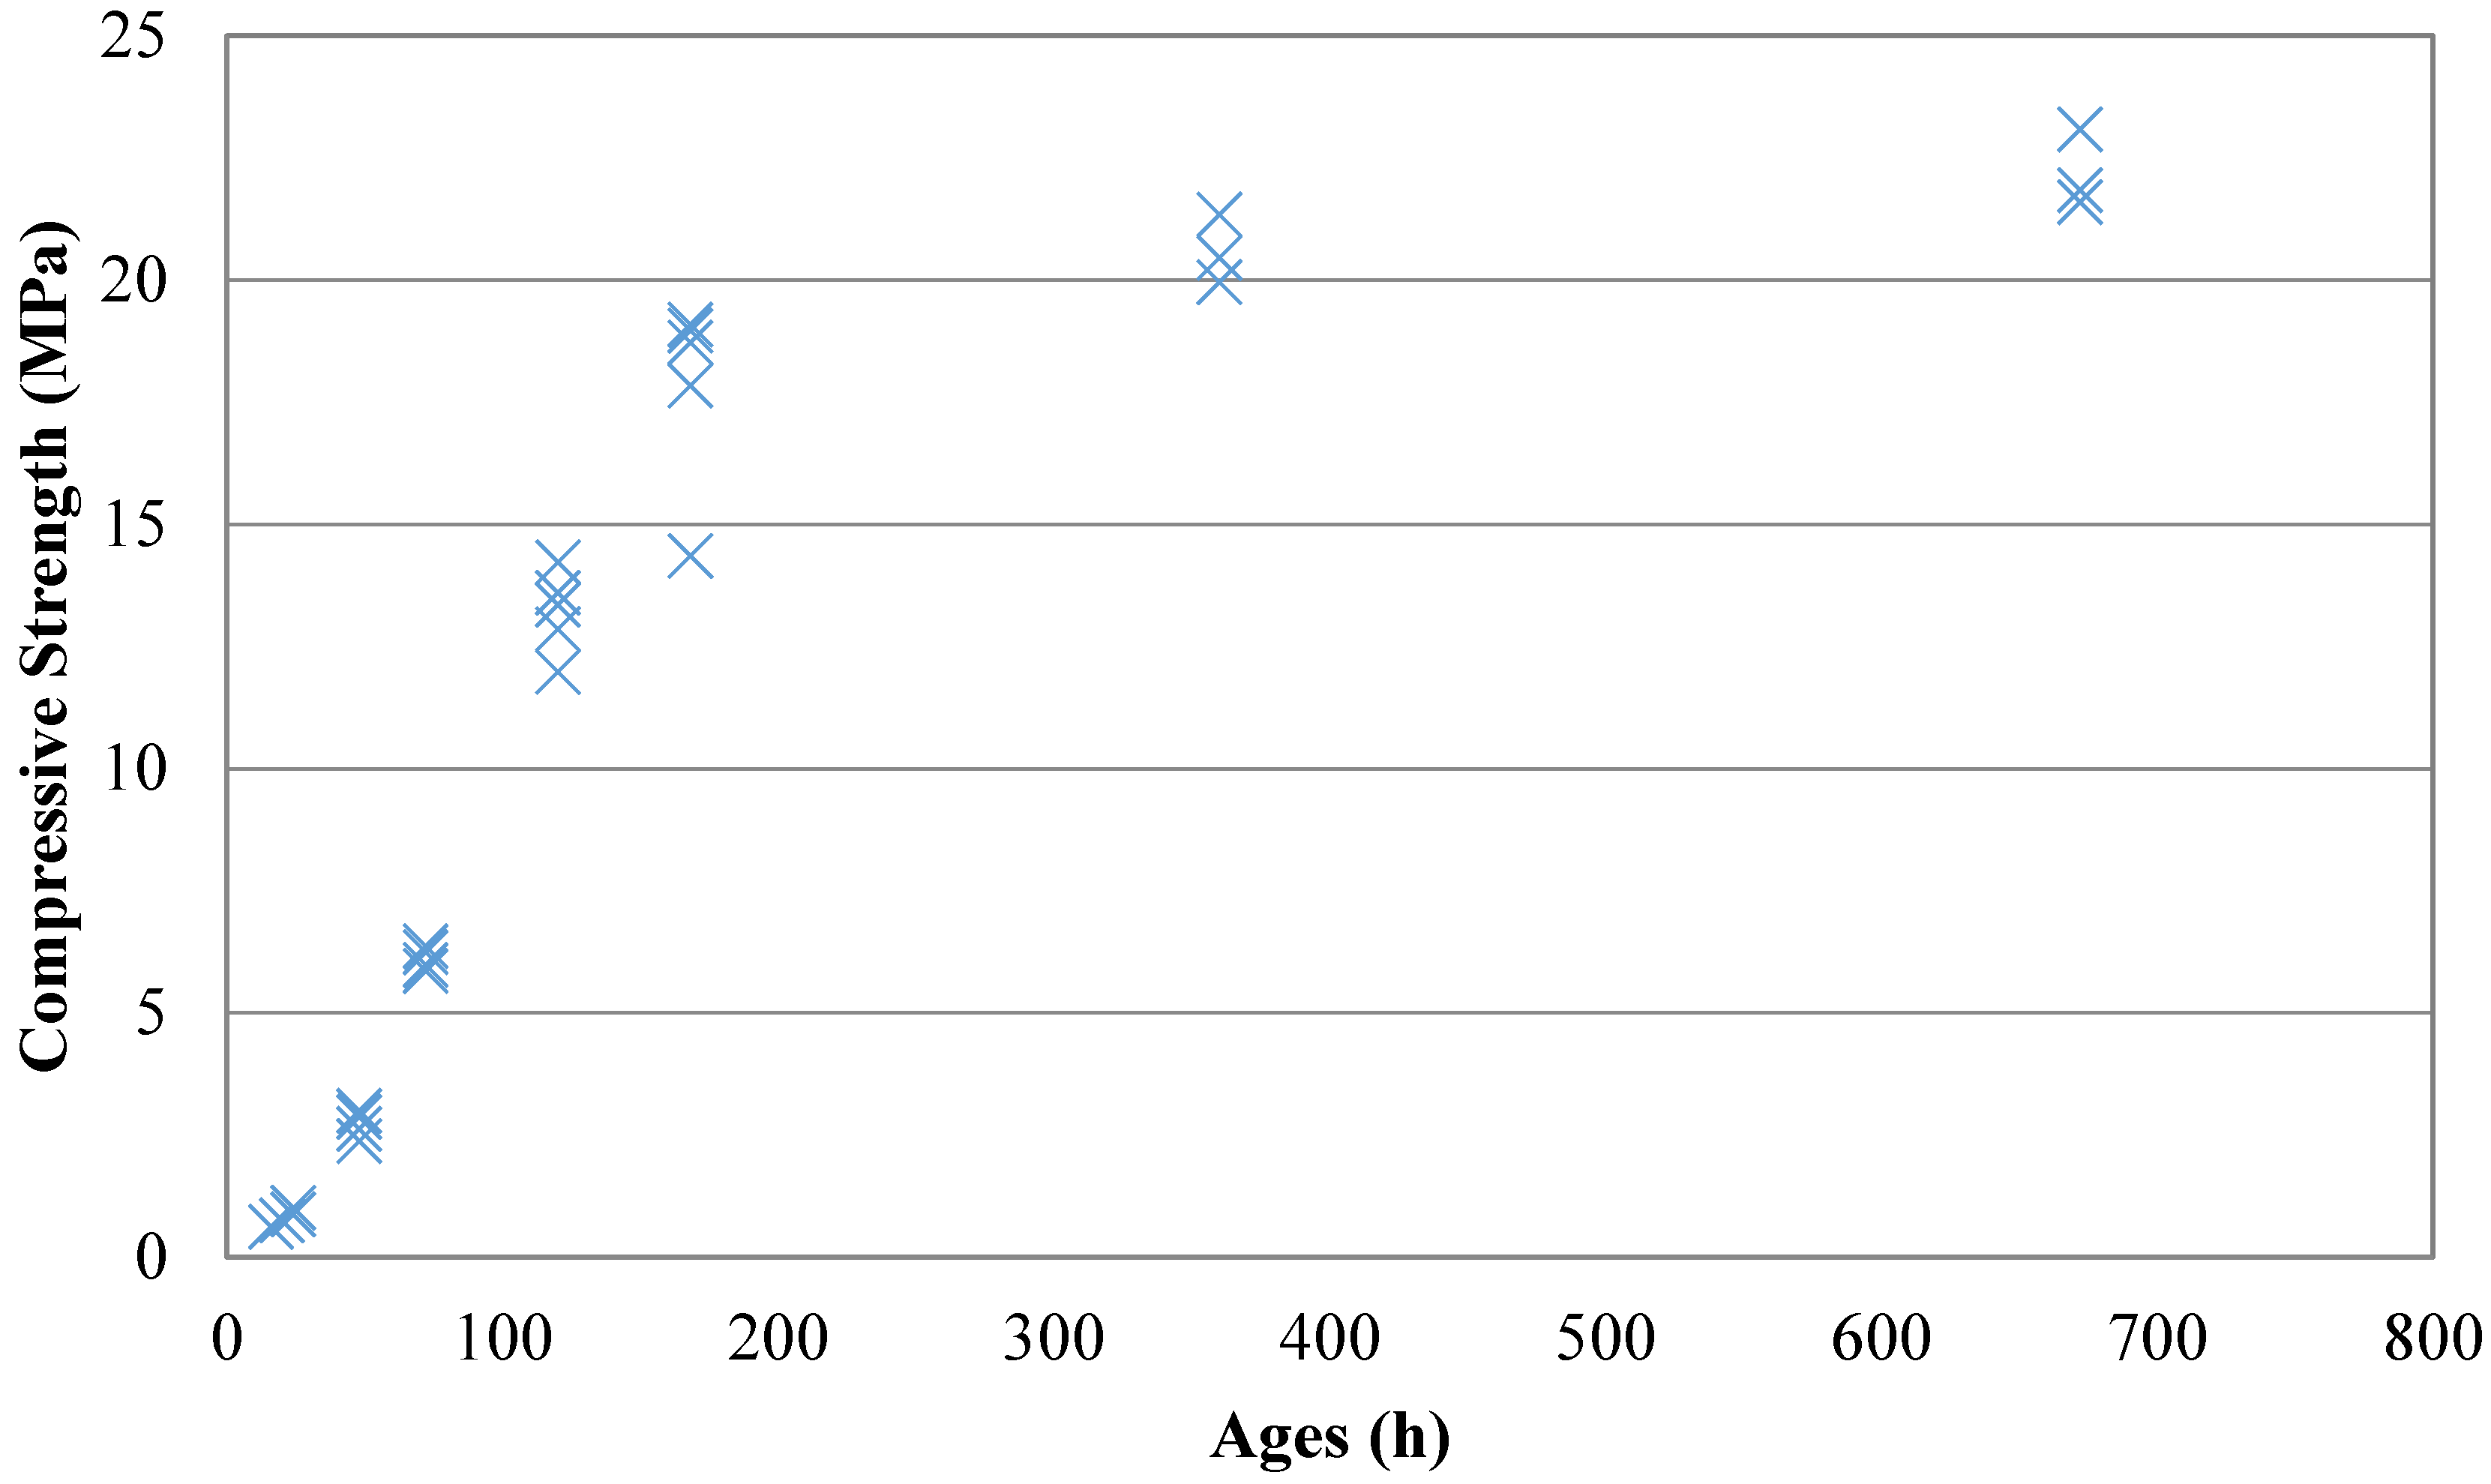
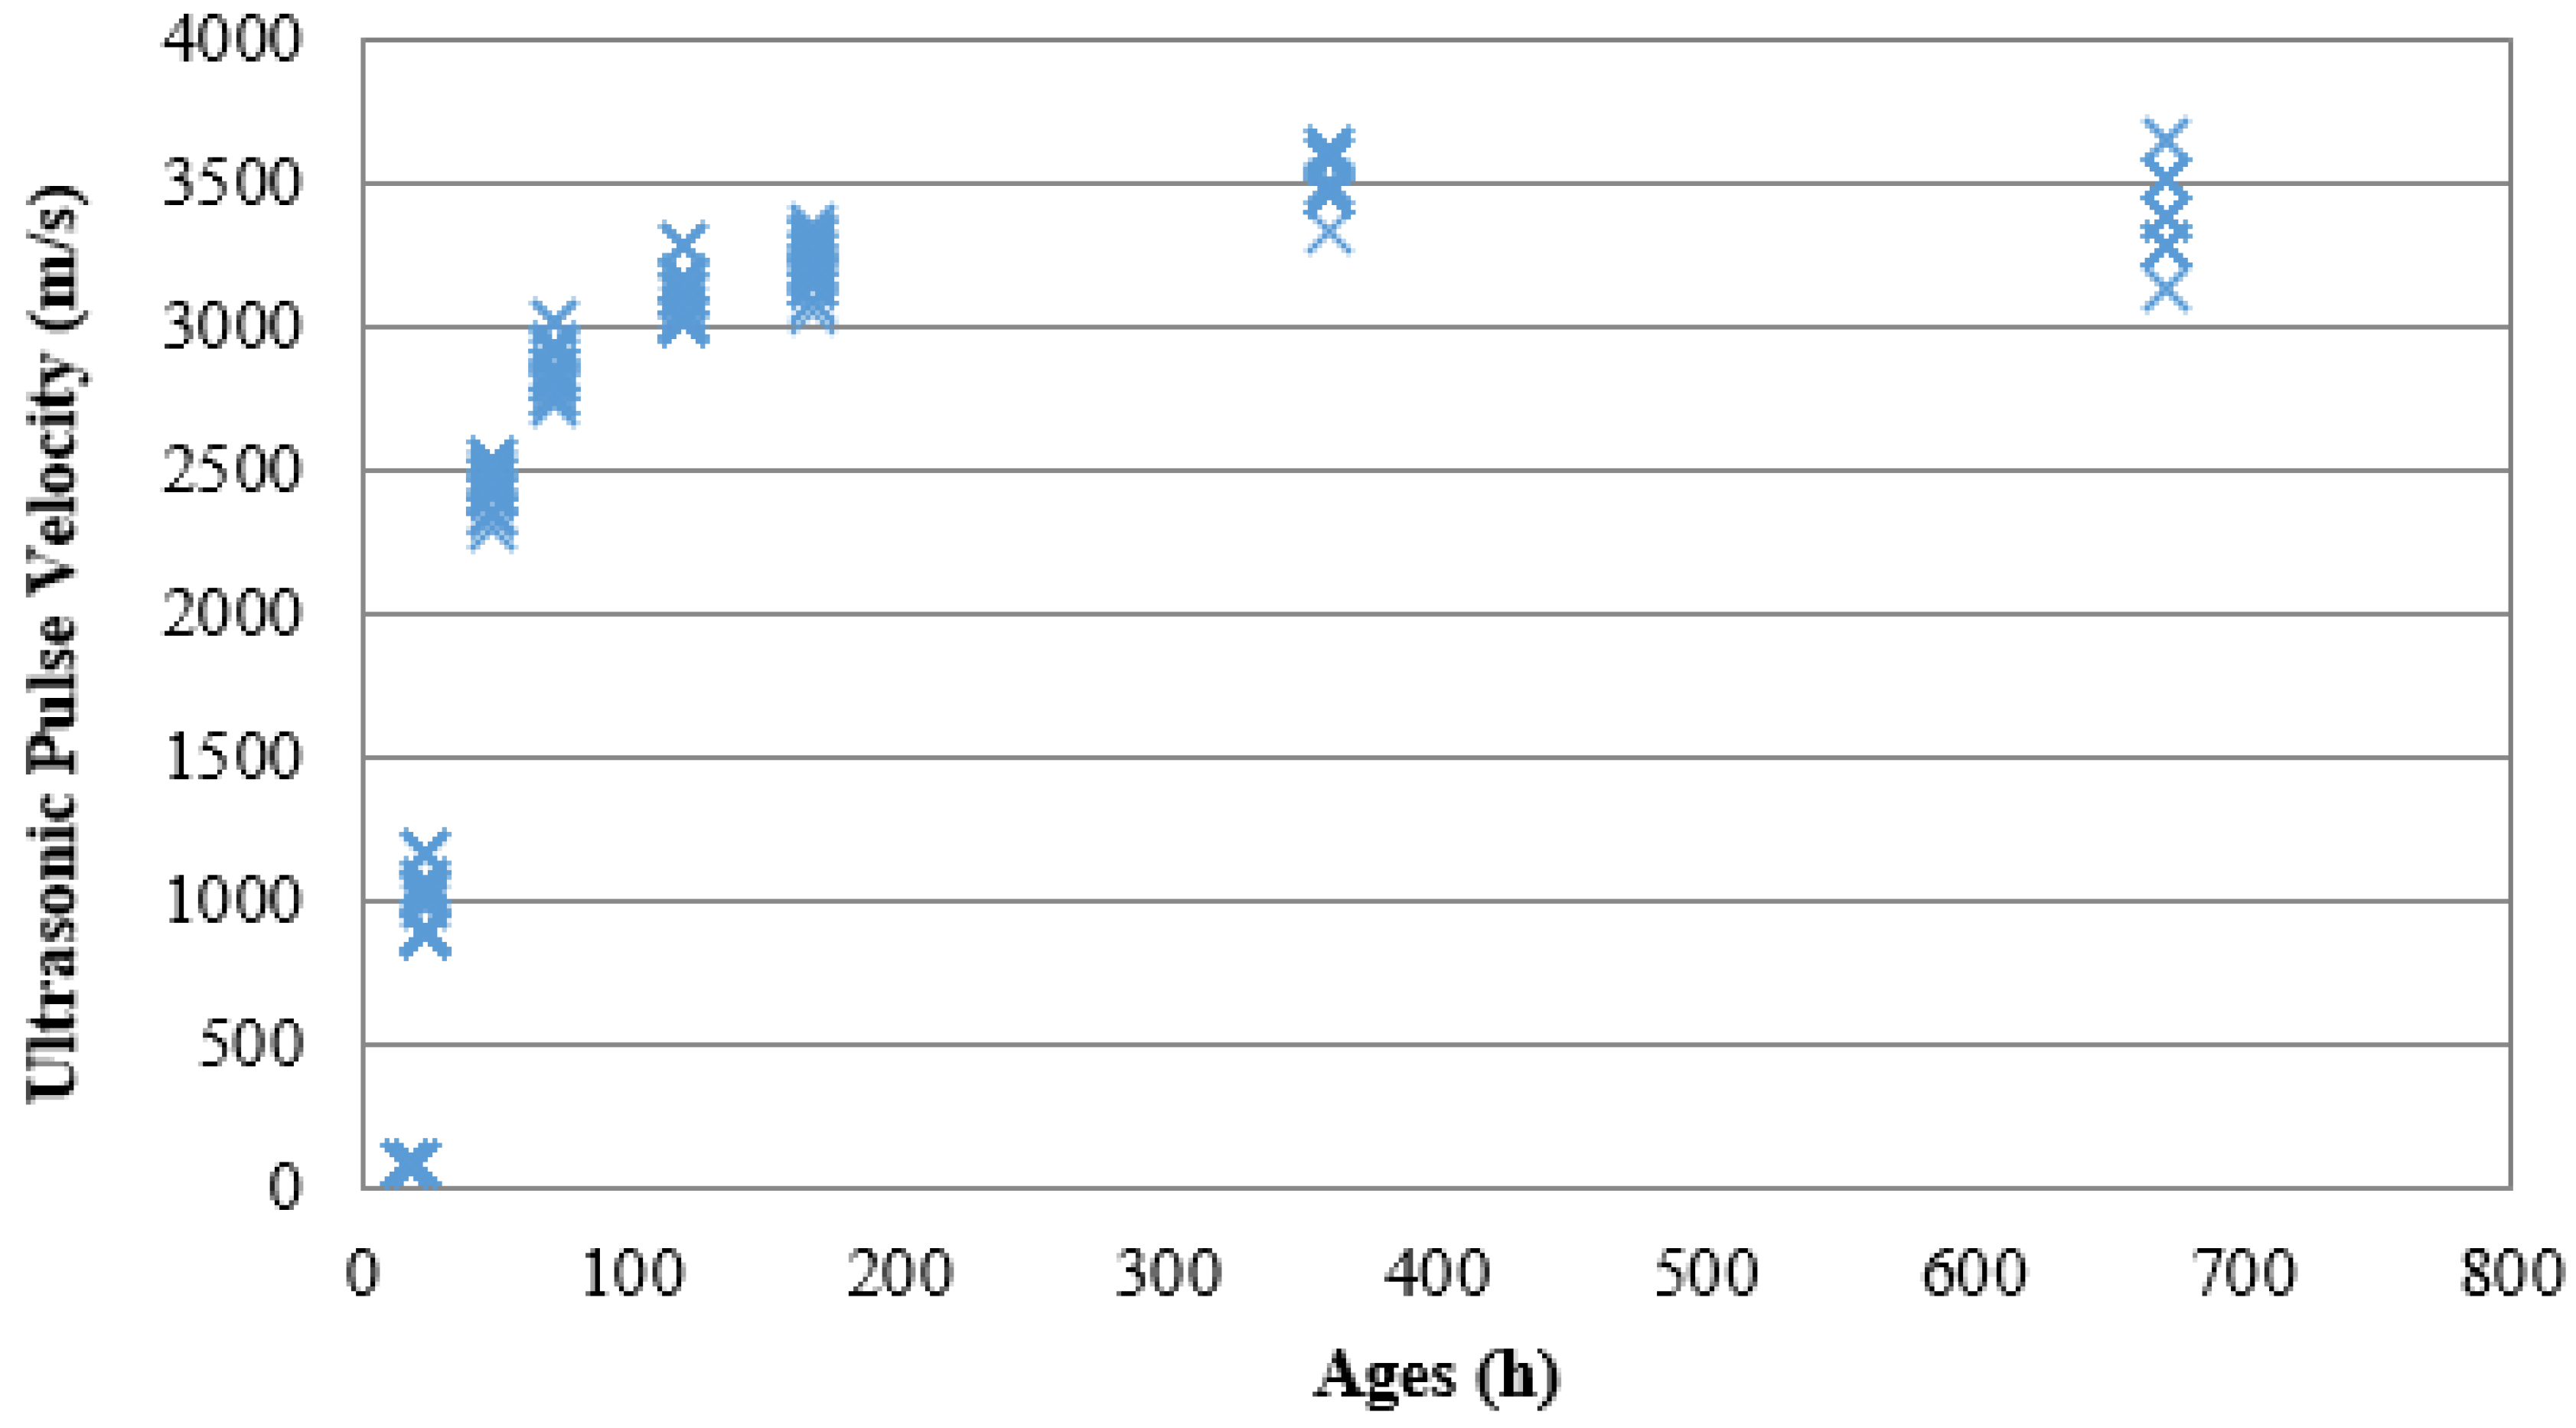
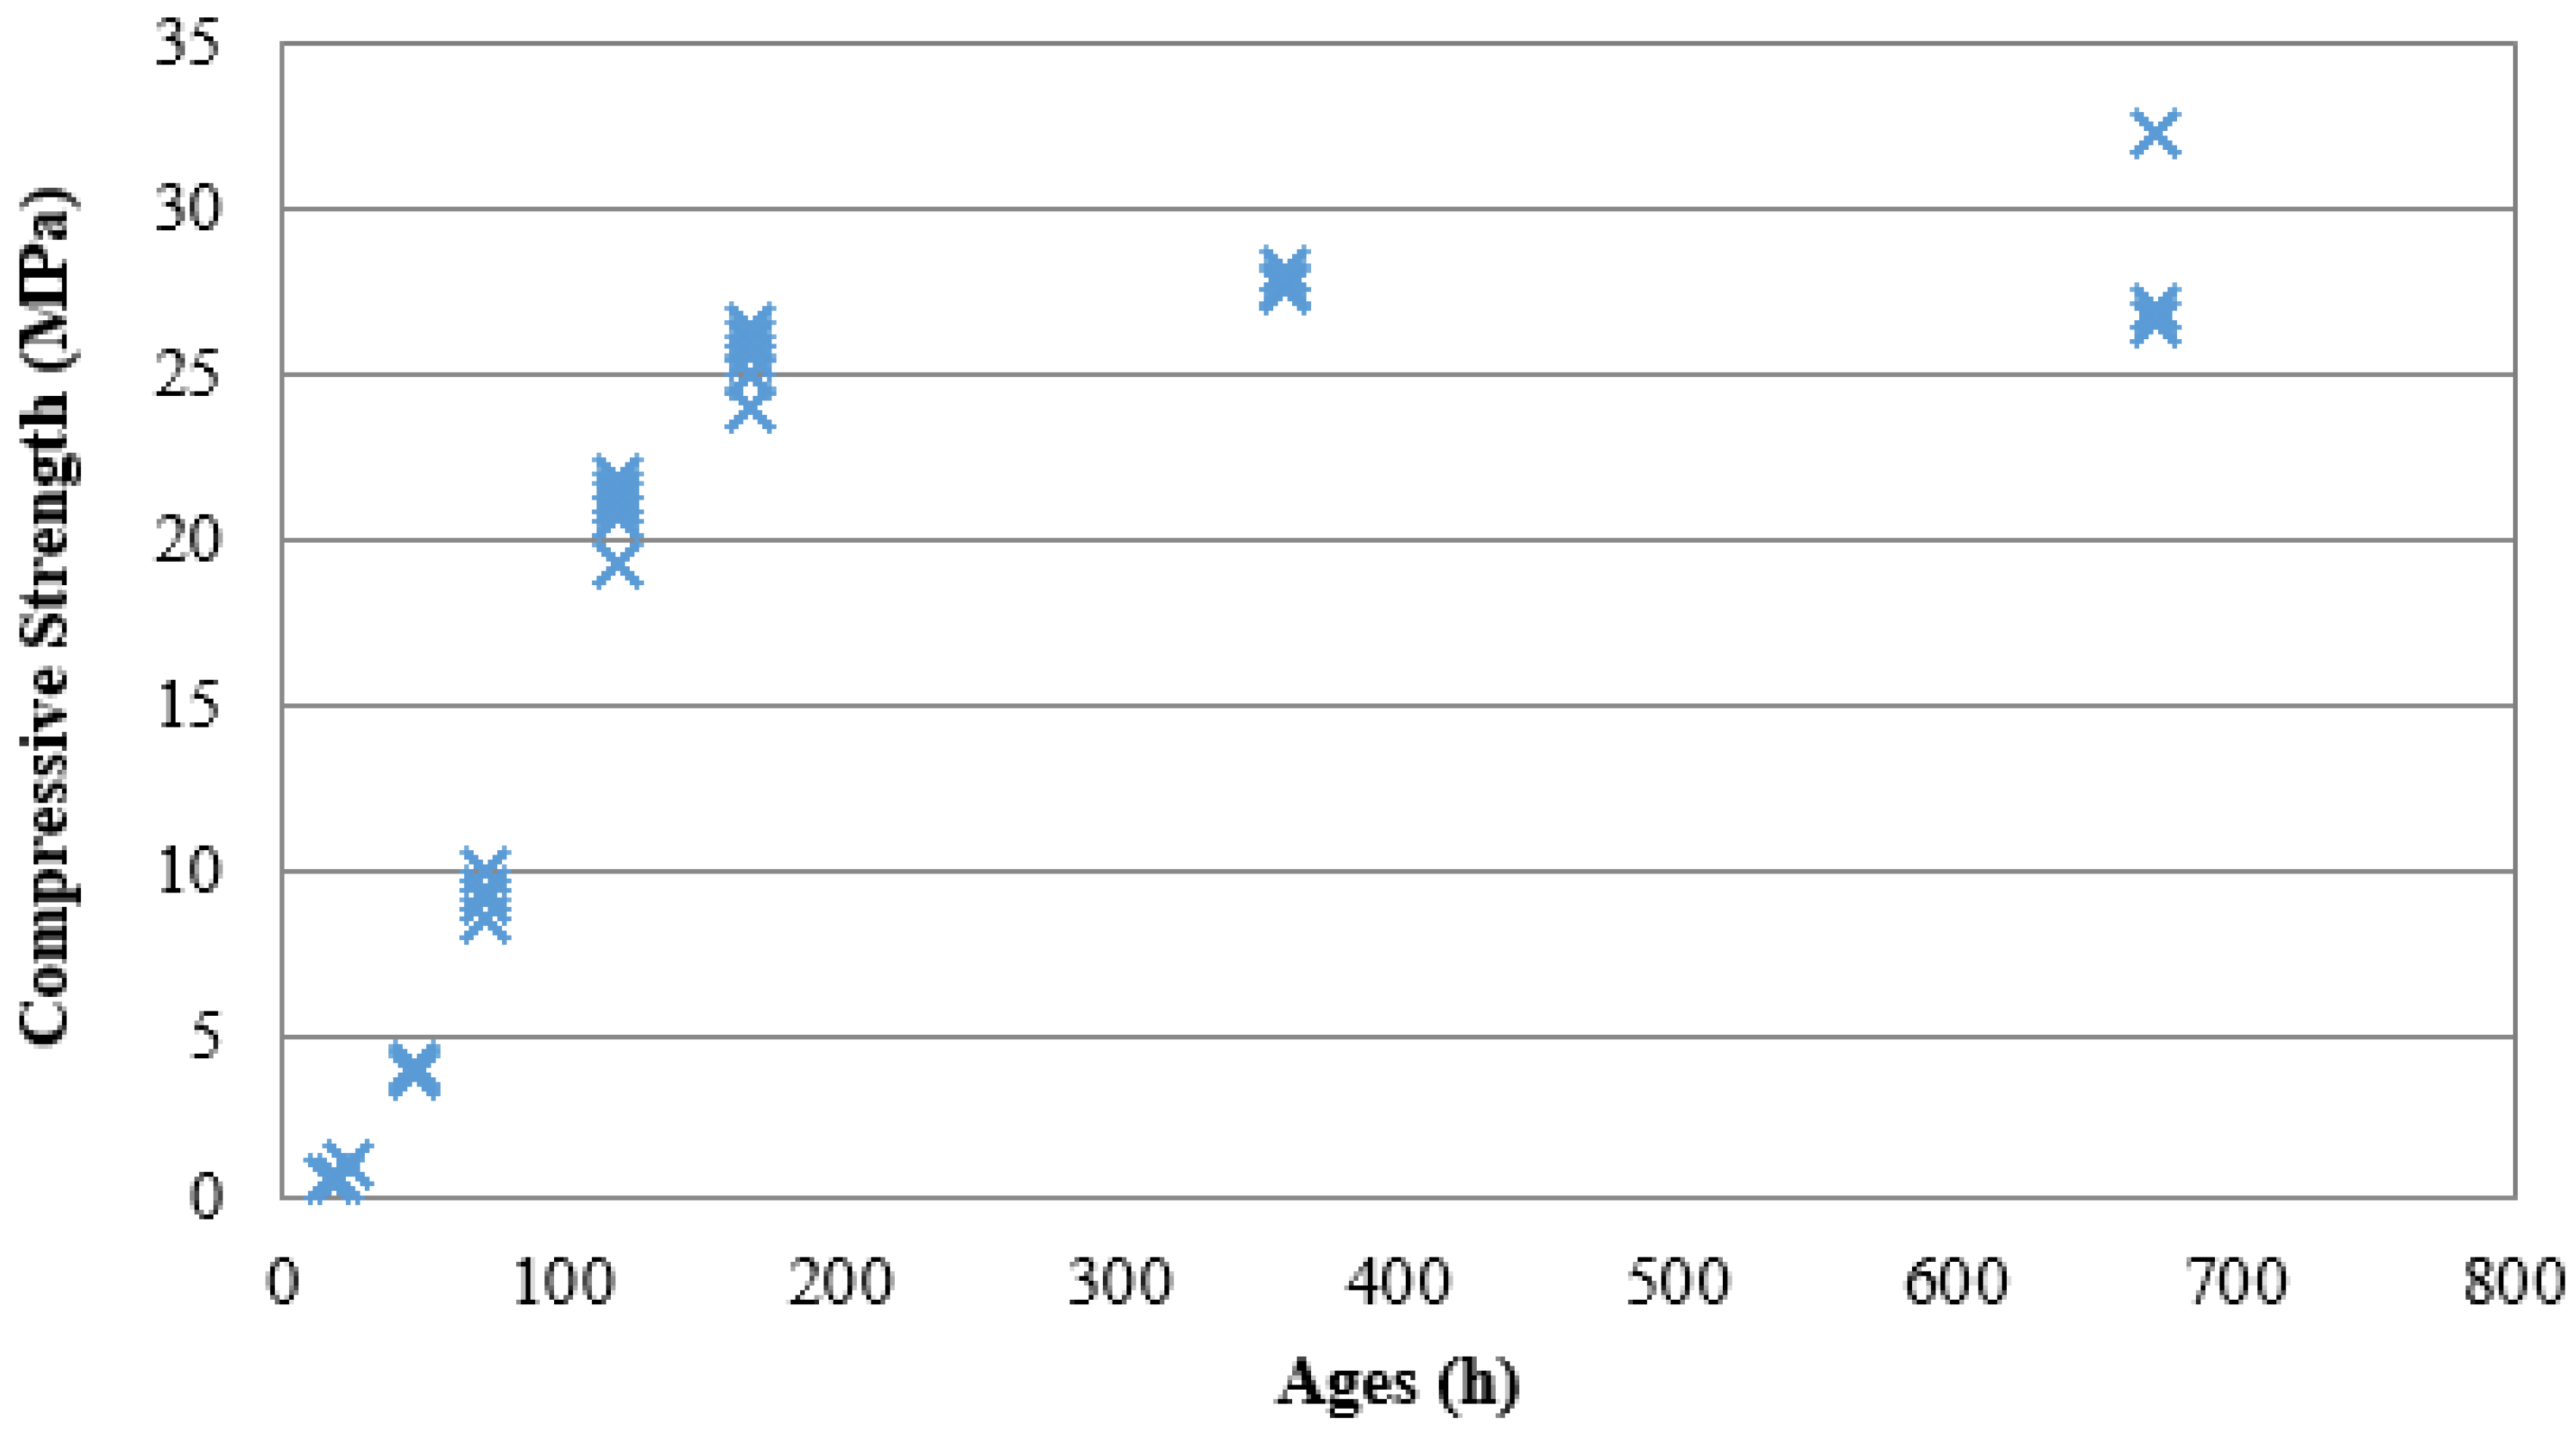
4. Experiment
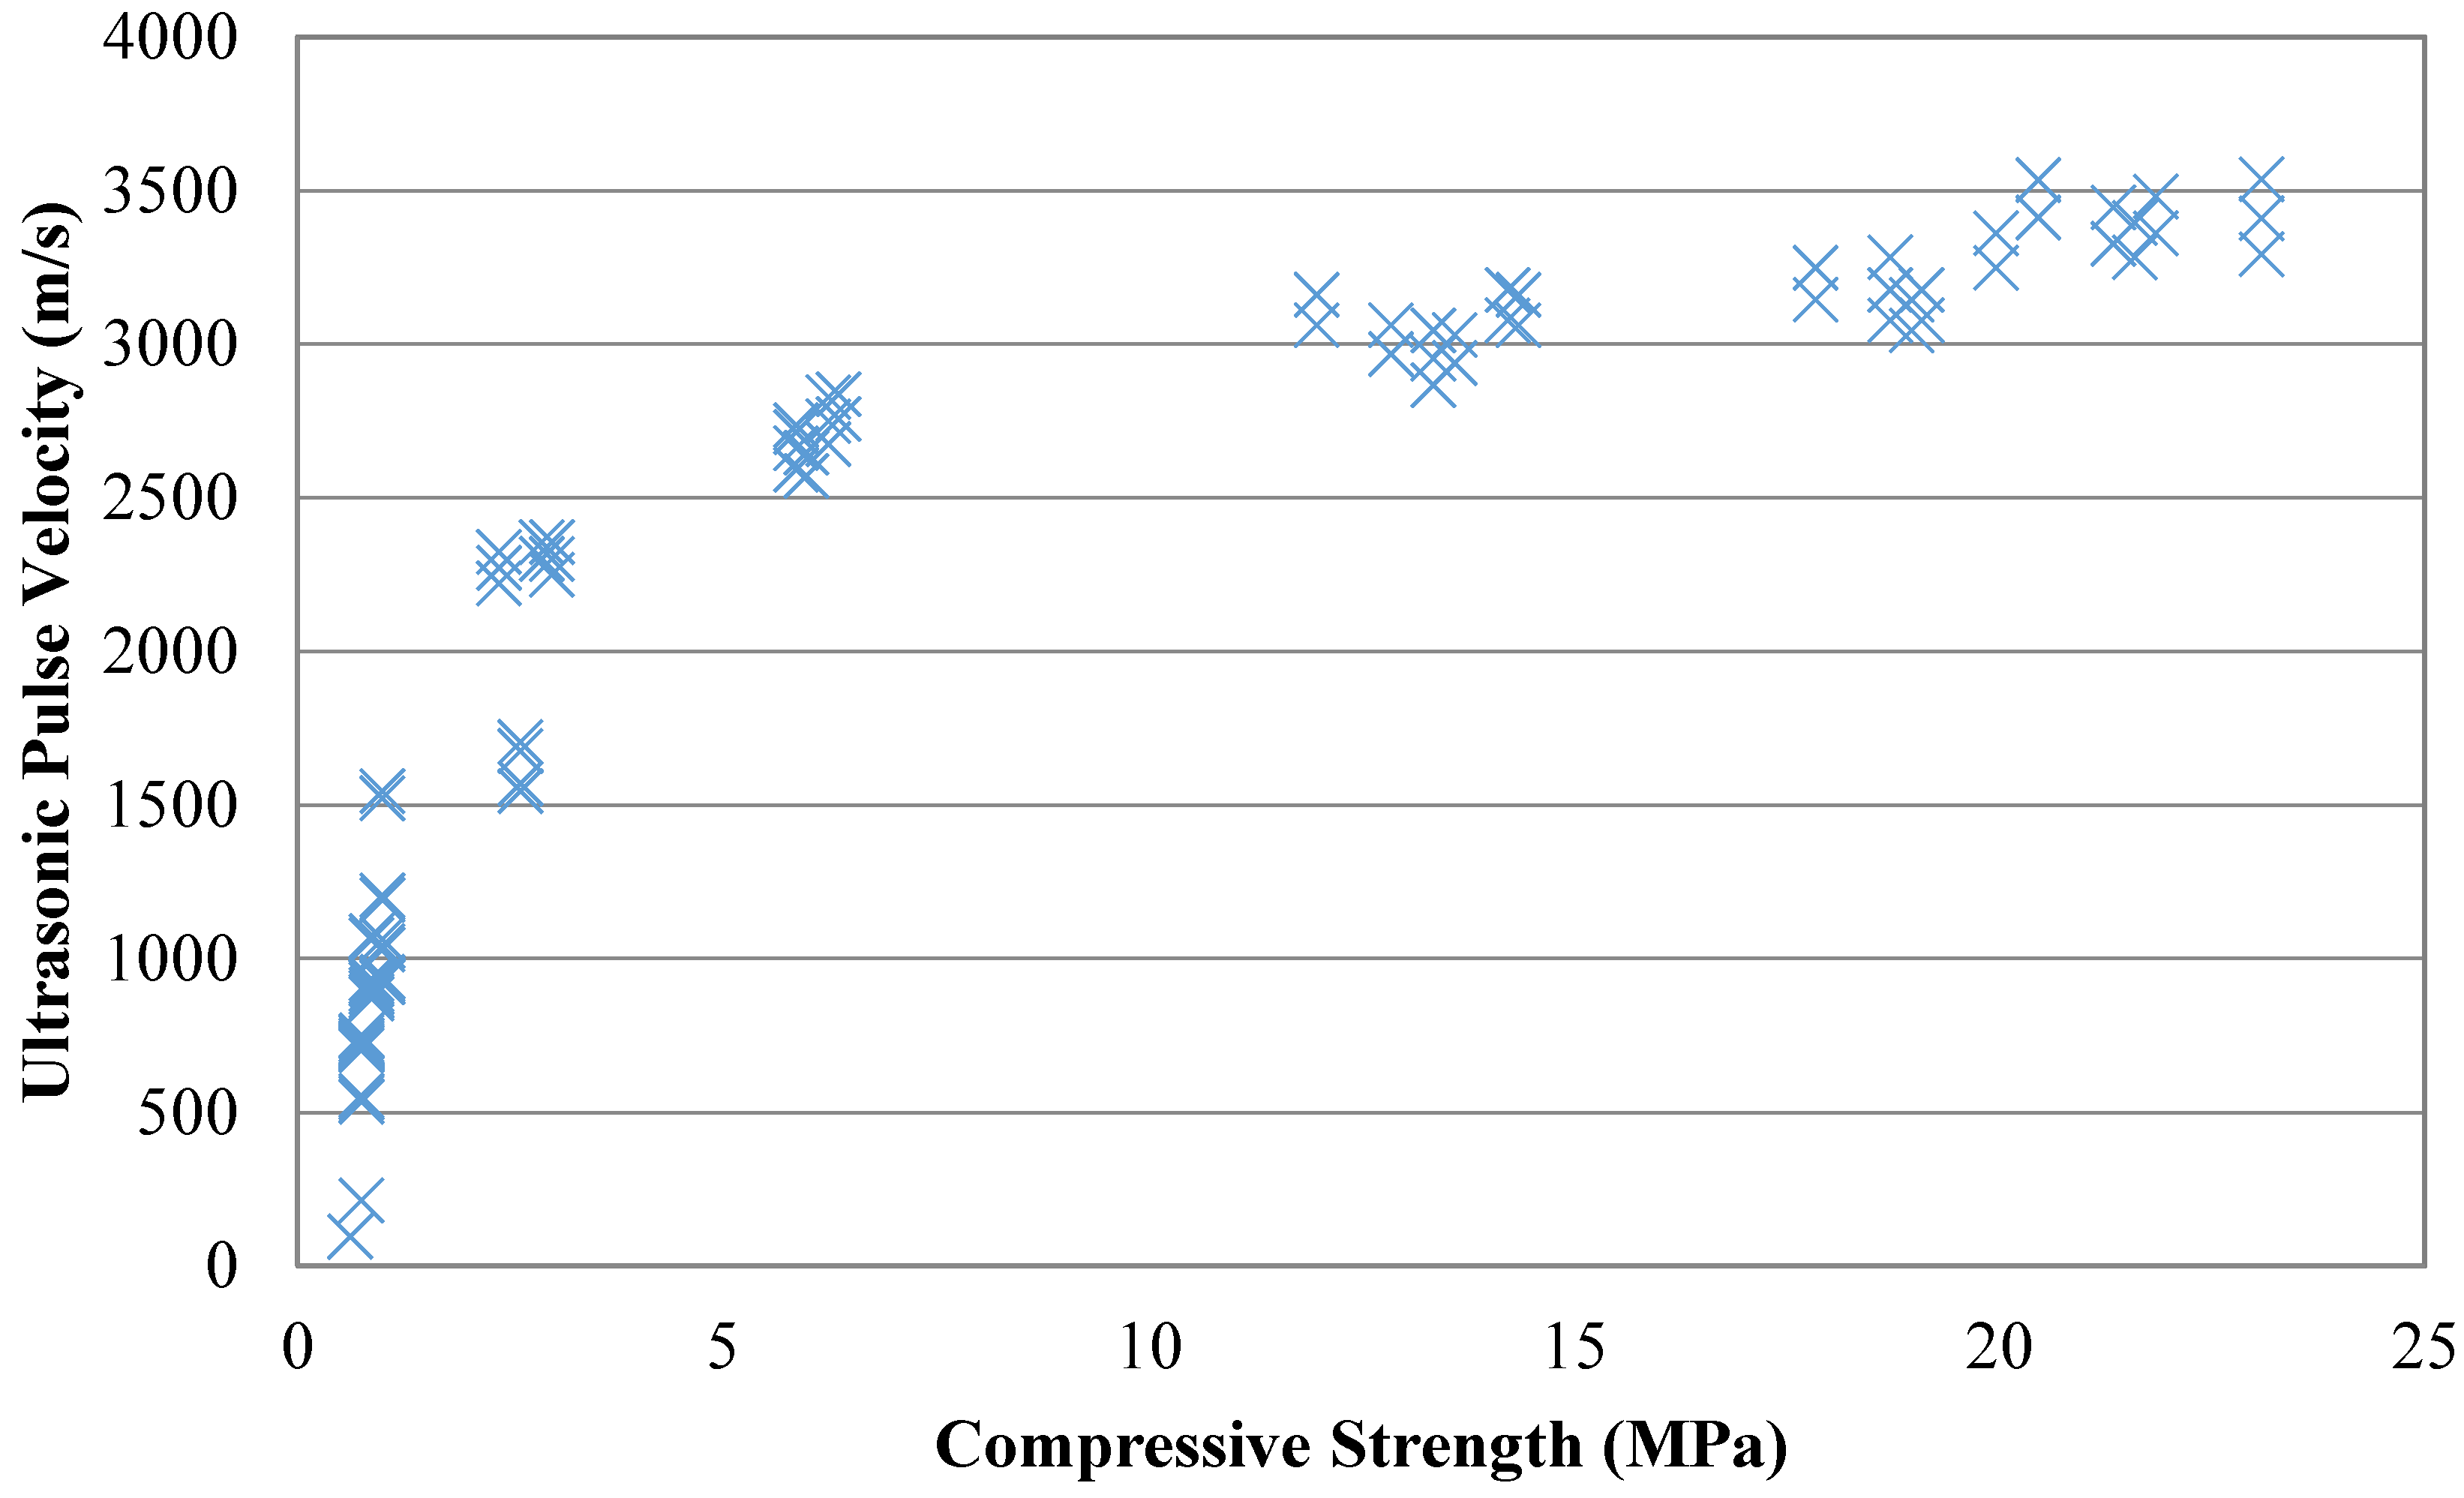
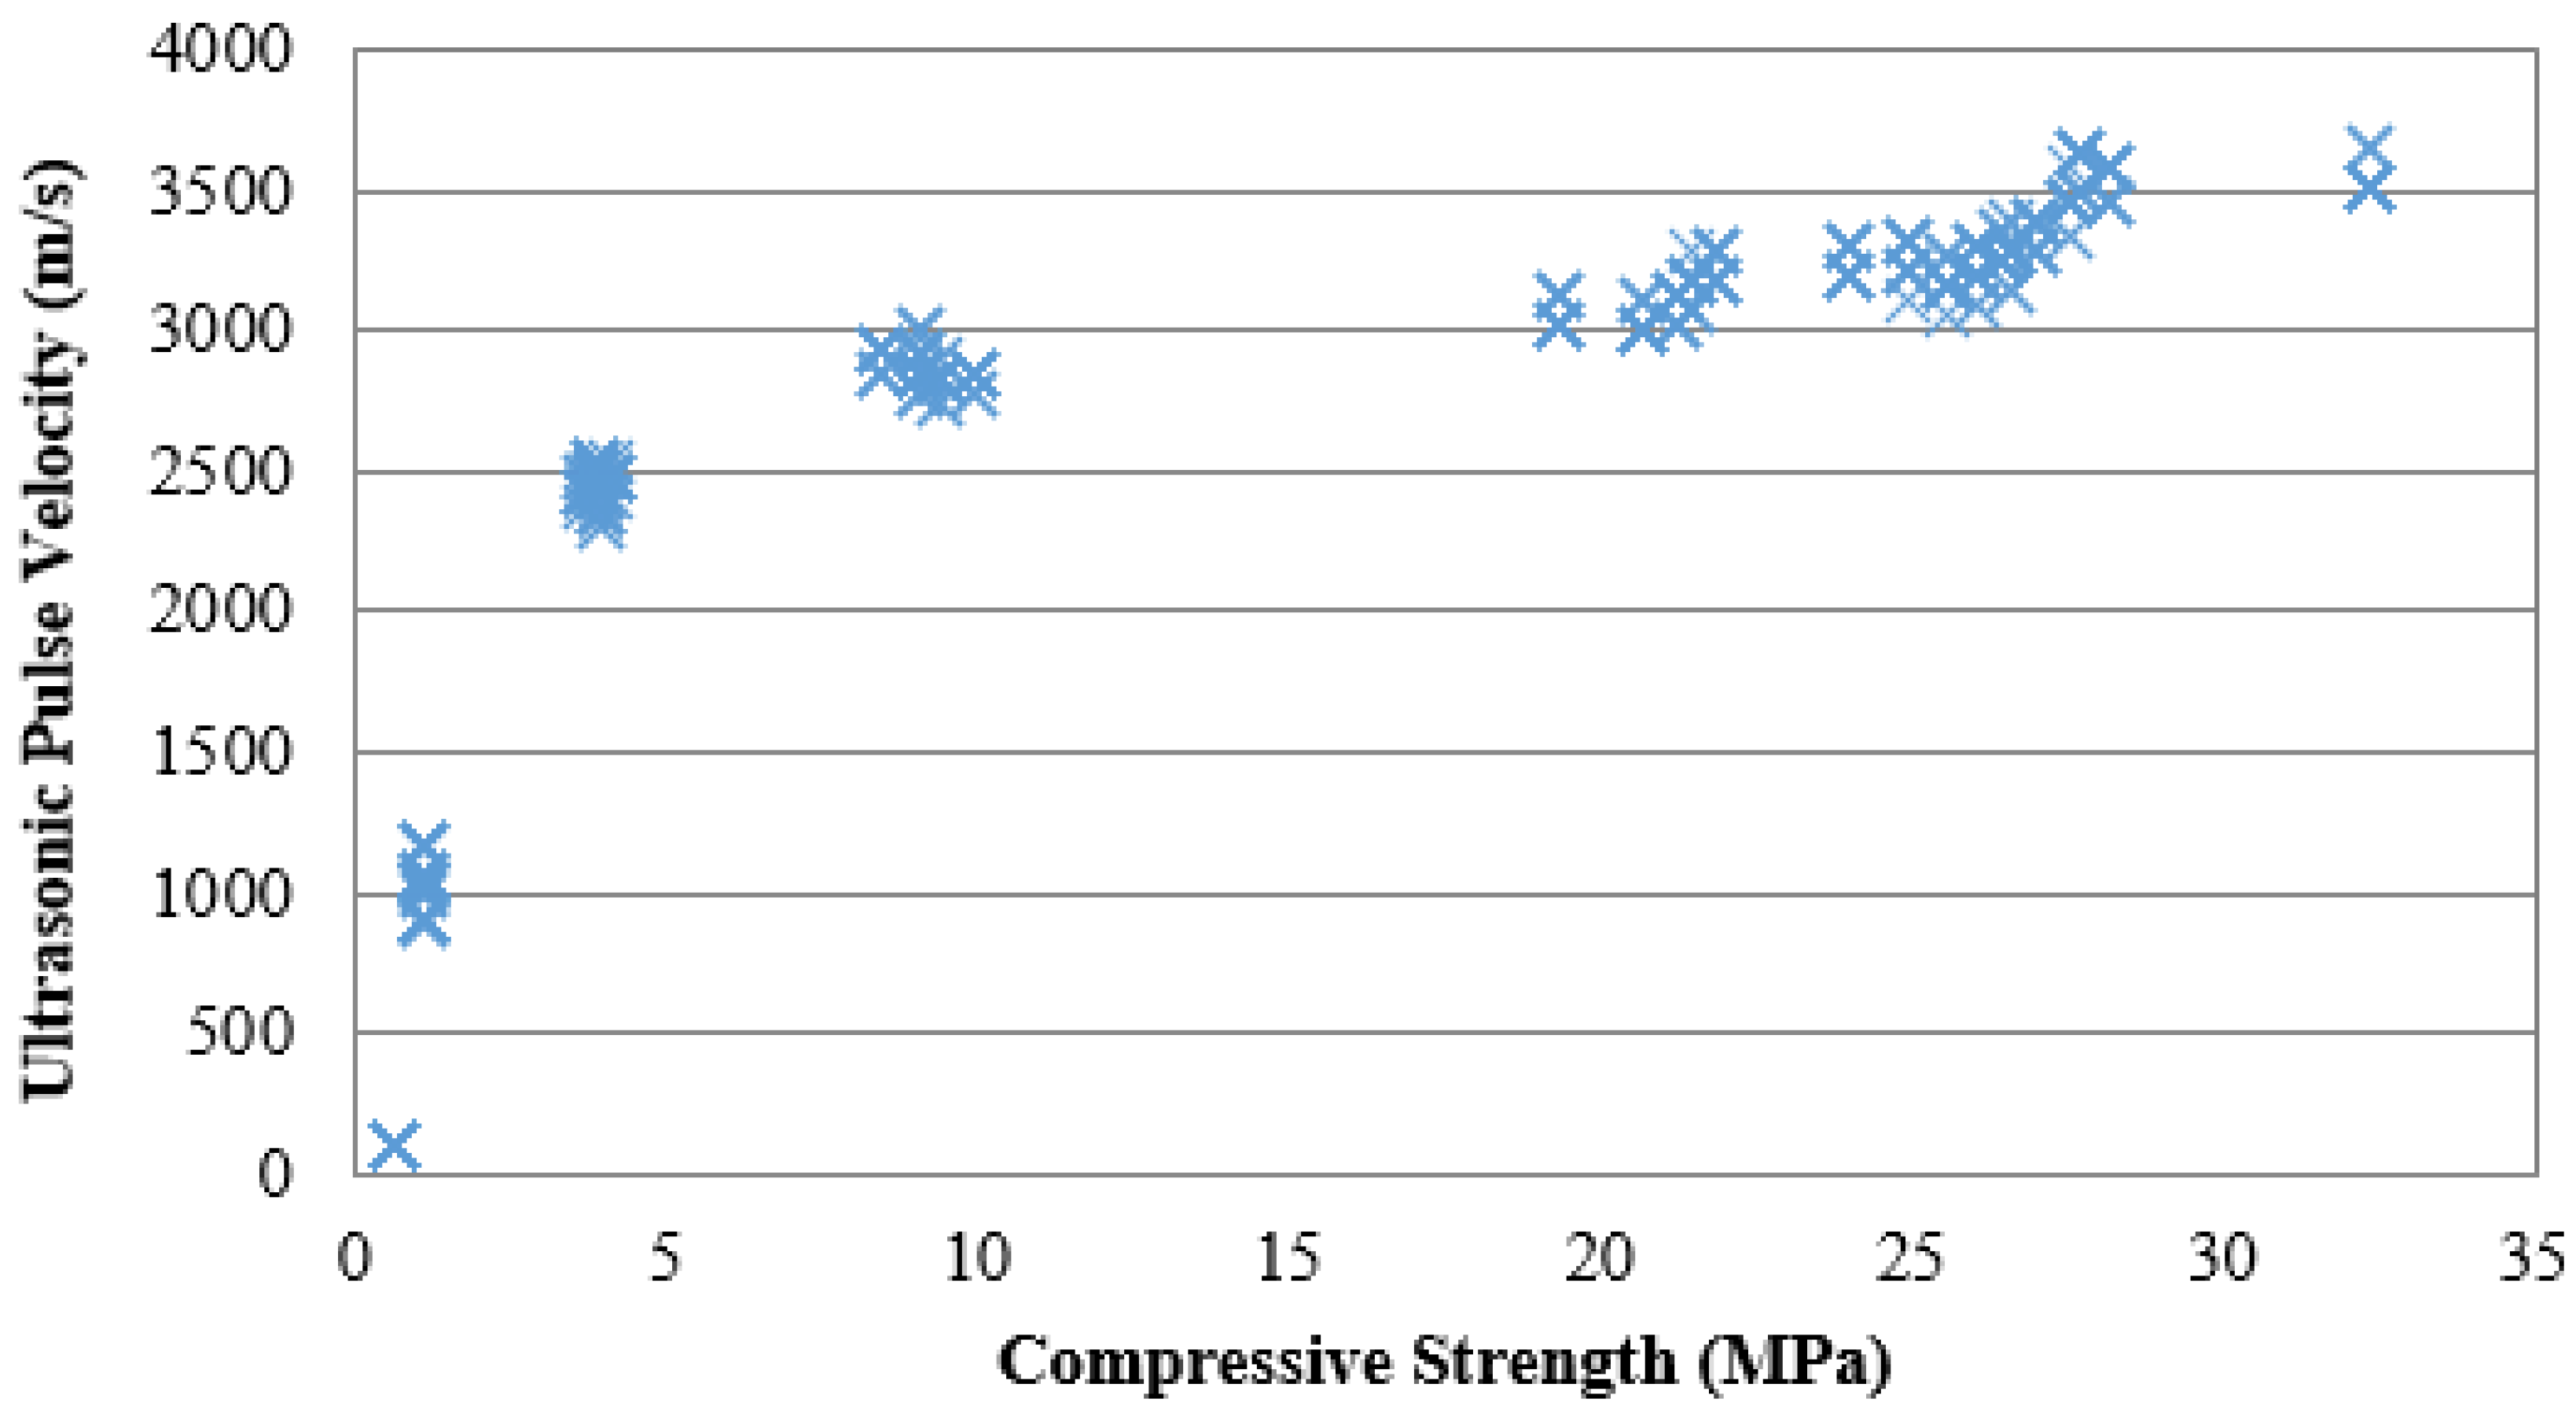
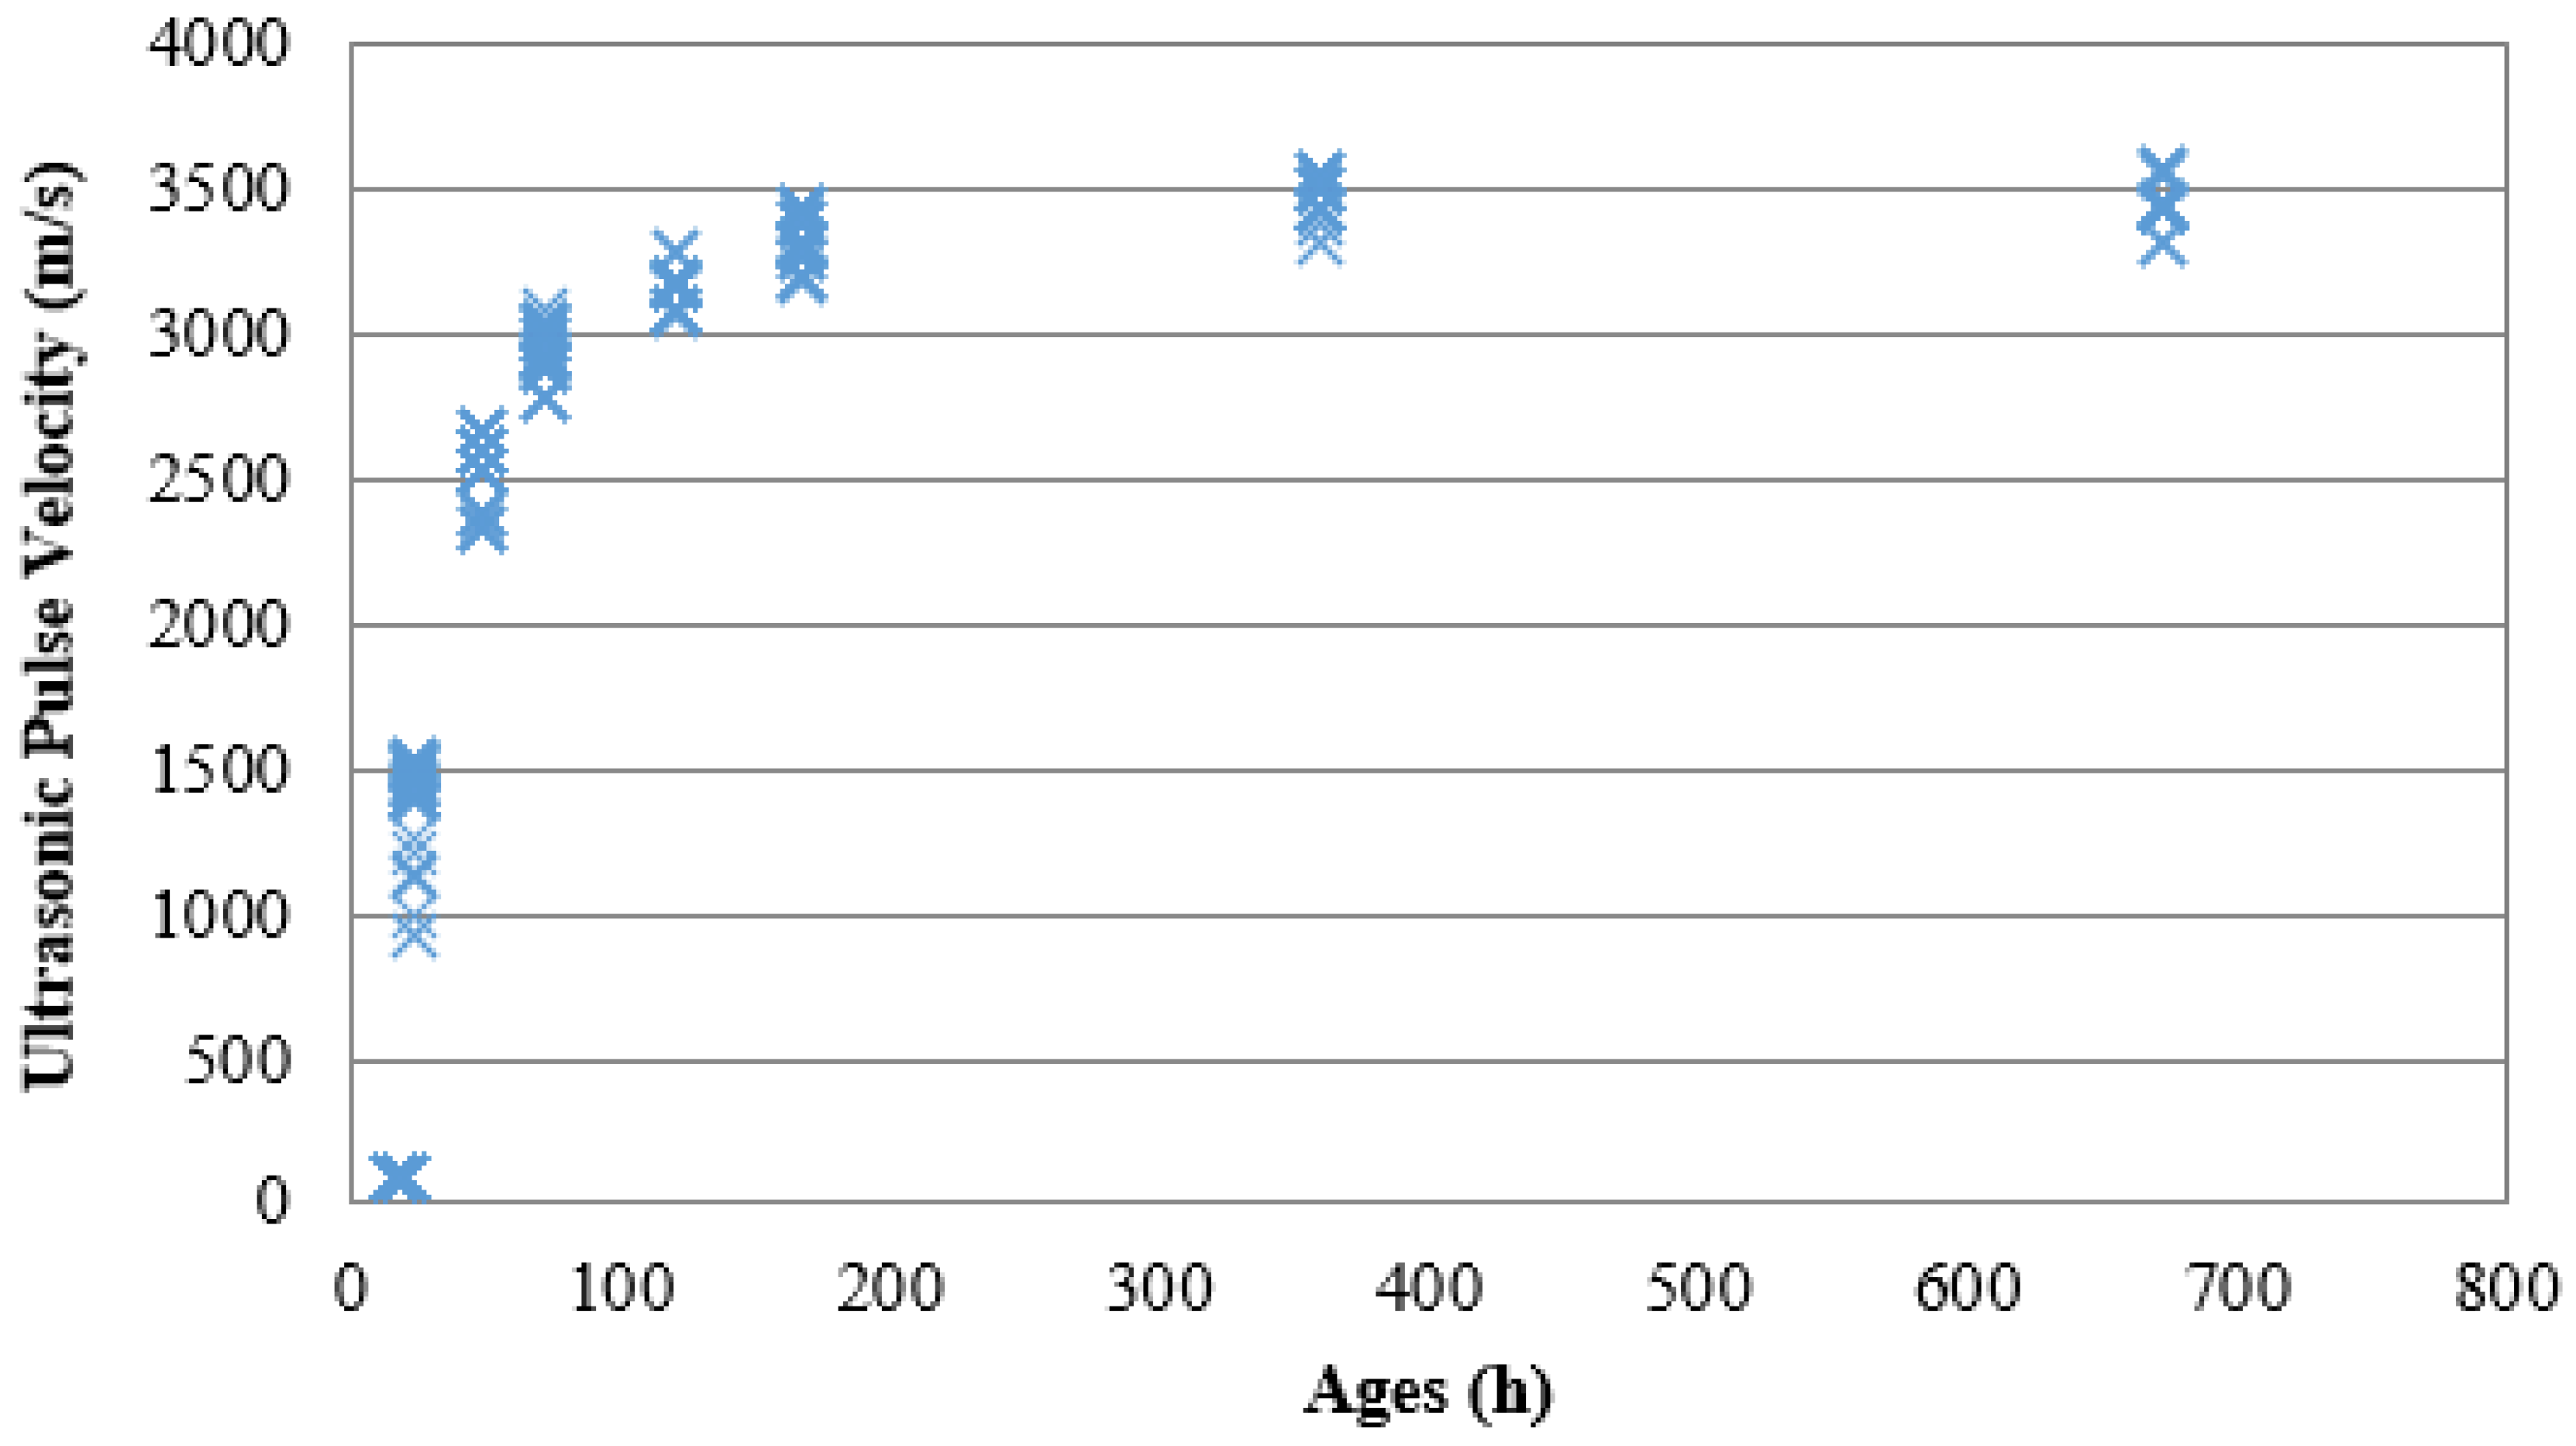
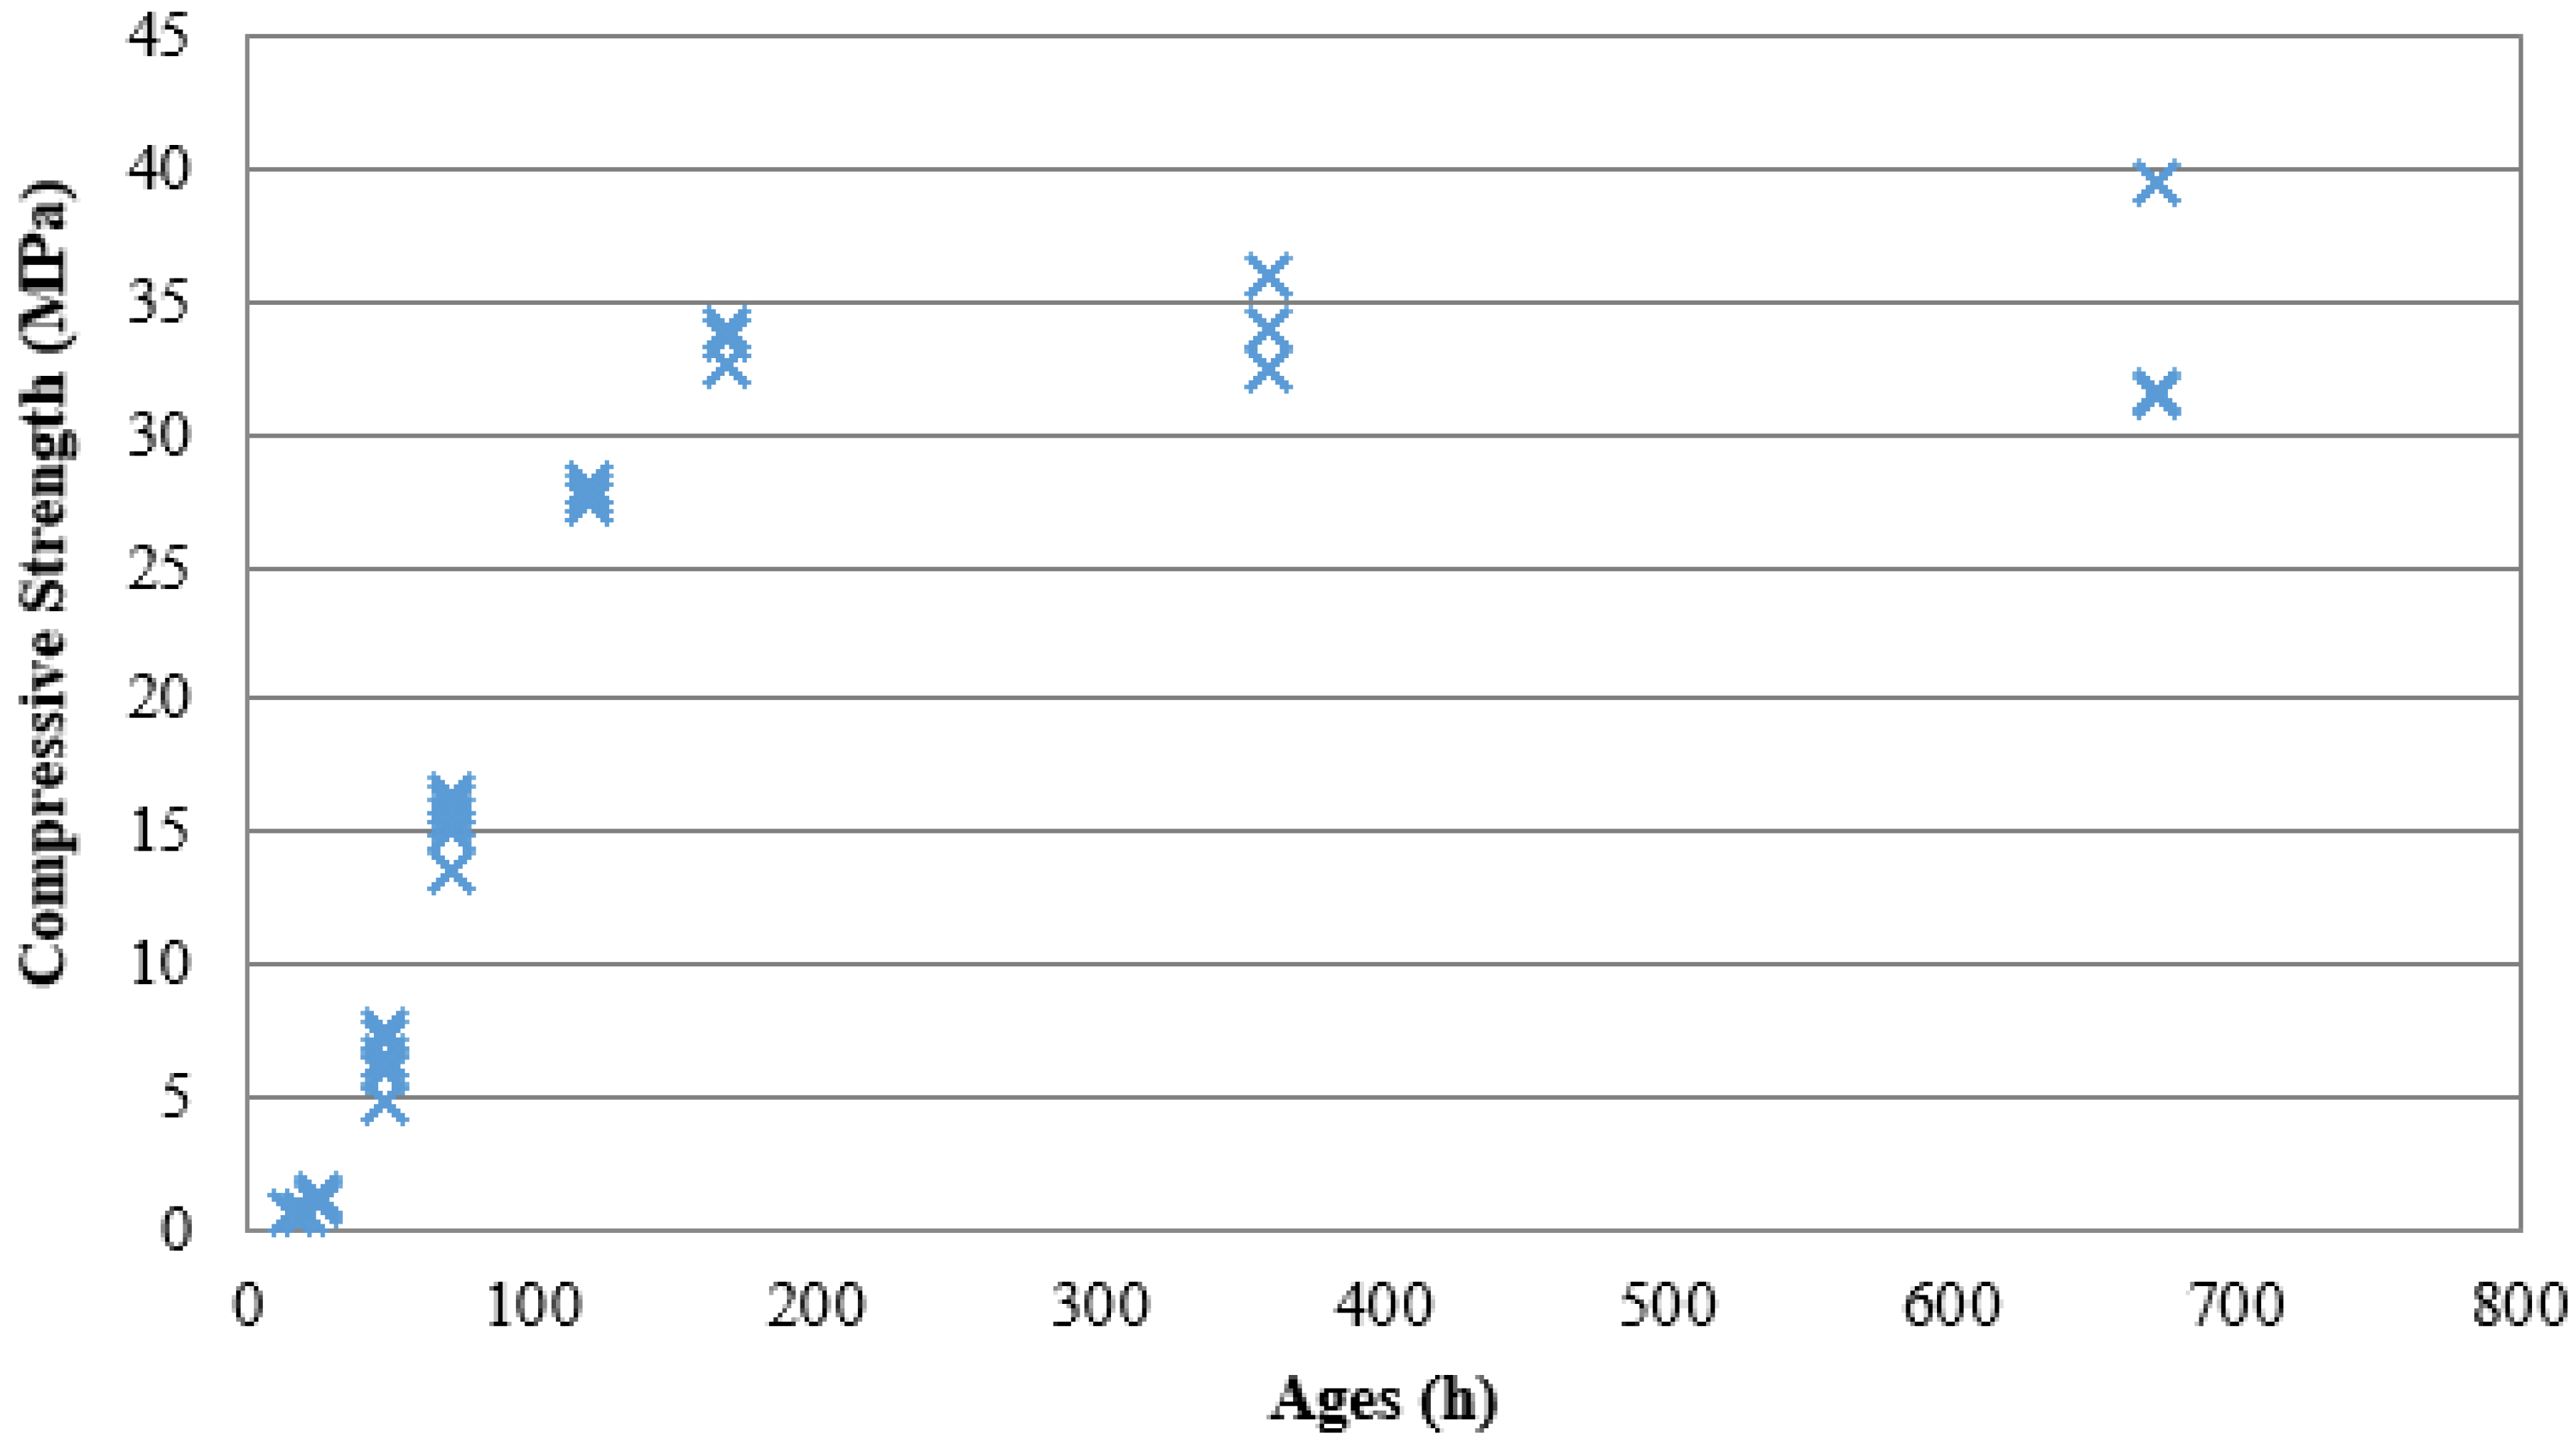
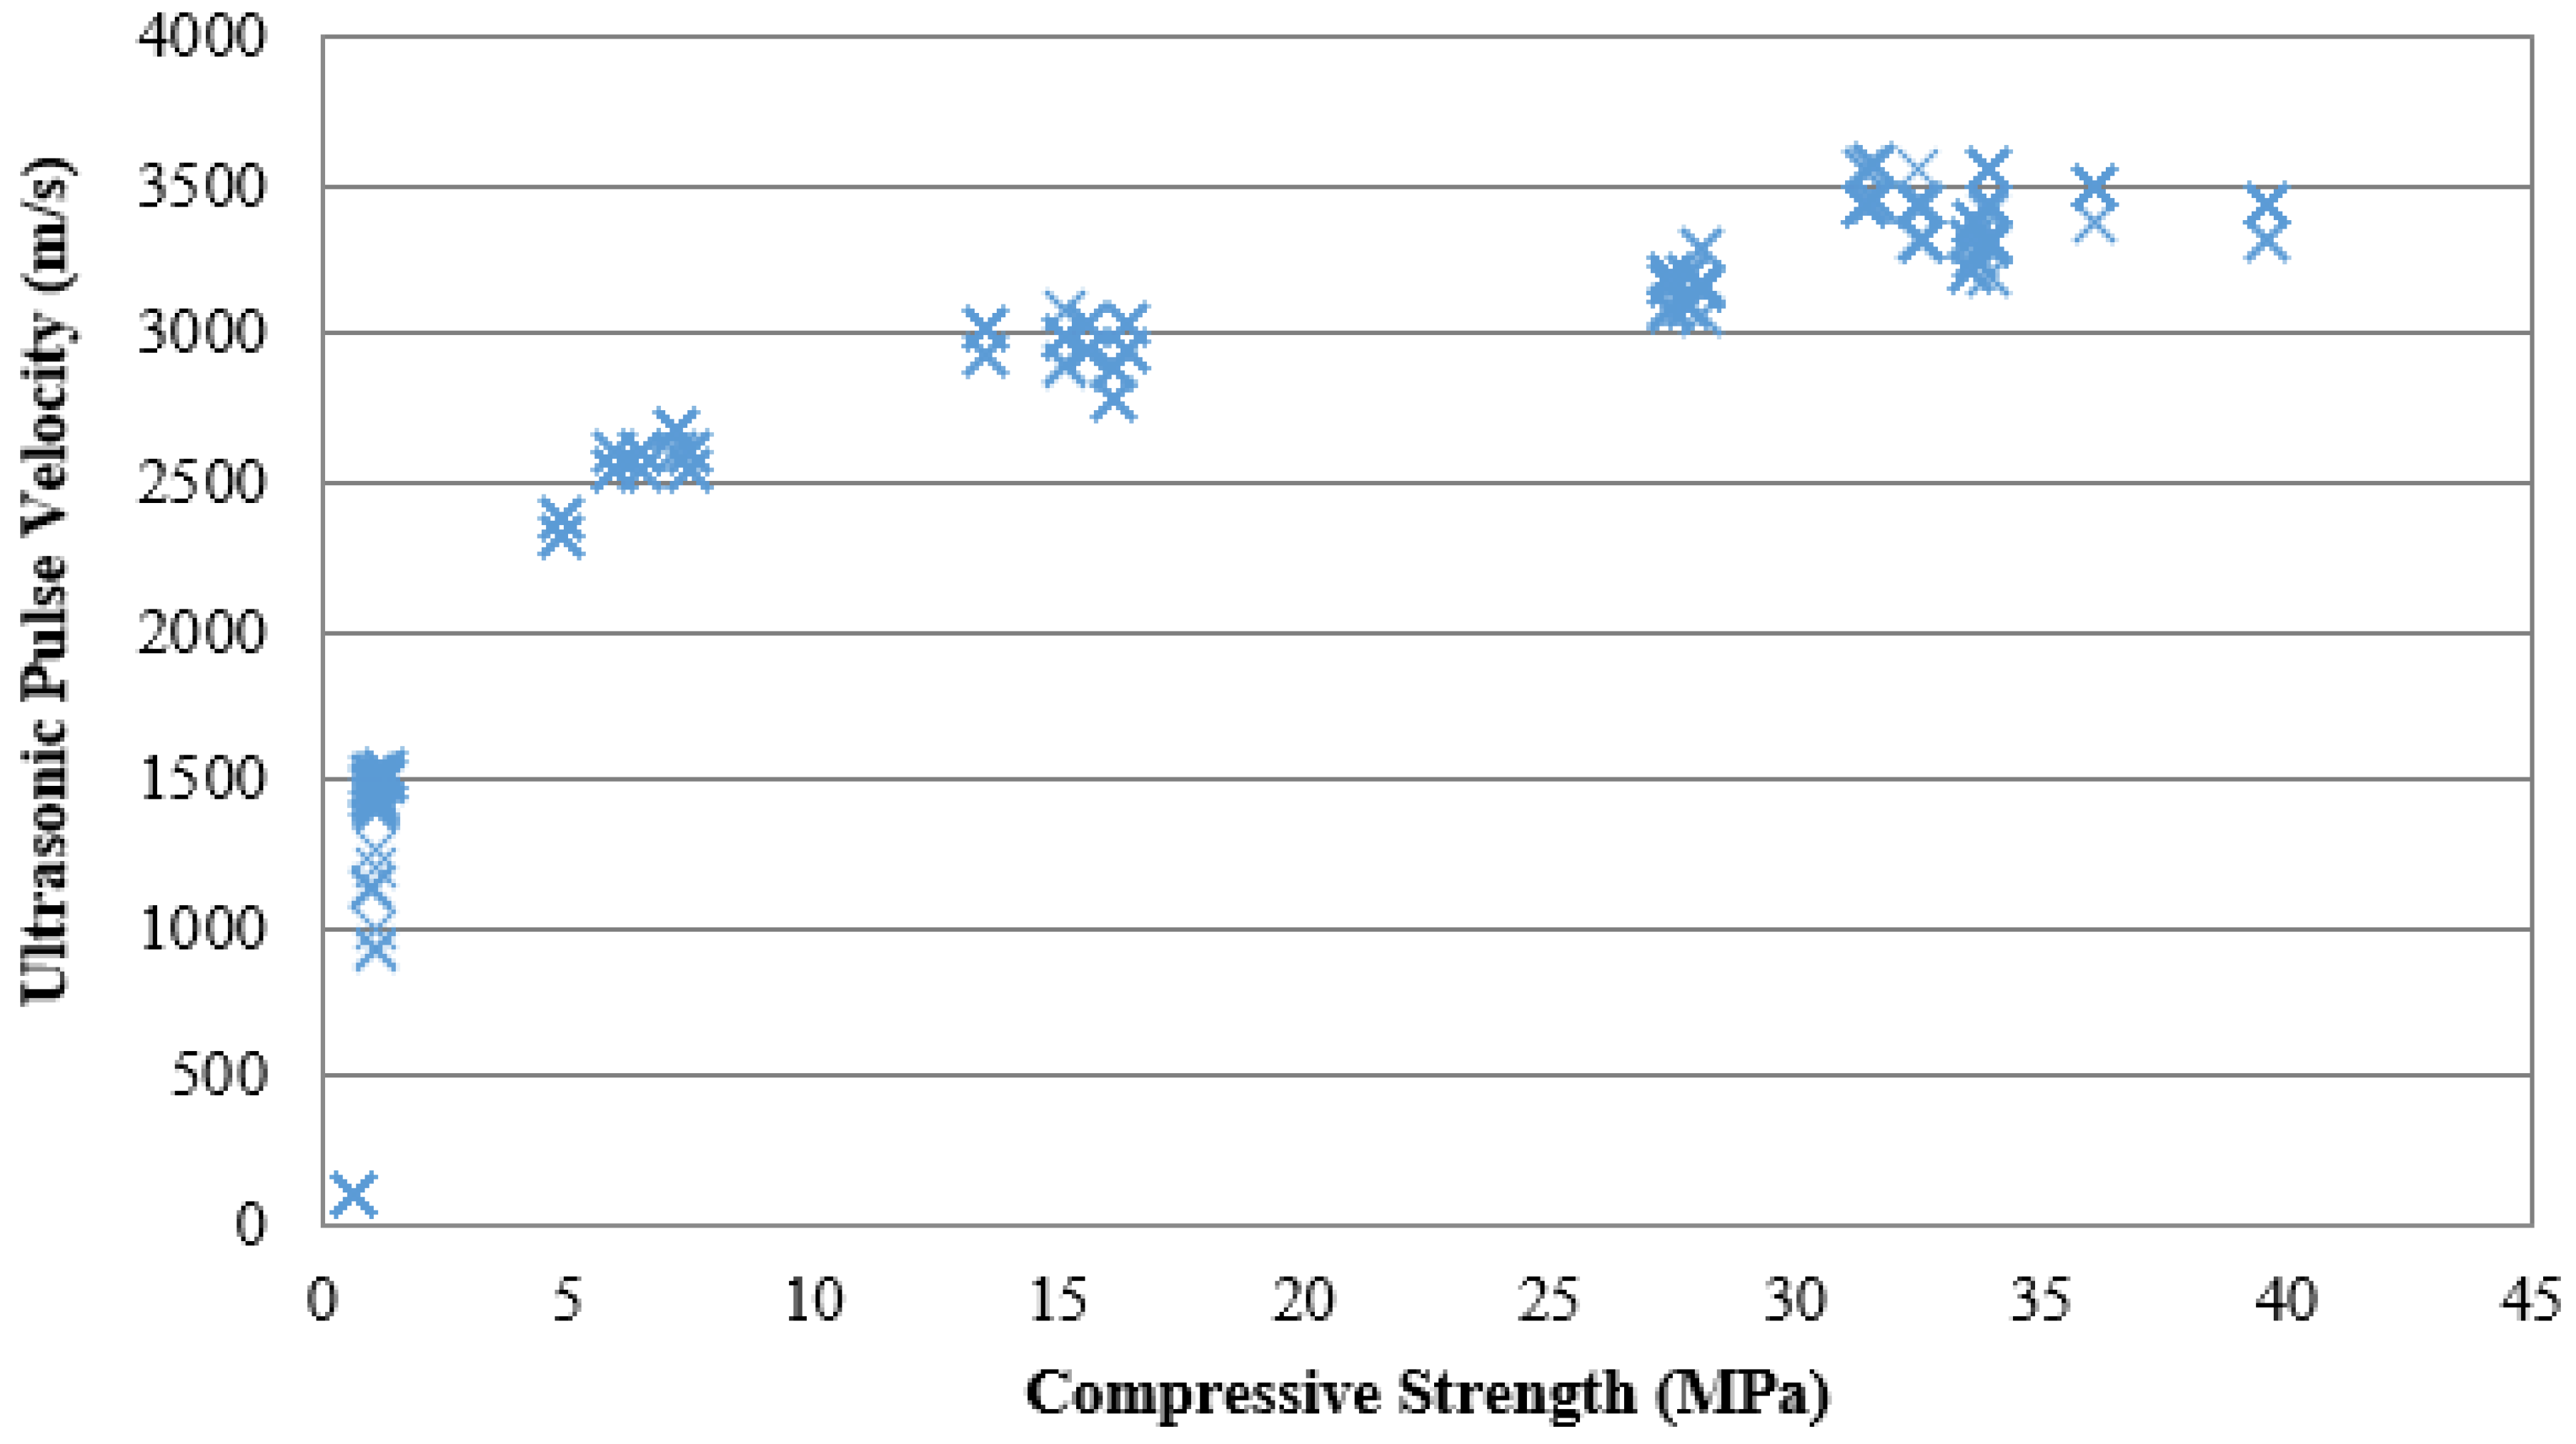
5. Discussion
- x: concrete compressive strength (MPa)
- y: ultrasonic pulse velocity (m/s)
6. Conclusions
Author Contributions
Funding
Acknowledgments
Conflicts of Interest
References
- ACI 228.2R. Nondestructive Test Methods for Evaluation of Concrete in Structures; American Concrete Institute: Farmington Hills, MI, USA, 2013. [Google Scholar]
- ASTM C 597. Standard Test Method for Pulse Velocity through Concrete; American Society for Testing and Materials: West Conshohocken, PA, USA, 2016. [Google Scholar]
- ASTM C 1383. Standard Test Method for Measuring the P-wave Speed and the Thickness of Concrete Plates Using the Impact Echo Method; American Society for Testing and Materials: West Conshohocken, PA, USA, 2015. [Google Scholar]
- Azari, H.; Nazarian, S.; Yuan, D. Assessing sensitivity of impact echo and ultrasonic surface wave methods for nondestructive evaluation of concrete structures. Constr. Build. Mater. 2014, 71, 384–391. [Google Scholar] [CrossRef]
- Sabbag, N.; Uyanık, O. Prediction of reinforced concrete strength by ultrasonic velocities. J. Appl. Geophys. 2017, 141, 13–23. [Google Scholar] [CrossRef]
- Ghosh, R.; Sagar, S.P.; Kumar, A.; Gupta, S.K.; Kumar, S. Estimation of geopolymer concrete strength from ultrasonic pulse velocity using high power pulser. J. Build. Eng. 2018, 16, 39–44. [Google Scholar] [CrossRef]
- Naderpour, H.; Rafiean, A.H.; Fakharian, P. Compressive strength prediction of environmentally friendly concrete using artificial neural networks. J. Build. Eng. 2016, 16, 213–219. [Google Scholar] [CrossRef]
- Pal, P. Dynamic Poisson’s ratio modulus of elasticity of pozzolana Portland cement concrete. Int. J. Eng. Technol. Innov. 2019, 9, 131–144. [Google Scholar]
- Panedpojaman, P.; Tonnayopas, D. Rebound hammer test to estimate compressive strength of heat exposed concrete. Constr. Build. Mater. 2018, 172, 387–395. [Google Scholar] [CrossRef]
- Hong, S.U.; Lee, Y.T.; Kim, S.H.; Lee, C.S. Estimation of Thickness of Concrete Structures using the Impact Echo Method and Ultrasonic Pulse Velocity Method. Archit. Res. 2016, 18, 179–184. [Google Scholar] [CrossRef]
- Hong, S.U.; Cho, Y.S. A Study on the Damage Detection of Concrete Structures using Impact Echo Method based on Stress Waves. J. Archit. Inst. Korea 2006, 22, 11–18. [Google Scholar]
- Bogas, J.A.; Gomes, M.G.; Gomes, A. Compressive strength evaluation of structural lightweight concrete by non-destructive ultrasonic pulse velocity method. Ultrasonics 2013, 53, 962–972. [Google Scholar] [CrossRef] [PubMed]
- Furuichi, N. Fundamental uncertainty analysis of flow rate measurement using the ultrasonic Doppler velocity profile method. Flow Meas. Instrum. 2013, 33, 202–211. [Google Scholar] [CrossRef]
- Roh, Y.S. Corrosion Level Measurement Technique for RC Wall Reinforcement Using Non-Destructive Test Methods. J. Korean Soc. Nondestruct. Test. 2011, 31, 24–31. [Google Scholar]
- Baek, I.K.; Cho, S.H.; Chung, L. Non-destructive Measurement Method of Reinforcement Corrosion Level by Infrared Thermography Data. J. Archit. Inst. Korea 2005, 21, 3–10. [Google Scholar]
- Naderpour, H.; Rafiean, A.H.; Fakharian, P. Analytical and genetic programming model of compressive strength of eco concretes by NDT according to curing temperature. Constr. Build. Mater. 2017, 144, 195–206. [Google Scholar]
- Saint-Pierre, F.; Philibert, A.; Giroux, B.; Rivard, P. Concrete Quality Designation based on Ultrasonic Pulse Velocity. Constr. Build. Mater. 2016, 125, 1022–1027. [Google Scholar] [CrossRef]


| Designed Strength 24 MPa: Mix Ratio (kg/m3) | |||||
| Cement | Water | Fine Aggregate | Crushed Sand | Coarse Aggregate | High-Performance AE Reducing Agent |
| 314 | 166 | 619 | 267 | 931 | 2.51 |
| W/B | 52.9% | S/a | 49% | ||
| Designed Strength 30 MPa: Mix Ratio (kg/m3) | |||||
| Cement | Water | Natural Sand | Crushed Sand | Coarse Aggregate | High-Performance AE Reducing Agent |
| 383 | 170 | 557 | 240 | 948 | 3.06 |
| W/B | 44.4% | S/a | 45.9% | ||
| Designed Strength 40 MPa: Mix Ratio (kg/m3) | |||||
| Cement | Water | Natural Sand | Crushed Sand | Coarse Aggregate | High-Performance AE Reducing Agent |
| 465 | 160 | 532 | 230 | 944 | 3.72 |
| W/B | 34.4% | S/a | 44.9% | ||
| Age (h) | Ultrasonic Pulse Velocity (m/s) | Aver. | Compressive Strength (MPa) | Aver. | |||||||||
|---|---|---|---|---|---|---|---|---|---|---|---|---|---|
| 16 | 97 | 96 | 97 | 96 | 96 | 97 | 96 | 97 | 96 | 96 | 96.40 | 0.62 | 0.62 |
| 97 | 96 | 97 | 96 | 96 | 97 | 96 | 97 | 96 | 96 | ||||
| 97 | 96 | 97 | 96 | 96 | 97 | 96 | 97 | 96 | 96 | 0.62 | |||
| 97 | 96 | 97 | 96 | 96 | 97 | 96 | 97 | 96 | 96 | ||||
| 97 | 96 | 97 | 96 | 96 | 97 | 96 | 97 | 96 | 96 | 0.62 | |||
| 97 | 96 | 97 | 96 | 96 | 97 | 96 | 97 | 96 | 96 | ||||
| 97 | 96 | 97 | 96 | 96 | 97 | 96 | 97 | 96 | 96 | 0.62 | |||
| 97 | 96 | 97 | 96 | 96 | 97 | 96 | 97 | 96 | 96 | ||||
| 97 | 96 | 97 | 96 | 96 | 97 | 96 | 97 | 96 | 96 | 0.62 | |||
| 97 | 96 | 97 | 96 | 96 | 97 | 96 | 97 | 96 | 96 | ||||
| 20 | 549 | 537 | 735 | 535 | 729 | 724 | 751 | 707 | 729 | 719 | 709.83 | 0.75 | 0.75 |
| 555 | 714 | 746 | 702 | 724 | 724 | 751 | 707 | 751 | 707 | ||||
| 719 | 719 | 751 | 707 | 724 | 724 | 751 | 707 | 724 | 719 | 0.75 | |||
| 214 | 719 | 746 | 702 | 729 | 724 | 751 | 707 | 751 | 712 | ||||
| 719 | 719 | 746 | 702 | 724 | 724 | 751 | 707 | 714 | 719 | 0.75 | |||
| 724 | 719 | 751 | 707 | 724 | 724 | 746 | 702 | 746 | 707 | ||||
| 724 | 724 | 751 | 702 | 729 | 724 | 751 | 702 | 724 | 724 | 0.75 | |||
| 719 | 724 | 751 | 702 | 729 | 724 | 751 | 702 | 751 | 707 | ||||
| 24 | 891 | 1207 | 925 | 917 | 871 | 900 | 1207 | 942 | 1063 | 871 | 1005.27 | 0.87 | 0.92 |
| 900 | 1031 | 933 | 917 | 879 | 900 | 1523 | 942 | 925 | 879 | ||||
| 900 | 1523 | 933 | 1075 | 879 | 900 | 1546 | 942 | 925 | 879 | 1.00 | |||
| 891 | 1042 | 933 | 925 | 871 | 900 | 1546 | 942 | 925 | 879 | ||||
| 900 | 1042 | 942 | 917 | 879 | 900 | 1546 | 942 | 934 | 871 | 1.00 | |||
| 891 | 1546 | 942 | 925 | 879 | 900 | 1207 | 942 | 925 | 879 | ||||
| 900 | 1546 | 933 | 925 | 879 | 900 | 1546 | 942 | 934 | 879 | 0.87 | |||
| 900 | 1192 | 942 | 925 | 871 | 900 | 1523 | 942 | 925 | 879 | ||||
| 900 | 1546 | 942 | 925 | 871 | 900 | 1523 | 942 | 934 | 879 | 0.87 | |||
| 900 | 1064 | 942 | 925 | 879 | 900 | 1546 | 942 | 925 | 871 | ||||
| 48 | 2357 | 2250 | 1706 | 2272 | 2302 | 2357 | 2250 | 1677 | 2272 | 2357 | 2176.86 | 2.99 | 2.77 |
| 2357 | 2302 | 1706 | 2222 | 2302 | 2357 | 2250 | 1706 | 2272 | 2357 | ||||
| 2302 | 2250 | 1706 | 2272 | 2302 | 2357 | 2302 | 1677 | 2222 | 2357 | 2.99 | |||
| 2357 | 2302 | 1706 | 2222 | 2302 | 2302 | 2250 | 1706 | 2222 | 2357 | ||||
| 2302 | 2302 | 1706 | 2222 | 2302 | 2357 | 2302 | 1677 | 2272 | 2357 | 2.62 | |||
| 2357 | 2250 | 1706 | 2272 | 2302 | 2357 | 2250 | 1677 | 2325 | 2357 | ||||
| 2302 | 2302 | 1706 | 2272 | 2357 | 2302 | 2302 | 1706 | 2272 | 2357 | 2.37 | |||
| 2302 | 2250 | 1706 | 2222 | 2357 | 2357 | 2250 | 1677 | 2272 | 2357 | ||||
| 2302 | 2250 | 1706 | 2272 | 2302 | 2302 | 2250 | 1546 | 2272 | 2357 | 2.87 | |||
| 2357 | 2302 | 1706 | 2272 | 2357 | 2302 | 2302 | 1571 | 2272 | 2302 | ||||
| 72 | 2662 | 2572 | 2838 | 2750 | 2736 | 2592 | 2572 | 2757 | 2750 | 2736 | 2703.51 | 5.86 | 6.06 |
| 2662 | 2572 | 2757 | 2675 | 2662 | 2662 | 2648 | 2838 | 2750 | 2736 | ||||
| 2662 | 2572 | 2838 | 2750 | 2736 | 2662 | 2648 | 2757 | 2750 | 2662 | 5.98 | |||
| 2662 | 2572 | 2757 | 2828 | 2662 | 2662 | 2572 | 2757 | 2750 | 2736 | ||||
| 2662 | 2648 | 2838 | 2750 | 2736 | 2662 | 2648 | 2838 | 2750 | 2714 | 6.36 | |||
| 2592 | 2648 | 2757 | 2750 | 2736 | 2662 | 2648 | 2757 | 2750 | 2736 | ||||
| 2662 | 2572 | 2757 | 2828 | 2736 | 2592 | 2648 | 2757 | 2750 | 2662 | 6.24 | |||
| 2662 | 2572 | 2838 | 2675 | 2736 | 2662 | 2648 | 2838 | 2675 | 2736 | ||||
| 2662 | 2648 | 2838 | 2750 | 2736 | 2662 | 2572 | 2757 | 2750 | 2736 | 5.86 | |||
| 2736 | 2648 | 2757 | 2750 | 2662 | 2662 | 2572 | 2757 | 2750 | 2736 | ||||
| 120 | 3062 | 2969 | 3078 | 3031 | 2954 | 3062 | 3062 | 3177 | 2939 | 2954 | 2988.83 | 11.98 | 13.20 |
| 3163 | 2969 | 3177 | 2939 | 2867 | 3062 | 3062 | 3078 | 293.9 | 2954 | ||||
| 3161 | 2969 | 3078 | 3031 | 2867 | 3062 | 2969 | 3078 | 3031 | 2954 | 12.85 | |||
| 3161 | 2969 | 3177 | 2939 | 2954 | 3062 | 3062 | 3078 | 3031 | 3046 | ||||
| 3062 | 3062 | 3078 | 3031 | 2867 | 3062 | 2969 | 3177 | 3031 | 3046 | 14.22 | |||
| 3062 | 2969 | 3177 | 3031 | 2954 | 3062 | 3062 | 3177 | 3031 | 3046 | ||||
| 3062 | 3062 | 3078 | 3031 | 2954 | 3161 | 2969 | 3177 | 3031 | 2954 | 13.60 | |||
| 3161 | 3062 | 3177 | 3031 | 3046 | 3062 | 3062 | 377 | 3031 | 2954 | ||||
| 3062 | 3062 | 3078 | 3031 | 3046 | 3062 | 3062 | 3177 | 3031 | 2954 | 13.35 | |||
| 3062 | 3062 | 3177 | 2939 | 2954 | 3062 | 3062 | 3177 | 2939 | 2954 | ||||
| 168 | 3062 | 3078 | 3145 | 3078 | 3046 | 3062 | 3078 | 3250 | 3177 | 3046 | 3131.91 | 14.35 | 17.79 |
| 3062 | 3177 | 3145 | 3078 | 3046 | 3062 | 3177 | 3250 | 3177 | 3046 | ||||
| 3161 | 3177 | 3145 | 3177 | 3046 | 3161 | 3078 | 3250 | 3078 | 3046 | 19.09 | |||
| 3062 | 3177 | 3250 | 3177 | 3046 | 3161 | 3078 | 3145 | 3078 | 3046 | ||||
| 3161 | 3177 | 3145 | 3177 | 3046 | 3062 | 3078 | 3145 | 3177 | 3046 | 17.84 | |||
| 3161 | 3177 | 3145 | 3177 | 3046 | 3062 | 3177 | 3250 | 3177 | 3046 | ||||
| 3062 | 3177 | 3250 | 3078 | 3046 | 3062 | 3177 | 3145 | 3078 | 3046 | 18.72 | |||
| 3062 | 3177 | 3145 | 3177 | 3046 | 3161 | 3177 | 3145 | 3283 | 3145 | ||||
| 3062 | 3177 | 3250 | 3177 | 3046 | 3161 | 3177 | 3250 | 3177 | 3046 | 18.97 | |||
| 3161 | 3177 | 3145 | 3177 | 3145 | 3062 | 3177 | 3250 | 3177 | 3145 | ||||
| 360 | 3362 | 3446 | 3413 | 3362 | 3327 | 3535 | 3250 | 3327 | 3413 | 3362 | 3382.57 | 19.96 | 20.59 |
| 3362 | 3327 | 3413 | 3250 | 3327 | 3535 | 3250 | 3446 | 3413 | 3250 | ||||
| 3362 | 3327 | 3413 | 3362 | 3446 | 3413 | 3250 | 3446 | 3413 | 3446 | 21.34 | |||
| 3250 | 3446 | 3535 | 3250 | 3327 | 3413 | 3362 | 3446 | 3413 | 3446 | ||||
| 3362 | 3327 | 3535 | 3362 | 3446 | 3413 | 3362 | 3327 | 3535 | 3413 | 20.46 | |||
| 3250 | 3327 | 3413 | 3362 | 3327 | 3413 | 3250 | 3446 | 3535 | 3413 | ||||
| 672 | 3410 | 3362 | 3396 | 3410 | 3482 | 3283 | 3410 | 3482 | 3283 | 3410 | 3381.12 | 23.08 | 22.17 |
| 3410 | 3482 | 3396 | 3293 | 3362 | 3283 | 3410 | 3362 | 3283 | 3410 | ||||
| 3410 | 3362 | 3283 | 3410 | 3362 | 3396 | 3410 | 3362 | 3396 | 3482 | 21.84 | |||
| 3293 | 3362 | 3283 | 3293 | 3482 | 3283 | 3410 | 3362 | 3396 | 3482 | ||||
| 3410 | 3362 | 3283 | 3410 | 3482 | 3283 | 3410 | 3482 | 3283 | 3283 | 21.59 | |||
| 3410 | 3482 | 3396 | 3410 | 3362 | 3283 | 3537 | 3482 | 3283 | 3396 | ||||
| Age (h) | Ultrasonic Pulse Velocity (m/s) | Aver. | Compressive Strength (MPa) | Aver. | |||||||||
|---|---|---|---|---|---|---|---|---|---|---|---|---|---|
| 16 | 97 | 96 | 97 | 96 | 96 | 97 | 96 | 97 | 96 | 96 | 96.40 | 0.62 | 0.62 |
| 97 | 96 | 97 | 96 | 96 | 97 | 96 | 97 | 96 | 96 | ||||
| 97 | 96 | 97 | 96 | 96 | 97 | 96 | 97 | 96 | 96 | 0.62 | |||
| 97 | 96 | 97 | 96 | 96 | 97 | 96 | 97 | 96 | 96 | ||||
| 97 | 96 | 97 | 96 | 96 | 97 | 96 | 97 | 96 | 96 | 0.62 | |||
| 97 | 96 | 97 | 96 | 96 | 97 | 96 | 97 | 96 | 96 | ||||
| 97 | 96 | 97 | 96 | 96 | 97 | 96 | 97 | 96 | 96 | 0.62 | |||
| 97 | 96 | 97 | 96 | 96 | 97 | 96 | 97 | 96 | 96 | ||||
| 97 | 96 | 97 | 96 | 96 | 97 | 96 | 97 | 96 | 96 | 0.62 | |||
| 97 | 96 | 97 | 96 | 96 | 97 | 96 | 97 | 96 | 96 | ||||
| 20 | 96 | 96 | 96 | 96 | 96 | 96 | 96 | 96 | 96 | 96 | 96.00 | 0.62 | 0.62 |
| 96 | 96 | 96 | 96 | 96 | 96 | 96 | 96 | 96 | 96 | ||||
| 96 | 96 | 96 | 96 | 96 | 96 | 96 | 96 | 96 | 96 | 0.62 | |||
| 96 | 96 | 96 | 96 | 96 | 96 | 96 | 96 | 96 | 96 | ||||
| 96 | 96 | 96 | 96 | 96 | 96 | 96 | 96 | 96 | 96 | 0.62 | |||
| 96 | 96 | 96 | 96 | 96 | 96 | 96 | 96 | 96 | 96 | ||||
| 96 | 96 | 96 | 96 | 96 | 96 | 96 | 96 | 96 | 96 | 0.62 | |||
| 96 | 96 | 96 | 96 | 96 | 96 | 96 | 96 | 96 | 96 | ||||
| 96 | 96 | 96 | 96 | 96 | 96 | 96 | 96 | 96 | 96 | 0.62 | |||
| 96 | 96 | 96 | 96 | 96 | 96 | 96 | 96 | 96 | 96 | ||||
| 24 | 1069 | 888 | 1157 | 1036 | 900 | 1069 | 896 | 1164 | 904 | 908 | 1009.95 | 1.12 | 1.12 |
| 1058 | 1005 | 1164 | 1025 | 1020 | 1069 | 888 | 1164 | 1025 | 908 | ||||
| 1047 | 995 | 1164 | 1025 | 908 | 1069 | 985 | 1164 | 1025 | 908 | 1.12 | |||
| 1069 | 896 | 1164 | 1015 | 908 | 1058 | 888 | 1164 | 1036 | 908 | ||||
| 1069 | 888 | 1164 | 1025 | 900 | 1069 | 896 | 1164 | 904 | 908 | 1.12 | |||
| 1058 | 995 | 1164 | 896 | 908 | 1069 | 896 | 1164 | 1036 | 908 | ||||
| 1069 | 896 | 1164 | 1015 | 908 | 1069 | 896 | 1164 | 1036 | 908 | 1.12 | |||
| 1069 | 896 | 1164 | 904 | 908 | 1069 | 896 | 1164 | 1025 | 900 | ||||
| 1069 | 896 | 1164 | 896 | 908 | 1069 | 896 | 1164 | 1025 | 908 | 1.12 | |||
| 1069 | 896 | 1164 | 896 | 900 | 1069 | 995 | 1164 | 1025 | 908 | ||||
| 48 | 2426 | 2475 | 2475 | 2414 | 2439 | 2426 | 2475 | 2475 | 2357 | 2439 | 2451.78 | 3.74 | 3.92 |
| 2426 | 2475 | 2538 | 2302 | 2439 | 2426 | 2475 | 2475 | 2357 | 2500 | ||||
| 2369 | 2475 | 2538 | 2357 | 2439 | 2426 | 2475 | 2538 | 2357 | 2439 | 4.12 | |||
| 2369 | 2475 | 2538 | 2357 | 2439 | 2426 | 2475 | 2538 | 2357 | 2500 | ||||
| 2426 | 2538 | 2475 | 2414 | 2439 | 2426 | 2475 | 2538 | 2414 | 2439 | 3.87 | |||
| 2426 | 2475 | 2538 | 2357 | 2439 | 2487 | 2475 | 2475 | 2414 | 2500 | ||||
| 2426 | 2475 | 2475 | 2302 | 2439 | 2426 | 2414 | 2538 | 2414 | 2500 | 3.99 | |||
| 2426 | 2475 | 2538 | 2302 | 2439 | 2487 | 2475 | 2538 | 2357 | 2500 | ||||
| 2487 | 2475 | 2538 | 2357 | 2439 | 2487 | 2538 | 2538 | 2414 | 2439 | 3.87 | |||
| 2426 | 2475 | 2538 | 2414 | 2500 | 2487 | 2475 | 2538 | 2357 | 2439 | ||||
| 72 | 2842 | 2771 | 2823 | 2852 | 2852 | 2926 | 2771 | 2742 | 2852 | 2939 | 2867.16 | 9.11 | 9.21 |
| 2926 | 2852 | 2823 | 2852 | 2939 | 2926 | 2852 | 2823 | 2852 | 2939 | ||||
| 2926 | 2852 | 2909 | 2771 | 2939 | 3015 | 2852 | 2823 | 2771 | 2939 | 9.98 | |||
| 2926 | 2852 | 2823 | 2852 | 2852 | 2926 | 2852 | 2823 | 2852 | 2852 | ||||
| 2842 | 2852 | 2823 | 2771 | 2939 | 3015 | 2771 | 2742 | 2852 | 2852 | 9.36 | |||
| 2926 | 2852 | 2823 | 2852 | 2939 | 2926 | 2852 | 2823 | 2852 | 2852 | ||||
| 2926 | 2771 | 2823 | 2852 | 2939 | 3015 | 2852 | 2742 | 2852 | 2939 | 9.11 | |||
| 2926 | 2852 | 2823 | 2852 | 2939 | 2926 | 2852 | 2823 | 2771 | 2852 | ||||
| 3015 | 2852 | 2823 | 2771 | 2939 | 3015 | 2852 | 2823 | 2852 | 2939 | 8.48 | |||
| 3015 | 2852 | 2823 | 2852 | 2939 | 2926 | 2852 | 2909 | 2771 | 2852 | ||||
| 120 | 3078 | 3177 | 3031 | 3031 | 3015 | 3177 | 3177 | 3031 | 3129 | 3015 | 3118.27 | 21.46 | 20.91 |
| 3177 | 3177 | 3031 | 3129 | 3015 | 3177 | 3283 | 3129 | 3129 | 3112 | ||||
| 3177 | 3283 | 3129 | 3129 | 3112 | 3177 | 3177 | 3129 | 3129 | 3015 | 21.84 | |||
| 3078 | 3177 | 3031 | 3129 | 3015 | 3177 | 3283 | 3031 | 3031 | 3015 | ||||
| 3177 | 3177 | 3129 | 3129 | 3015 | 3177 | 3177 | 3129 | 3129 | 3015 | 19.34 | |||
| 3177 | 3177 | 3031 | 3129 | 3015 | 3177 | 3283 | 3129 | 3031 | 3015 | ||||
| 3177 | 3177 | 3031 | 3129 | 3015 | 3283 | 3283 | 3031 | 3031 | 3112 | 21.21 | |||
| 3177 | 3283 | 3031 | 3129 | 3015 | 3078 | 3177 | 3031 | 3129 | 3015 | ||||
| 3177 | 3283 | 3129 | 3129 | 3015 | 3177 | 3283 | 3031 | 3031 | 3112 | 20.71 | |||
| 3078 | 3177 | 3129 | 3031 | 3112 | 3177 | 3283 | 3031 | 3031 | 3015 | ||||
| 168 | 3200 | 3112 | 3250 | 3062 | 3193 | 3200 | 3216 | 3362 | 3161 | 3300 | 3240.31 | 23.96 | 25.41 |
| 3310 | 3216 | 3250 | 3266 | 3093 | 3200 | 3216 | 3250 | 3161 | 3193 | ||||
| 3310 | 3327 | 3250 | 3161 | 3093 | 3310 | 3327 | 3362 | 3266 | 3300 | 24.96 | |||
| 3310 | 3216 | 3250 | 3161 | 3300 | 3310 | 3216 | 3362 | 3161 | 3193 | ||||
| 3200 | 3327 | 3250 | 3161 | 3191 | 3310 | 3216 | 3250 | 3161 | 3300 | 26.45 | |||
| 3310 | 3327 | 3250 | 3161 | 3300 | 3310 | 3327 | 3250 | 3161 | 3193 | ||||
| 3200 | 3216 | 3250 | 3266 | 3193 | 3200 | 3327 | 3362 | 3266 | 3300 | 25.58 | |||
| 3200 | 3327 | 3250 | 3266 | 3193 | 3200 | 3216 | 3250 | 3161 | 3300 | ||||
| 3200 | 3327 | 3250 | 3161 | 3193 | 3310 | 3327 | 3250 | 3161 | 3193 | 26.08 | |||
| 3200 | 3216 | 3250 | 3161 | 3300 | 3200 | 3327 | 3250 | 3161 | 3300 | ||||
| 360 | 3464 | 3464 | 3629 | 3592 | 3464 | 3500 | 3592 | 3464 | 3629 | 3592 | 3529.82 | 28.20 | 27.83 |
| 3464 | 3464 | 3629 | 3592 | 3464 | 3500 | 3592 | 3344 | 3629 | 3464 | ||||
| 3464 | 3464 | 3629 | 3592 | 3464 | 3500 | 3592 | 3464 | 3500 | 3464 | 27.58 | |||
| 3464 | 3344 | 3500 | 3592 | 3464 | 3629 | 3592 | 3592 | 3500 | 3464 | ||||
| 3464 | 3464 | 3629 | 3464 | 3464 | 3629 | 3592 | 3464 | 3629 | 3500 | 27.70 | |||
| 3592 | 3464 | 3629 | 3592 | 3464 | 3629 | 3592 | 3464 | 3629 | 3629 | ||||
| 672 | 3517 | 3283 | 3283 | 3517 | 3283 | 3145 | 3648 | 3396 | 3283 | 3648 | 3389.20 | 32.32 | 28.62 |
| 3517 | 3396 | 3283 | 3648 | 3283 | 3283 | 3517 | 3396 | 3283 | 3517 | ||||
| 3517 | 3283 | 3283 | 3517 | 3283 | 3283 | 3517 | 3396 | 3396 | 3396 | 26.95 | |||
| 3517 | 3283 | 3283 | 3517 | 3396 | 3283 | 3517 | 3396 | 3396 | 3283 | ||||
| 3517 | 3396 | 3283 | 3517 | 3396 | 3283 | 3648 | 3396 | 3283 | 3283 | 26.58 | |||
| 3517 | 3396 | 3283 | 3517 | 3396 | 3145 | 3517 | 3283 | 3145 | 3283 | ||||
| Age (h) | Ultrasonic Pulse Velocity (m/s) | Aver. | Compressive Strength (MPa) | Aver. | |||||||||
|---|---|---|---|---|---|---|---|---|---|---|---|---|---|
| 16 | 97 | 96 | 97 | 96 | 96 | 97 | 96 | 97 | 96 | 96 | 96.40 | 0.62 | 0.62 |
| 97 | 96 | 97 | 96 | 96 | 97 | 96 | 97 | 96 | 96 | ||||
| 97 | 96 | 97 | 96 | 96 | 97 | 96 | 97 | 96 | 96 | 0.62 | |||
| 97 | 96 | 97 | 96 | 96 | 97 | 96 | 97 | 96 | 96 | ||||
| 97 | 96 | 97 | 96 | 96 | 97 | 96 | 97 | 96 | 96 | 0.62 | |||
| 97 | 96 | 97 | 96 | 96 | 97 | 96 | 97 | 96 | 96 | ||||
| 97 | 96 | 97 | 96 | 96 | 97 | 96 | 97 | 96 | 96 | 0.62 | |||
| 97 | 96 | 97 | 96 | 96 | 97 | 96 | 97 | 96 | 96 | ||||
| 97 | 96 | 97 | 96 | 96 | 97 | 96 | 97 | 96 | 96 | 0.62 | |||
| 97 | 96 | 97 | 96 | 96 | 97 | 96 | 97 | 96 | 96 | ||||
| 20 | 96 | 96 | 96 | 96 | 96 | 96 | 96 | 96 | 96 | 96 | 96.00 | 0.62 | 0.62 |
| 96 | 96 | 96 | 96 | 96 | 96 | 96 | 96 | 96 | 96 | ||||
| 96 | 96 | 96 | 96 | 96 | 96 | 96 | 96 | 96 | 96 | 0.62 | |||
| 96 | 96 | 96 | 96 | 96 | 96 | 96 | 96 | 96 | 96 | ||||
| 96 | 96 | 96 | 96 | 96 | 96 | 96 | 96 | 96 | 96 | 0.62 | |||
| 96 | 96 | 96 | 96 | 96 | 96 | 96 | 96 | 96 | 96 | ||||
| 96 | 96 | 96 | 96 | 96 | 96 | 96 | 96 | 96 | 96 | 0.62 | |||
| 96 | 96 | 96 | 96 | 96 | 96 | 96 | 96 | 96 | 96 | ||||
| 96 | 96 | 96 | 96 | 96 | 96 | 96 | 96 | 96 | 96 | 0.62 | |||
| 96 | 96 | 96 | 96 | 96 | 96 | 96 | 96 | 96 | 96 | ||||
| 24 | 1414 | 1449 | 1401 | 1507 | 1149 | 1414 | 1515 | 1421 | 1530 | 1136 | 1570.92 | 1.12 | 1.12 |
| 1000 | 1492 | 1421 | 1485 | 1470 | 1394 | 1492 | 1442 | 1530 | 1515 | ||||
| 1394 | 1492 | 1442 | 1507 | 1449 | 1207 | 1515 | 1421 | 1507 | 1449 | 1.12 | |||
| 933 | 1492 | 1442 | 1507 | 1492 | 1414 | 1515 | 1421 | 1530 | 1492 | ||||
| 925 | 1492 | 1421 | 1507 | 1449 | 1394 | 1515 | 1421 | 1507 | 1515 | 1.12 | |||
| 1414 | 1270 | 1421 | 1530 | 1470 | 1414 | 1515 | 1442 | 1530 | 1492 | ||||
| 1394 | 1492 | 1421 | 15074 | 1136 | 1414 | 1515 | 1463 | 1507 | 1449 | 1.25 | |||
| 1414 | 1492 | 1421 | 1530 | 1136 | 1414 | 1492 | 1421 | 1530 | 1515 | ||||
| 1394 | 1515 | 1442 | 1530 | 1470 | 1414 | 1515 | 1442 | 1507 | 1492 | 1.00 | |||
| 1414 | 1492 | 1421 | 1530 | 1515 | 1414 | 1515 | 1421 | 1507 | 1470 | ||||
| 48 | 2605 | 2605 | 2538 | 2538 | 2325 | 2605 | 2675 | 2605 | 2538 | 2325 | 2543.53 | 7.49 | 6.42 |
| 2605 | 2675 | 2538 | 2605 | 2380 | 2605 | 2675 | 2605 | 2605 | 2325 | ||||
| 2538 | 2605 | 2605 | 2538 | 2380 | 2605 | 2675 | 2538 | 2538 | 2380 | 7.24 | |||
| 2605 | 2675 | 2605 | 2538 | 2380 | 2538 | 2675 | 2605 | 2538 | 2380 | ||||
| 2538 | 2675 | 2605 | 2605 | 2380 | 2538 | 2675 | 2605 | 2538 | 2380 | 6.49 | |||
| 2605 | 2675 | 2538 | 2605 | 2380 | 2538 | 2675 | 2538 | 2605 | 2325 | ||||
| 2605 | 2675 | 2538 | 2538 | 2325 | 2605 | 2675 | 2605 | 2538 | 2325 | 5.99 | |||
| 2538 | 2675 | 2605 | 2605 | 2325 | 2538 | 2605 | 2605 | 2538 | 2325 | ||||
| 2605 | 2605 | 2605 | 2538 | 2380 | 2538 | 2605 | 2605 | 2538 | 2380 | 4.87 | |||
| 2538 | 2605 | 2538 | 2538 | 2325 | 2538 | 2675 | 2538 | 2605 | 2325 | ||||
| 72 | 2984 | 2887 | 2926 | 3031 | 3030 | 2984 | 2785 | 2926 | 3031 | 3030 | 2952.45 | 15.10 | 15.33 |
| 2984 | 2785 | 3015 | 2939 | 2941 | 2897 | 2785 | 2926 | 2939 | 2941 | ||||
| 2984 | 2887 | 3015 | 3031 | 2941 | 2984 | 2887 | 3015 | 2939 | 2941 | 16.10 | |||
| 3078 | 2887 | 3015 | 3031 | 2941 | 2894 | 2785 | 2926 | 2939 | 3030 | ||||
| 2984 | 2785 | 2926 | 2939 | 2941 | 2984 | 2887 | 3015 | 2939 | 3030 | 13.48 | |||
| 2984 | 2887 | 2926 | 2939 | 2941 | 2984 | 2887 | 3015 | 3031 | 2941 | ||||
| 2984 | 2785 | 3015 | 2939 | 3030 | 2984 | 2887 | 2926 | 3031 | 3030 | 16.35 | |||
| 2897 | 2887 | 3015 | 2939 | 3030 | 2984 | 2785 | 3015 | 3031 | 2941 | ||||
| 2897 | 2887 | 3015 | 2939 | 3030 | 3078 | 2887 | 3015 | 2939 | 3030 | 15.60 | |||
| 2984 | 2785 | 3015 | 3031 | 2941 | 2984 | 2785 | 3015 | 3031 | 2941 | ||||
| 120 | 3093 | 3161 | 3177 | 3177 | 3093 | 3193 | 3062 | 3177 | 3177 | 3093 | 3157.61 | 27.45 | 27.77 |
| 3193 | 3161 | 3177 | 3177 | 3093 | 3193 | 3161 | 3177 | 3177 | 3193 | ||||
| 3093 | 3062 | 3177 | 3177 | 3093 | 3193 | 3161 | 3078 | 3283 | 3093 | 28.07 | |||
| 3193 | 3161 | 3177 | 3177 | 3093 | 3193 | 3161 | 3177 | 3283 | 3193 | ||||
| 3093 | 3062 | 3078 | 3283 | 3093 | 3193 | 3161 | 3078 | 3177 | 3093 | 27.45 | |||
| 3093 | 3161 | 3078 | 3177 | 3193 | 3193 | 3161 | 3177 | 3177 | 3193 | ||||
| 3193 | 3161 | 3078 | 3177 | 3193 | 3193 | 3161 | 3078 | 3283 | 3093 | 28.07 | |||
| 3193 | 3161 | 3078 | 3283 | 3093 | 3093 | 3161 | 3177 | 3177 | 3193 | ||||
| 3093 | 3161 | 3177 | 3177 | 3093 | 3193 | 3161 | 3177 | 3177 | 3193 | 27.83 | |||
| 3193 | 3161 | 3177 | 3177 | 3193 | 3193 | 3161 | 3078 | 3177 | 3193 | ||||
| 168 | 3316 | 3300 | 3266 | 3316 | 3209 | 3316 | 3193 | 3379 | 3316 | 3209 | 3321.93 | 32.57 | 33.54 |
| 3316 | 3193 | 3378 | 3316 | 3316 | 3431 | 3300 | 3379 | 3316 | 3316 | ||||
| 3316 | 3300 | 3379 | 3316 | 3209 | 3431 | 3300 | 3379 | 3316 | 3209 | 33.94 | |||
| 3316 | 3193 | 3379 | 3316 | 3316 | 3431 | 3300 | 3266 | 3316 | 3316 | ||||
| 3431 | 3300 | 3379 | 3316 | 3316 | 3431 | 3300 | 3379 | 3431 | 3316 | 33.69 | |||
| 3431 | 3300 | 3379 | 3316 | 3209 | 3431 | 3413 | 3266 | 3431 | 3209 | ||||
| 3316 | 3300 | 3379 | 3316 | 3209 | 3316 | 3300 | 3379 | 3431 | 3316 | 33.94 | |||
| 3316 | 3300 | 3379 | 3316 | 3209 | 3316 | 3300 | 3379 | 3431 | 3209 | ||||
| 3316 | 3300 | 3266 | 3431 | 3316 | 3316 | 3300 | 3266 | 3316 | 3316 | 33.57 | |||
| 3316 | 3300 | 3379 | 3431 | 3316 | 3431 | 3300 | 3266 | 3316 | 3209 | ||||
| 360 | 3500 | 3431 | 3431 | 3500 | 3553 | 3431 | 3500 | 3431 | 3431 | 3379 | 3474.60 | 36.06 | 34.15 |
| 3500 | 3553 | 3431 | 3500 | 3553 | 3431 | 3500 | 3553 | 3431 | 3500 | ||||
| 3500 | 3431 | 3431 | 3500 | 3553 | 3316 | 3500 | 3431 | 3431 | 3553 | 33.94 | |||
| 3500 | 3431 | 3431 | 3500 | 3553 | 3431 | 3379 | 3553 | 3316 | 3553 | ||||
| 3500 | 3553 | 3431 | 3500 | 3431 | 3431 | 3500 | 3553 | 3431 | 3431 | 32.44 | |||
| 3500 | 3431 | 3431 | 3500 | 3553 | 3431 | 3500 | 3553 | 3431 | 3553 | ||||
| 672 | 3316 | 3431 | 3448 | 3431 | 3431 | 3571 | 3316 | 3431 | 3448 | 3431 | 3455.70 | 39.55 | 34.19 |
| 3431 | 3431 | 3571 | 3431 | 3553 | 3448 | 3316 | 3553 | 3571 | 3431 | ||||
| 3431 | 3431 | 3571 | 3431 | 3553 | 3571 | 3431 | 3431 | 3448 | 3431 | 31.44 | |||
| 3316 | 3431 | 3448 | 3431 | 3431 | 3448 | 3431 | 3553 | 3448 | 3431 | ||||
| 3431 | 3431 | 3448 | 3431 | 3553 | 3448 | 3316 | 3431 | 3448 | 3448 | 31.57 | |||
| 3431 | 3431 | 3571 | 3431 | 3431 | 3571 | 3431 | 3431 | 3571 | 3571 | ||||
© 2020 by the authors. Licensee MDPI, Basel, Switzerland. This article is an open access article distributed under the terms and conditions of the Creative Commons Attribution (CC BY) license (http://creativecommons.org/licenses/by/4.0/).
Share and Cite
Hong, S.; Yoon, S.; Kim, J.; Lee, C.; Kim, S.; Lee, Y. Evaluation of Condition of Concrete Structures Using Ultrasonic Pulse Velocity Method. Appl. Sci. 2020, 10, 706. https://doi.org/10.3390/app10020706
Hong S, Yoon S, Kim J, Lee C, Kim S, Lee Y. Evaluation of Condition of Concrete Structures Using Ultrasonic Pulse Velocity Method. Applied Sciences. 2020; 10(2):706. https://doi.org/10.3390/app10020706
Chicago/Turabian StyleHong, Seonguk, Sangki Yoon, Jonghyun Kim, Changjong Lee, Seunghun Kim, and Yongtaeg Lee. 2020. "Evaluation of Condition of Concrete Structures Using Ultrasonic Pulse Velocity Method" Applied Sciences 10, no. 2: 706. https://doi.org/10.3390/app10020706
APA StyleHong, S., Yoon, S., Kim, J., Lee, C., Kim, S., & Lee, Y. (2020). Evaluation of Condition of Concrete Structures Using Ultrasonic Pulse Velocity Method. Applied Sciences, 10(2), 706. https://doi.org/10.3390/app10020706