1. Introduction
Engineers are familiar with formulations written down in codes and technical handbooks that are used to solve geotechnical issues, however, they do not often have the opportunity to contrast their predictions, therefore the risk of using that formulation is not properly assessed.
Safety factor design methods are based in evaluating the uncertainty of any input introduces on the calculation. One of these inputs is the verification equation. It is usually named model uncertainty.
This paper is a practical case where a particular geotechnical formulation is addressed in order to obtain an insight on its uncertainty and to know how to reduce it properly using the outputs of the site investigation. The formulation case is the laterally loaded piles in sand deposits. The piles were installed and tested recently in a new industrial facility in the Persian Gulf.
Land reclamations are frequent constructions at Persian Gulf, close to the shores of the Arabic Peninsula. For this study case, after building a 4-Ha land reclamation on shallow sea waters, the new platform was tested with an extensive soil investigation. On the platform, four (4) metallic tubular piles were driven and tested by static lateral loads.
In this paper, the load test records are compared to the predicted displacement from the site investigation using well-known formulation based mainly on SPT test [
1,
2]. The analytical methods used are the p-y curve method developed by the API (American Petroleum Institute) [
3] and the horizontal ballast modules methods obtained from the deformation modulus, as proposed on several codes.
The uncertainty of the API and horizontal ballast method is obtained by comparing predicted and measured deflections.
2. Site Geology
Persian Gulf shoreline is on the edge of the deep sedimentary basin that forms the Arabian Peninsula, and is underlain by a considerable thickness of sedimentary rocks. Relatively young deposits of the Dibdibba formation (Upper Miocene to Pleistocene Epochs, approximately 2 to 10 million years old) outcrops at the surface. These deposits are underlain at depth by the Dammam formation (Upper Eocene Epoch, approximately 38 to 42 million years old).
The Dibdibba formation typically consists of siliceous sands and gravels, with varying amounts of silt and some thin clay and gypsum bands. Cementation is only partial and relatively poor, consisting of calcium carbonate and gypsum.
After dredging and removing other more recent marine deposits, Dibdibba formation was used to build the 4Ha land reclamation. At the same time, Dibdibba formation was also the foundation of this land reclamation.
The land reclamation fill was formed by sand or silty sand placed below the water. The deposit thickness was about 20 m, and it was generated by hydraulic method—plumping sand mixed with water, and then compacted with vibrocompaction [
4,
5].
Therefore, a very thick deposit of granular material, partially natural and partially man-made was generated. The tests described in this paper mainly affect the man-made fill and the upper part of the natural Dibdibba formation.
3. Geotechnical Conditions of the Tested Ground
The tested fill is described as a 20 m thick deposit formed by hydraulic methods below water. It is made of siliceous sands with fine percentage (pass through·#200 ASTM) lower than 20%. The material is described as a well graduated sand or silty sand where the medium-sized predominates. They are mostly rounded, with a silty fraction and sporadically some gravel.
The technical specifications of the material used for the filling are summarized in the following
Table 1.
After the discharge, the material was compacted by deep vibrocompaction in a 2.5 × 2.5 m mesh. The operation is controlled until it is densified up to 90% of its maximum dry density.
On top of the hydraulic fill, an additional 3 m engineering fill was built. It was made of the same granular material but placed by compacted 25 cm thick layers. Compaction was carried out up to 95% maximum dry density.
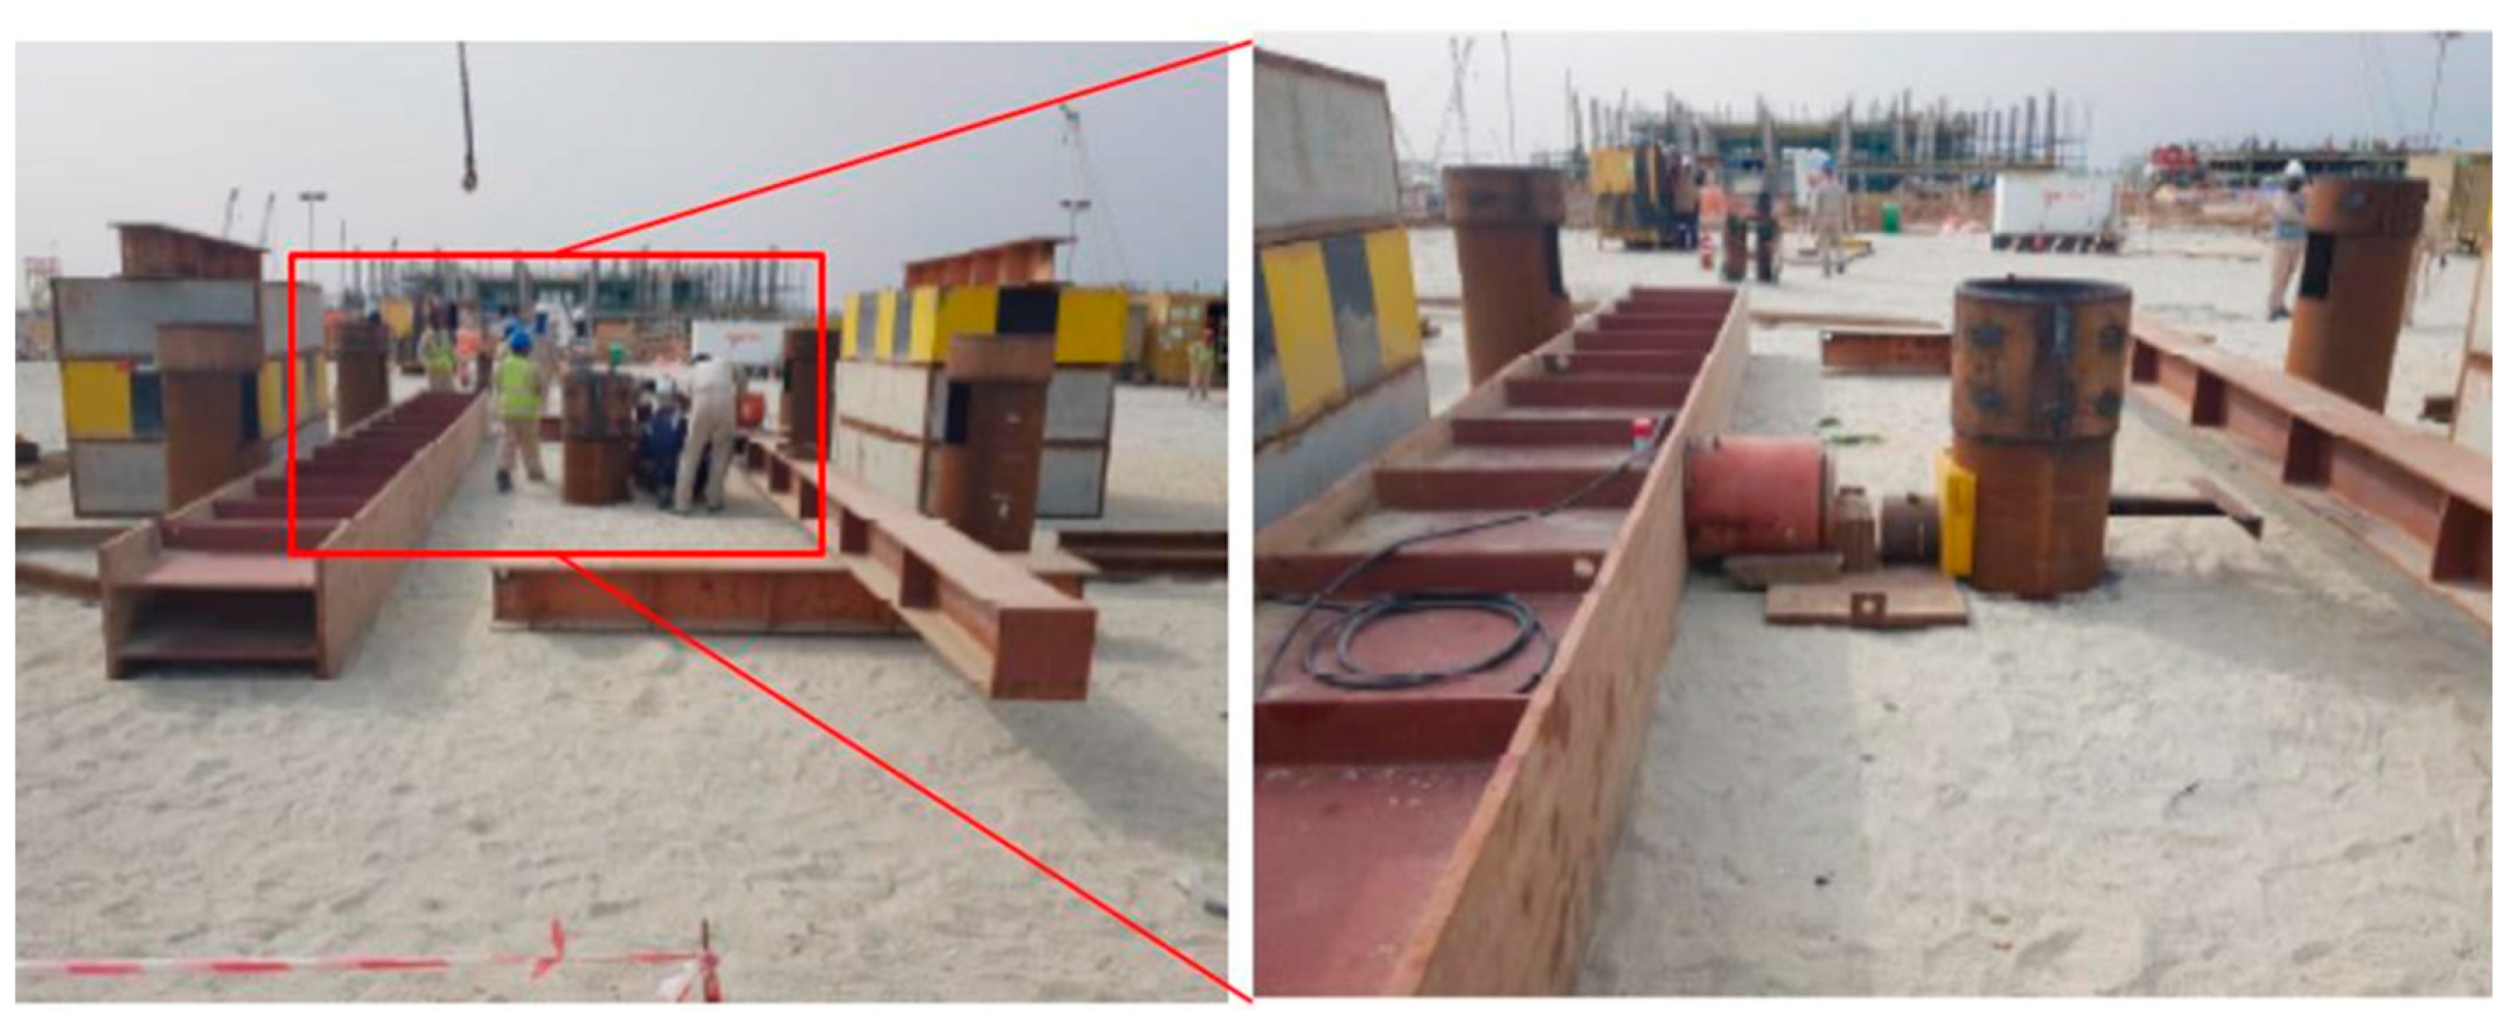
On this platform metallic tubular piles were driven by percussion. The piles were 609.6 mm diameter and 23 m long. The piles were tested by lateral loads. The
Figure 1 shows an example where the test arrangement can be appreciated. It is also shown the texture of the platform material where tests were performed.
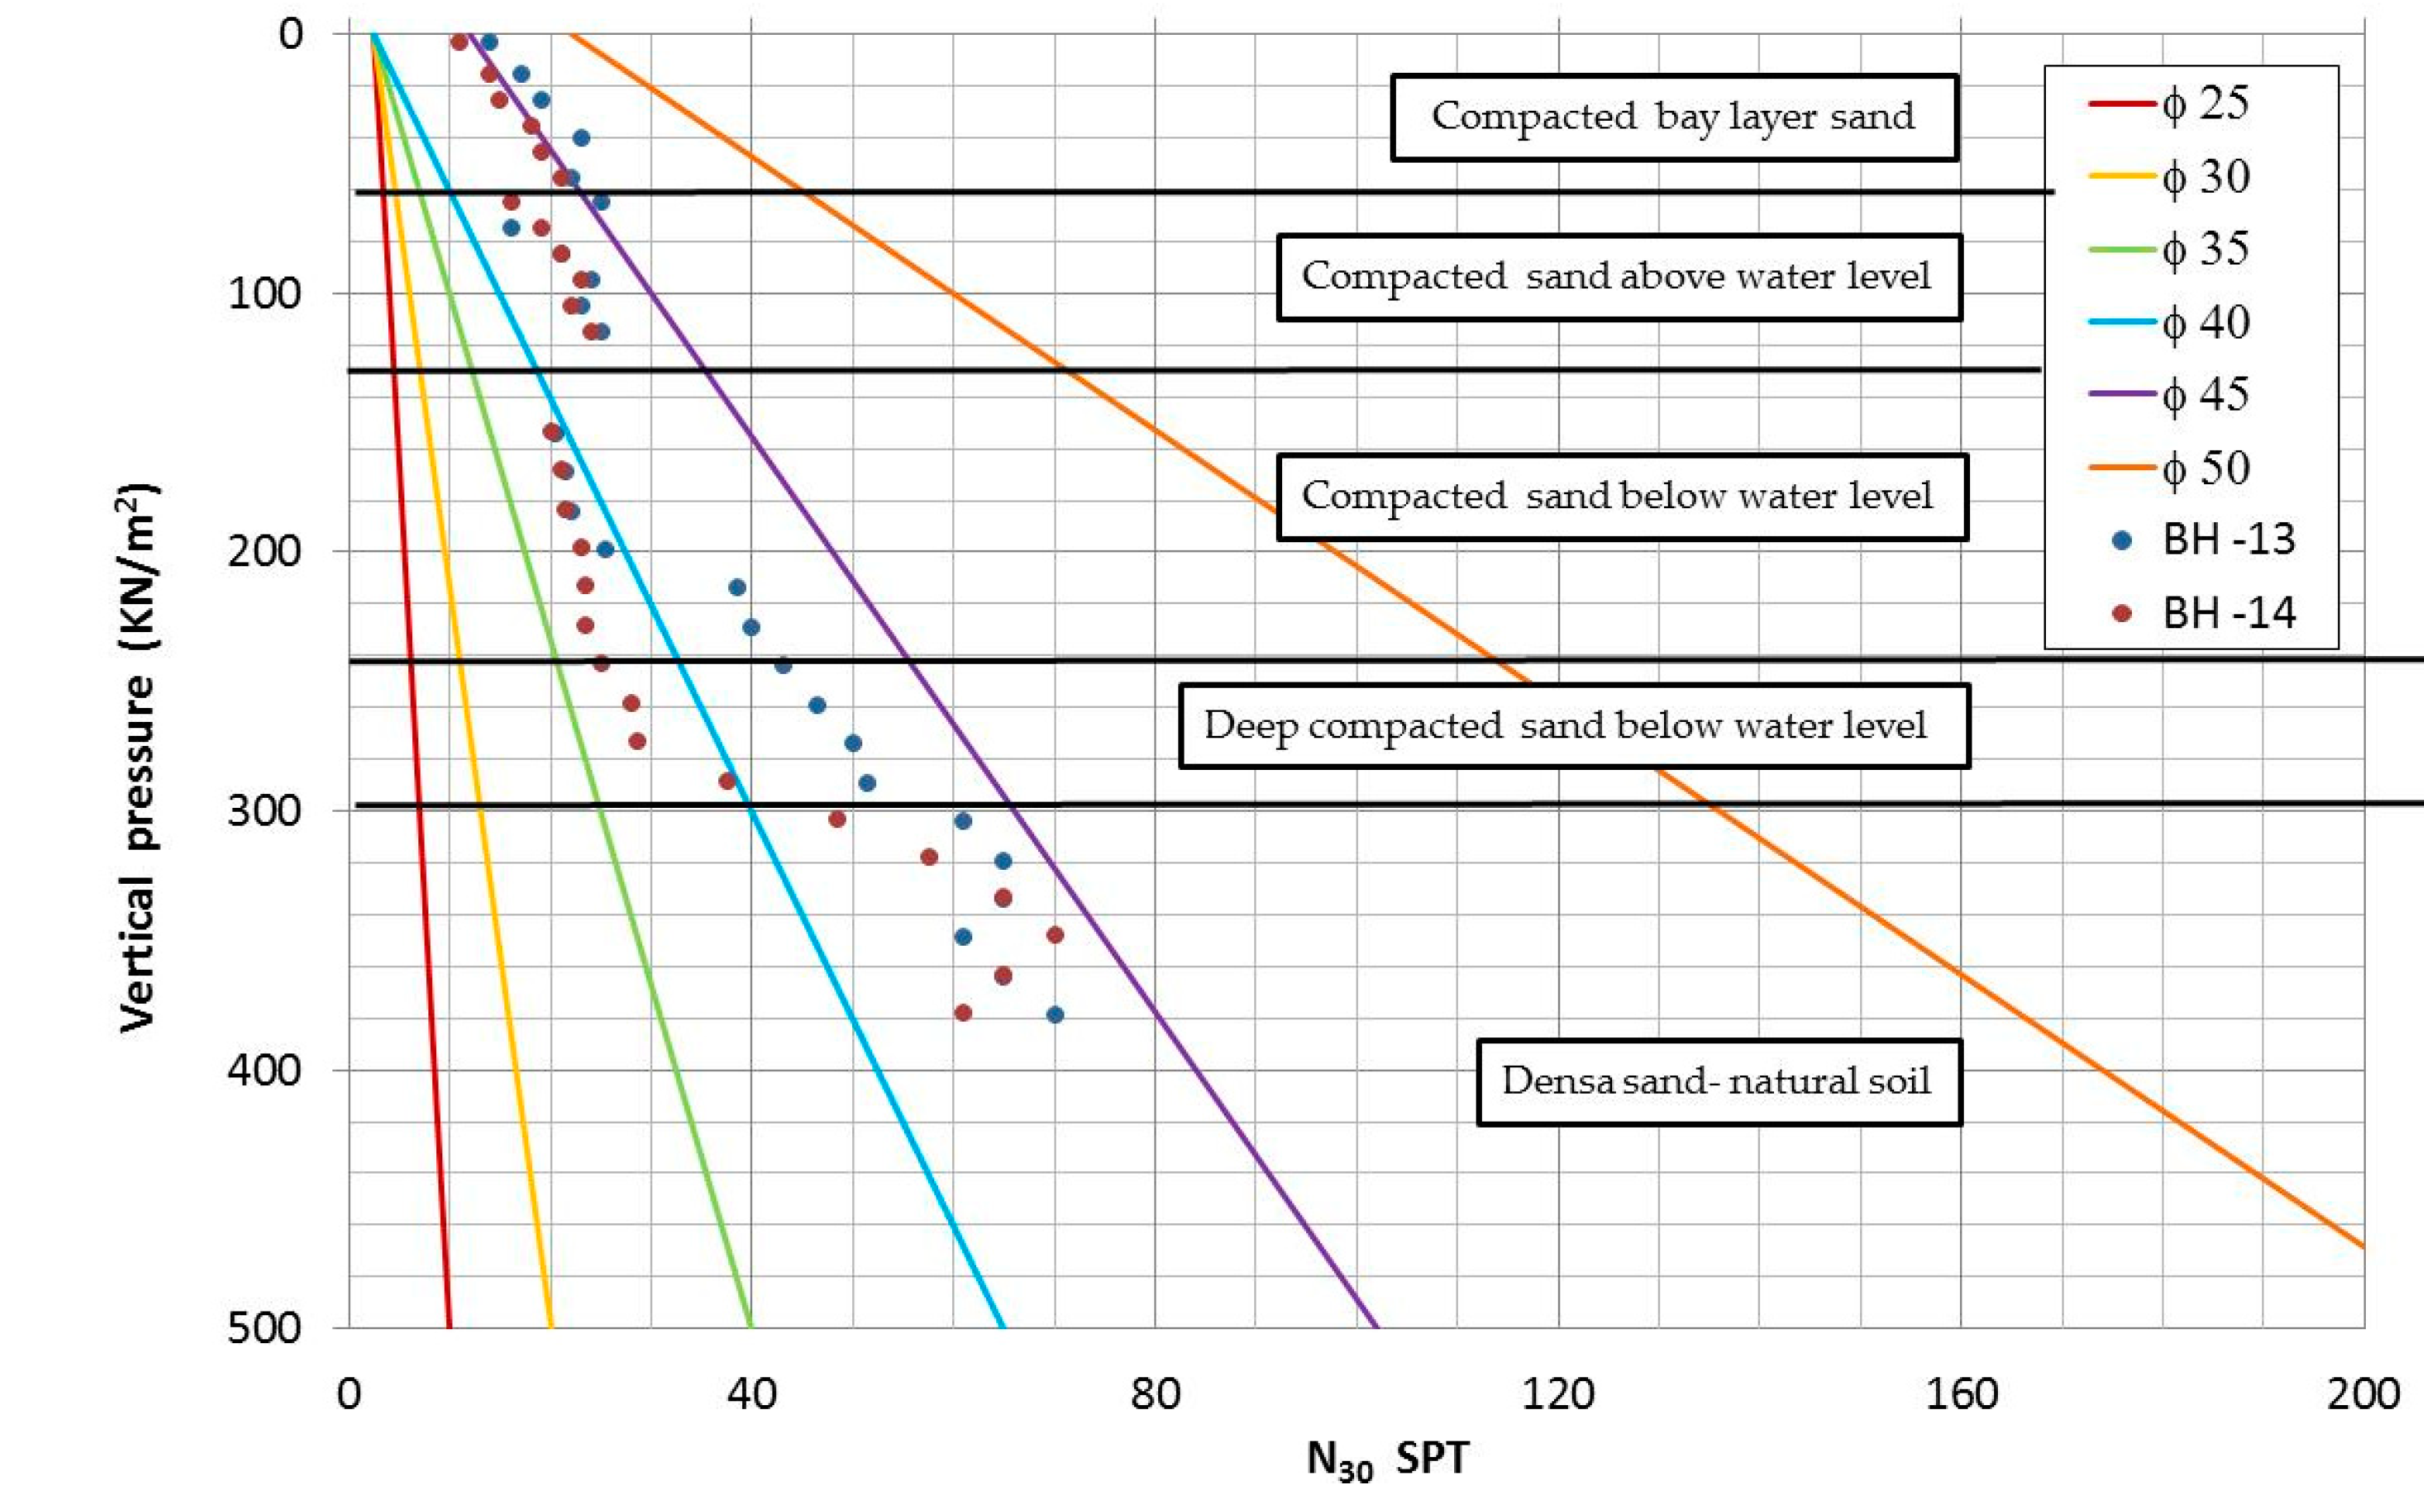
Close to the tested piles, two boreholes with
SPT each meter and one CPT were carried out. The
SPT indexes are presented in the following
Figure 2 and
Figure 3.
SPTs have been corrected exclusive with the energy factor and with the correction by groundwater level (Equation (1)).
Water level was connected to the sea level. It was at a depth of 7.0 m below working platform. Tide rise at that sea is below half a meter, so that water level inside the land reclamation can be considered constant.
The
Figure 2 below shows the available
SPT indexes with respect to the effective pressure at vertical axil. Soil layers are included, defining which are above and below water level. The chart also includes the framework proposed by Sousa [
6], by which internal friction angle of a granular material depends on vertical effective stress and
SPT index.
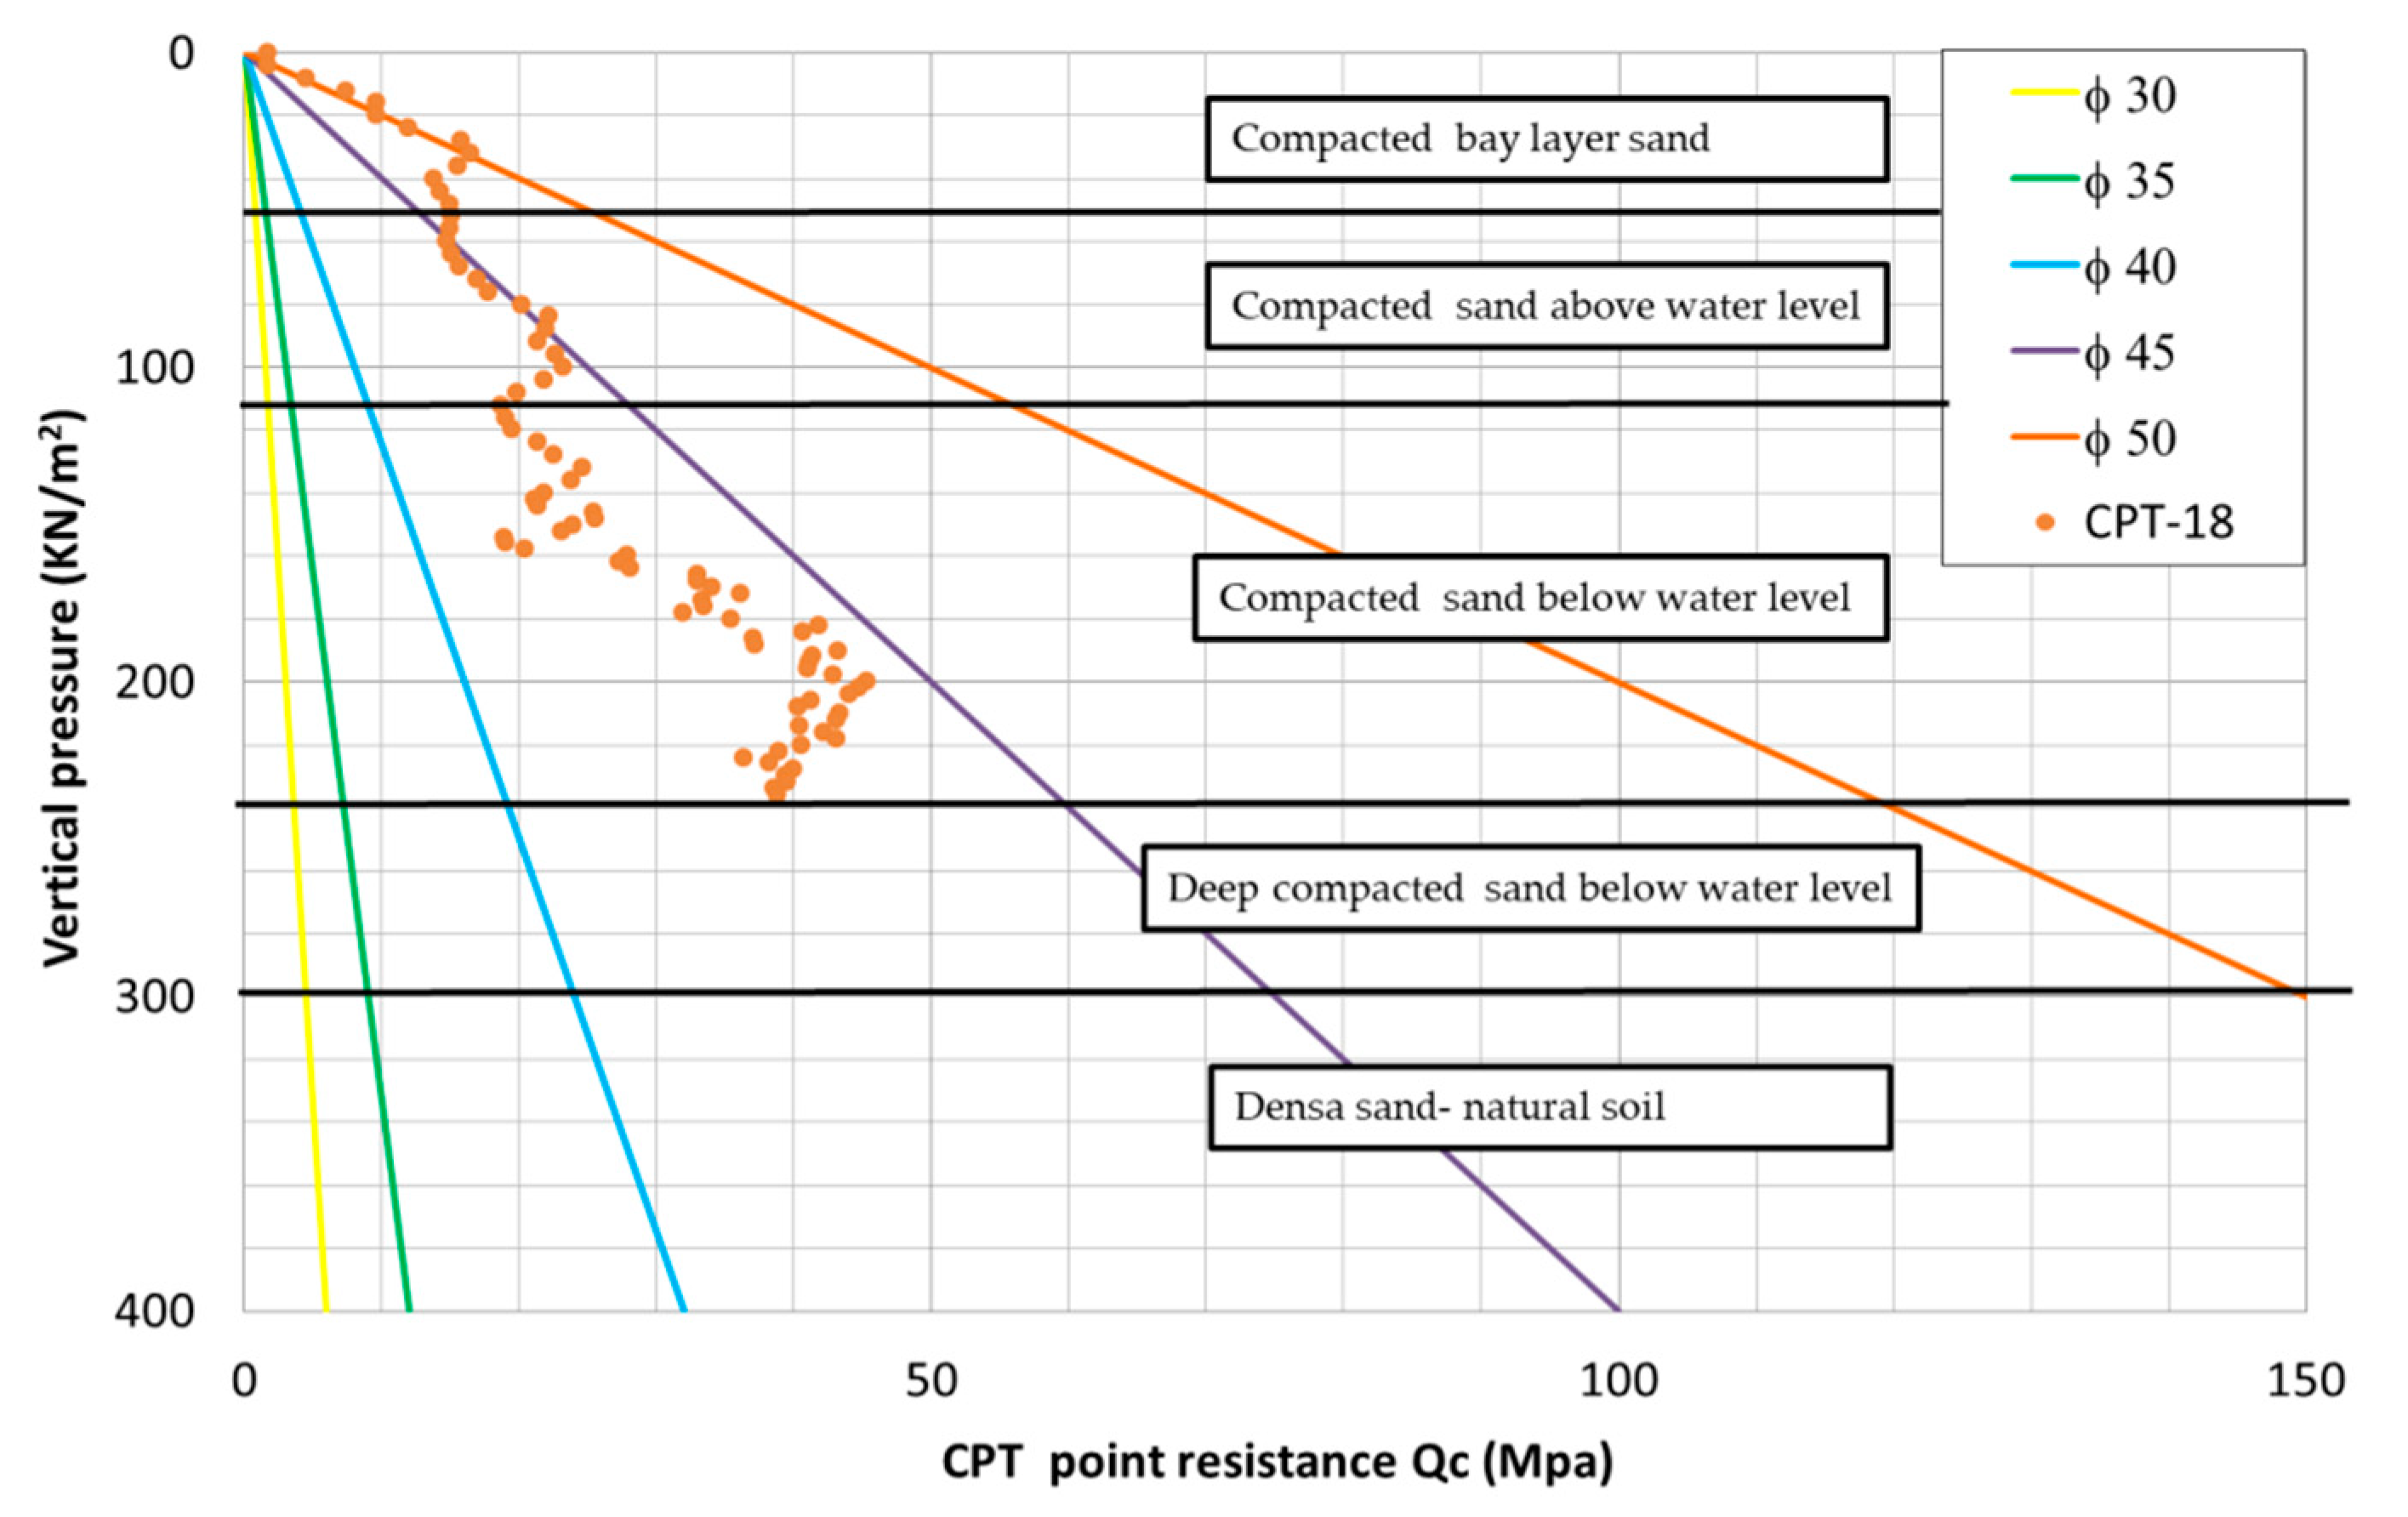
The CPT records are also presented within the framework of interpretation of the values of the angle of internal friction given by the abacus of Robertson & Campanela (1983) (
Figure 3) [
1].
4. Laterally Load Test Records
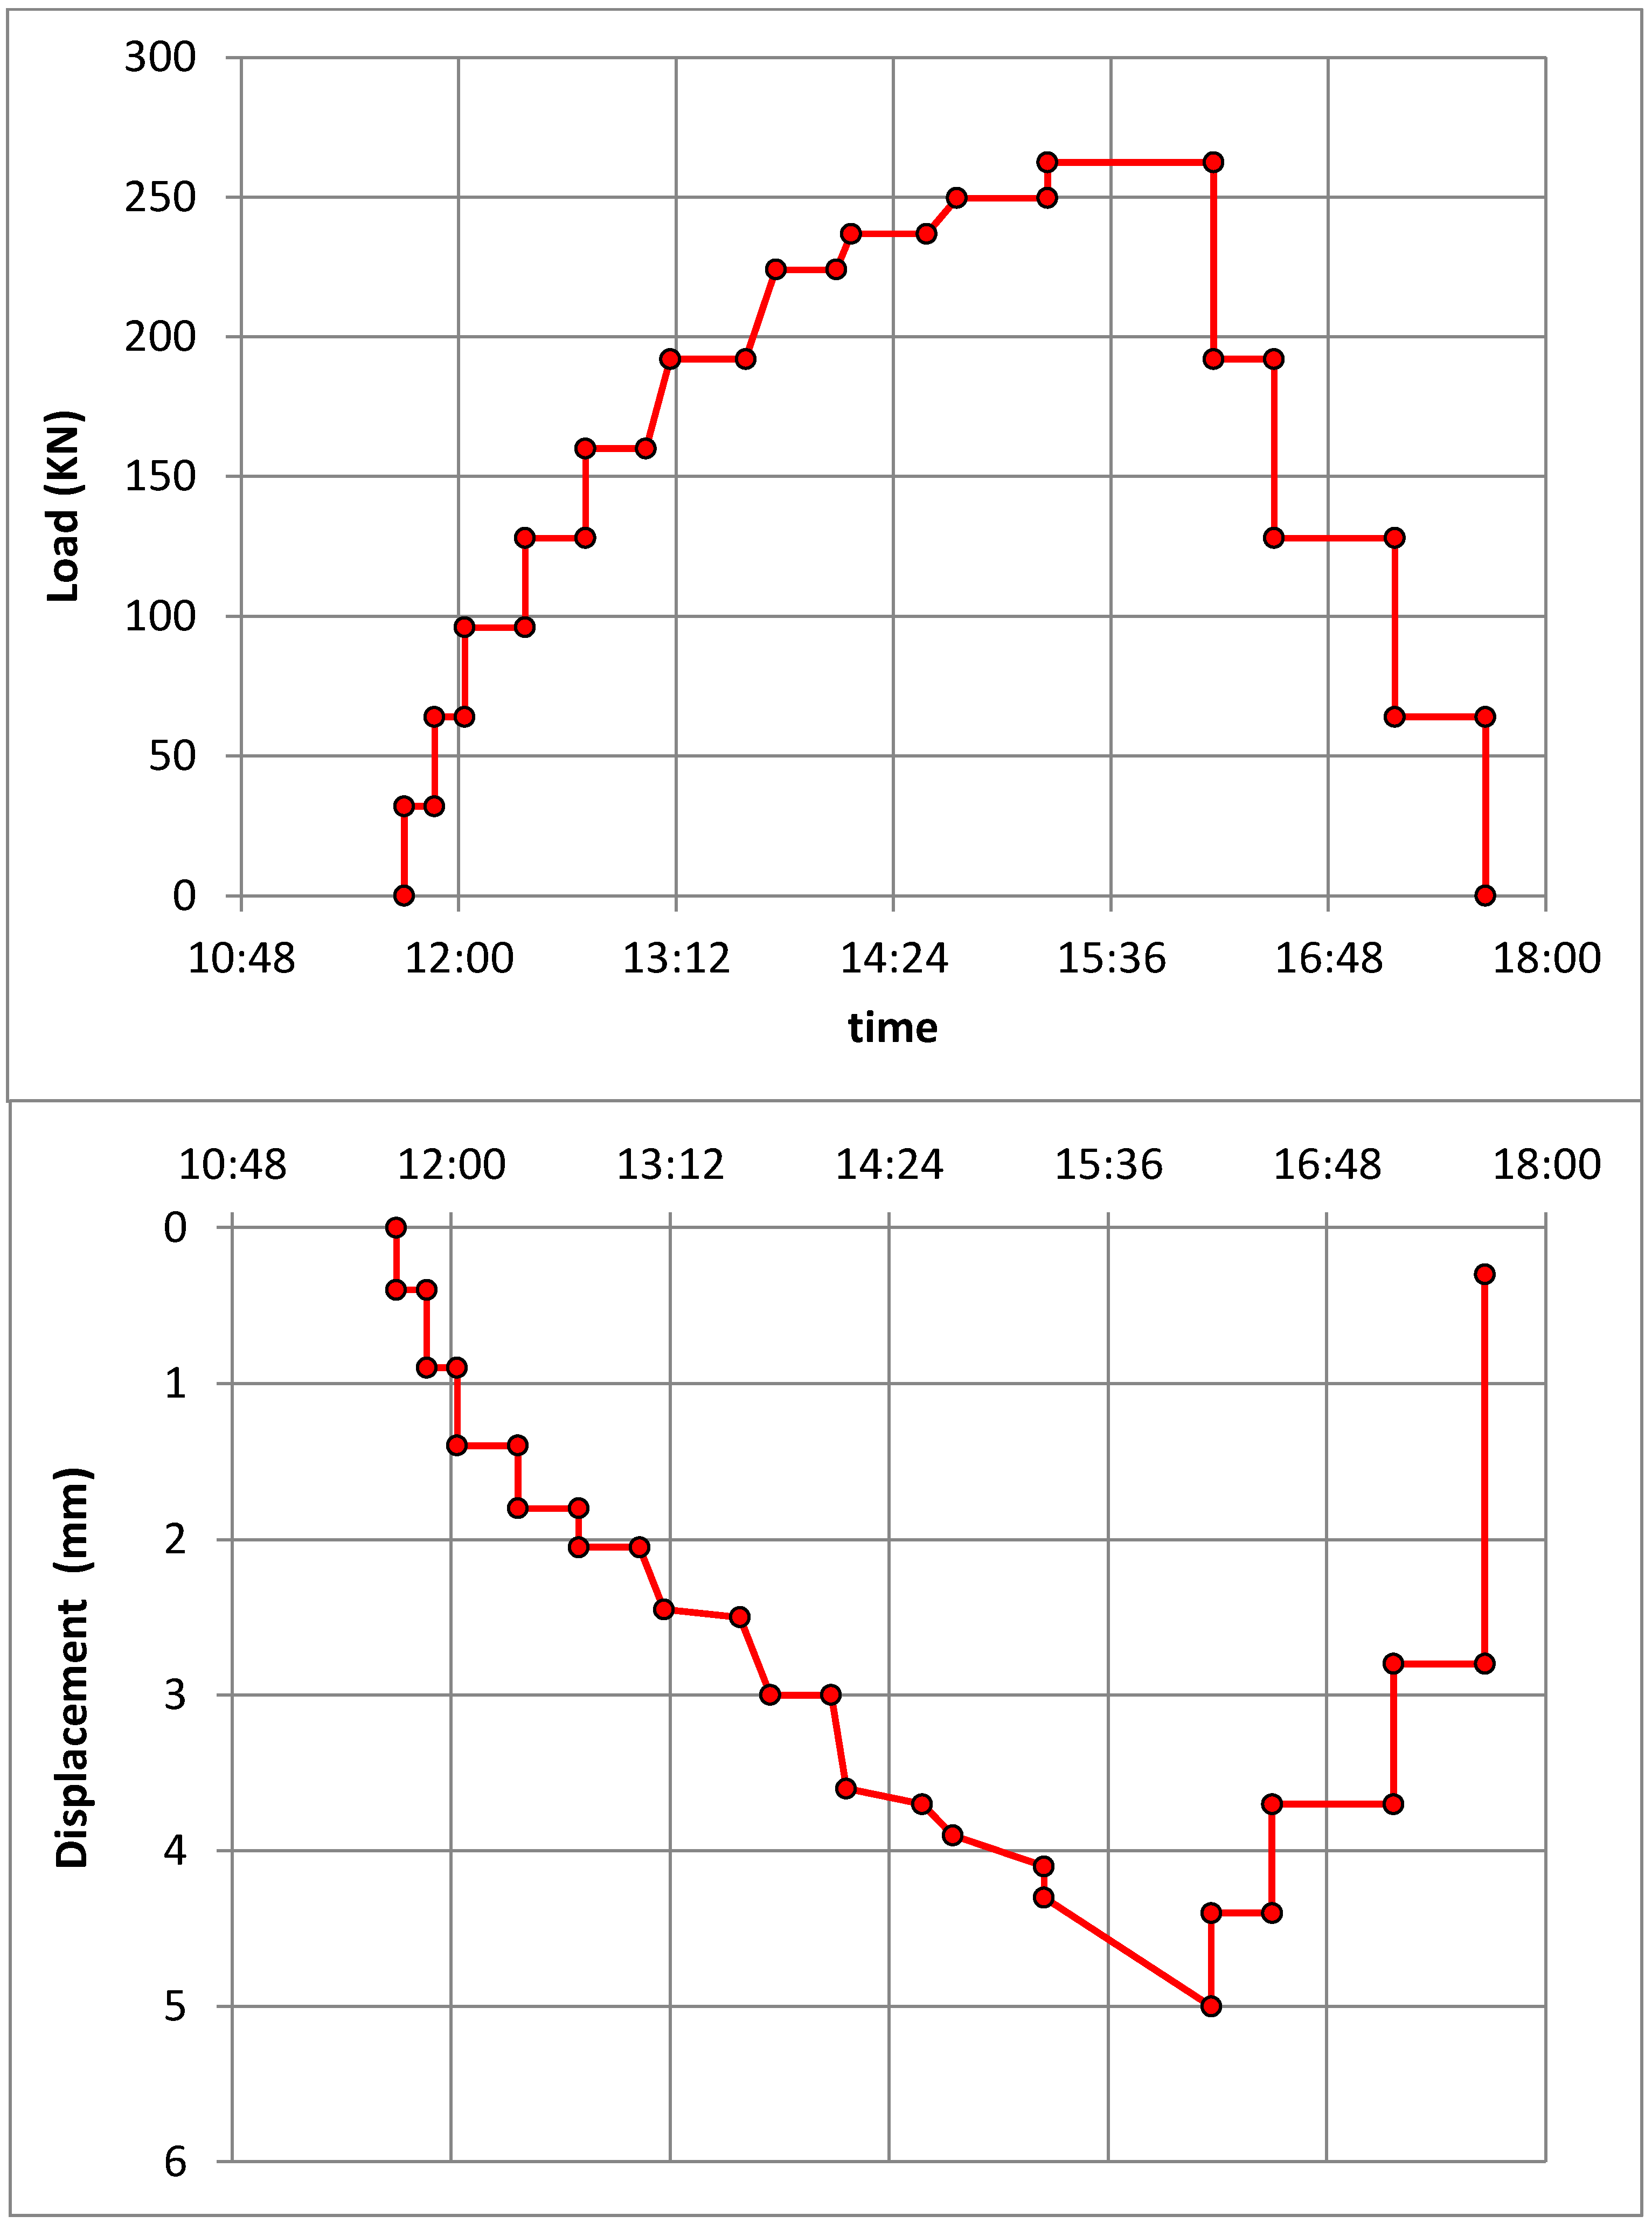
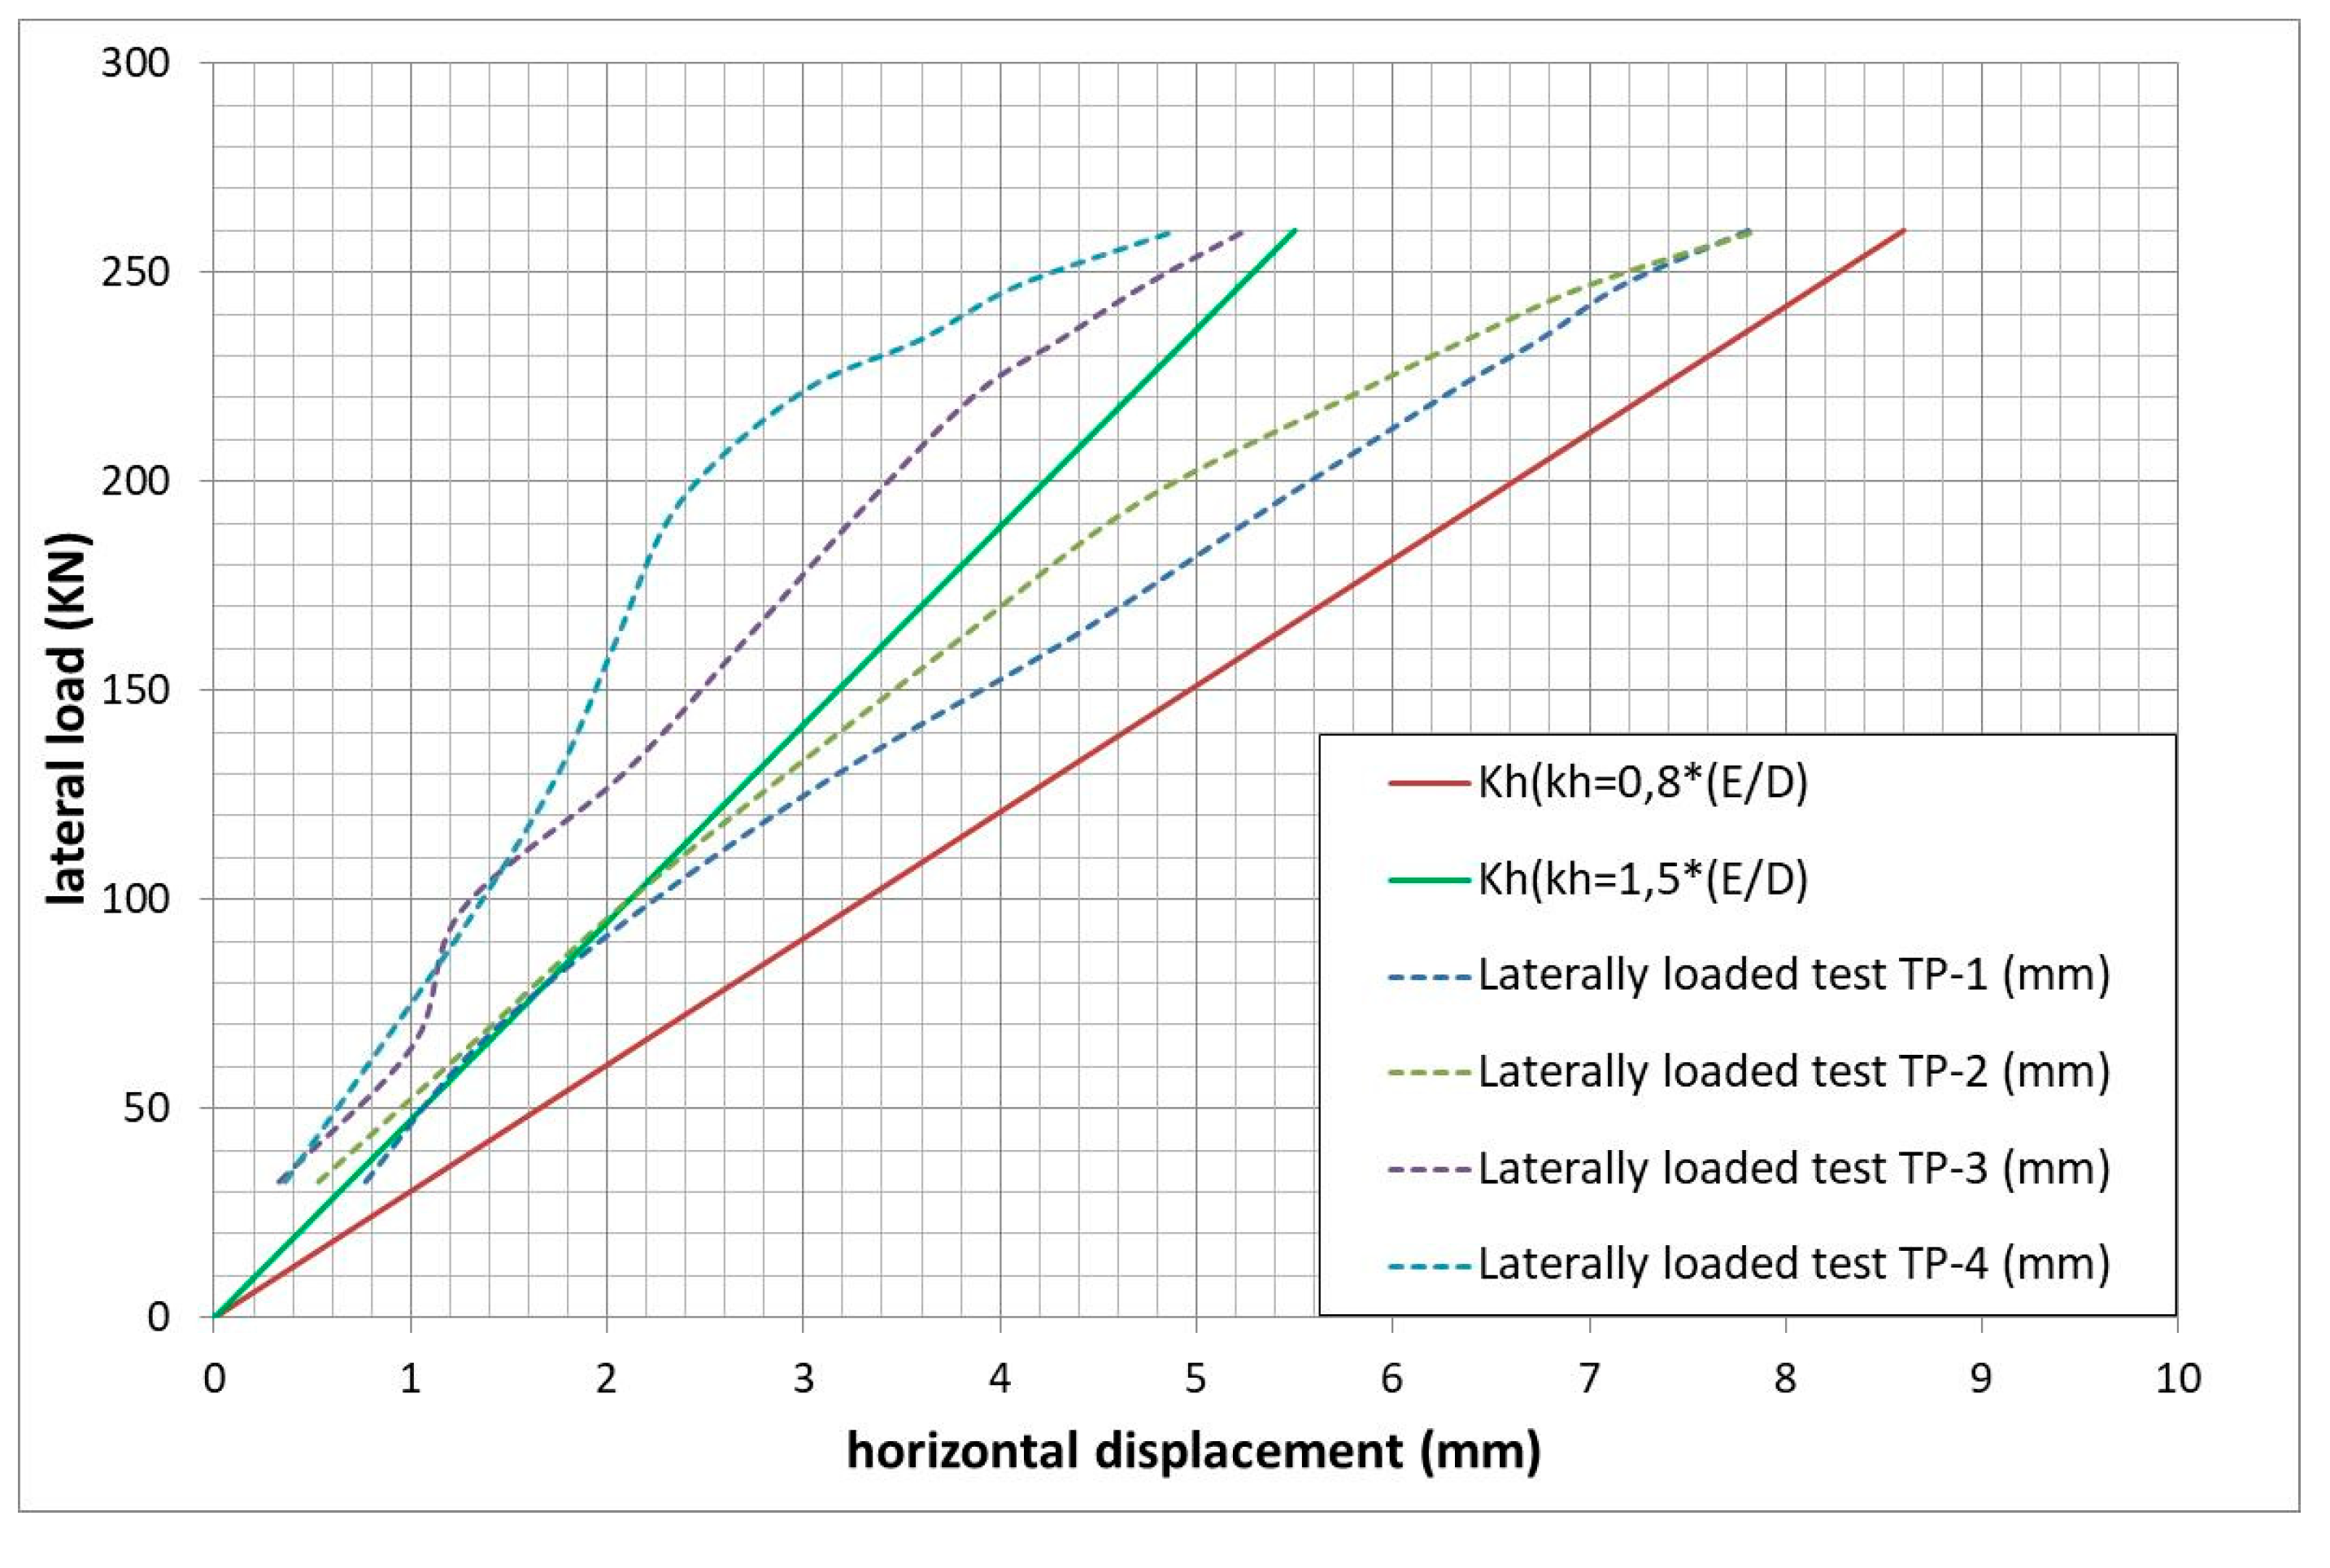
Four lateral load tests on 609 mm diameter, 12 mm thick, metallic tubular piles have been carried out. The piles were driven to a depth of 23 m. The load was applied at the top of the pile, up to 260 KN, on 10 steps. Each step was 32.5 KN and it was kept by 30 min before to apply the next step. A representative graph of these tests is shown in the following
Figure 4.
This behavior has been studied by Brown, et al. (1988) and by Cox, et al. (1974) [
7,
8]. The recorded data for the four tests are shown in
Figure 5. The horizontal displacements at the top are represented against the applied load.
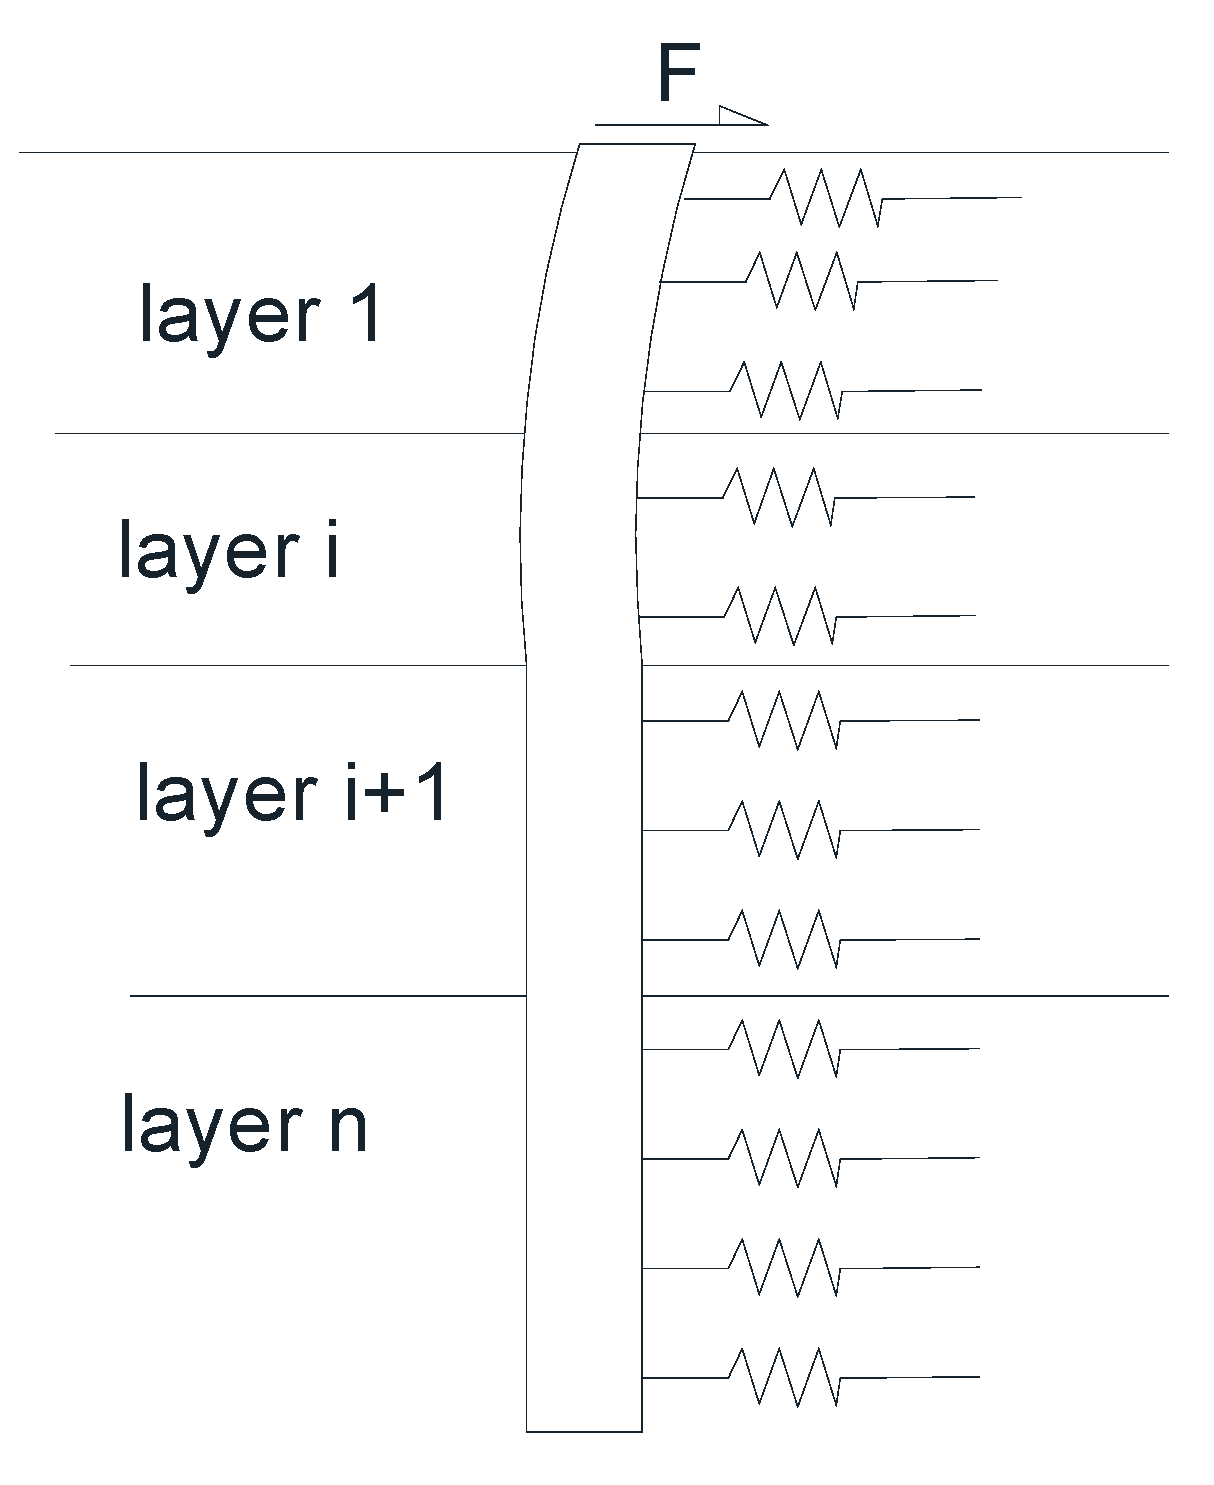
5. Formulations for Isolated Piles Undergoing Horizontal Load
Two different formulations have been used to predict the horizontal movements of the piles subjected to lateral load. Both of them are based on spring models subjected to lateral horizontal tension (
Figure 6).
The models used are:
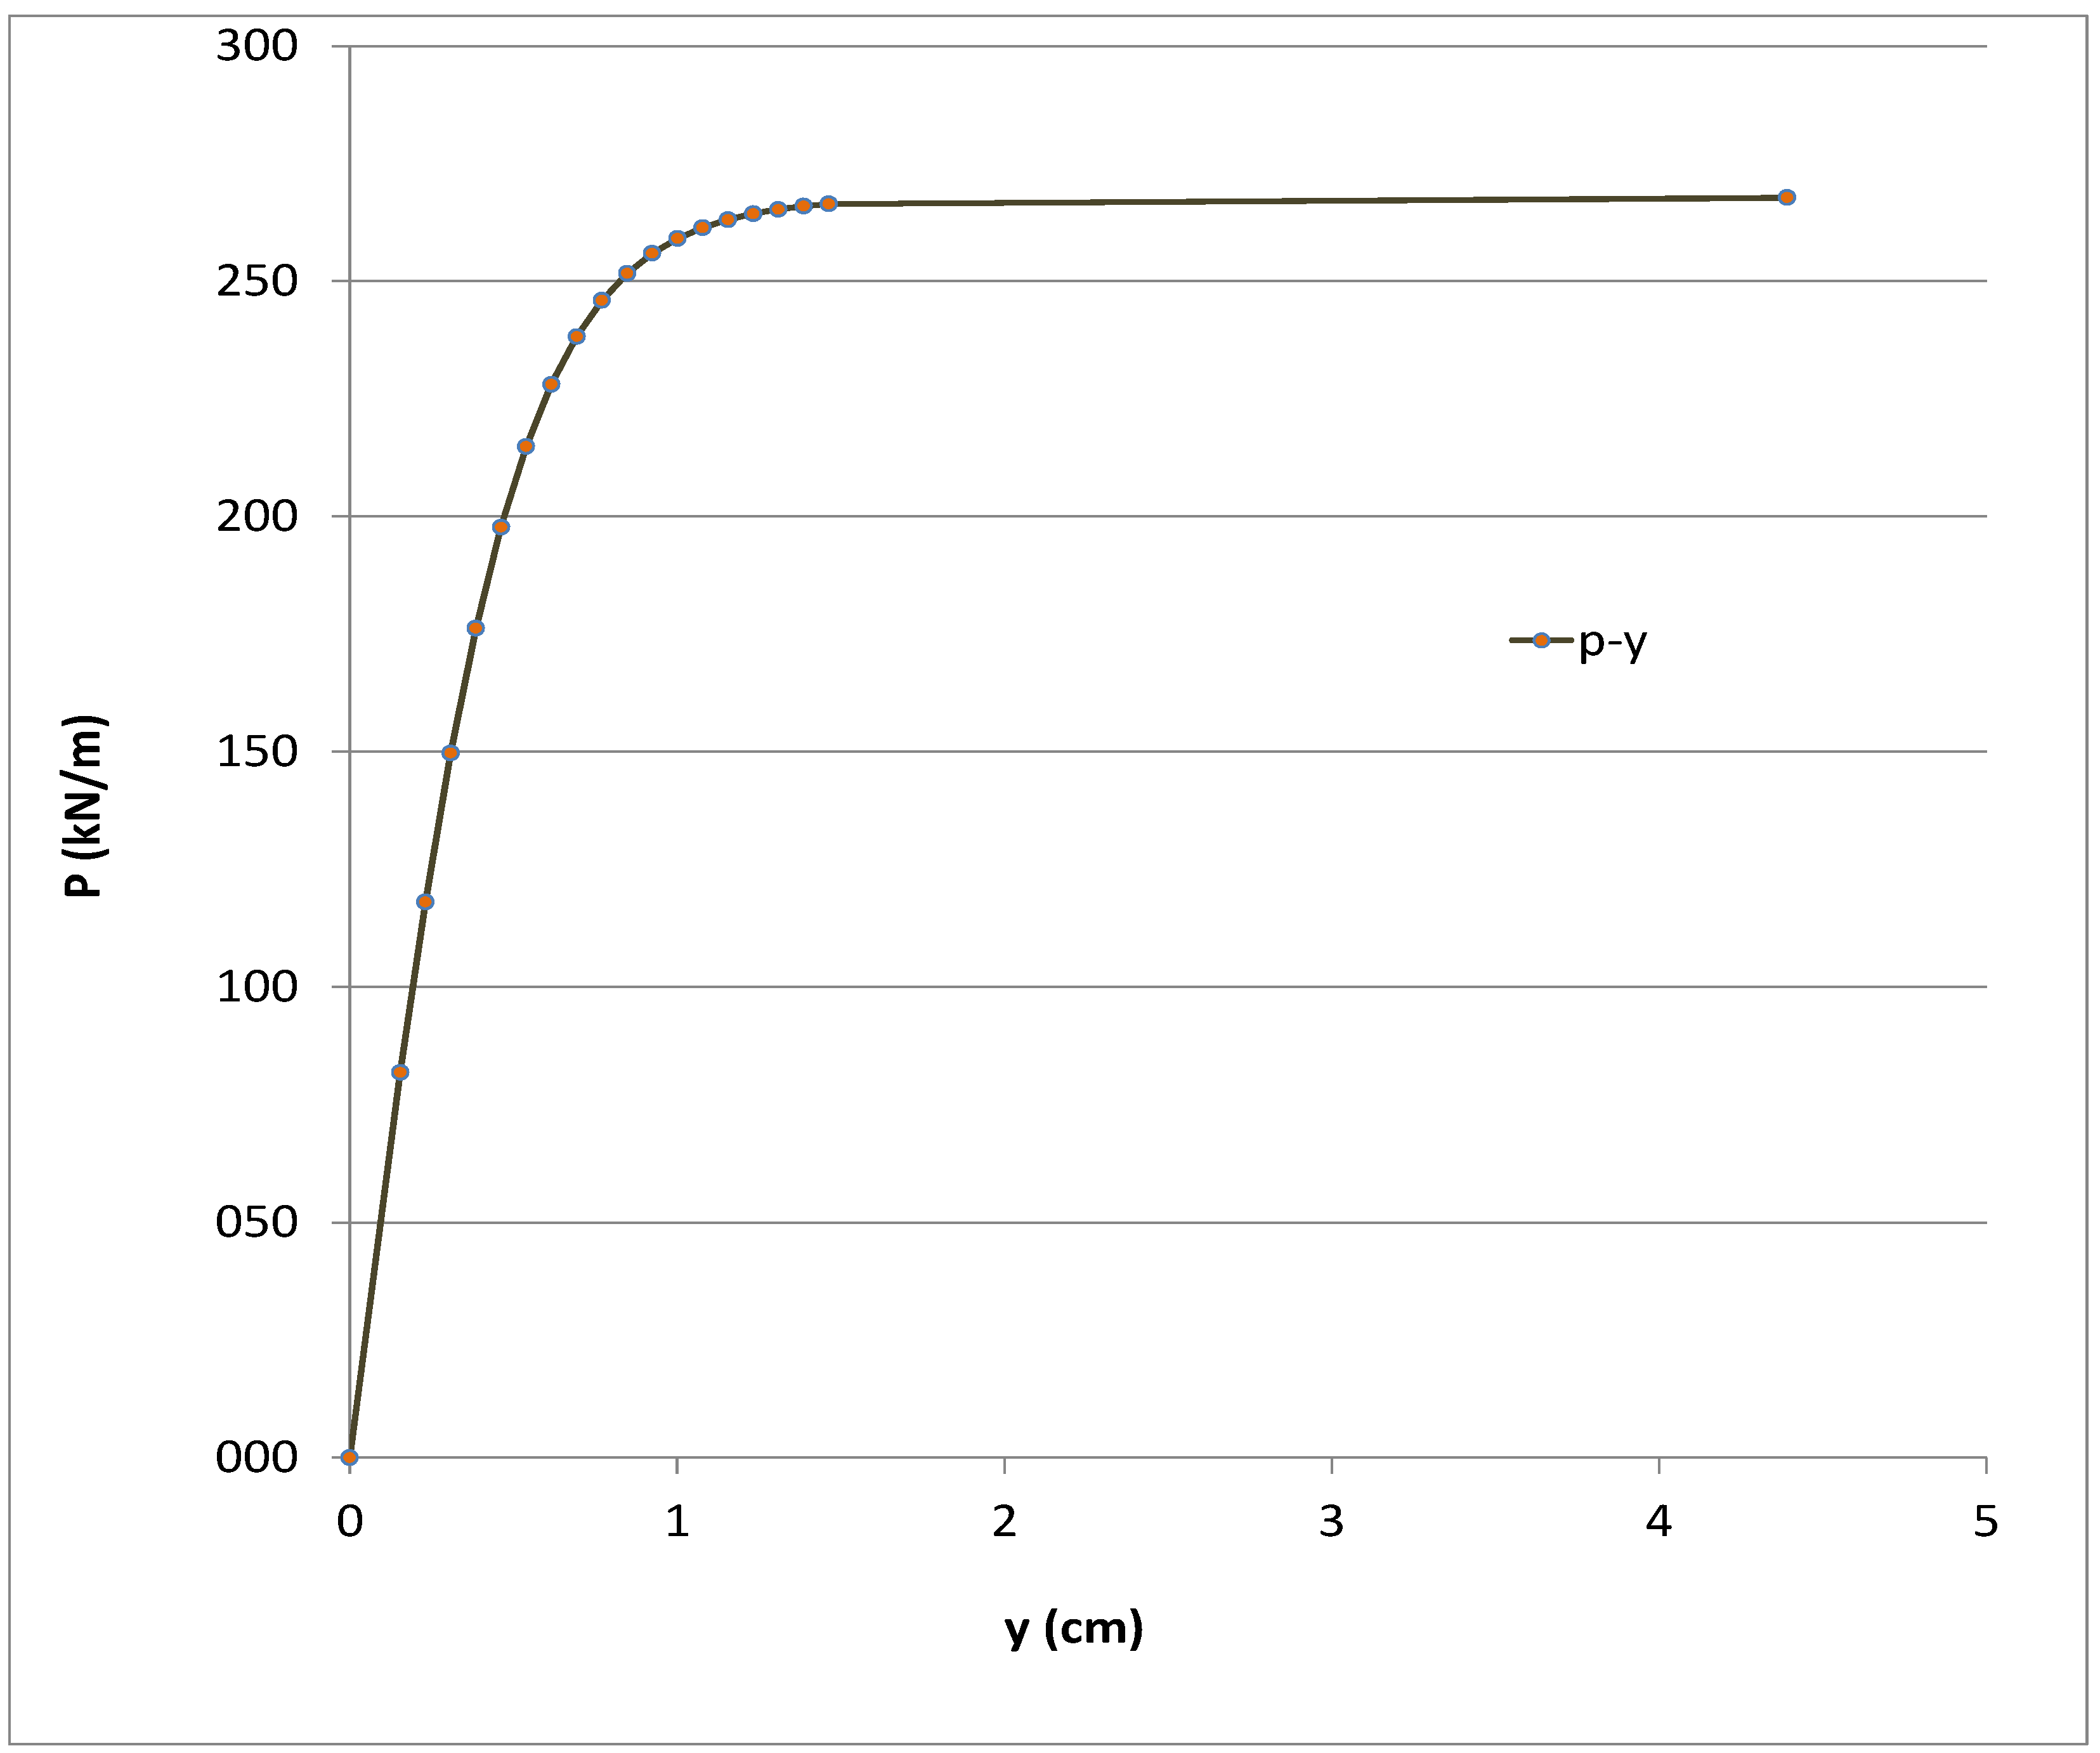
5.1. P-Y Model
The first method is the one collected in the API “Geotechnical and Foundation Design Consideration GEO2”. In this formulation, the relation between pressure and displacement is given by the relation (Equation (2)):
where:
p: force per lineal vertical meter of the pile at the spring position;
y: extension and shortening of the spring;
A: value coefficient;
k: value of the initial ballast module;
pu: ultimate force per vertical lineal meter at spring position.
z: depth of the spring;
D: diameter of the pile.
A curve model is shown in the figure below (
Figure 7).
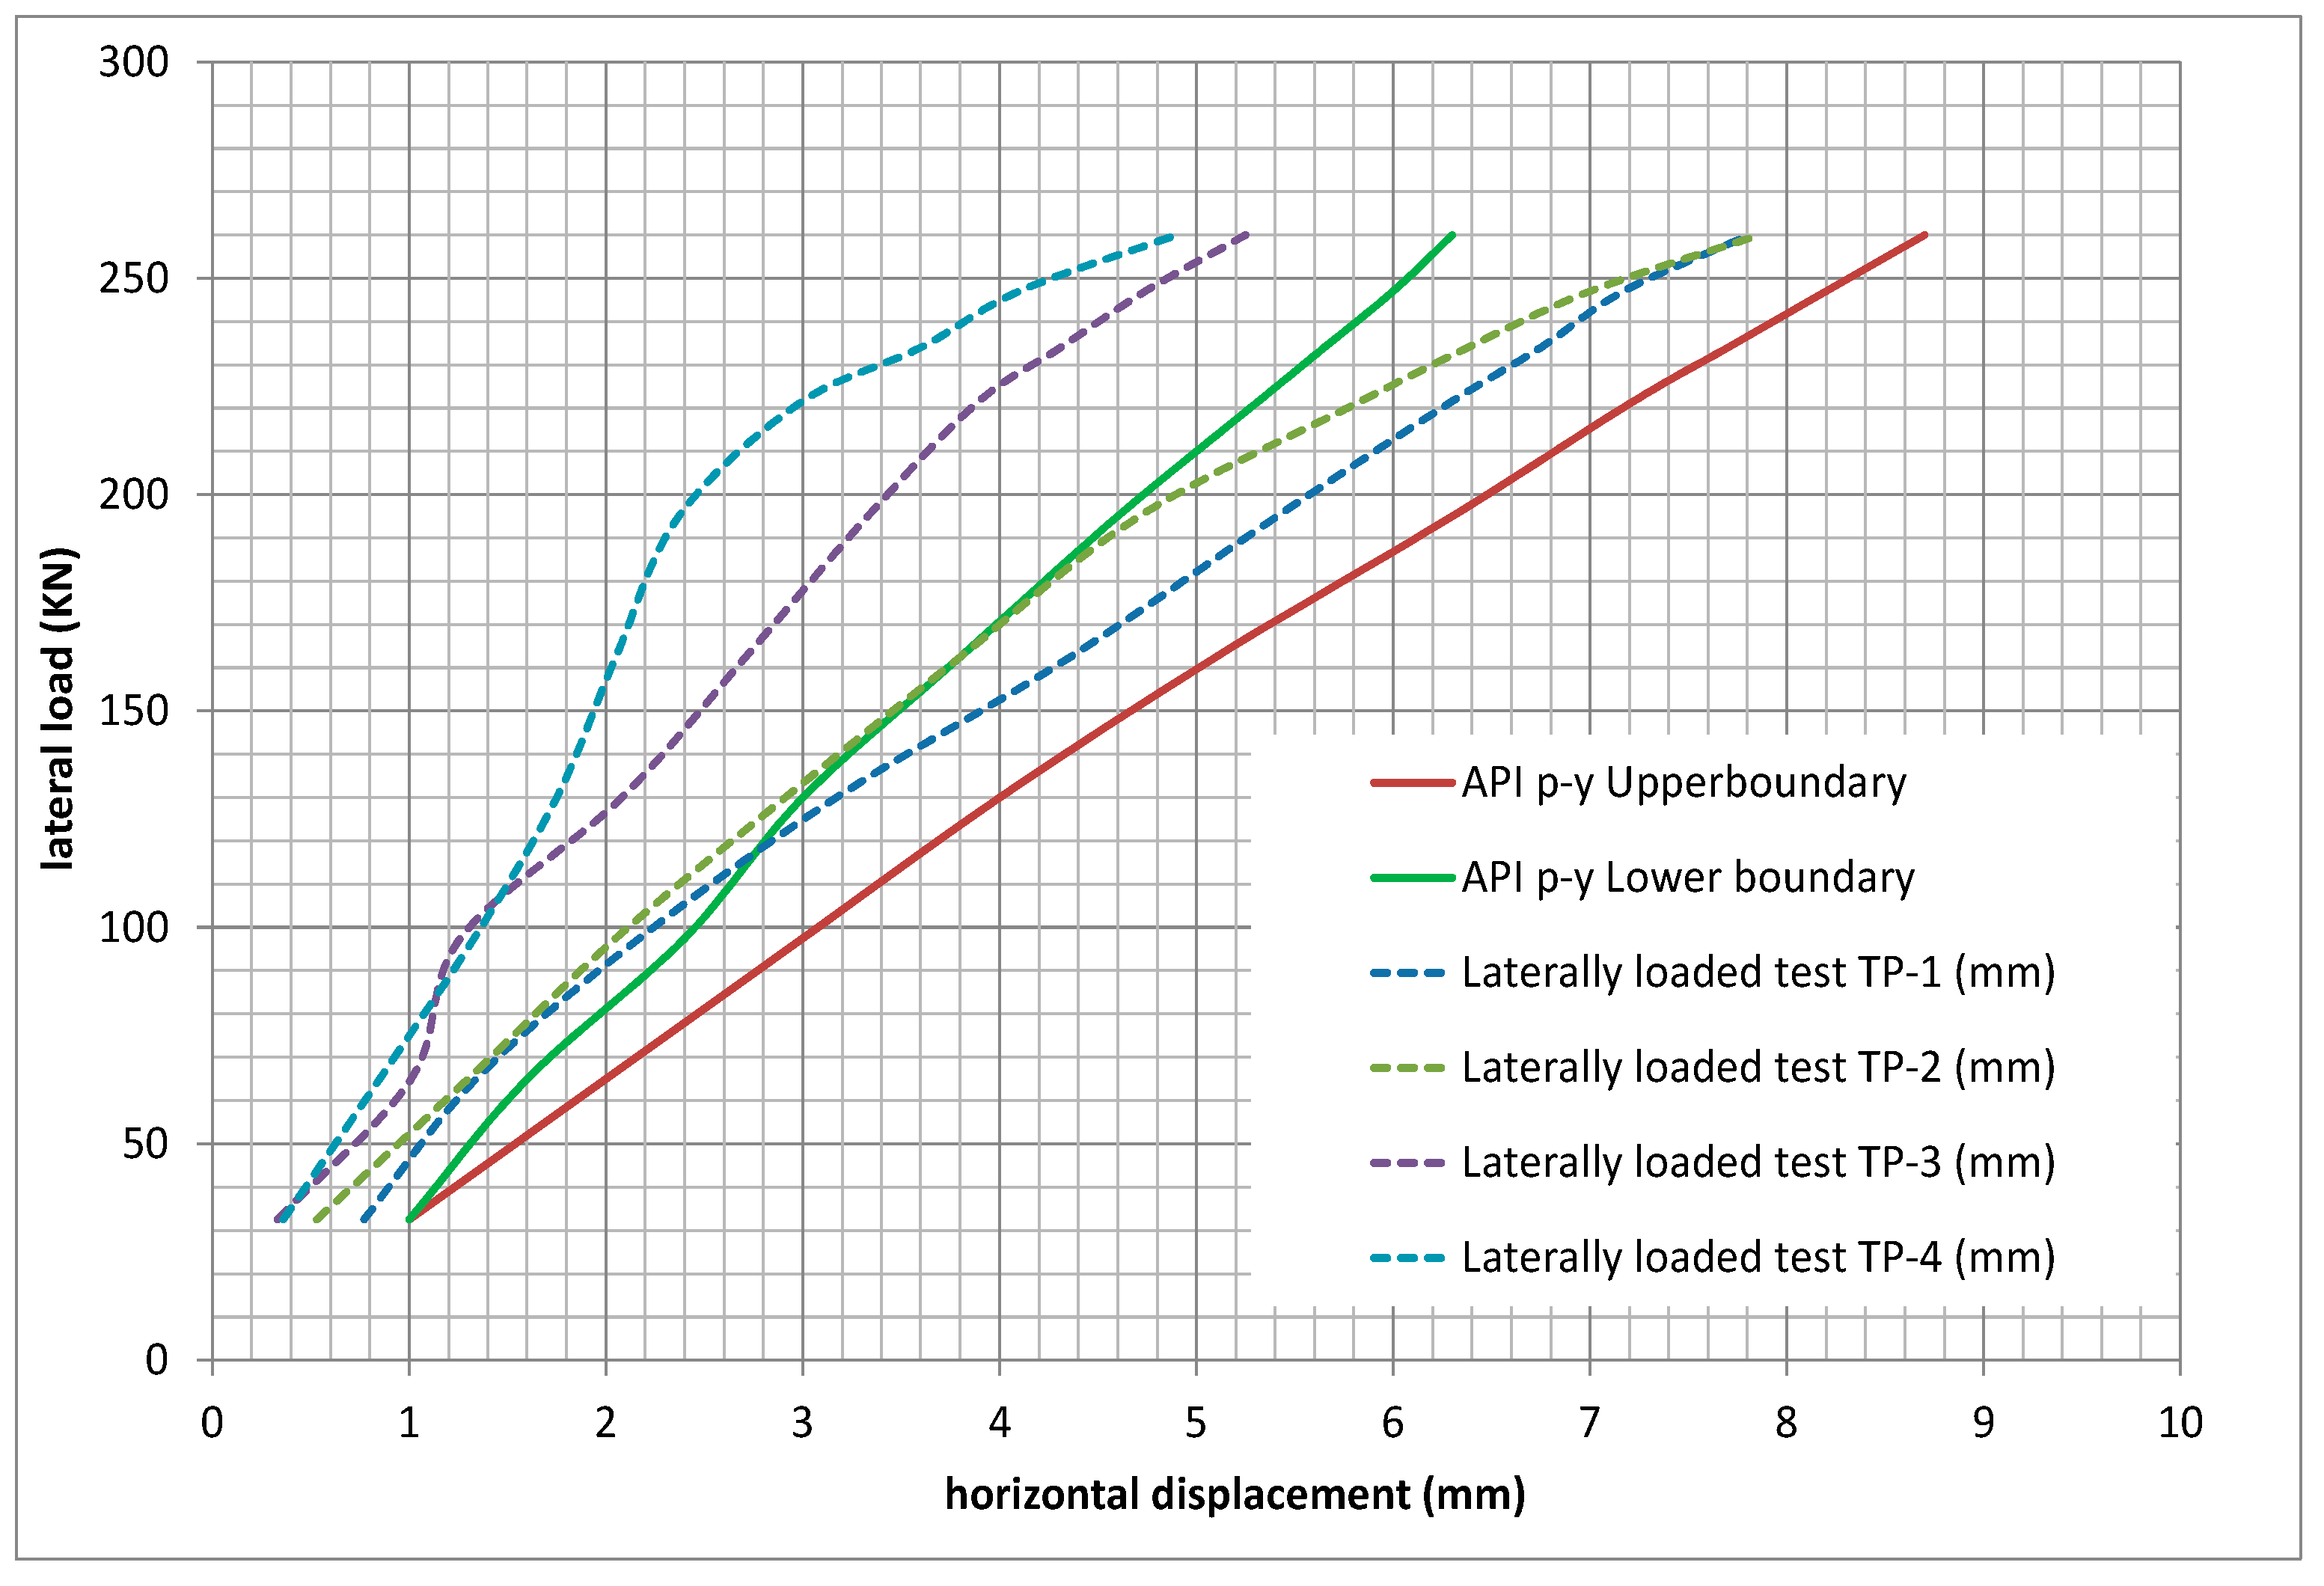
The soil profile considered for the analysis is obtained from the soil investigation presented in the previous sections. The used profile is (
Table 2):
The following figure compares the results of the pile load test with the analytical model. It is observed how pile tests TP-1 and TP-2 fall within the boundaries defined between the upper and lower limits of p-y model.
Tests 3 and 4 are somewhat below (
Figure 8), although given the small size of the taken measurements (1 to 2 mm), it may be still considered an acceptable adjustment.
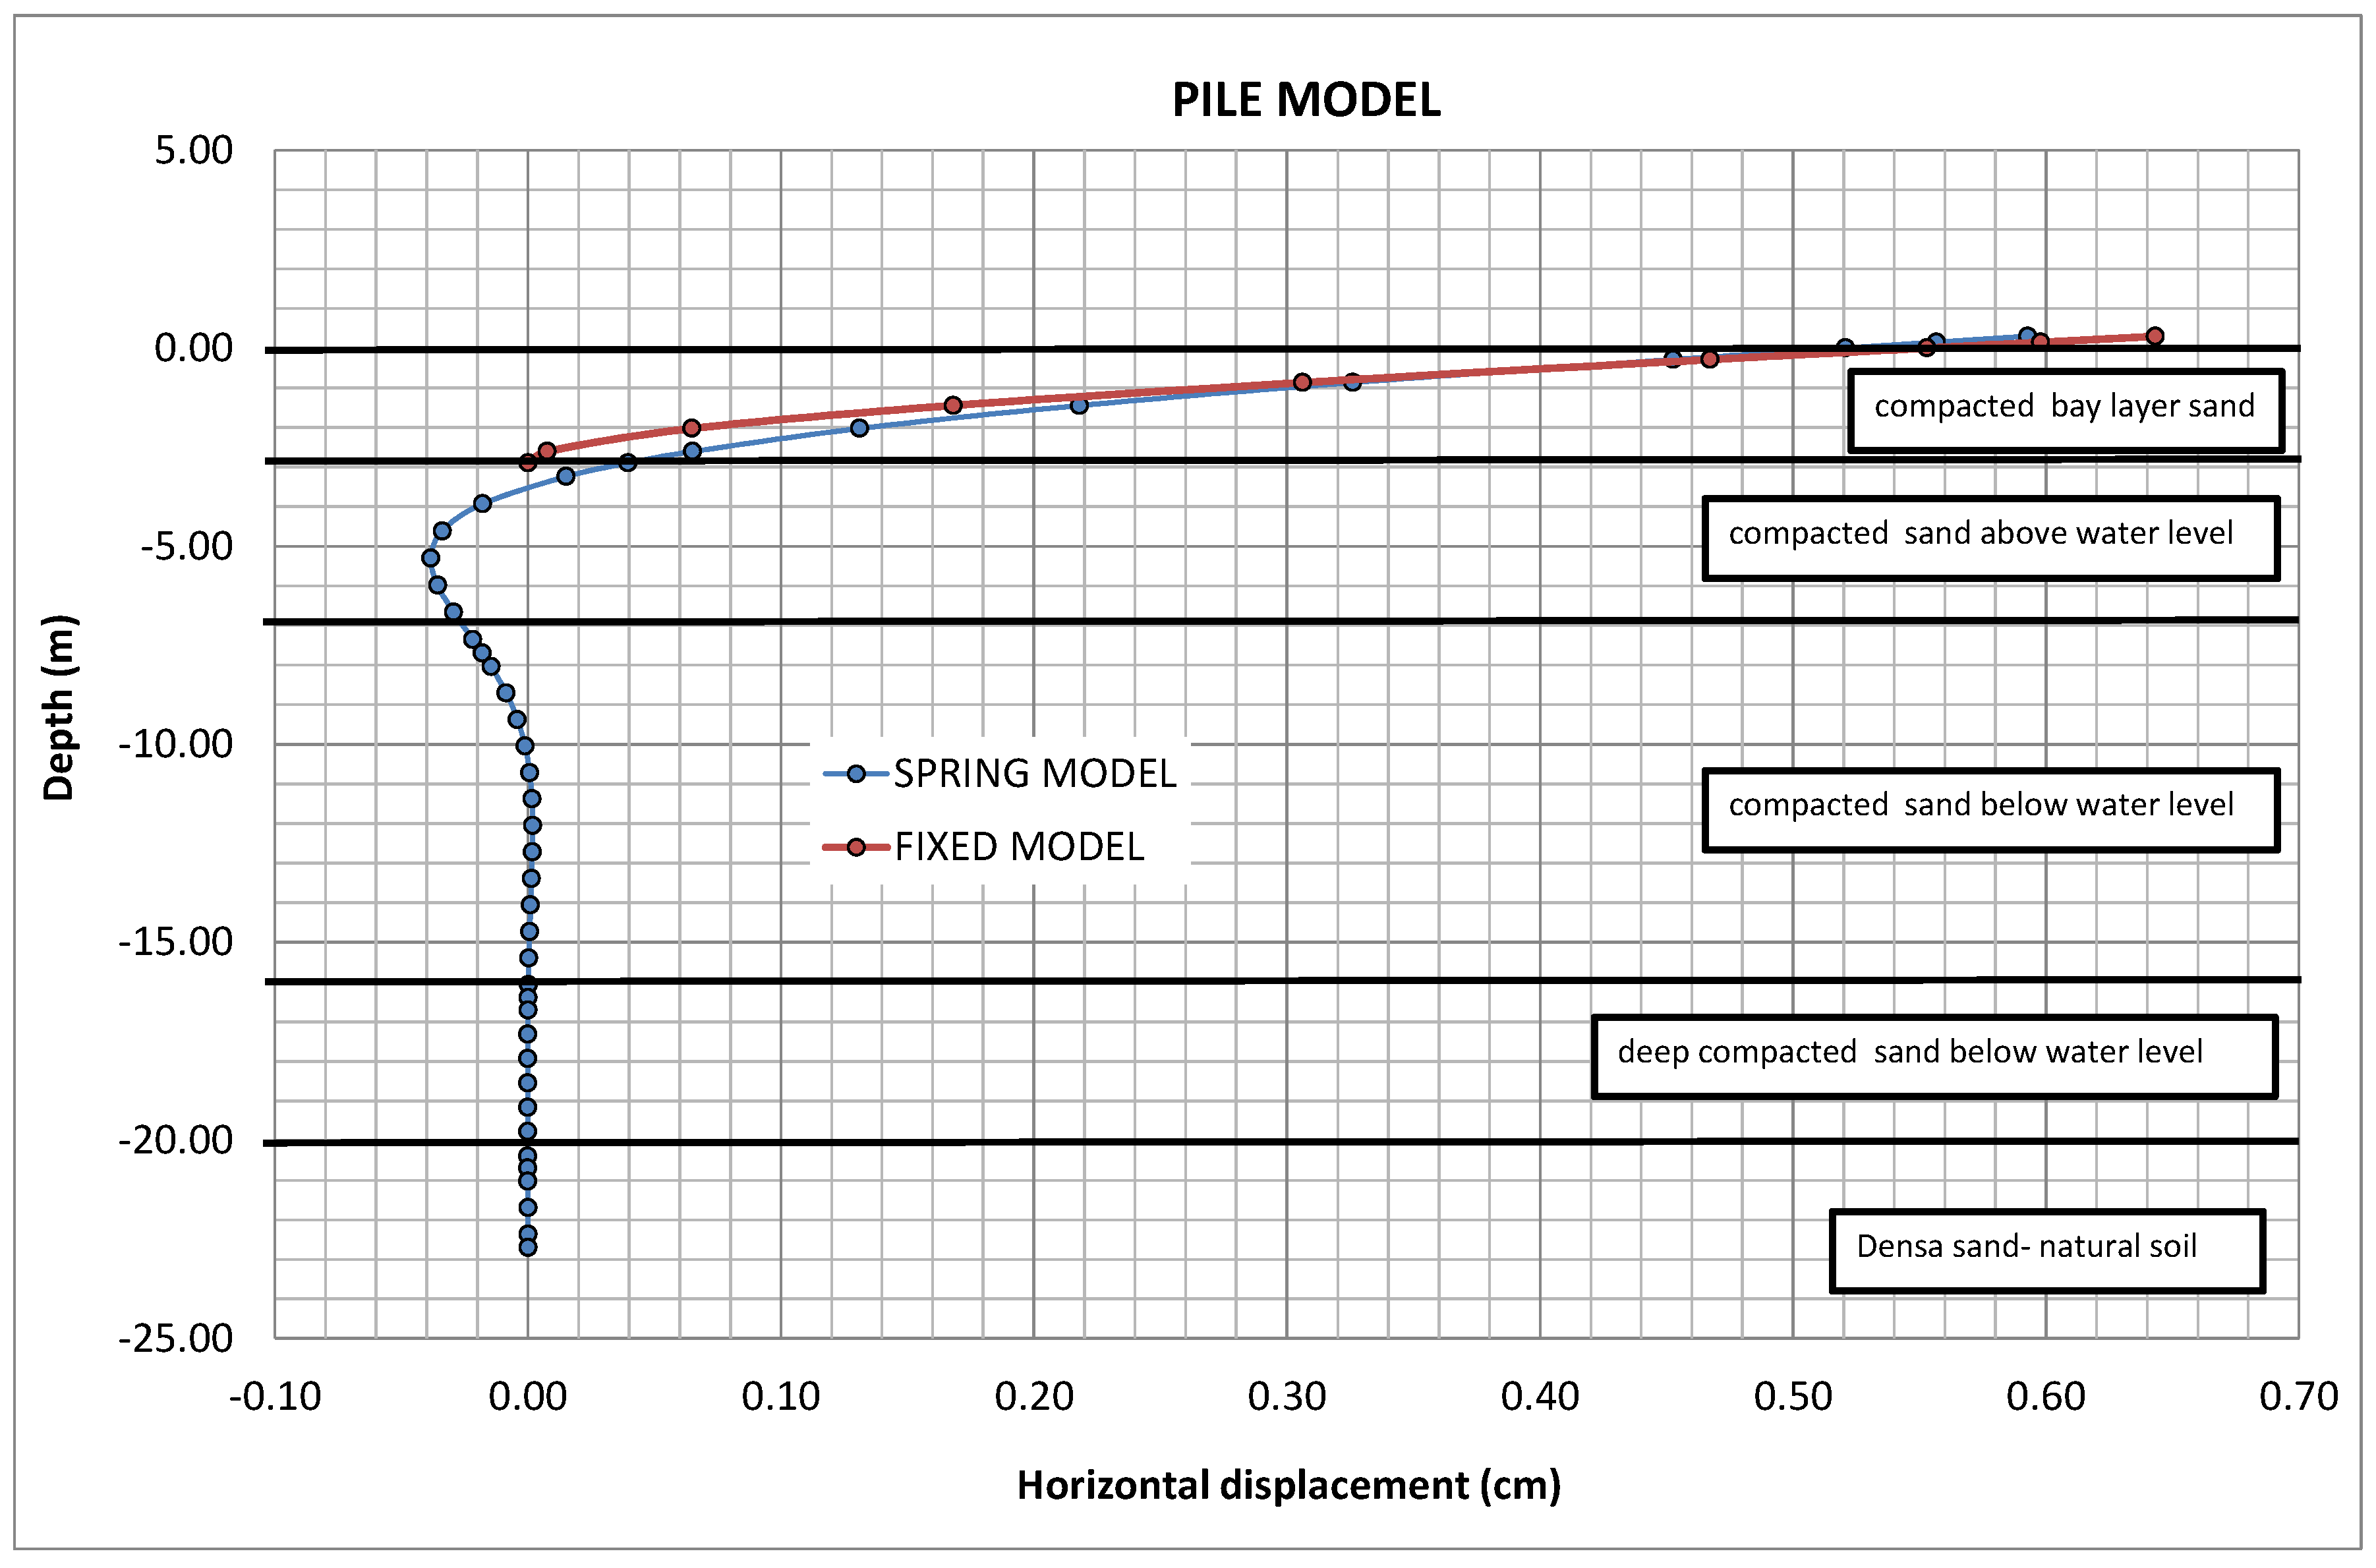
The entire deformation of the pile with depth is shown in the
Figure 9 below. Blue line shows the deformation obtained with the spring model. The chart also shows the equivalent cantilever beam which has the same deformation at the pile top, but it is fixed at a certain depth.
In the
Figure 9, we can observe that all the deformation of the pile happens at the first 3.0 m. The fixed point of the equivalent cantilever beam is located precisely at a depth of 3.0 m, which for 0.6 m diameter pile is equivalent to about 5 diameters.
5.2. Horizontal Reaction Modulus Model
The reaction modulus may be related with the soil deformation modulus by the expression (Equation (4)):
where:
E: soil deformation modulus for the level of deformation considered;
D: diameter of the pile;
A: constant with value between from 0.8 to 1.5.
Soil deformation modulus can be obtained from the soil profile based on SPT test. The correlation used in this case is the following Equation (5):
Therefore, the soil profile used is (
Table 3):
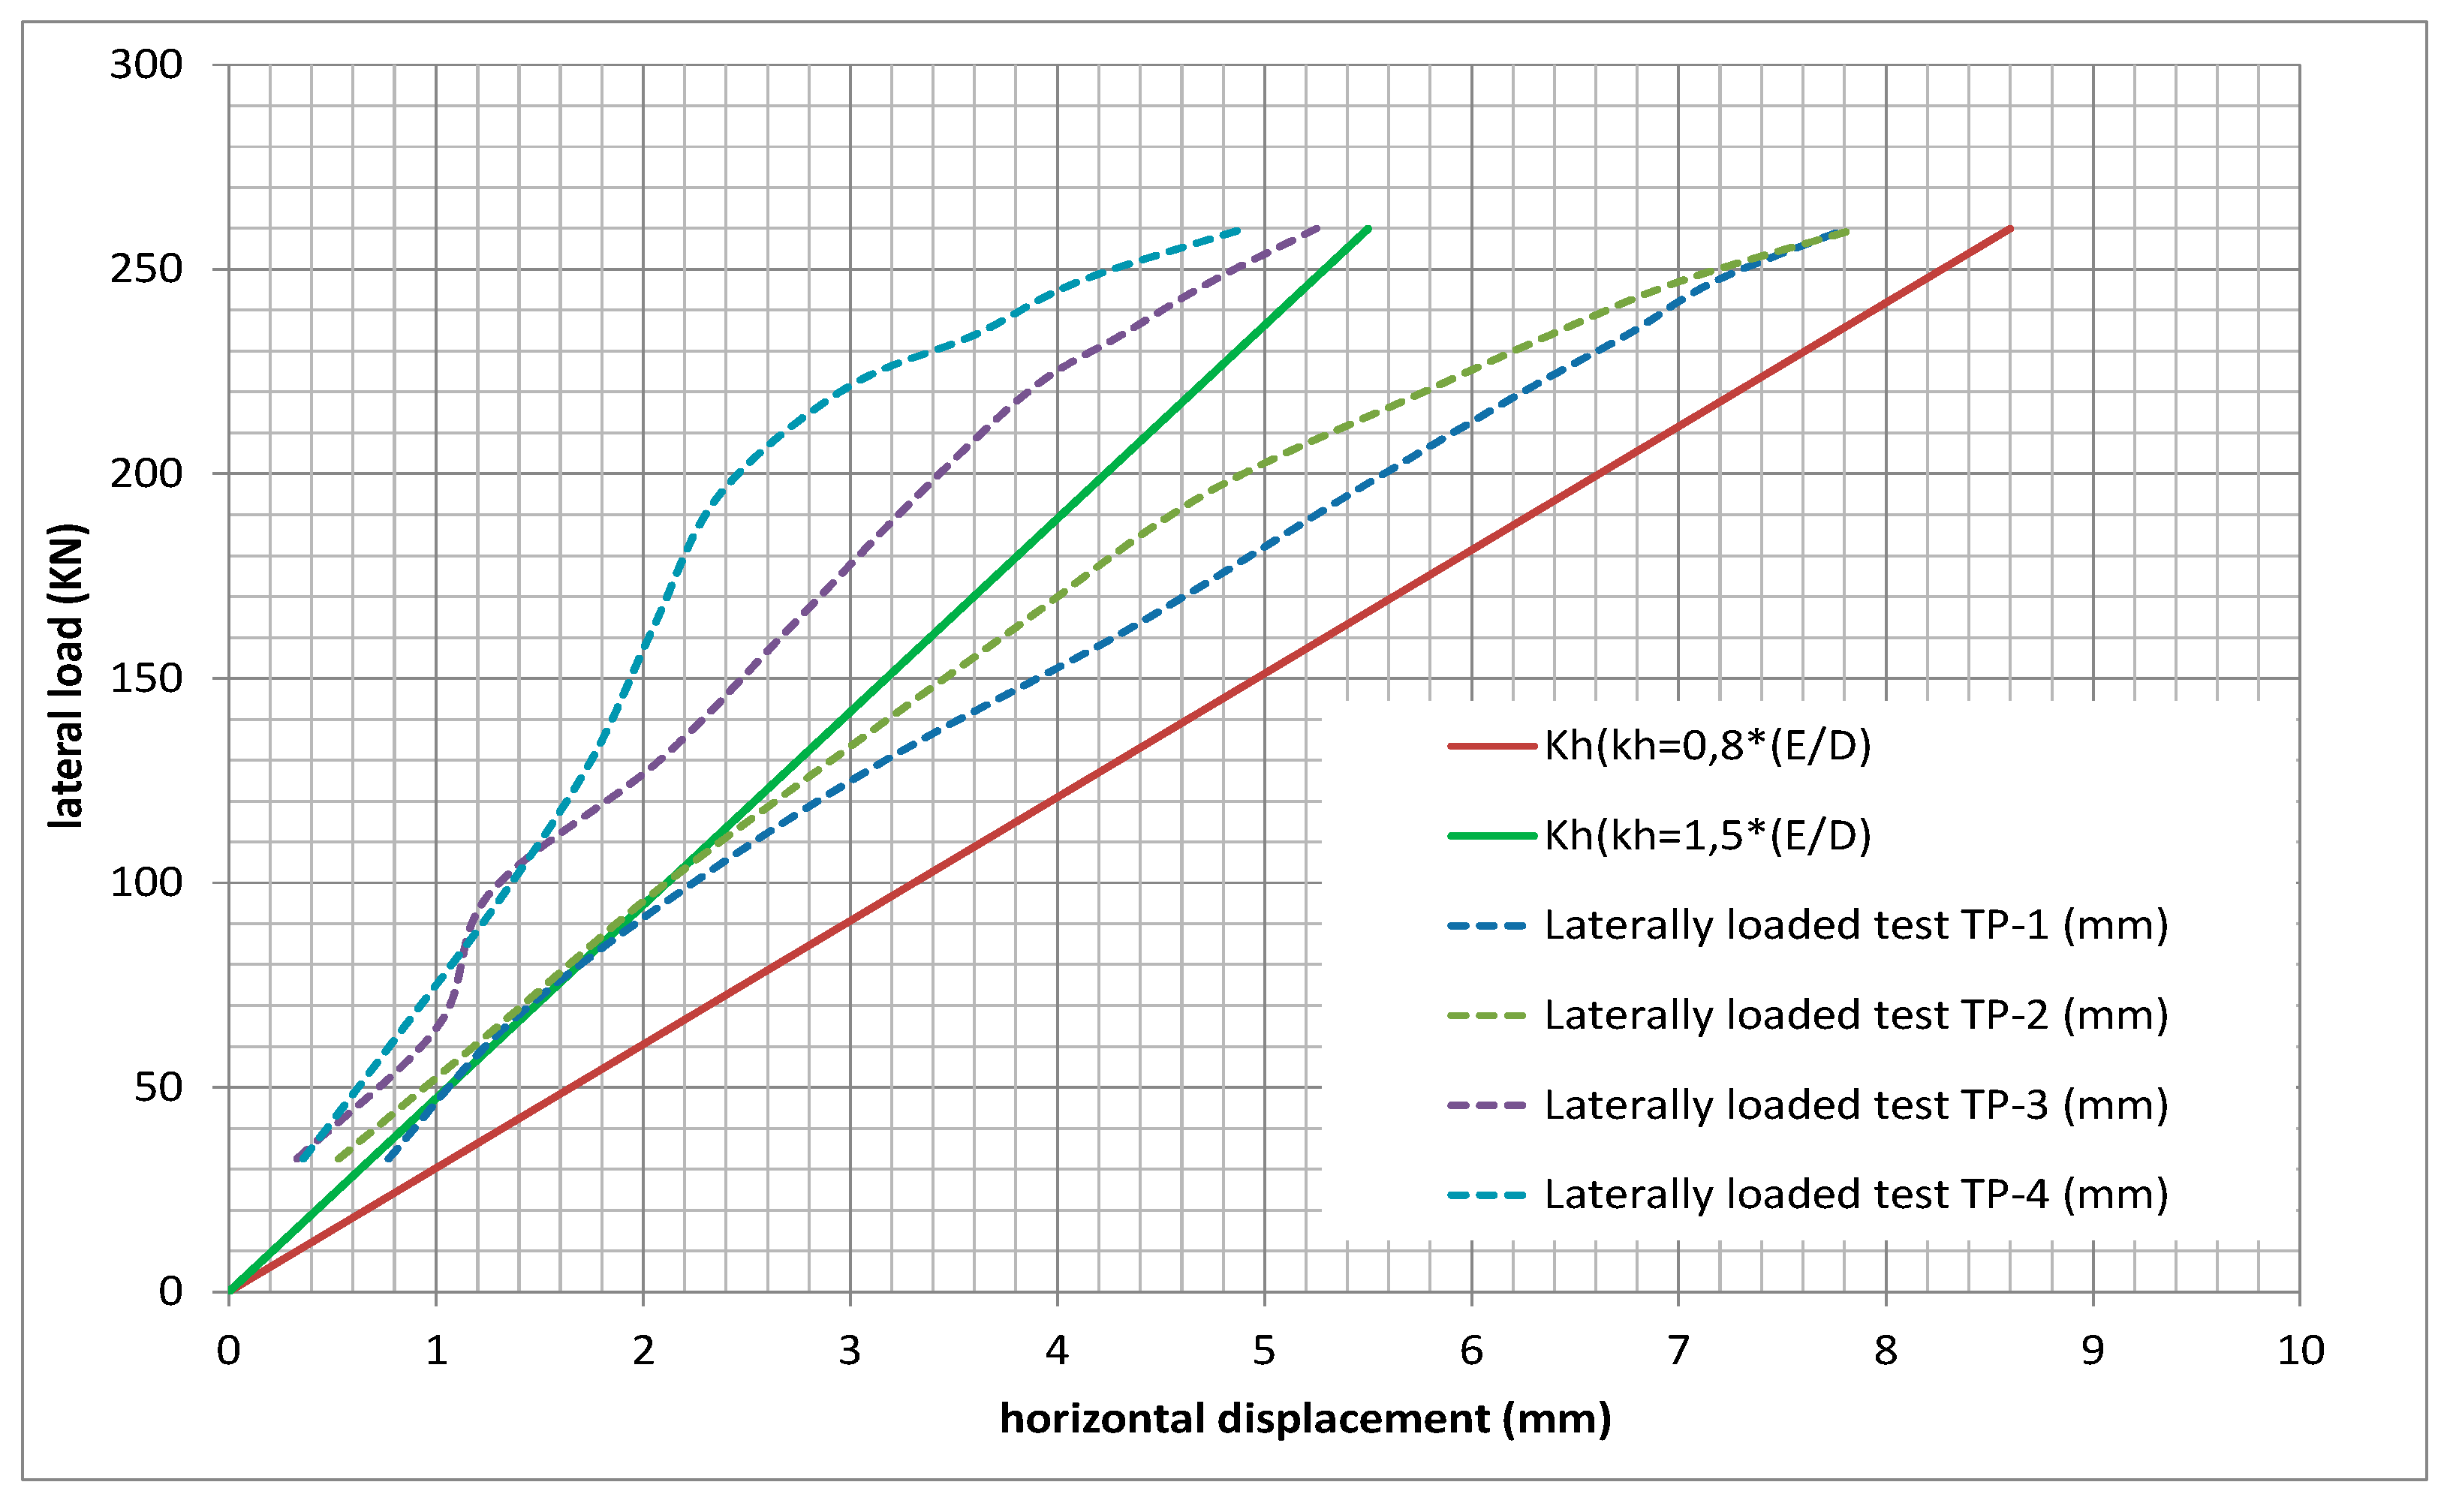
The
Figure 10, compares the results between the four tests of the piles and the analytical model. It is observed, again, how the piles test on TP-1 and TP-2 fall within the limits defined by upper and lower boundaries.
The tests TP-3 and TP-4 are somewhat lower, although, as previously mentioned, it may be considered an acceptable fitting.
6. Discussion
Prediction for horizontal displacement at the top of an isolated pile—and hence bending moments and shear forces—has been addressed by two different methods. The first one, known as the p-y method, is based on internal friction angle of the granular soil. Friction angle is obtained for well-known correlation with SPT and CPT.
Internal friction angle values correspond to the peak strength of the dense sands. They are in the range of 35° to 48°, therefore it is the angle related to small deformations. The calculated deformations are also small, so this hypothesis is consistent.
The second method is based on the relation between horizontal reaction modulus and deformation modulus that are in turn related to SPT test.
Predictions from both methods are compared with the records of the four horizontal load tests. The fitting is outstanding.
It has to be considered however that the applied loads are far from the laterally ultimate bearing capacity; therefore, soil is working all the time on an almost elastic regimen. This point has to be bore in mind when applied the proposed correlations, because for larger loads close to failure, others, more conservative soil parameters, may be needed.
7. Conclusions
Behind the reliability analysis to determine the safety factors on structural design, there are some uncertainties which have to be evaluated. One of them is the model uncertainty. This study compares predictions using well-known laterally-loaded-pile formulations with outputs of large-scale tests. In this way, an insight on that kind of uncertainty is presented.
It is observed that fixing an upper and lower boundary defined by credible soil parameters can improve the prediction. However, even with this approach, it should be expected that some outputs are out of that range.
Formulations developed for design purposes tents to overestimate movements, which do not always occur. The proposed formulations are still useful tool as long as the design conditions are based on the maximum displacement.
This type of studies should be available for other geotechnical issues, together with the code formulations, in other to properly appreciate their scope and the associated uncertainty involved in the use of the models.

