1. Introduction
Object detection is a fundamental field of computer vision and an essential component of autonomous driving (AD), which uses sensors to detect the driving environment. Sensing the driving environment is closely related to safety, and research on fusion of sensors with different characteristics is being actively conducted to increase the detection rate of objects in a dynamic environment to secure such safety [
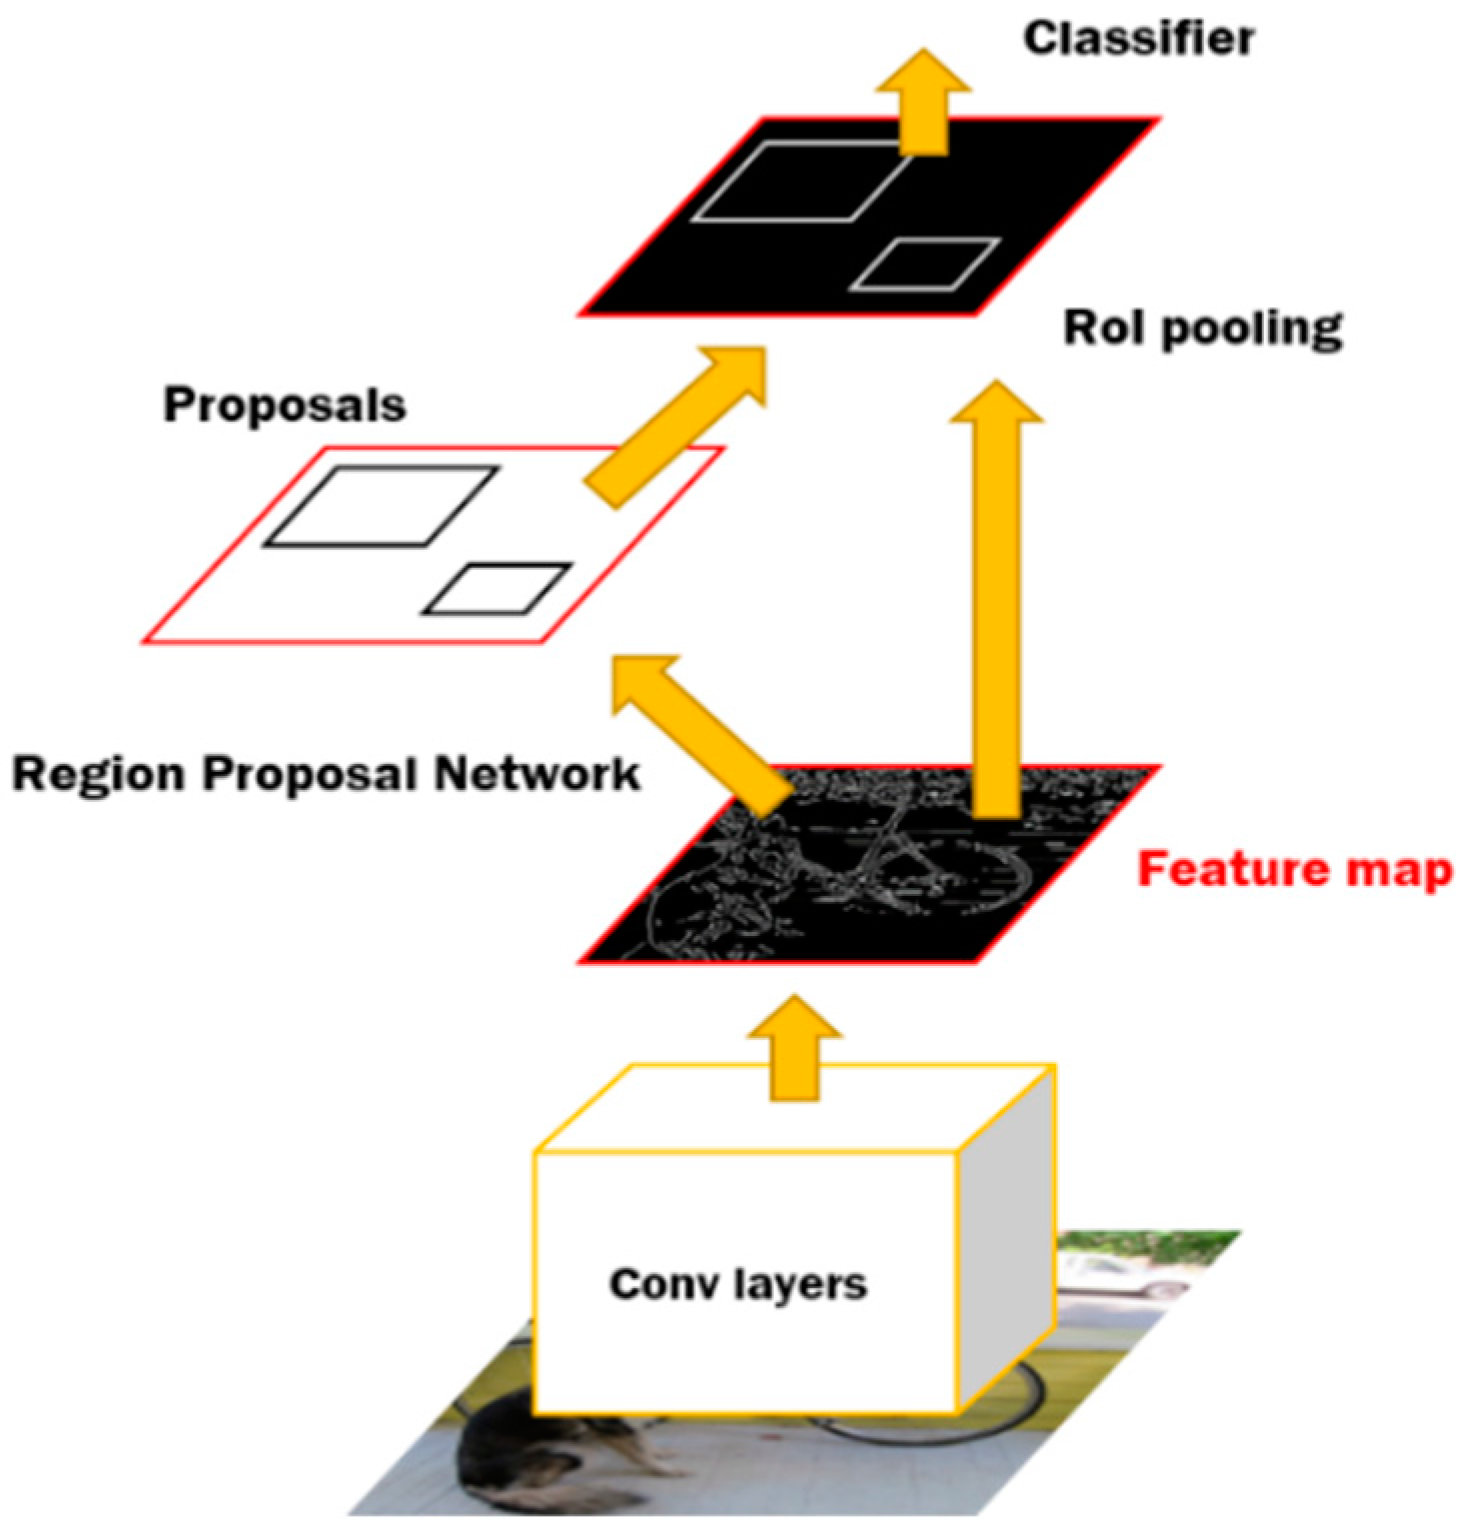
1]. However, the development of a robust object detection system that can be operated in various driving environments in real time remains a challenge. In recent years, object detection has been considerably improved through in-depth learning algorithms using a large amount of input data. Since the convolutional neural network (CNN) structure was proposed, autonomous driving has seen a large improvement in performance compared to conventional methods. It is also actively used to detect the driving environment [
2].
In most cases, various sensors such as RGB cameras, infrared cameras, radars, and LiDARs (Light Detection and Ranging) have been used to build robust object detection systems for the implementation of AD [
3]. The detection scheme using an RGB camera basically recognizes the shapes and colors of objects, similar to human vision, and has the highest detection performance when used alone. However, since it is displayed as image data through visible light reflected from an object, it is vulnerable to external environmental factors such as lighting, weather, and object shape [
4]. In addition, it is difficult to obtain accurate three-dimensional distance information of the detected object. To solve such a problem, a method of calculating the distance according to positional difference between pixels using two or more RGB cameras has been proposed, but sensors other than RGB cameras are being used in AD due to the low accuracy of the distance information [
5]. Recently, many studies have been performed to overcome the limitations by using LiDAR with RGB cameras to improve object detection [
6].
LiDAR emits a laser and represents the signal reflected from objects within the measurement range as point cloud data (PCD). Since the laser derived from the sensor itself measures the reflected signal, it has the advantage of robustness to external environmental factors, unlike RGB cameras that measure visible light. In addition, accurate distance measurement with an object is possible, including reflectance information according to surface properties of the object and distance information according to the reflected time. However, since only the reflected laser signal is measured, a limited image of the surrounding area is generated. As a result, the resolution of the data expressed in PCD is very small, within 10% of the image data, and has a limitation in expressing all the information of the actual environment [
7].
As such, RGB cameras and LiDARs have complementary aspects, and there are active proposals for a convergence technology that fuses information from these sensors to enhance object detection performance [
8,
9]. Recent studies of representative sensor fusions are largely divided into halfway-fusion and late-fusion. The architecture for halfway-fusion newly defines a feature map through fusion of features extracted from each sensor data in the middle of the CNN, and detects objects based on the fused feature map. In the late-fusion structure, a single object detection model is trained based on each sensor data, and the non-maximum suppression (NMS) technique is applied to the result of fusion by concatenating each detection result in a stack at decision level.
In view of halfway-fusion of [
10], a method was proposed for detecting a vehicle, by learning an object detection model after fusion of image data and features extracted from an image of a candidate region in which an object may exist in PCD. Recently, a fusion method has been proposed by grouping a single-level feature map obtained by element-wise sum and average of feature maps extracted from image data and PCD and feature maps of each convolution layer [
11]. In general, halfway-fusion improves the overall detection performance because feature maps that are fused at the intermediate stages of the CNN contain meaningful information of the object. However, due to the convergence before the decision level, there may be a case where an object cannot be detected by a specific sensor, and thus there is a limit in improving the missed-detection rate.
In the previous study of [
12] classified as late-fusion, the object was inferred through a segmentation technique based on image data and PCD, and the outputs classified at decision level were converged based on probability using a convolution-based feature map. This improved the performance of multi-objects classification for vehicles, pedestrians, and cyclists. In addition, a method applying NMS after fusing object detection results was proposed based on three images converted into different sizes according to resolution [
13]. Three object detection models were trained in [
14] based on image data, LiDAR reflectance, and distance information, and a method of object detection using a multi-layer perceptron (MLP) by extracting features from the detection results has been proposed. Here they implemented late-fusion by redefining reliability through the MLP learning process, which takes the bounding box and its reliability generated by each single object detection model, and targets the ground truth and the intersection of union (IOU) of the bounding box. However, due to the structural nature of MLP, where the number of nodes in the input layer must be constant, the performance of the system was improved only when all the trained detection models detected the objects. In case of failure, the impact of performance improvement through MLP was very limited. In addition, since the bounding box detected during the fusion process is not modified, it is difficult to expect improved detection performance through newly defined reliability when the predicted bounding box and the ground truth have low IOUs.
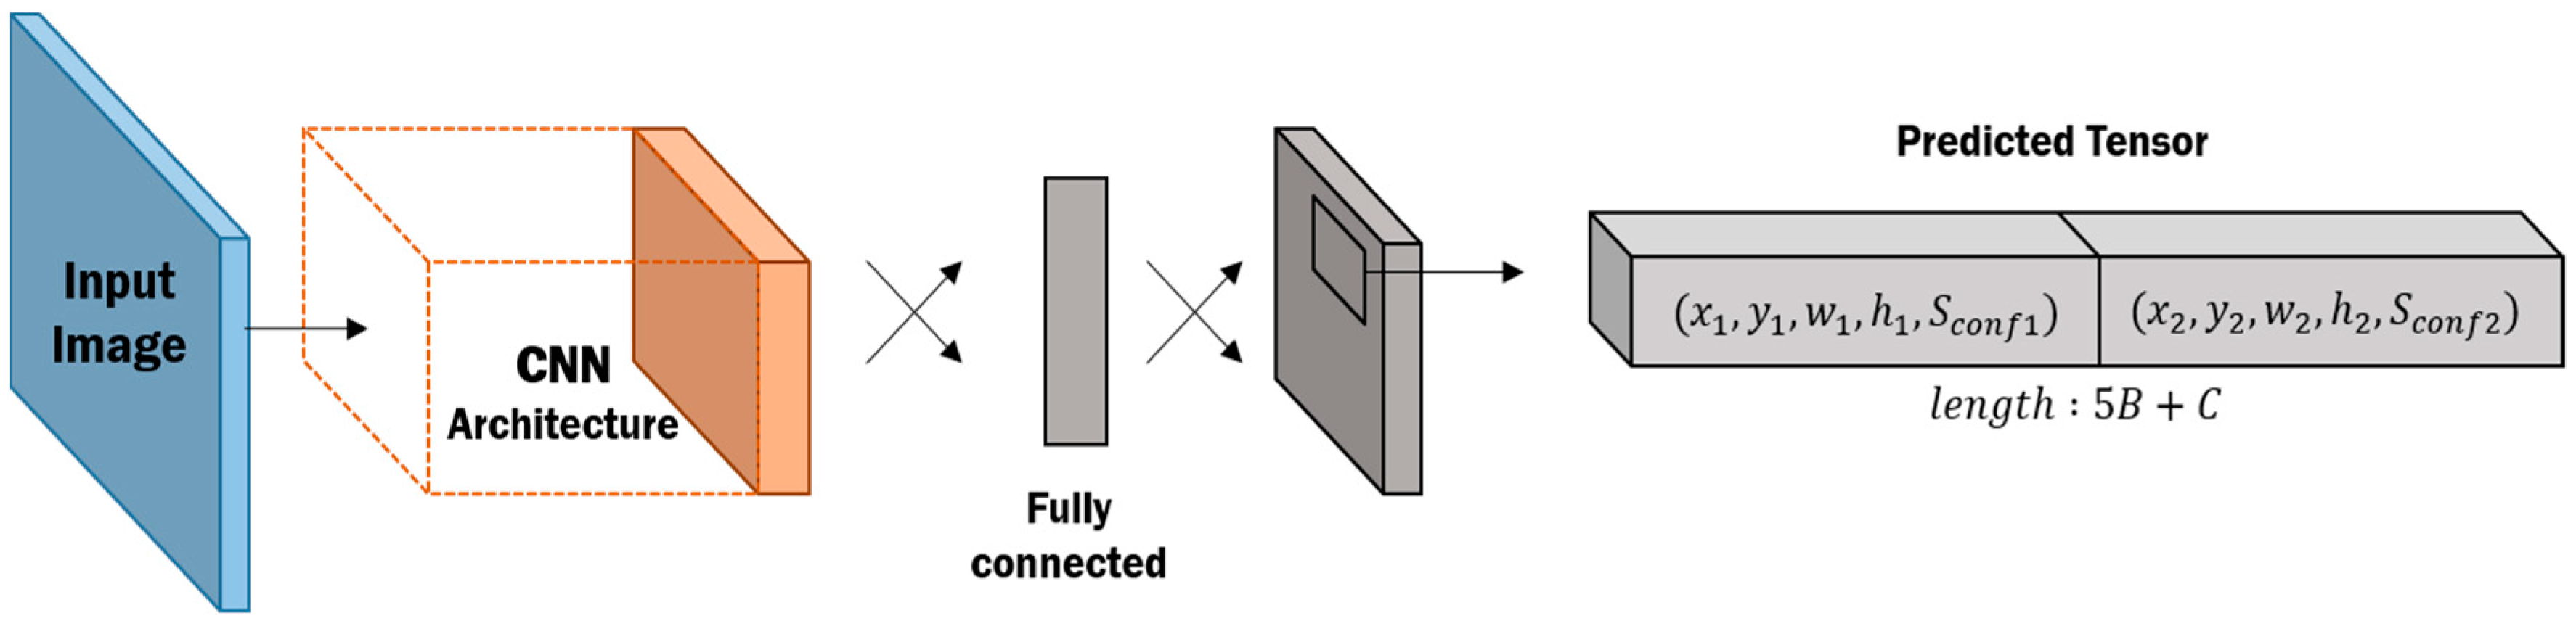
In this study, we propose an adaptive object detection system that can improve the detection performance by redefining the bounding box through the convergence with multiple sensor detection results even if detection performance of one sensor is degraded by external environmental factors. The proposed system utilizes YOLO (You Only Look Once: Real-Time Object Detection) architecture suitable for real-time object detection and performs independent object detection using image data and PCD. Each of the detection results is then combined to improve the performance of the undetected rate directly at the decision level, late-fusion. In more detail, on the basis of image data and PCD including reflectance and distance information, training for object detection of three CNN-based YOLOs is conducted. The bounding boxes and confidence scores for the objects in each model are then predicted After that, the bounding box is created by applying the weighted average to the coordinates and the sizes of the bounding boxes expected in each model based on the reliability. At this time, to pick a valid bounding box, the bounding boxes predicted by the existing models and the stacking result are applied. Thus, even if all three models fail to detect an object, the bounding box is redefined or the detection result is stacked to compensate for the undetected rate of the system. Furthermore, although all three models detect the object, even if the IOU of the bounding box and ground truth is weak, the system can be strengthened by redefining the bounding box.
For learning and evaluating the performance of the proposed object detection system, object detection was carried out for vehicles and pedestrians using the KITTI Benchmark Suite [
15]. The result of sensor fusion using the proposed weighted average shows much better object detection rate than using the RGB camera alone. Even if one YOLO model failed to detect an object, it was possible to reduce the undetected rate by weighting the detection result from the entire model.
3. Multimodal Mixture-Of-YOLOs Framework for Object Detection
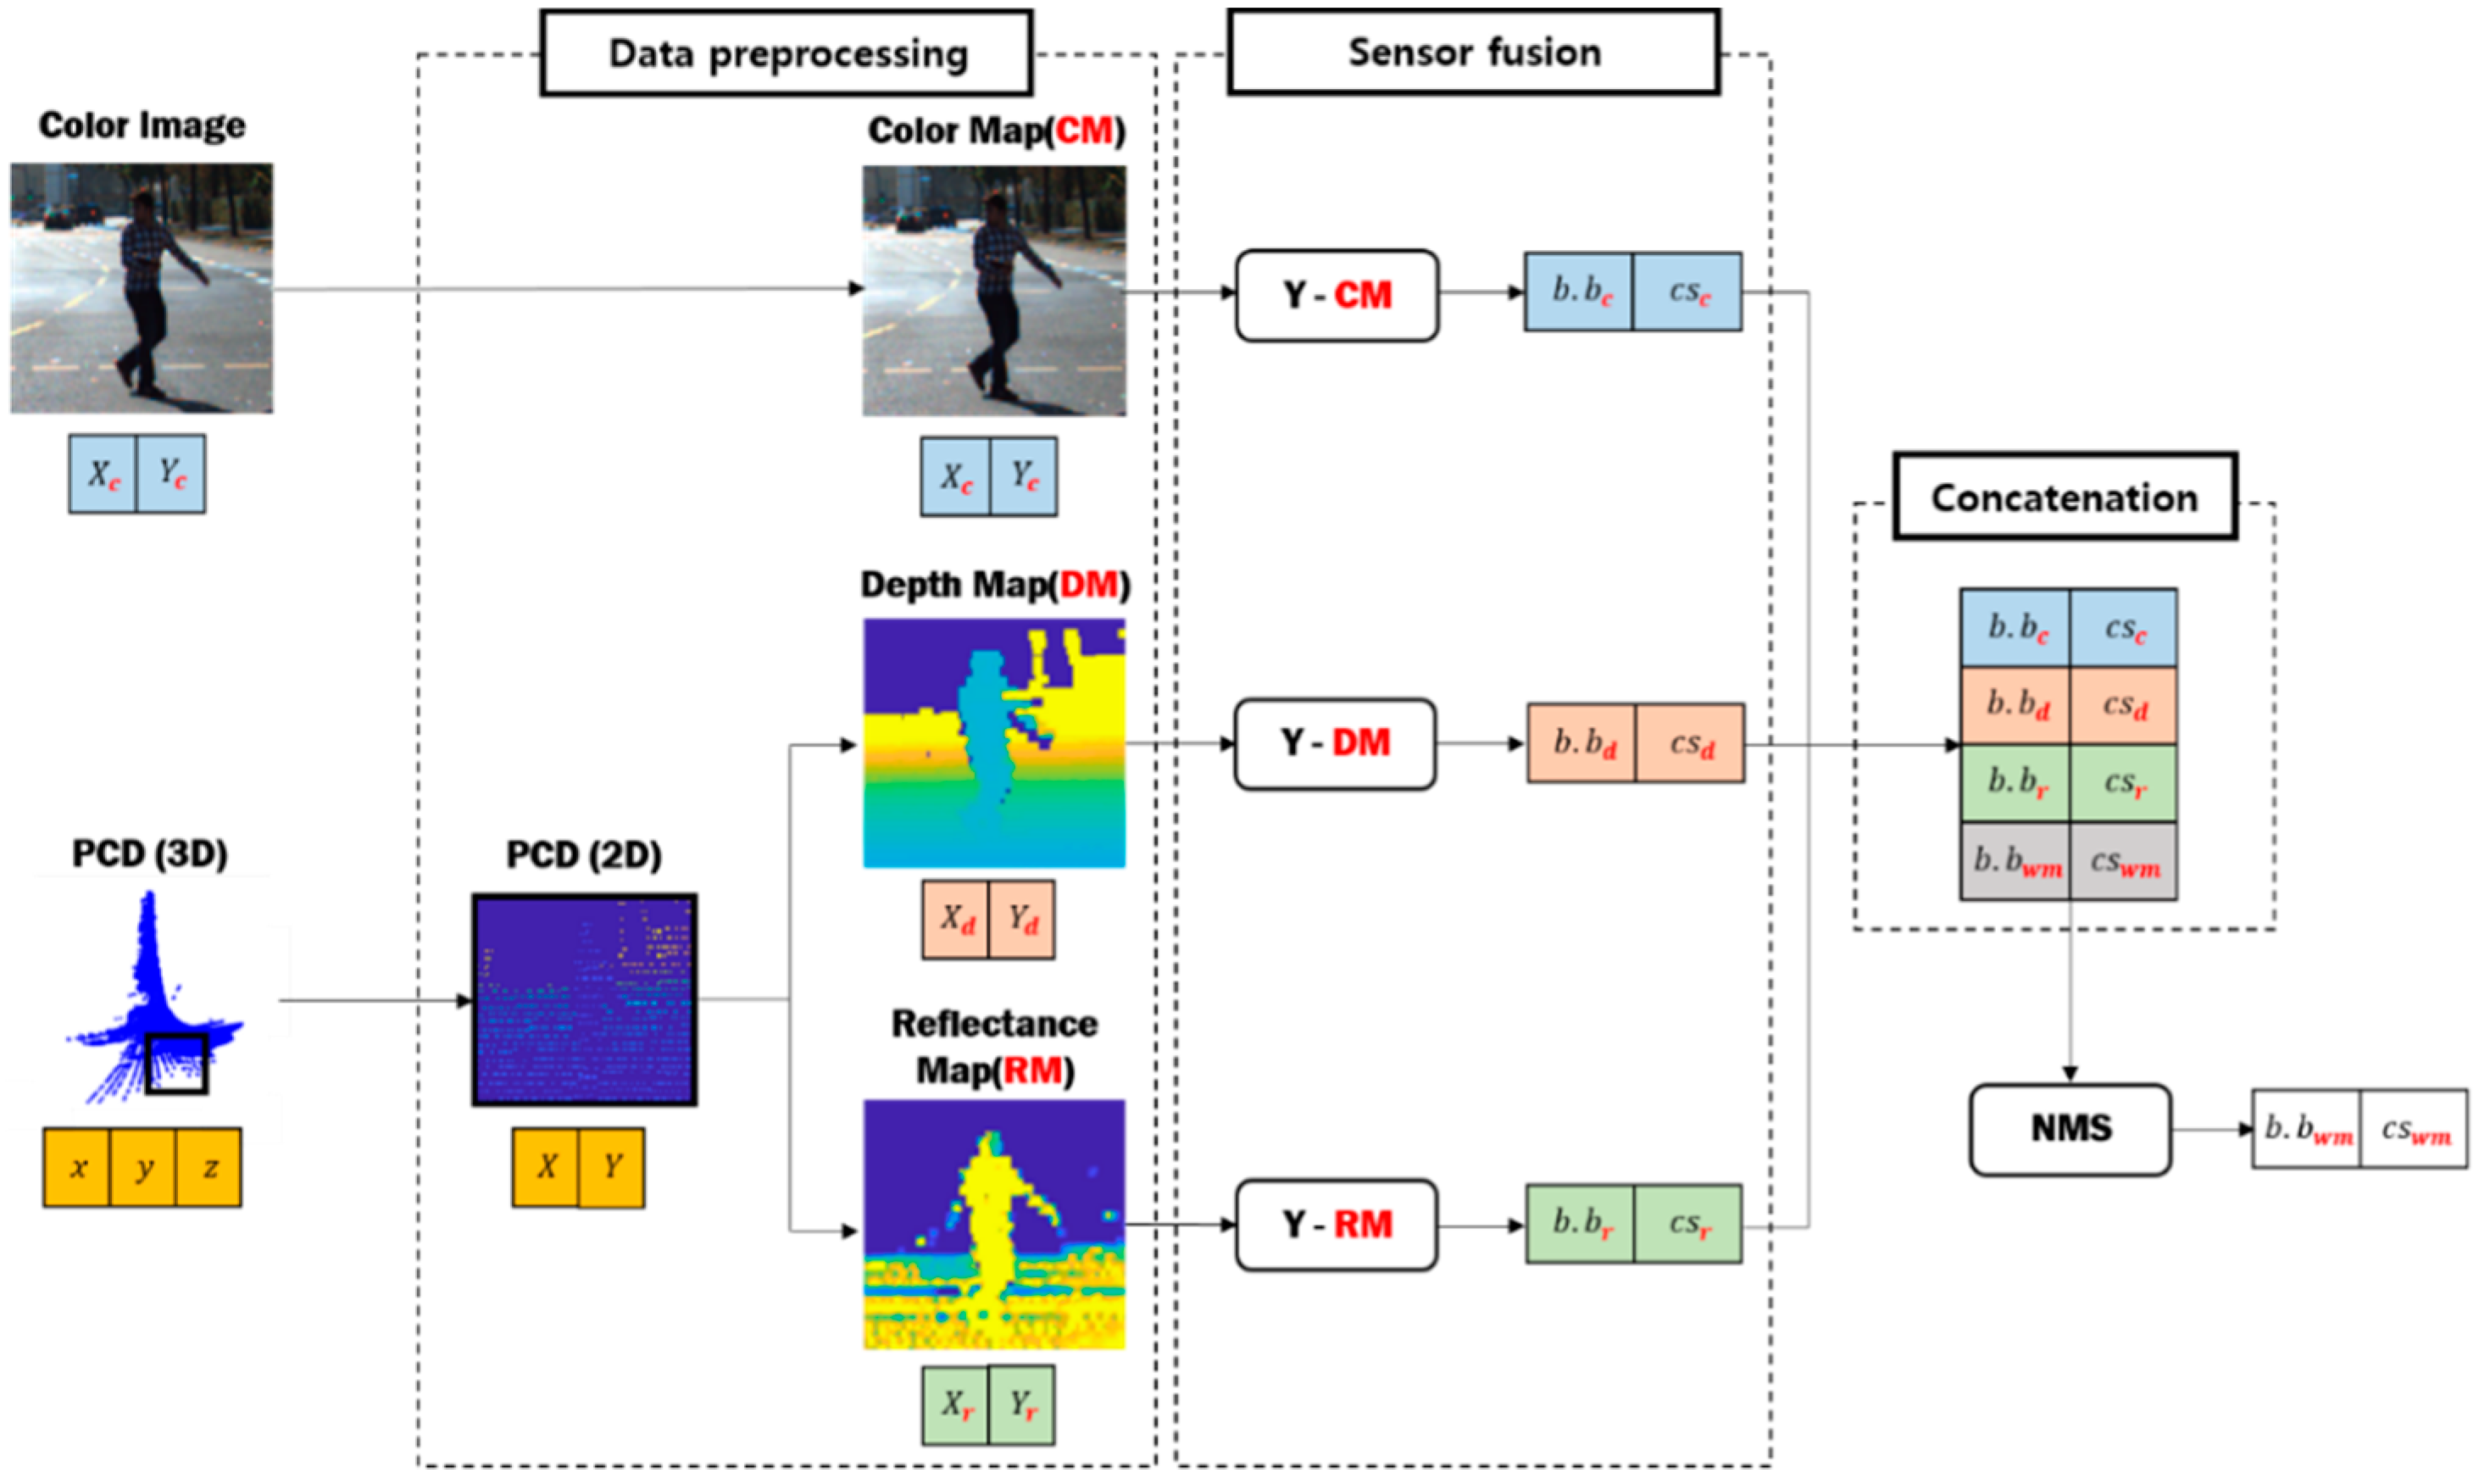
The proposed multimodal YOLO-based object detection framework using the weighted mean consists of a data preprocessing unit and a sensor fusion unit. In the preprocessing, the PCD representing the three-dimensional spatial information is projected in two-dimensional space through coordinate correction that matches the viewpoint of the RGB camera. After projection, the depth map and reflectance map are built according to the distance and reflectance information included in the PCD and are used for object detection. The overall schematic diagram of the proposed detection architecture is shown in
Figure 3.
In the sensor fusion process, each YOLO-based model is trained based on the image data from the RGB camera, the depth map, and the reflectance map of the pre-processed PCD to detect the object. Then, the weighted mean process is applied to determine the coordinates and size of the predicted bounding box. Laser signals derived from a LiDAR have a higher pulse than other sensors to measure long distances. Because they measure information reflected from signals derived from the sensors themselves, they are robust to external environmental factors.
3.1. Data Preprocessing
LiDAR provides the reflected laser signal,
, as a three-dimensional coordinate value (
) and reflectance information (
), which refers to the intensity of the reflected signal according to roughness, color, and materials of the ground and reflective surface of the object. Object detection using LiDAR is classified based on use the 3D coordinate value as is or by projecting it into 2D space of the top or front view [
22]. Object detection using the top view allows easy extraction of the direction and speed of movement of the vehicle, although the computational process of this type of object detection is complicated. On the other hand, object detection using the same front view as the RGB camera and driver view is simpler than object detection using the top view.
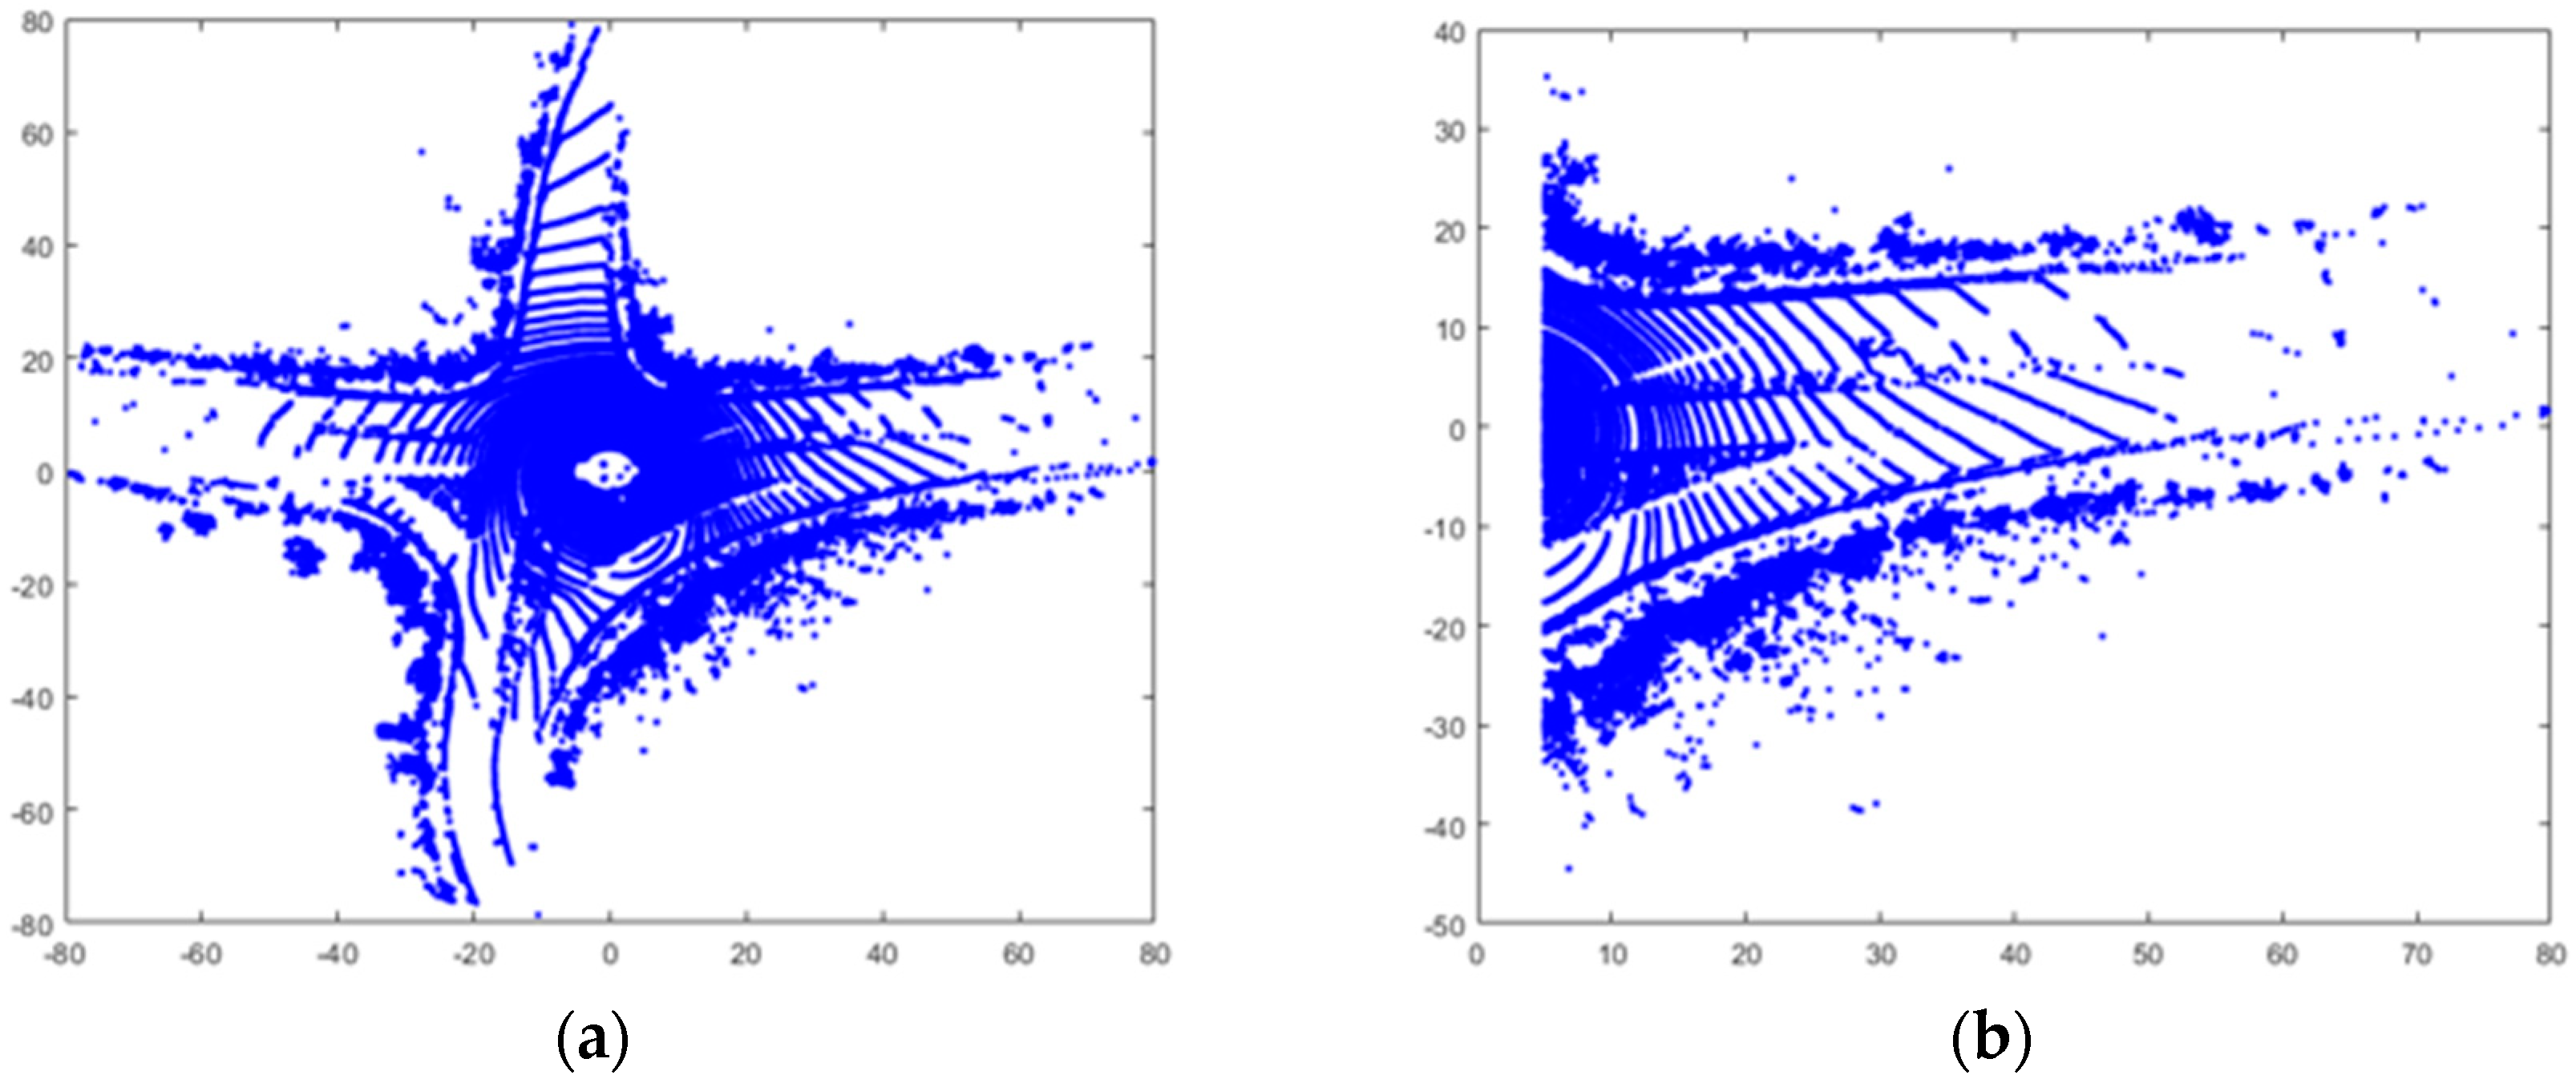
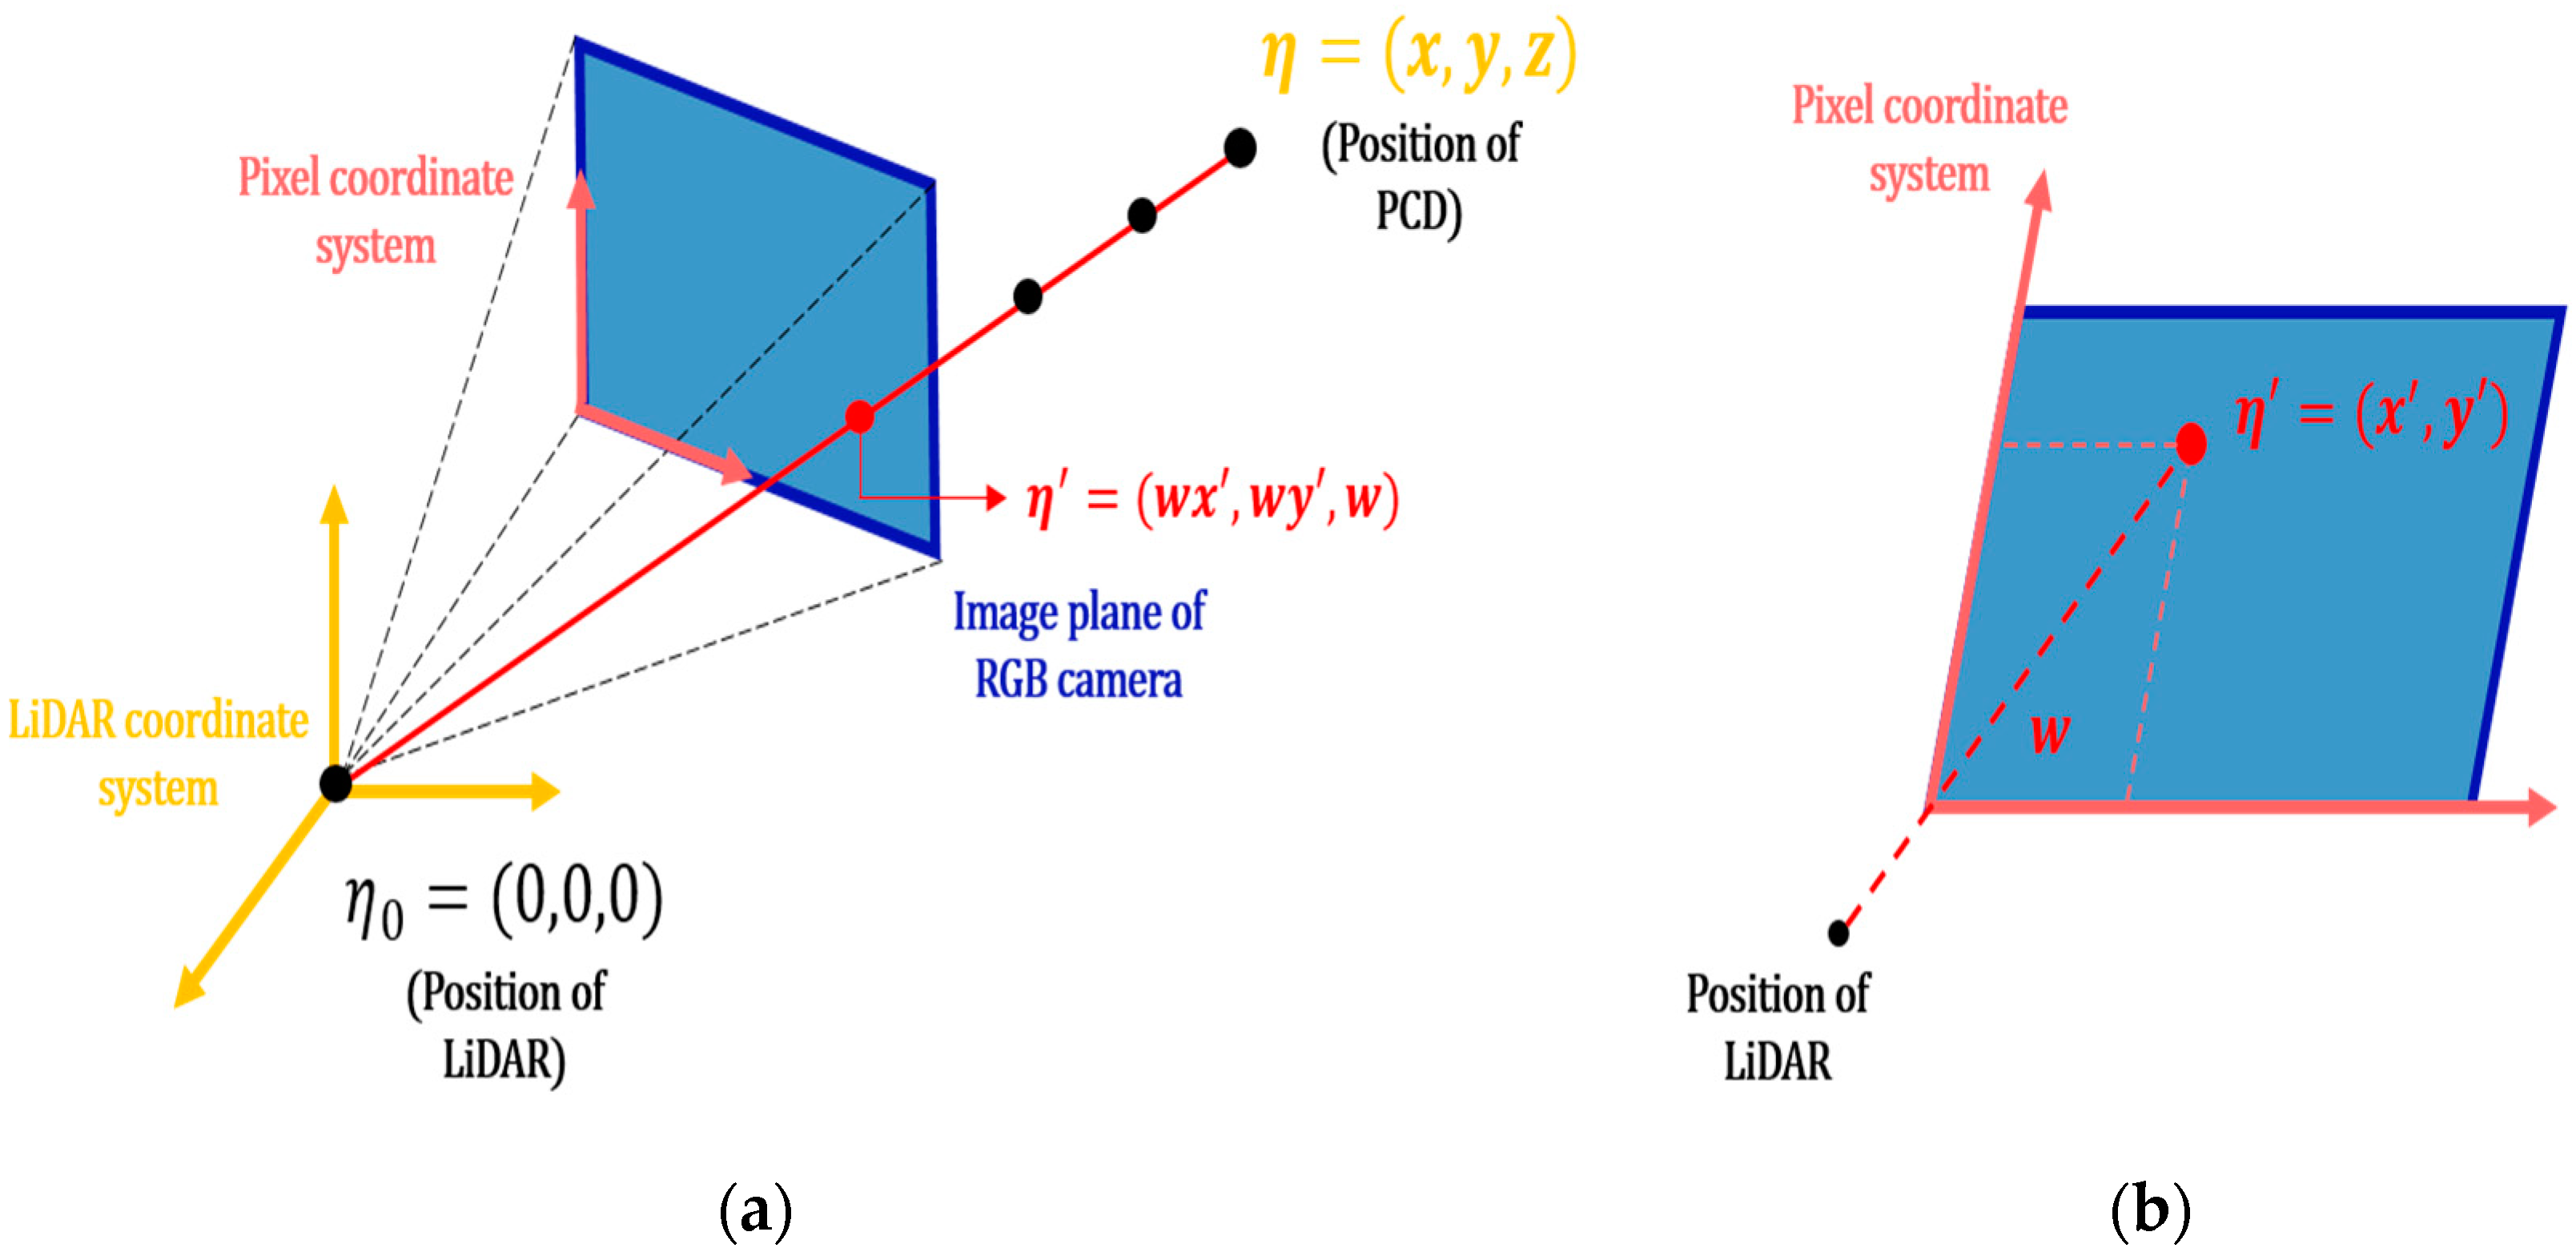
In this study, the PCD is converted into a two-dimensional pixel coordinate system such as image data through the conversion process of projecting the PCD to the same front view as the field of view (FOV) of the RGB camera. The pixel coordinate system refers to a 2D reference coordinate system of pixels included in the image data [
23]. Since the PCD represents data obtained from all directions of x, as shown in
Figure 4a, the PCD expressed in the FOV of the RGB camera is separated as shown in
Figure 4b. In
Figure 4a, the position of the LiDAR is the origin, the position of the RGB camera is the point shifted by 5 axes from the LiDAR, and the central axis of the FOV is the direction parallel to the y axis, satisfying the condition x > 5. The 3D LiDAR coordinate system, which represents spatial information, is converted to a 2D pixel coordinate system through a rotation/translation transformation matrix provided by the KITTI dataset so that it is projected onto the camera’s image plane. As shown in
Figure 5a, the coordinate (
), which is a separated PCD, is extracted and converted into the homogeneous coordinate of (
), and
projected onto the image plane is obtained through the rotation/translation transformation matrix. Here, the homogeneous coordinate extends
-dimensional coordinate of
to
dimension with respect to nonzero
, and is represented by
. A PCD,
, on the projected image plane is represented by (
), where w represents the distance from the camera and the lidar to the projected PCD,
, depending on the nature of the homogeneous coordinates. Dividing w by two-dimensional coordinates of
converts it to the pixel coordinate system as
and defines it as
.
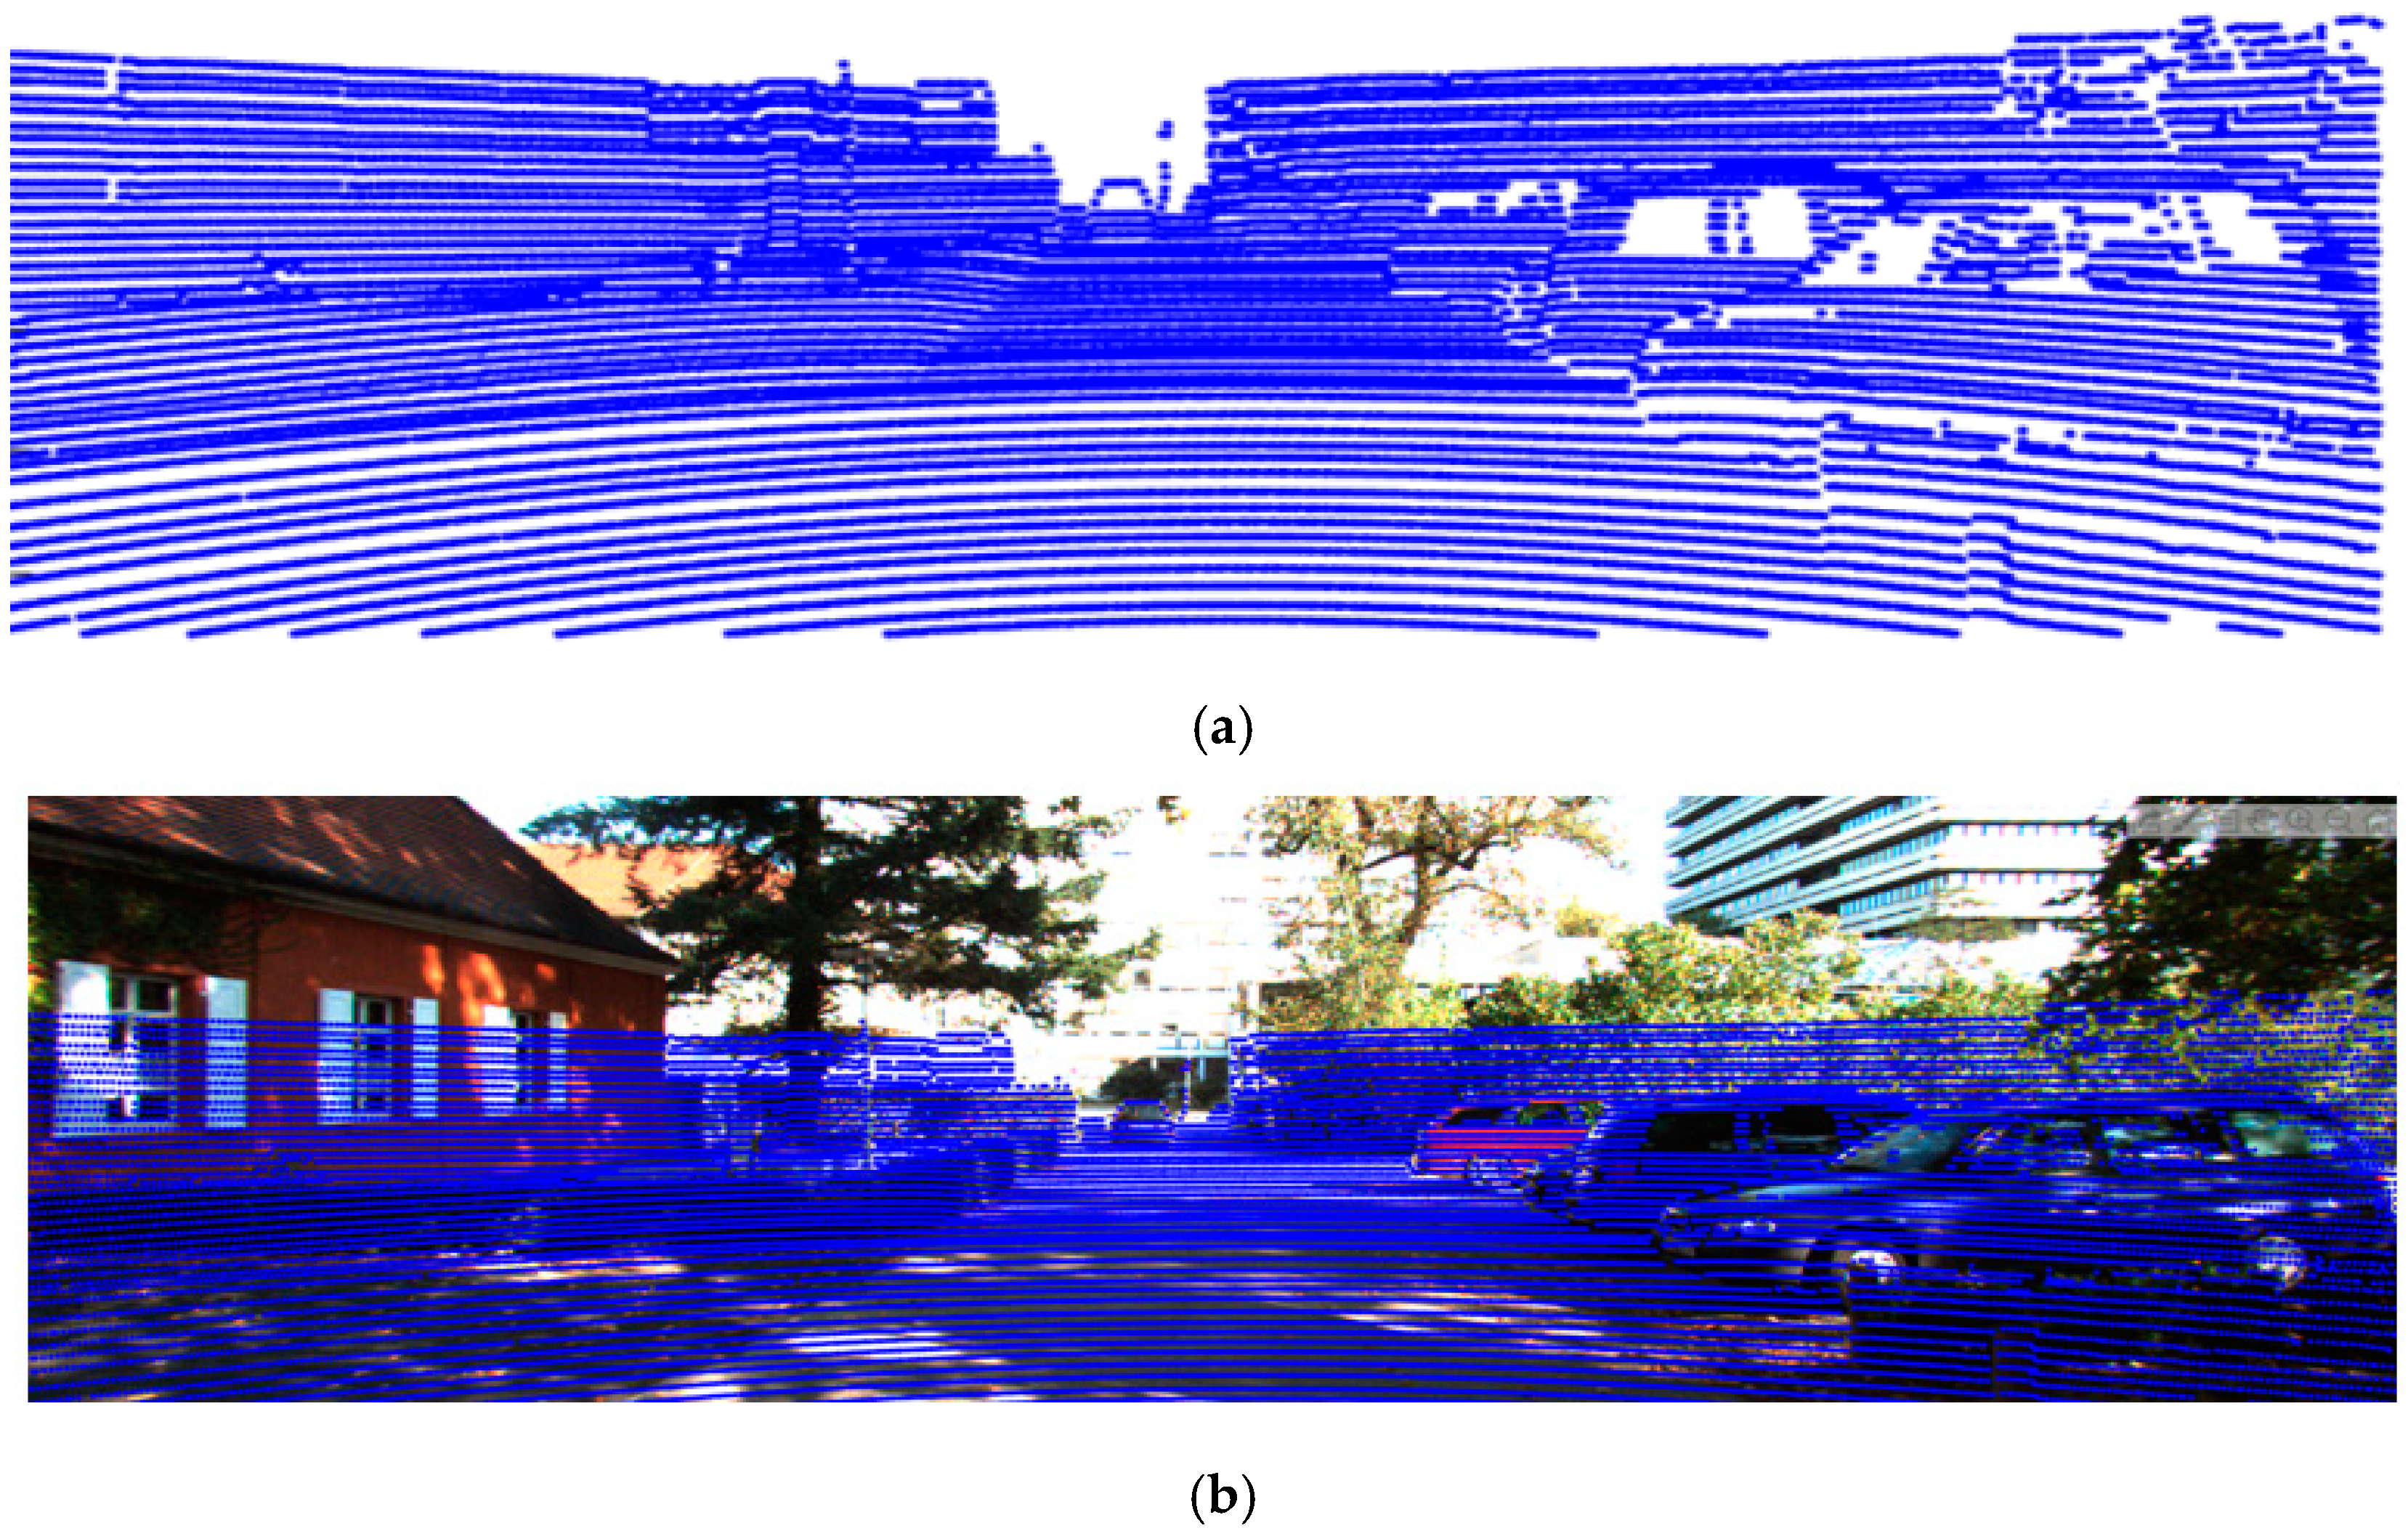
Through this process, the PCD projected by the 2D pixel coordinate system is illustrated in
Figure 6a, and
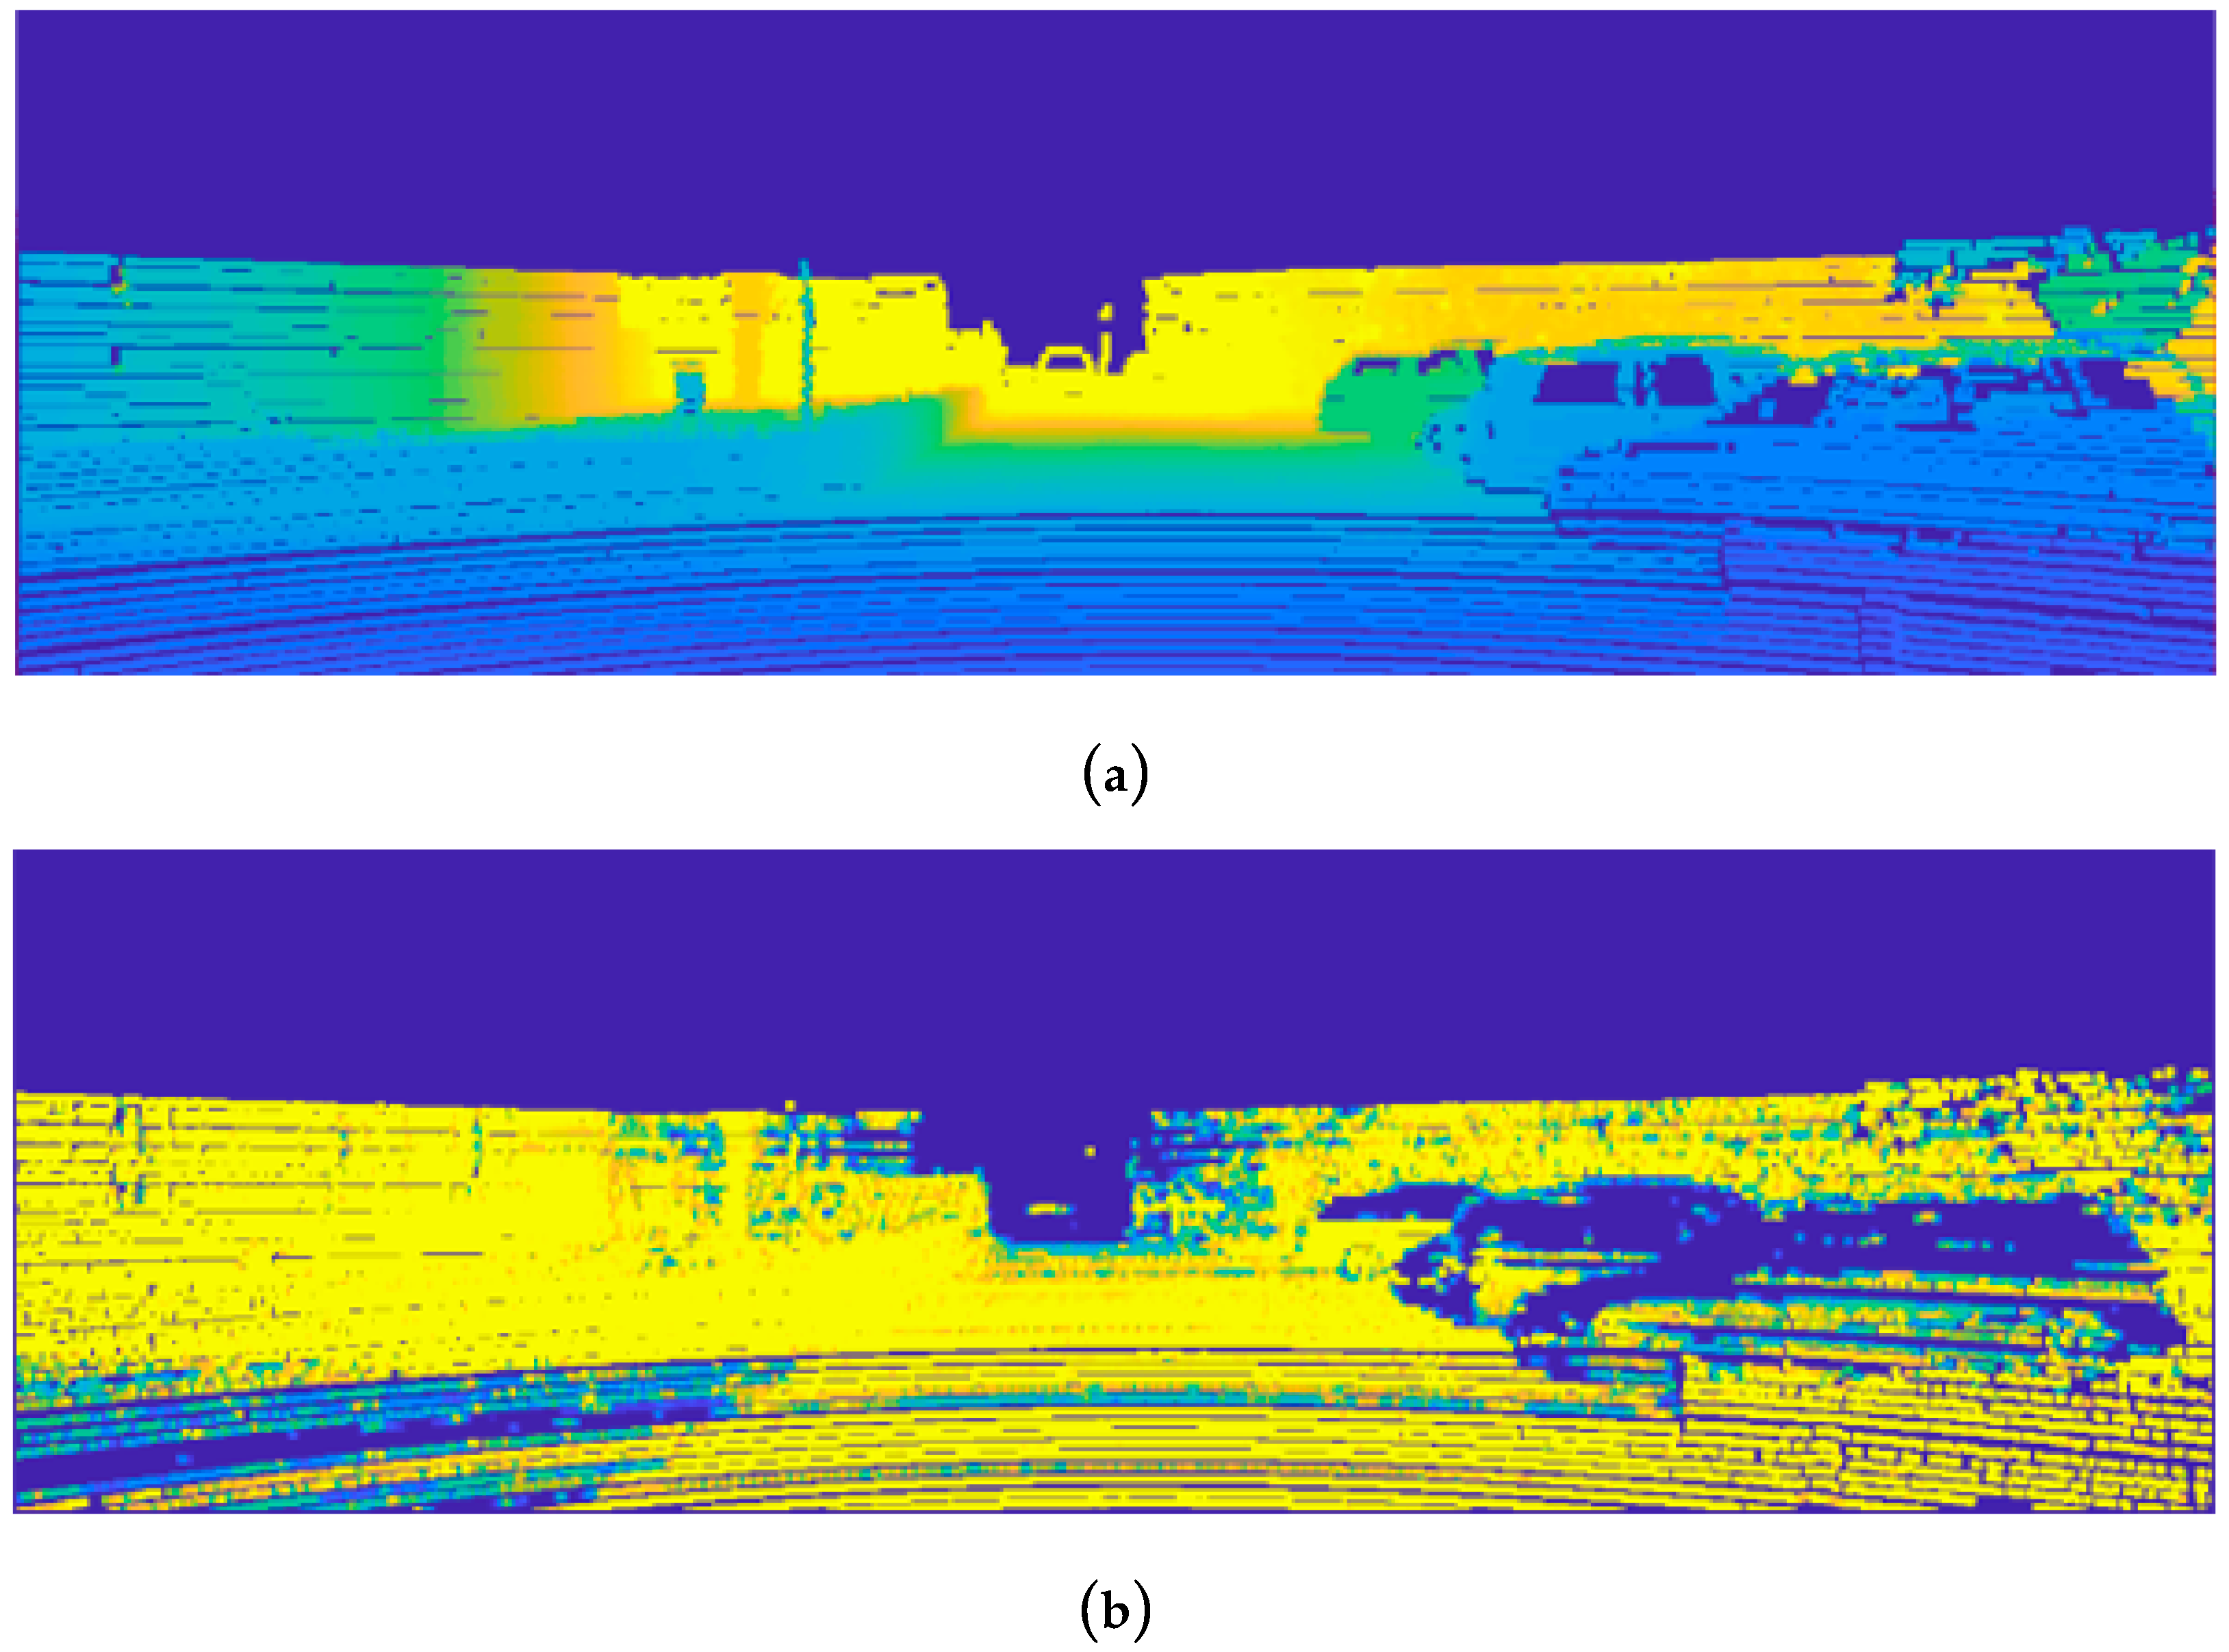
Figure 6b shows that the PCD is projected with a view the same as the FOV of the RGB camera. However, since PCD has much lower resolution than the original image, up-sampling for high resolution is performed using spatial interpolation based on bilateral filter [
24]. The scaled high-resolution depth map and the reflectance map are generated by applying the weighted pixel values obtained based on the distance and reflectance information of the pixels adjacent to the PCD projected on the image and the adjacent pixels, as shown in
Figure 7. The coordinates of the pixels of the depth map and the reflectance map are defined as
and
, respectively, and the coordinates of the pixels of the image data are defined as
.
3.2. Object Detection through Multimodal Mixture-Of-YOLO
After preprocessing, each YOLO model marked with Y-CM, Y-DM, and Y-RM is trained and optimized based on the color map, depth map, and reflectance map, respectively, so object detection proceeds independently. Each trained YOLO object detection model outputs the information of the bounding box,
, indicating the position and size of the object included in the data, and
, where
, indicates the detection result as a probability.
reflects the probability that an object is classified, and the bounding box,
, from the object detection result with high
has a high IOU because the area overlapping the bounding box of the ground truth is widened. In general, when there is more than one object, many object detection algorithms apply a non-maximum suppression technique that excludes all bounding boxes other than that with the highest confidence score. Rather, a weighted mean is employed to extract a more accurate bounding box, which results in better convergence of detection results. The element-wise mean of geometric information of the bounding box is obtained by weighting
of the detected objects from the three models as described in Equation (5)
When simply averaging the three bounding boxes without applying weights, they are fused based on the geometric information of each regardless of the ground truth. However, when the average of three bounding boxes is calculated using as a weight, the bounding box with a high IOU can be obtained because the IOU considers the ground truth. In addition, even if at least one of the three models of Y-CM, Y-DM, and Y-RM fails to detect an object, detection performance can be compensated by a weighted mean based on detection results from the other two models. In this way, the proposed object detection system composed of three YOLO models (Y-CM, Y-DM, Y-RM) and a weighted mean scheme is called a mixture-of-YOLOs with weighted mean defined by MYs-WM.
4. Experimental Results
The KITTI dataset used for performance evaluation in this paper was extracted from an urban area using a vehicle equipped with sensors such as RGB cameras and Velodyne LiDARs and consists of 7481 sequences of training data. The training data include nine types of objects and 51,867 labels, of which 65% (4860) were used for training, 35% (2621) were used for performance evaluation, and the objects were selected as cars and pedestrians. The OS of the workstation used for learning YOLO-v3 [
25] was Ubuntu 16.04.5 (4.15.0–38 kernel), and the GPUs were two GTX 1080 Tis (11GB). All parameters except the input data size of YOLO-v3 were used as default values provided by YOLO-v3. Since the resolution provided by the KITTI data set was 1242 × 375, the input data size of YOLO-v3 was modified from the default value of 416 × 416 to match the image resolution of the KITTI data set. The number of training epochs was set to 8000 for each YOLO model, and the performance evaluation of object detection was conducted based on average precision (AP), which is a performance evaluation indicator based on the PASCAL VOC IOU metric and undetected rate. AP is an evaluation index that takes into account both missed detection and false alarm rates and is defined by precision and recall, represented by Equation (6)
Here, correct detection of an object is a true positive (TP), while incorrect detection is a false negative (FN). If an object that should not be detected is not detected, it is considered a true negative (TN), and if an object is detected that should not be, it is considered a false positive (FP). Precision is the ratio of what the model classifies as true to what is actually true, and recall is the ratio of what is actually true to what your model predicts to be true.
Precision and recall are affected by IOU, and the numerical value representing the product (the area of the curve) of the increase in recall relative to precision according to IOU is defined as AP. For performance evaluation of the proposed object detection system, we set IOU to 0.7 for cars and to 0.5 for pedestrians according to the KITTI dataset. As mentioned earlier, the proposed system aims to enhance the performance of object detection by fusing all object detection results from Y-CM, Y-DM, and Y-RM through a weighted mean. Performance comparisons with the single-object detection systems (Y-CM, Y-DM, Y-RM) and [
1], where Faster R-CNN is applied to VGG-16 [
26] structure based on a RGB camera and a LiDAR, were conducted with IOUs of 0.3, 0.5, and 0.7, and the evaluation results are summarized in
Table 1 for cars and
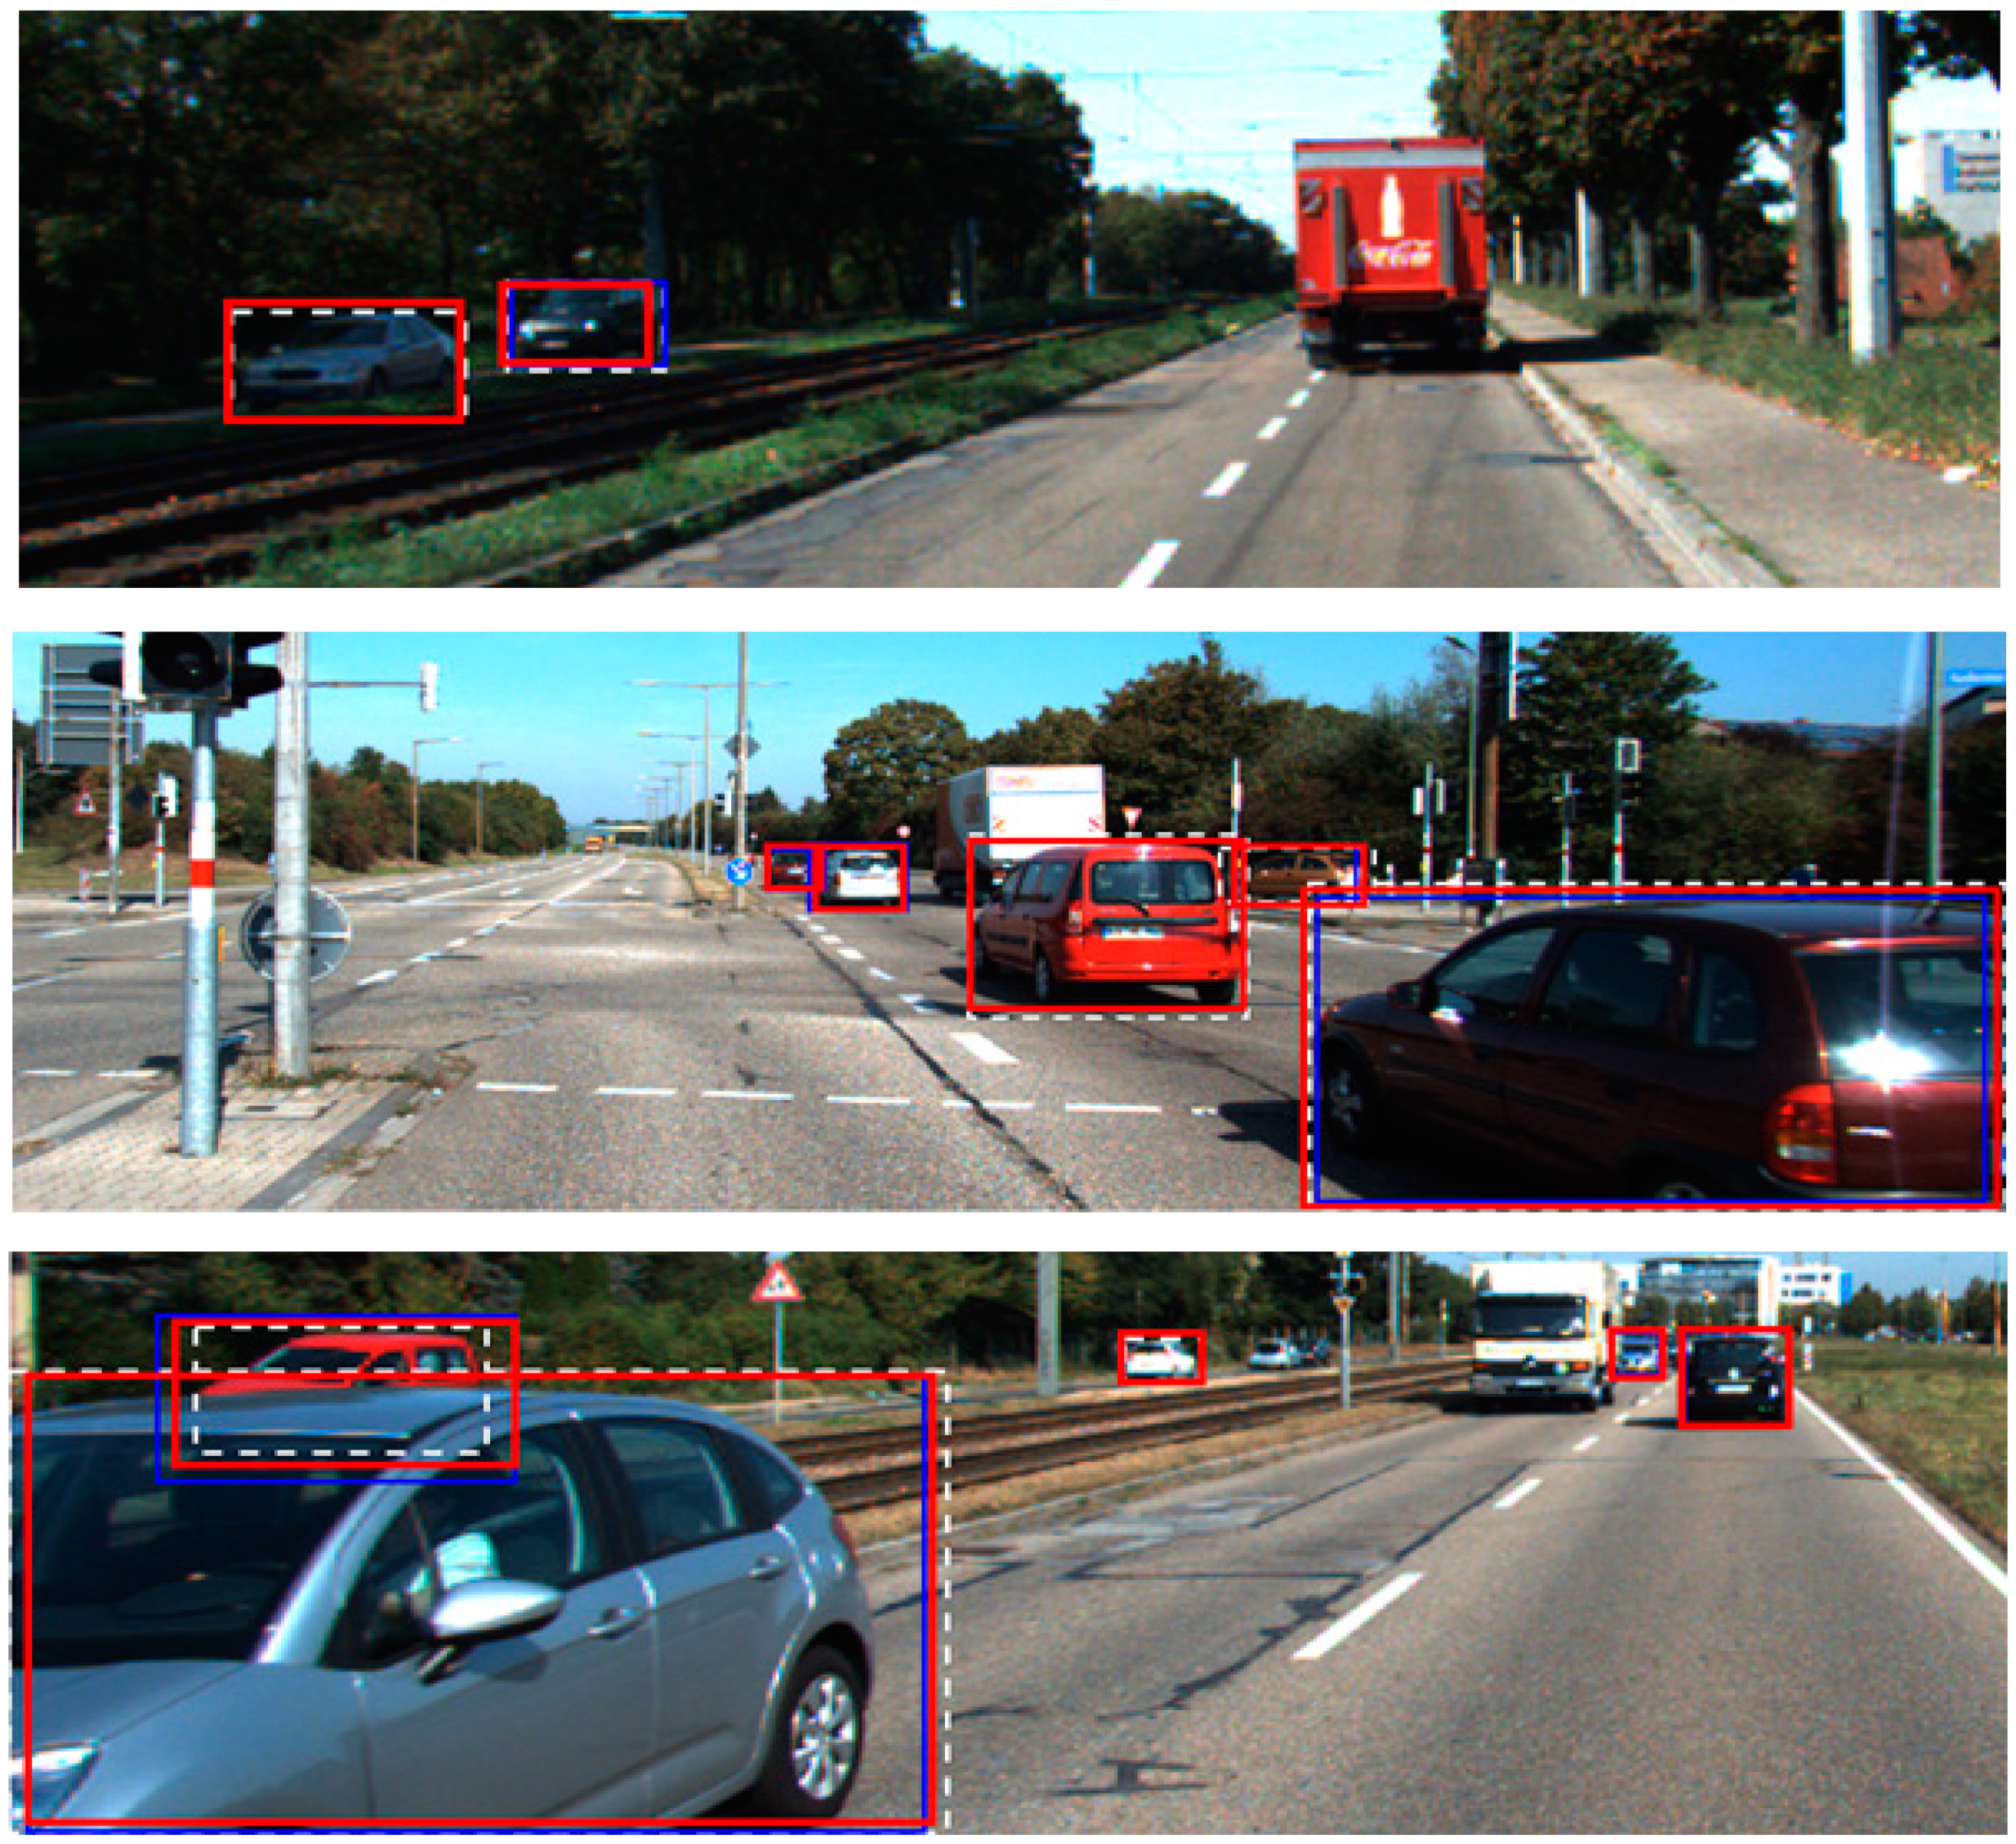
Table 2 for pedestrians. The results show that Y-CM had the highest detection performance of 87.12% (IOU = 0.7) for cars and 76.62% (IOU = 0.5) for pedestrians among the single-object detection systems, while Y-DM and Y-RM each showed about 16% lower detection performance. Although Y-DM and Y-RM have become high-resolution images through data preprocessing, the detection performance of Y-CM remains the highest since the resolutions of the depth and reflectance maps are less than 35–45% of those of the color map. However, since Y-CM is vulnerable to external environmental changes, detection performance of Y-DM and Y-RM may be better when the background is darkened by shadow or when a part of the object is obscured. Therefore, when the detection results of the single-object detection systems are different from each other, the performance can be improved through the proposed MYs-WM by reinforcement through result fusion. The detection result of the car through MYs-WM was improved to 89.83% (IOU = 0.7), and that of the pedestrian to 79.25% (IOU = 0.5), which is higher than that of the Faster R-CNN-based convergence system of [
1]. Examples of fusion detection results of MYs-WM in comparison with Y-CM are shown in
Figure 8 for cars and
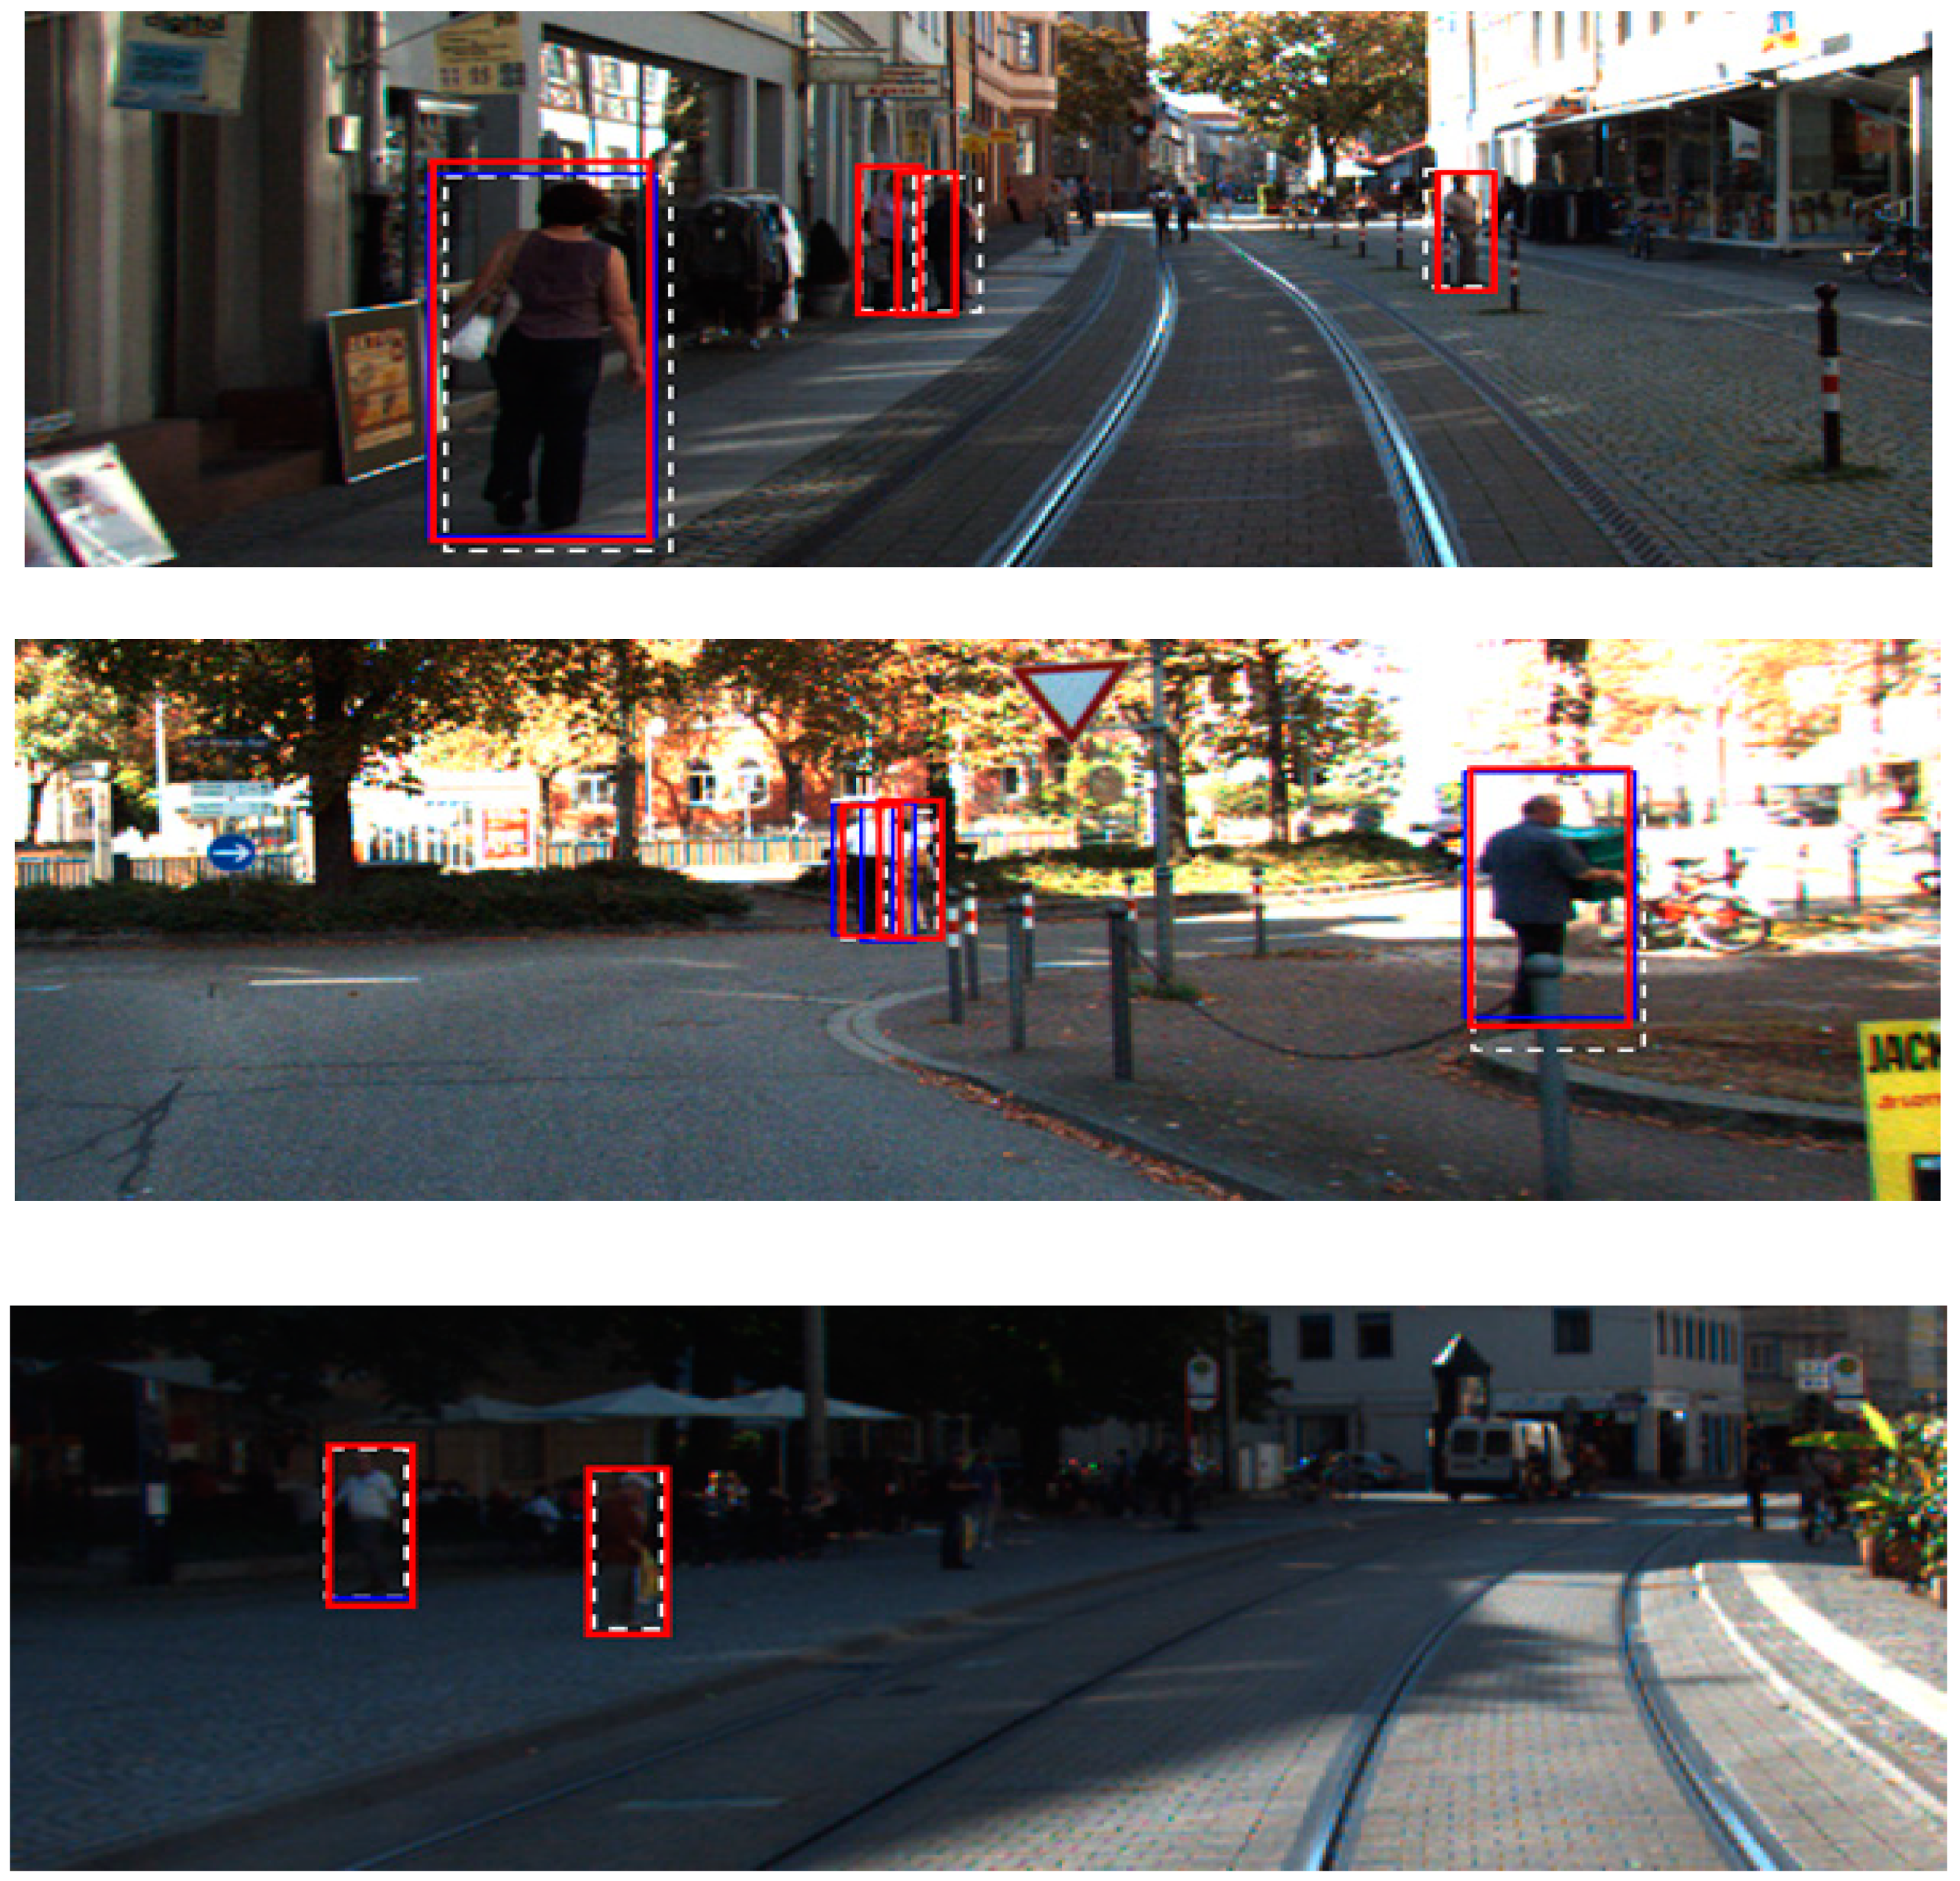
Figure 9 for pedestrians. In the figures, the white dotted line indicates the ground truth, and the red and blue solid lines indicate the bounding box of the object detected by MYs-WM and Y-CM, respectively. In particular, in
Figure 9, for the white bounding box representing the ground truth of pedestrians, Y-CM hardly detected pedestrians due to the shadow effect, while MYs-WM detected almost all of them.
The performance evaluation method for the KITTI dataset is generally divided into three difficulty levels of ‘easy’, ‘moderate’, and ‘hard’, depending on the size of the object to be detected and the degree of truncation. ‘Easy’ means ‘fully visible’ with at least 40 pixels, ‘moderate’ is ‘partial occlusion’ with at least 25 pixels, ‘hard’ is ‘higher occlusion’, and the number of pixels is equal to ‘moderate’ [
27]. Therefore, an additional performance evaluation was carried out based on AP and missed-detection rate according to the difficulty level of pedestrians and cars, and the detection results are presented in
Table 3 and
Table 4. Additional comparison and evaluation with [
28], a system of detecting objects by input of the left and right images from a stereo camera, its difference map, and the extracted features from PCD into the deformable part models were also performed.
For the detection of cars and pedestrians, the proposed MYs-WM showed the highest performance at all difficulty levels; in particular, MYs-WM showed much higher AP compared to [
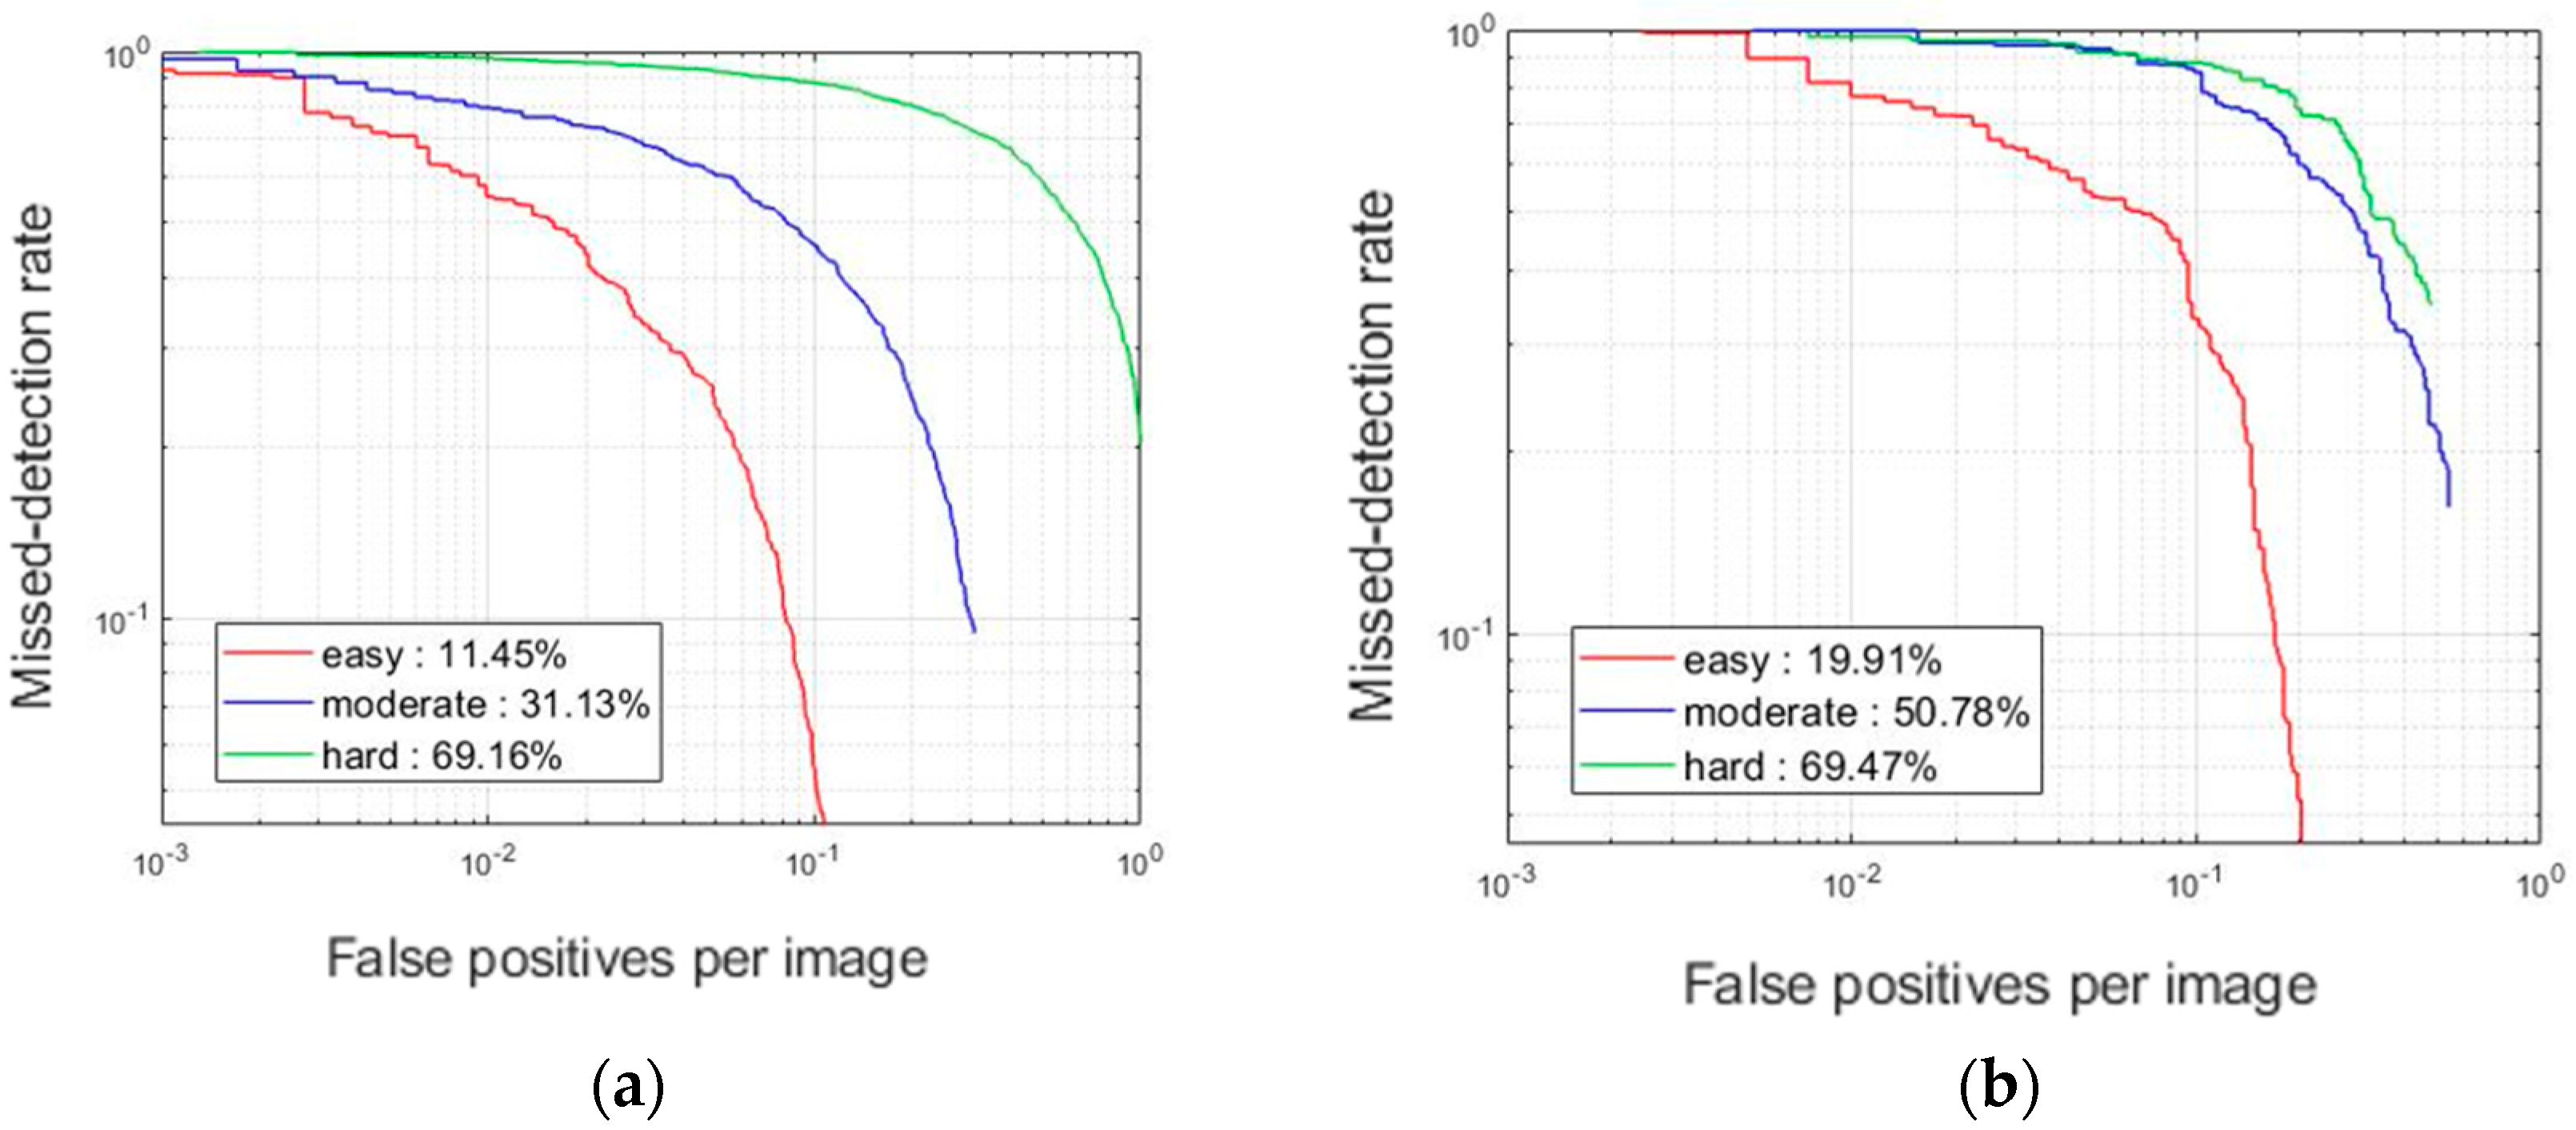
28] at difficulty levels of ‘easy’ and ‘moderate’. In addition,
Figure 10 demonstrates the effectively improved missed-detection rate of the proposed system. Improvement in detection performance is not as high with the new method at the level of ‘hard.’ This is because single-step object detection algorithms, such as YOLO or SSD, are relatively fast in real time compared to other object detection algorithms due to spatial constraints but are limited in detecting small objects rated as ‘hard.’ The CNN-based object detection algorithm extracts low-level features from the input image through the convolution layer and then classifies the objects through fully connected nodes. The smaller is an object, the more information about features extracted through the convolutional layer is lost. In particular, YOLO detects images divided into lattice regions using a single regression method, so the detection performance for small objects or multiple overlapping objects is lower than that of the two-stage object detection algorithm of the R-CNN series.
With the exception of the ‘hard’ level, MYs-WM showed relatively high detection performance compared to other detection systems. This is because the detection rate is improved by reinforcing the detection result even though the objects to be detected differ according to the characteristics of the sensor used in the proposed fusion system. Since RGB cameras express data through high-resolution pixels with a wide range of values from 0 to 255, the shape and color of objects are clearly expressed, and detection performance is high. However, detection performance is degraded when affected by external environmental factors such as lighting, shadows, and obstacles. On the other hand, a LiDAR uses a high-pulse laser derived from the sensor itself to acquire the reflected data and is robust to external environmental factors; however, its low resolution results in low object detection performance under normal circumstances.
Lastly, to evaluate the performance of RGB cameras that are vulnerable to changes in the external environment, the intensity of the image data applied to Y-CM is changed, and various environmental changes are simulated by adding Gaussian white noise. Bright contrast images are used to simulate lightning strikes or high beams, dark contrast images describe the interior of a tunnel or nighttime, and Gaussian white noise represents various external environments, such as snowy, rainy, or foggy weather. We added a constant 50 to decrease the contrast of the image, subtracted the same number to increase it, and generated Gaussian white noise with a zero mean and variance of 0.005 as typical noise in real environments.
Table 5 compares Y-CM and MYs-WM for each external environmental factor in terms of AP. It shows the detection results of Y-CM, which is greatly influenced by external environment change, and those of MYs-WM, which combines the detection results of Y-CM with those of Y-DM and Y-RM and is not significantly affected by external changes. Although the object detection result through the RGB camera is adversely affected by external environmental factors, the weighted mean of the object detection results through LiDAR can obtain much improved object detection results compared to Y-CM.


