Article

Interdisciplinarily Exploring the Most Potential IoT Technology Determinants in the Omnichannel E-Commerce Purchasing Decision-Making Processes

Department of International Business, National Taichung University of Education, Taichung 40396, Taiwan
Appl. Sci. 2020, 10(2), 603; https://doi.org/10.3390/app10020603
Submission received: 20 November 2019 / Revised: 6 January 2020 / Accepted: 7 January 2020 / Published: 14 January 2020
(This article belongs to the Special Issue Intelligent System Innovation)

Abstract

:
This research has interdisciplinarily employed the “SoLoMo” concept of Intern of Things (IoT) technology, Social Cognitive Theory and the Technological Acceptance Model (TAM) into the hierarchical Analytical Network Process (ANP) model of qualitative analysis in order to concretively construct the most comprehensive IoT technology model in the purchasing decision-making process of the omnichannel e-commerce model. Statistically, this research not only employed the Factor Analysis (FA) approach of quantitative analysis for systematically assaying the data results from the dispensation of large-scale questionnaires to refine the commonality of each sub-criterion with higher research representativeness and validity but it also applied the Fuzzy Set Theory (FST) and Grey Relation Analysis (GRA) methods of qualitative analyses for in-depth analytically evaluate the data results from the operation of expert’s questionnaires to refine the measured consequences of the ANP model with higher research accuracy and reliability. Conclusively, the “Purchasing Original Intentions” has been the most critical purchasing factors in the omnichannel e-commerce purchasing decision-making processes which means current omnichannel e-commerce consumers have commenced to firstly and rationally think over before making purchasing decisions and actions without any irrational consumptions. Conclusively, “Purchasing Importance-Purchasing Importance (PI)”, “Purchasing Financial Status-Purchasing Financial Status (PFS)” and “Purchaser’s Personality-Purchaser’s Personality (PP)” were the most potential IoT technology determinants in the omnichannel e-commerce purchasing decision-making processes because (1) omnichannel e-commerce consumers have been rationally focused on what they demand without traditional emotional purchasing consumptions, (2) omnichannel e-commerce consumers have rationally considered their financial resources without impulsive purchasing consumptions and (3) omnichannel e-commerce consumers have rationally respected their personal characteristics and individual value without blindly purchasing consumptions.

1. Introduction

As the hyper-dynamic development and popularization of telecommunication technology and mobile devices (such as notebooks, tablets, smart-phones etc.), most consumers not only singly surf and download information but they also further interactively share and upload news and information in real-time to diversified internet websites with the contemporary Internet of Things (IoT) technology, especially in purchasing transactions of Electronic Commerce (“e-commerce”) while pursuing the best quality of products and services at the lowest prices [1]. According to the latest annual 2018 Statista report of Global Electronic Commerce Trend and Statistic by Amasty Ltd. (“Amasty 2018 Report”), the worldwide retail e-commerce sales has reached 2.842 billion US dollars in 2018 from 2304 billion US dollars in 2017 as shown in Figure 1. In 2019, the worldwide retail e-commerce sales is expected to increase to 3453 billion US dollars with a projected growth rate of the entire e-commerce market of 21.49% in 2019. This growth is the result of the various technological functions and applications of emerging development in artificial intelligence, such as big-data mining, big-data analysis, augmented reality, virtual reality and so forth.
Based on the Amasty 2018 Report, the e-commerce market share in Asia surpassed 50% of the global e-commerce market beginning in 2017. It was crucial to recognize that Asia is responsible for half of the mobile commerce market. China, United Arab Emirates and Turkey have the highest number of mobile shoppers in entire world, with 68%, 57% and 53% of their respective total population. Momentously, India, Taiwan and Malaysia have replaced Japan, the United Kingdom and South Korea with the three highest growth rates countries in the e-commerce market. In order to understand the e-commerce customer’s purchasing-decision behaviors, the Amasty report specifically delivered two surveyed conclusions—(1) eight out of ten e-commerce customers in the IoT era use their smartphones as in-store shopping assistants while shopping in brick and mortar stores and (2) 78% of e-commerce customers were influenced on integrating e-commerce and in-store experiences during in-store purchases. In succession, due to the diversified applications of e-commerce technology in various industries, Omnichannels e-commerce has been formed to cover abstract and concrete commerce trades and platforms including physical stores, computers, kiosk machines, IoT internet websites, social media, online catalogs, smart phones, gaming consoles and so forth. In order to detect this such profitable niche and develop a trend in current omnichannels e-commercial market [2], “how to delve into the most potential IoT technology determinants in the omnichannels e-commerce purchasing decision-making processes” has been the critical research mainstream [3] for creating the most effective profits and commercial niche [4] in this contemporary hyper-dynamic and hyper-competitive omnichannels e-commerce era. After making a series of comprehensive surveys [5,6,7,8,9] in the omnichannels e-commerce market, there is no one to be able to simultaneously analyze the interplays and dependences between IoT technology and the purchasing-decision behaviors in contemporary omnichannels e-commerce relative research fields. The reason is the majority of purchasing-decision researches in omnichannels e-commerce research field have only focused on increasing the effectiveness of purchasing trade processes or the wonderful expressions of products or services without the comprehensive considerations of the technological in-depth influences in consumer’s purchasing-decision and the extensive correlations among individual customers, consumer groups and society as a whole. Significantly, these are the most critical synergism, influences and correlations of IoT technologies existing among individual customer, consumer groups and society with the broader technological influences of IoT technology.
For this reason, in order to quantify the broader technological influences of IoT technology [10], the Technology Acceptance Model (“TAM”) [11] was firstly going to be directly employed to verify the interplays dependences among customer’s individuals, consumer’s groups and society with the broader technological influences of IoT technology in current omnichannels e-commerce purchasing decision-making processes. In consideration of theoretical concept of TAM model, this was accomplished through five assessed dimensions (external variables, perceived usefulness, perceived ease of use, attitude toward using and behavioral intentions to use) of the TAM model in order to induce the user’s behavioral intentions [12] as shown in Figure 2.
Furthermore, in order to empirically and extensively assay the interactive impacts and relationships of the broader technological influences of IoT technology, the “SoLoMo” (Society-Localization-Mobility) concept was systematically developed and integrated by John Doerr, a corporate partner at Kleiner Perkins Caufield & Byers, in 2011 for extensively exploring the interplays among users, organizations and society on diversified websites due to the rapid development of high-speed transferred wireless and telecommunication technologies with popular 3C electronic devices. Doerr’s concept also explored three preliminary technological elements—consisting of Socialization (“So”), Localization (“Lo”) and Mobilization (“Mo”) functions [12] to completely assay the technological information-flow of current diversified IoT technology websites because each IoT technology user has been upload individual information (Mo Feature), such as personal photos, videos and comments, emoticon sticker and so on, with local news (Lo feature), for example, tag location, check-in location and so forth., to society who they friended them (So feature). In continuously, this was done because most current IoT technology users have been able to surf, share and edit individual information into various digital channels of IoT technology through the usage of their various mobile electronic devices to immediately receive and send news, messages, picture, information, videos, real-time connection in anytime and anywhere.
In order to discuss the influences and correlations among individuals, organizations (groups) and society in the current e-commerce of IoT characteristics, Miller and Dollard [13] first created the Social Cognitive Theory (“SCT”) to take various diversified interplays and correlations among individual behaviors, organizational conditions and social circumstance. In succession, Pritchard [14] further explored the brief Social Learning Theory (“SLT”) concepts to develop SCT for resupplying the research gap, “People are viewed as self-organizing, proactive, self-reflecting and self-regulating rather than as reactive organisms shaped and shepherded by environmental forces or driven by concealed inner impulses” [15]. In succession, the SCT was comprehensively applied to discuss these correlations from three essential perspective roles in the systematic analysis section of this research. These three perspectives are comprehended customer (user individual aspect; behaviorism), company (organizational group aspect; organizationalism) and society (societal entity aspect; socializationism) with the three digitalization-information peculiarities (mobility, immediacy, social-networking) [16]. For the reason, SCT covers three main theoretical concepts of the three interactive-circle influenced dependences among this three essential perspective roles [17]—(1) individual behaviors have always constructed and influenced the development and decisions of groups and even societies because the individual is an essential character (unit) of their belonging group and society and (2) group development not only impact individual concepts and behaviors but it also form the growth tendency of the entire society and (3) the social growth tendency indeed is affected by the concepts and behaviors of each individual and group because individuals and groups both have the instituted elements of the entire society. Therefore, in order to effectively and efficiently achieve the main goal of the research, the three main characteristics “SoLoMo” of IoT technology and the three essential elements of the SCT theory were comprehensively consolidated into the TAM model. Specifically, this was accomplish in order to simultaneously analyze the most critical synergism, influences and correlations among individual customer, consumer groups and society in consumer’s purchasing-decision processes of omnichannels e-commerce by means of the consideration of three purchasing decision-making models comprise of the Howard-Sheth (“HS”), Parasuraman, Zeithaml and Berry model (“EZB”) and the Nicosia (“NI”) model for in-depth synthetizing a series of purchasing initially intention and thinking of HS models, analysis and comparison of NI models as well as choice to final buying-action of EZB models in customer’s purchasing behaviors in omnichannel e-commerce [18,19,20,21].
In statistics, in order to concretize the evaluation of the most critical synergism, influences and correlations among individual customer, consumer groups and society, the Factor Analysis (“FA”) approach of quantitative analysis in the Multiple Criteria Decision Making (“MCDM”) methodology was firstly employed to detect the complexity and dependences of each appraised factor by calculating the communalities of the weighted results of 100 collected questionnaires from omnichannel e-commerce IoT customers in order to refine appraised factors for higher research validity and representations, based on the original statistical features of the regression analysis of FA approach [22]. Then, in order to synthetically establish the most effective IoT Technology Determinants in the Purchasing Decision-making Processes of Omnichannel E-commerce Evaluated Model (“IoTDPOEEM”) to identify the most potential IoT Technology Determinants in the Purchasing Decision-making Processes of Omnichannel E-commerce (“IoTDPDOE”), the hierarchical Analytical Network Process (“ANP”) model of qualitative analysis in the MCDM methodology was applied to construct the IoTDPOEEM to comprehensively achieve the goal of this research. The reason is that the hierarchical ANP model was originally designed to deeply and hierarchically assay the interactive impacts and connectivity between each evaluated factor through specific pair-compared weights matrix of the measurements of the ANP model.
Significantly, the Fuzzy Set Theory (“FST”) and Grey Relation Analysis (“GRA”) methods of qualitative analyses in the MCDM methodology were both going to be hierarchically cross-applied in order to refine the research accuracy and preciseness of weighted questionnaire results through a series of standardized calculations of the triangular fuzzy numbers of the FST method and greified numbers of the GRA method among each appraised criterion. The brief advantage was that the FST method was creatively inducted to effectively minimize the linguistic ambiguousness of interviewees of the questionnaires in order to exactly recognize the interviewees’ real comments. Furthermore, the main advantage was that the GRA method was further inducted from the FST method in order to diminish more efficiently the semantic indistinct in the expression of questionnaire interviewees and practically overcome a series of questionnaire collection mistakes, such as missing data, double answer and so forth. Therefore, the FST and GRA methods of qualitative analyses indeed efficaciously increased the research accuracy and reliability [23]. Ultimately, this research has not only comprehensively consolidated the three main “SoLoMo” characteristics of IoT technology and the three essential elements of SCT theory into the TAM model for achieving the highest research validity but it also systematically cross-employed the FA approach of qualitative analysis and ANP model and FST and GRA methods of quantitative analyses to construct the most effective IoTDPOEEM model for inducing the most potential IoTDPDOE. Hence, this research was able to academically resupply the interdisciplinary research gap between the contemporary IoT technology and omnichannel ecommerce relative research fields and also empirically provide the most effective corporate strategy of the most potential IoT technology determinants in omnichannel e-commerce purchasing decision-making processes.

2. Methodological Literatures

2.1. Three Purchasing-Decision Modes in Purchasing Decision-Making Processes

In consideration with the purchasing-decision procedures in an omnichannel ecommerce environment, the three essential mainstream models were the Howard-Sheth (“HS”), the Nicosia (“NI”) and Parasuraman, Zeithaml and Berry (“EZB”) modes. Firstly, the HS model was discussed in the dependences among information downloading and uploading, productions and services prices, purchasing behavior completion in the original concepts of purchasing decision process and behaviors through exquisitely assessed implementations on every elements [24], comprising of (1) imputed factors (or stimulated factors), (2) external influenced factors, (3) internal factors and (4) outputted factors (responding factors) [25] as demonstrated in Figure 3. Therefore, “exogenous variables” of the HS mode was expanded as the appraised session to the “External Variables” in TAM model, “perceptual constructs” of HS was clarified as the assessed session to the “Perceived Usefulness” in TAM model and “output-environmental-impacted variables” was categorized as “Behavioral Intentions to Use” in TAM model.
Behind the development of HS mode, the fundamental concepts of EZB mode was formed to be discussed in the essential concept that the customer’s decision in purchasing procedures was kind of a dark-decision box [26] because the most of customers always have been influenced by internalized the external stimulations including corporate marketing strategy effects (ex. promotion) and social environment influences (ex. culture difference) as shown in Figure 4. Marvelously, the rapid development and popularization of mobile electronic devices, the customers have finally been able to make a suitable purchasing decision regarding price and quantity by obtained enough information from digital websites and internet in anytime. Hence, the more and more companies have been supporting and devoting to analyze the core and potential factors of the customer’s decision in purchasing procedures under diversified e-commerce era for creating the highest profitable niches. In response to deeply understanding the purchasing-decision making process, the Henry’s fundamental concepts was further explored to construct the specific EZB mode [27]. Conclusively and subsequently, the “Decision Process” of EKB mode can be clarified as “Attitude toward Using” and “Behavioral Intentions to Use” in TAM model.
Behind the development of the HS and EKB models in assaying the customer’s purchasing procedures, the HS model was further induced to the NI model for assaying the consumer purchasing decision-making behaviors procedures [28,29]. There are four basic conditioned elements in the three sessions (information flow, information search & decision assessment and purchasing behavior) of the NI mode in succession with comprehensive recognition of the impact of customer’s individual condition on information-flow in purchasing procedures as described in Figure 5. In subsequence, the basic four conditioned elements in the e-commerce are (1) the entire company’s information (such as delivery methods, brand image and so forth.) does directly influence customers’ internalized purchasing motivation of the consumers’ purchasing decision-making, (2) the customer’s purchasing motivations formed the investigation and evaluations regarding products or services, (3) the customer’s concrete purchasing behaviors are definitely depended on their own earlier buying experience during they are executing the purchasing decision-making behaviors and (4) external circumstance things indirectly or directly affects not only the original abstract purchasing motivation but also the final concrete buying action. In response to the analytical characteristics of the NI model, the “Second session-Information Search & Decision Assessment” was specifically applied to define as the “Perceived Ease of Use” in TAM as described in further Figure 6.
In summary, the essential characteristics and elements of HS, NI and EZB modes purchasing process modes did not consider the in-depth and extensive influences of the swift technological development. Therefore, in order to supply this research gap, the main research framework was able to be illustrated in Figure 6 by means of the creative and interdisciplinary consolidations among the three brief elements of SCT, the three main concepts of “SoLoMo” of AI and technological recognition of TAM model into the hierarchical ANP model of qualitative analysis for the highest research validity but also FA approach, FST and GRA methods of quantitative analysis in MCDM methodology into the construction of the most potential IoT technology determinants in purchasing decision-making processes of omnichannel e-commerce.

2.2. Statistic and Soft Computing Concepts and Methods

In connection with the increment of research validity and representativeness, FA approach of quantitative analysis was first employed to manage the weight-measurements of the questionnaires from the random 96 valid e-commerce customers. This was done in order to identify the technological determinants in the purchasing-decision behavior but FST and GRA methods were also both applied to further measure the questionnaire results from the fifteen experts in the relative AI technologies and e-commerce of IoT relative research fields. In association of the FA approach development, the FA approach was designed to be utilized to assess the correlation coefficient among each analytical variable in order to acquire communality between each appraised factor [30].
In succession, the component analysis and principle structures and analyses was explored for completing the FA approach in order to prompt two similarities of problems in relative research topics [31]. Subsequently, the regression concepts for expressing the two principle analytical factors [32] (the directly observed influenced factors are presented as y 1 , y 2 , …, y k and the directly unobserved influenced factors are presented as x 1 , x 2 , …, x k ) into the FA approach evaluated measurements for inducing two principle appraised methods (exploratory factor analysis and confirmatory factor analysis) increment of research validity and unique factor to finally calculate the communalities between each appraised criterion. Therefore, the Equation (1) of between the two principle analytical factors of FA approach [33] can be described as
y k = w k 1 x 1 + w k 2 x 2 + + w k L + n k
s.t. y 1 , …. , y k is dependent variables, x 1 , …. , x L is independent variables, w 11 , …… , w k L is the autocorrelations between dependent and independent variables and n k is constant of FA approach.
Then, in order to refine the technological determinants in purchasing-decision behavior in a contemporary omnichannel e-commerce era from the measured results of the FA approach, the questionnaires given to the fifteen experts were surveyed and measured by the ANP model because ANP hierarchical model was created to systematically and comprehensively identify and appraise the interplays and relations among the assaying goal, evaluated patterns, assessable criteria and sub-criteria and potential selected candidates through the hierarchical analyses and weighted measurements in pairwise comparison matrix. According to the original theoretical concept of the ANP model, the Analytical Hierarchy Process (“AHP”) model was able to verify the original decisive hypothesis principle (variable) and the “independence” among each analytical assessed criterion [34]. Then, in order to deeply handle “dependence” among each analytical criterion with reference to the complex development of research topics and issues, the hierarchical ANP model was further induced from AHP model. In statistic, the dependence among each analytical criterion was estimated in the positive reciprocal matrix and supermatrix and the more complex analyses to generalize the results of the surveyed data by means of the weight-calculations of the questionnaires in the various, comprehensive, limited-resource and difficult-decision conditions. In statistics, the hierarchical and systematic measurements process of each related-impacted factor were organized to develop four main hierarchies [35]. In order to verify research validity, the consistency between each analytical criterions of research topic or issue, second-hierarchy for appraised attitudes, third-hierarchy for assessed criteria, forth-hierarchy for evaluated sub-criteria and the final fifth hierarchy and the candidates have to be computed by means of the each pairwise matrix assessments of the two-stage algorithm (the Consistency Index, “C.I.”) and Consistency Ratio (“C.R.”) of ANP method [36]. The equation of C.I. and C.X. were described as
C . I . = ( λ max n ) / ( n 1 ) ;   R w = λ max w ;   w i = j = 1 m ( R i j / i = 1 m R i j ) / m   ;   C . R . = C . I . / R . I .
In sight of research consistency of surveyed data, the acceptance of consistence is the C.R. number of pairwise-comparison matrix must be lower than 0.1. Specifically, in order to effectively arise the accuracy of questionnaire weights, the total assessable numbers ( i = 1 n W i n ) was further indicated to calculated in each hierarchical criterion weight measurement in FST measurements [37].
Significantly, “FST and GRA methods of qualitative analyses in MCDM methodology were both going to be hierarchically cross-applied to further minimize most of questionnaire measurement errors, such as linguistic obscure and ambiguousness in the questionnaire weighted results and so on, in order to efficaciously increase the research accuracy and reliability decrement. Therefore, the fuzziness has always existed in the human recognition or inductiveness under handling the more complex questions or issues [38]. For the reason, FST method was utilized to address the fuzzification computational mathematics to quantify the human fuzziness for directly complete the decision-makers’ concepts and thinking in the decision-making procedures [39]. Eventually, through implementation of the fuzzification computational mathematics, not only the decision-makers concepts and recognition have been able to be directly increased and expressed but also the uncertainty, missing or unpredicted errors of the linguistic obscure and ambiguous have been able to be decreased and avoided in decision-making procedures. Momentously, the triangular fuzzy measure was the essential defuzzified approach in the FST method and therefore, the triangular fuzzy number and trapezoidal fuzzy number have been two brief measured numbers in fuzzification computational mathematics and the triangular fuzzy number were expressed as A ˜ = ( l , m , u ) ; l m u ; l 0 and the fuzzification function as μ A ˜ ( x ) [40]:
μ A ˜ ( x ) = x l m l , l x m u x u m , m x u 0 , o t h e r w i s e
Consequently, the S [A,B] was defined as the eigenvector of the FST method to calculate the fuzzy sets weights ( W 1 , W 2 , , W n ) of the triangular fuzzy number and the trapezoidal fuzzy number and the equation of the S [A,B] between two measured eigenvectors ( A 1 = ( c 1 , a 1 , b 1 ) and A 2 = ( c 2 , a 2 , b 2 ) ) was able to be described as [41]
S   [ A , B ]   =   d 2 ( A 1 , A 2 ) = ( a 1 a 2 ) 2 = ( ( c 1 + a 1 ) ( c 2 + a 2 ) ) 2 4 + ( ( b 1 + a 1 ) ( b 2 + a 2 ) ) 2 4 ; α = ( D * + D * ) 2 + ( c 1 c 2 + b 1 b 2 ) 8 ;   D * = ( a 1 + b 1 ) ( a 2 + b 2 ) 2 ;   D * = ( a 1 + c 1 ) ( a 2 + c 2 ) 2
Furthermore, in order to strengthen the defuzzified measurements, all surveyed data is a kind of “grey system” was defined from the locates between black system (negative side) and white system (positive side) in the Grey System Theory (“GST”) from three analytical conditions—the analytical goal belongs efficient goal and satisfies the maximized analytical goal (the Larger The Better, “LTB”); the analytical goal belongs cost goal and satisfies the minimized analytical goal (the Smaller The Better, “STB”) and the analytical goal belongs specific goal (Nominal The Best, “NTB”) [42]. Moreover, the GRA method of GST was induced to quantitatively compute the greified numbers of between each influenced factor to deal with the patterns of uncertain research problems and uncertain and incomplete information of each evaluated criterion or factor. The three function of LTB, STB and NTB can be illustrated as
L T B , x i * = ( x i ( 0 ) ( k ) min x i ( 0 ) ( k ) ) / ( max x i ( 0 ) ( k ) min x i ( 0 ) ( k ) )
S T B , x i * = ( min x i ( 0 ) ( k ) x i ( 0 ) ( k ) ) / ( max x i ( 0 ) ( k ) min x i ( 0 ) ( k ) )
N T B , x i * = 1 ( x i ( 0 ) ( k ) O B / max max x i ( 0 ) ( k ) O B , O B min x i ( 0 ) ( k ) )
s.t. x 1 , …. , x L is independent variables; OB presents an average value of independent variables.
As a result, the Equations (1)–(4) was consolidated to form the comprehensive Equation (5) in order to measure the fuzzified Synthetically Comparative Index Numbers (“SCINFST”) of each potential candidate in ANP model of the most comprehensive omnichannel e-commerce purchasing-decision evaluation model as
S C I N F S T ( k L ) = k = 1 n j = L n F A k F S T L
s.t. k presents the number of dependents variable; L presents the number of independents variable; k = 1 n F A k is communality of FA approach; L = 1 n F S T L presents the fuzzy sets weights of the S [A,B].
Continuously, in order to increase the research accuracy and validity, the Equations (1)–(4) was consolidated to form the comprehensive Equation (6) in order to measure the greified Synthetically Comparative Index Numbers (“SCINGRA”) of each potential candidate in ANP model of the most comprehensive omnichannel e-commerce purchasing-decision evaluation model as
S C I N G R A ( k L ) = k = 1 n L = 1 n F A k G R A L
s.t. k = 1 n F A k is communality of FA approach, k = 1 n G R A k presents greified numbers.

3. Research Design

The research design was distinctively followed as the four brief research procedures, including (1) identifying the relative theories and models in order to achieve the research topic, (2) organizing the main framework and methodology in order to construct complete measured processes, (3) collecting the necessary surveyed data for entire model evaluation and analyses by the random and Delphi methods and (4) analyzing the measured results in order to make a comprehensive conclusion and recommendation.

3.1. Surveyed Data

First of all, in terms of the increment of research reliability, the 5-Likert’s surveyed scales of related interdependence and importance from equal important (1) to extreme important (5) was designed in the questionnaires of ANP model in order to measure the fuzzy transitivity, comparing weights, appraised criteria in the estimating positive reciprocal compared matrix and supermatrix. Subsequently, in response to research design, two types of questionnaires were used in this research. The first 100 omnichannel e-commerce customers questionnaires was randomly collected, in person, from Taipei and Taichung Train Stations and these omnichannel e-commerce customers all have over 5 years of purchasing experiences through e-commerce websites. After executing the 100 collected questionnaires, only 96 questionnaires were identified as properly completion without any missing information. In order to refine the measured accuracy and research validity, the second questionnaire used was collected from 15 professional experts in IoT technology and onmichannel e-commerce research fields. The questionnaires of these 15 professional were gathered by means of the Delphi method for measurement in the hierarchical ANP model. With reference to the collection of surveyed data from the 15 professional experts, the least errors of validity and reliability appears when the collected questionnaires are, at least, over 10 professional interviewees in the total surveyed data [43] of the Delphi method and expertise brainstorm approach. The first-group 5 professional experts (empirical perspective) includes the 3 surveyed experts were organized from the most representative senior professionals who have published a column in a relative omnichannel e-commerce publications and other 2 surveyed experts were covered in the most the most representative senior professionals who have a column in a relative IoT technology publications. Continuously, the second-group 5 professional experts (industrial perspective) covers the 2 senior managers who have over 10 years working experience in the e-commerce relative industry and other 3 senior managers who over 5 years working experience in the IoT technology relative industry. Lastly, the third-group 5 professional scholars (academic perspective) comprehended 3 professional scholars who have over 5 years in the relative omnichannel e-commerce research fields and other 2 professional scholars who have over 8 years in the relative IoT technology research fields.

3.2. Evaluated Criteria

Based on Figure 7, in consideration with the most effective IoTDPOEEM model was definitely able to systematically construct by means of the assessments of the main 17 features of IoT technology in order to effectively supply the correlations and interactives between IoT technology and the purchasing decision of omnichannel e-commerce research fields. Momentously, these the main 17 features of IoT technology were further identified and categorized into TAM model and three purchasing process modes to be considered as sub-criteria in ANP model of qualitative analysis. In detail, these seventeen sub-criteria were described in the fundamental construction of the measured ANP model as:
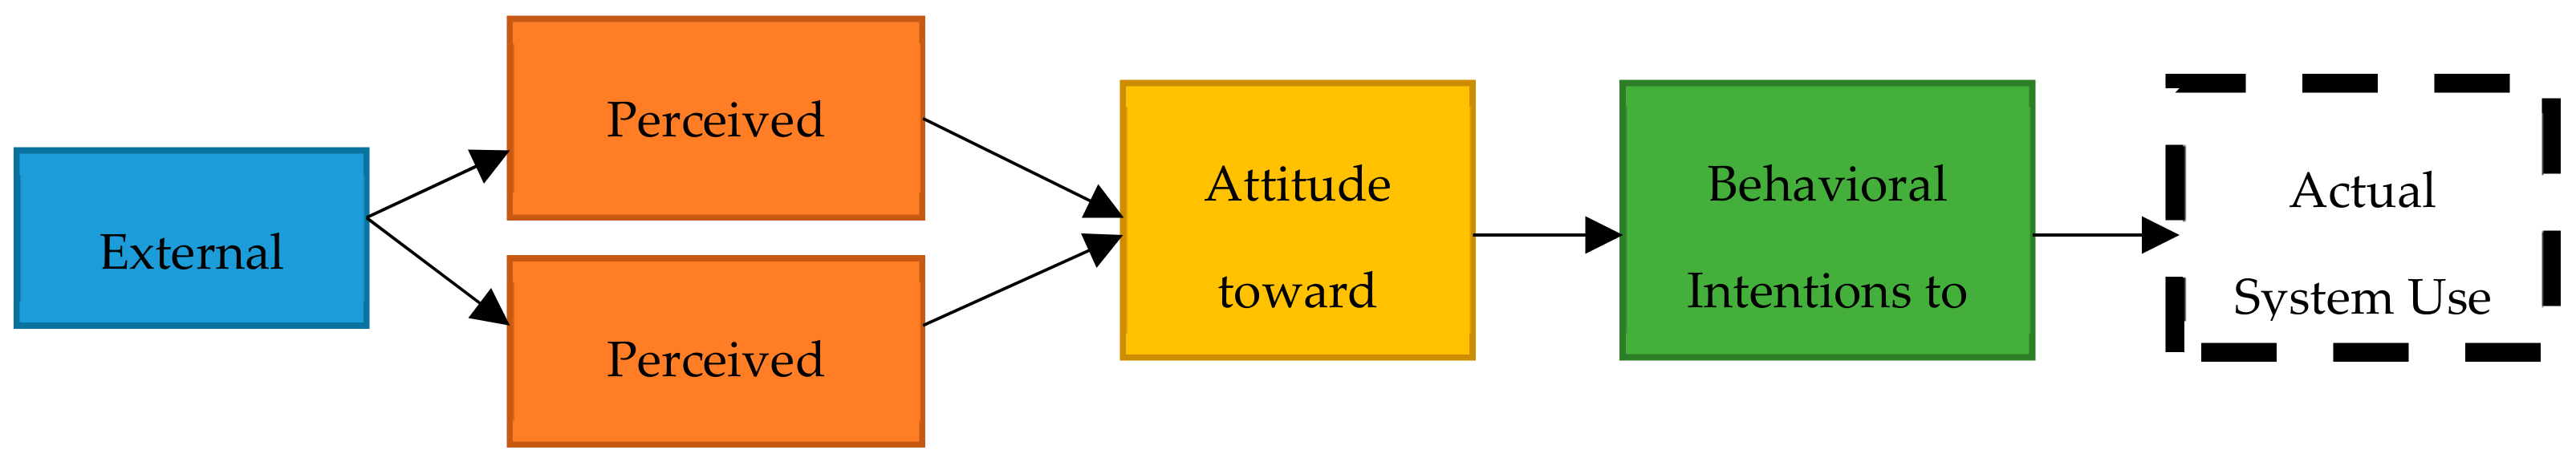
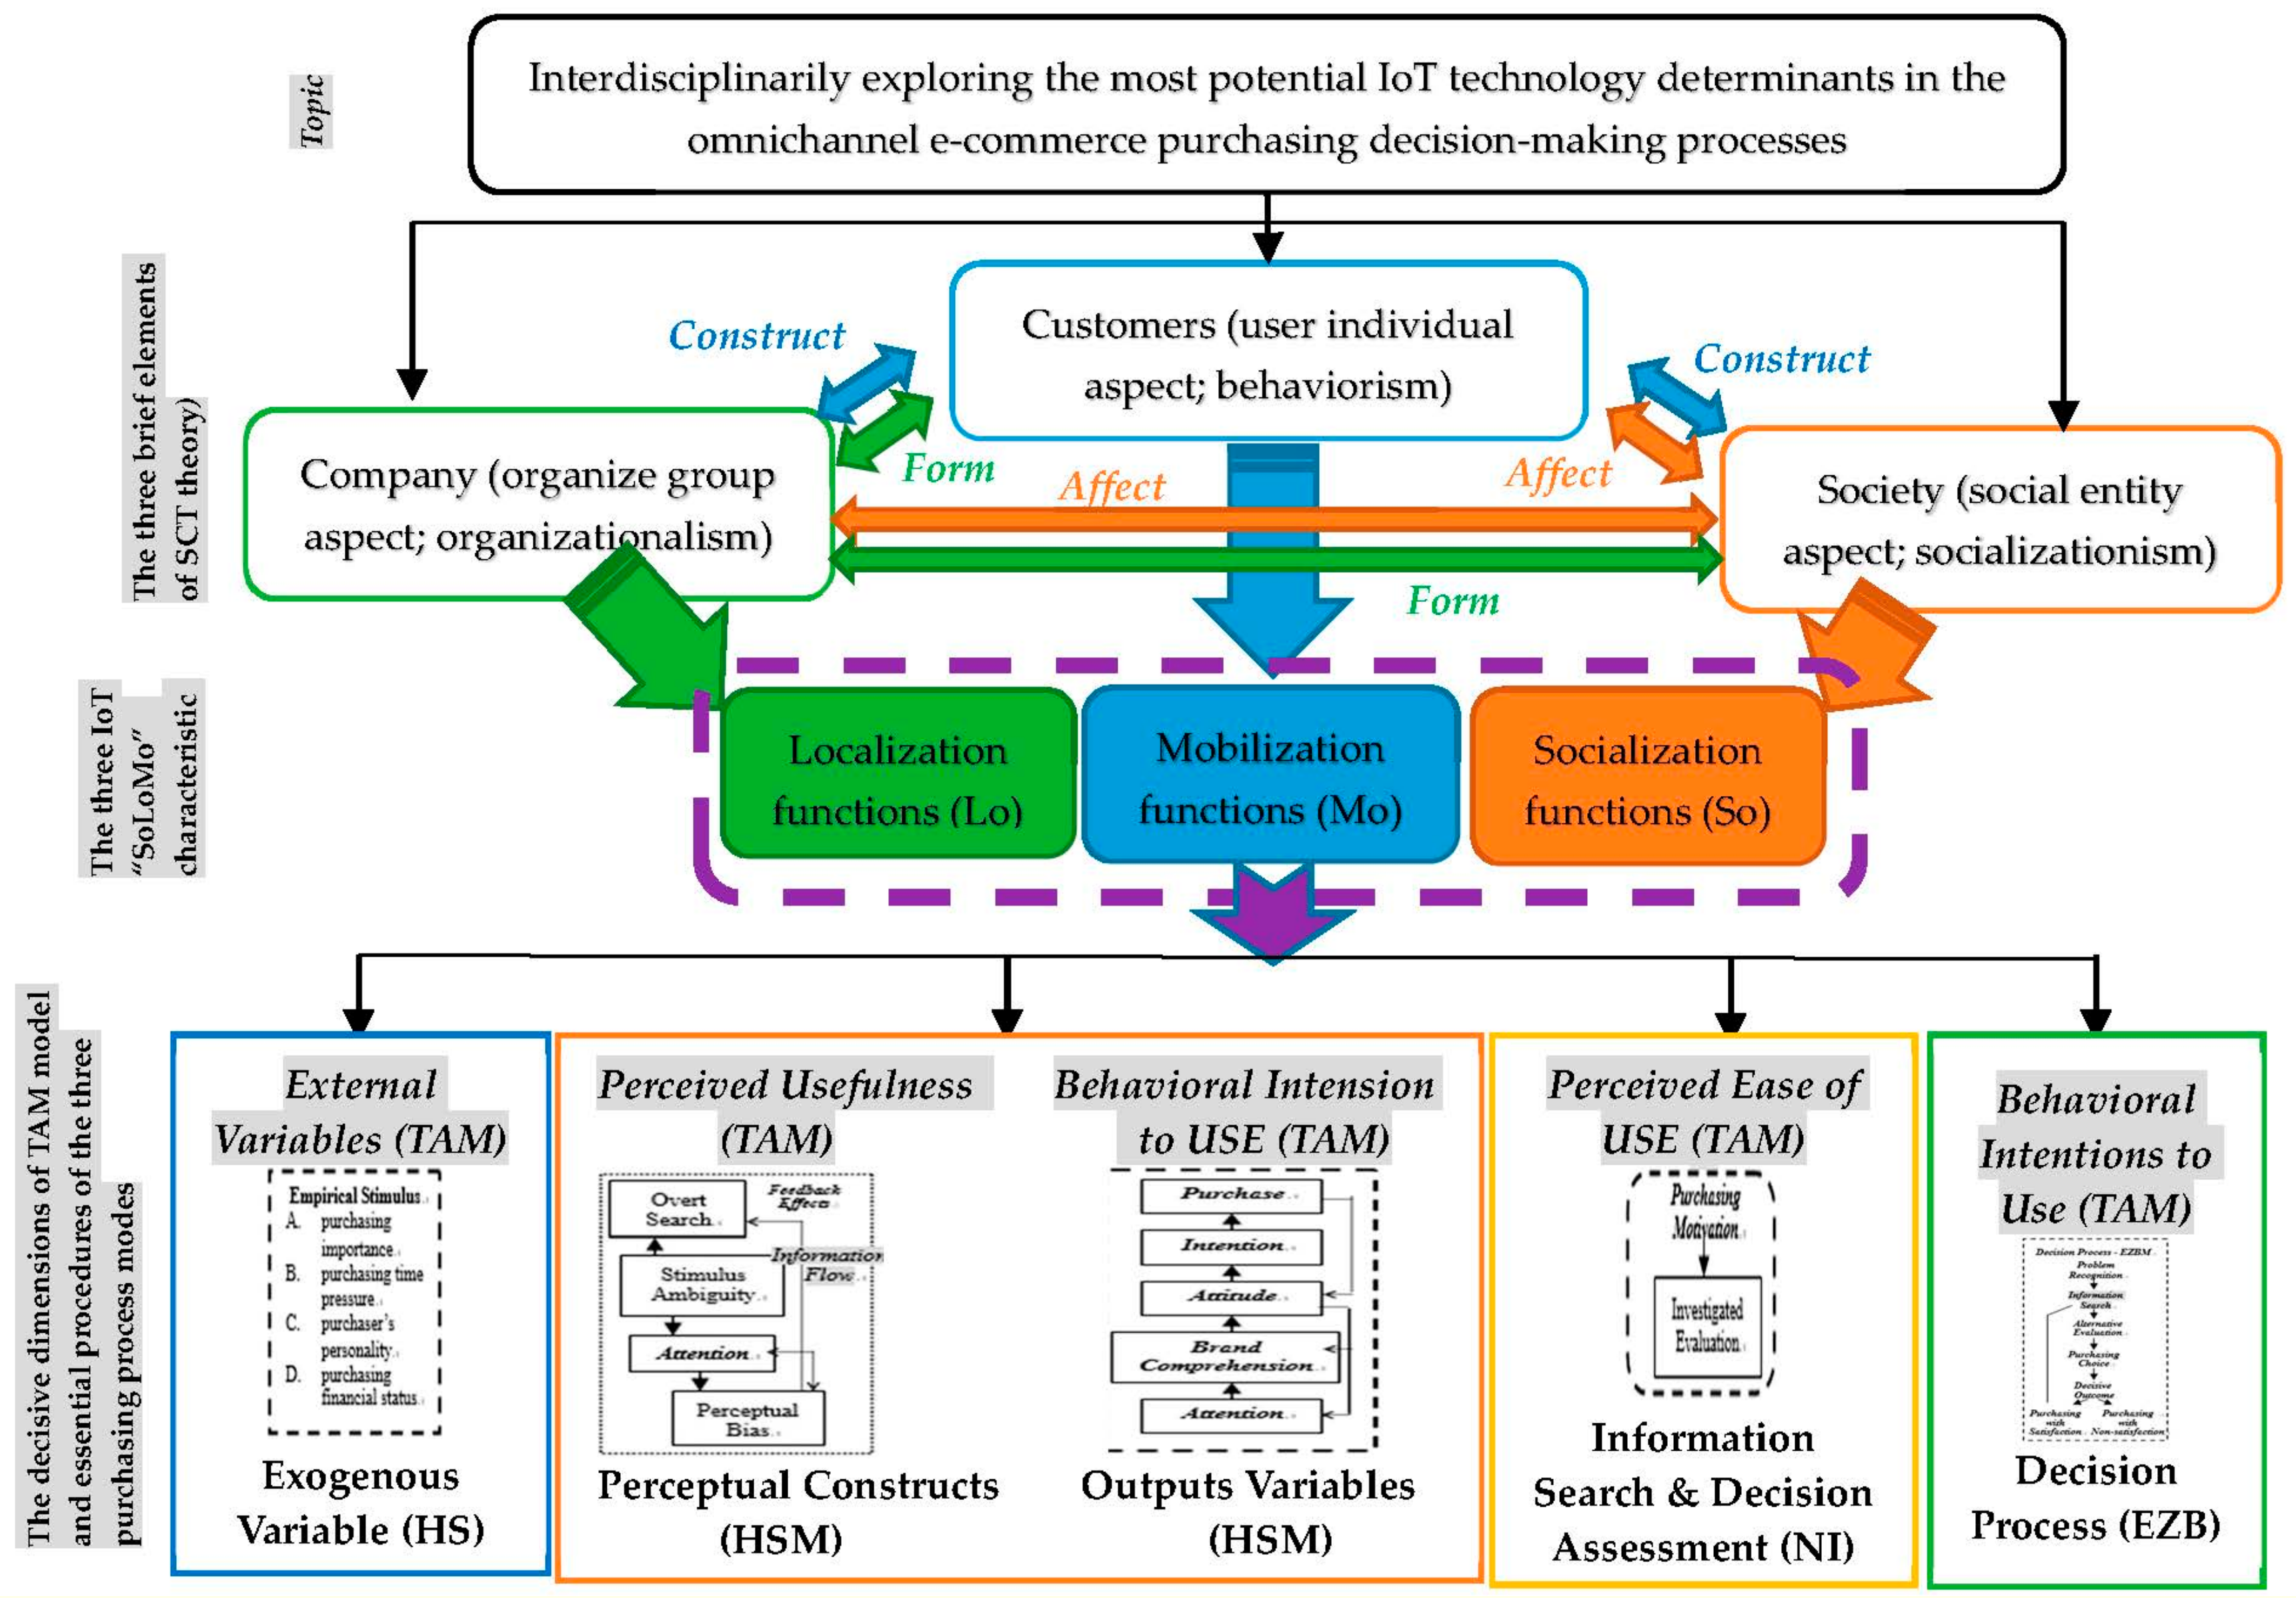
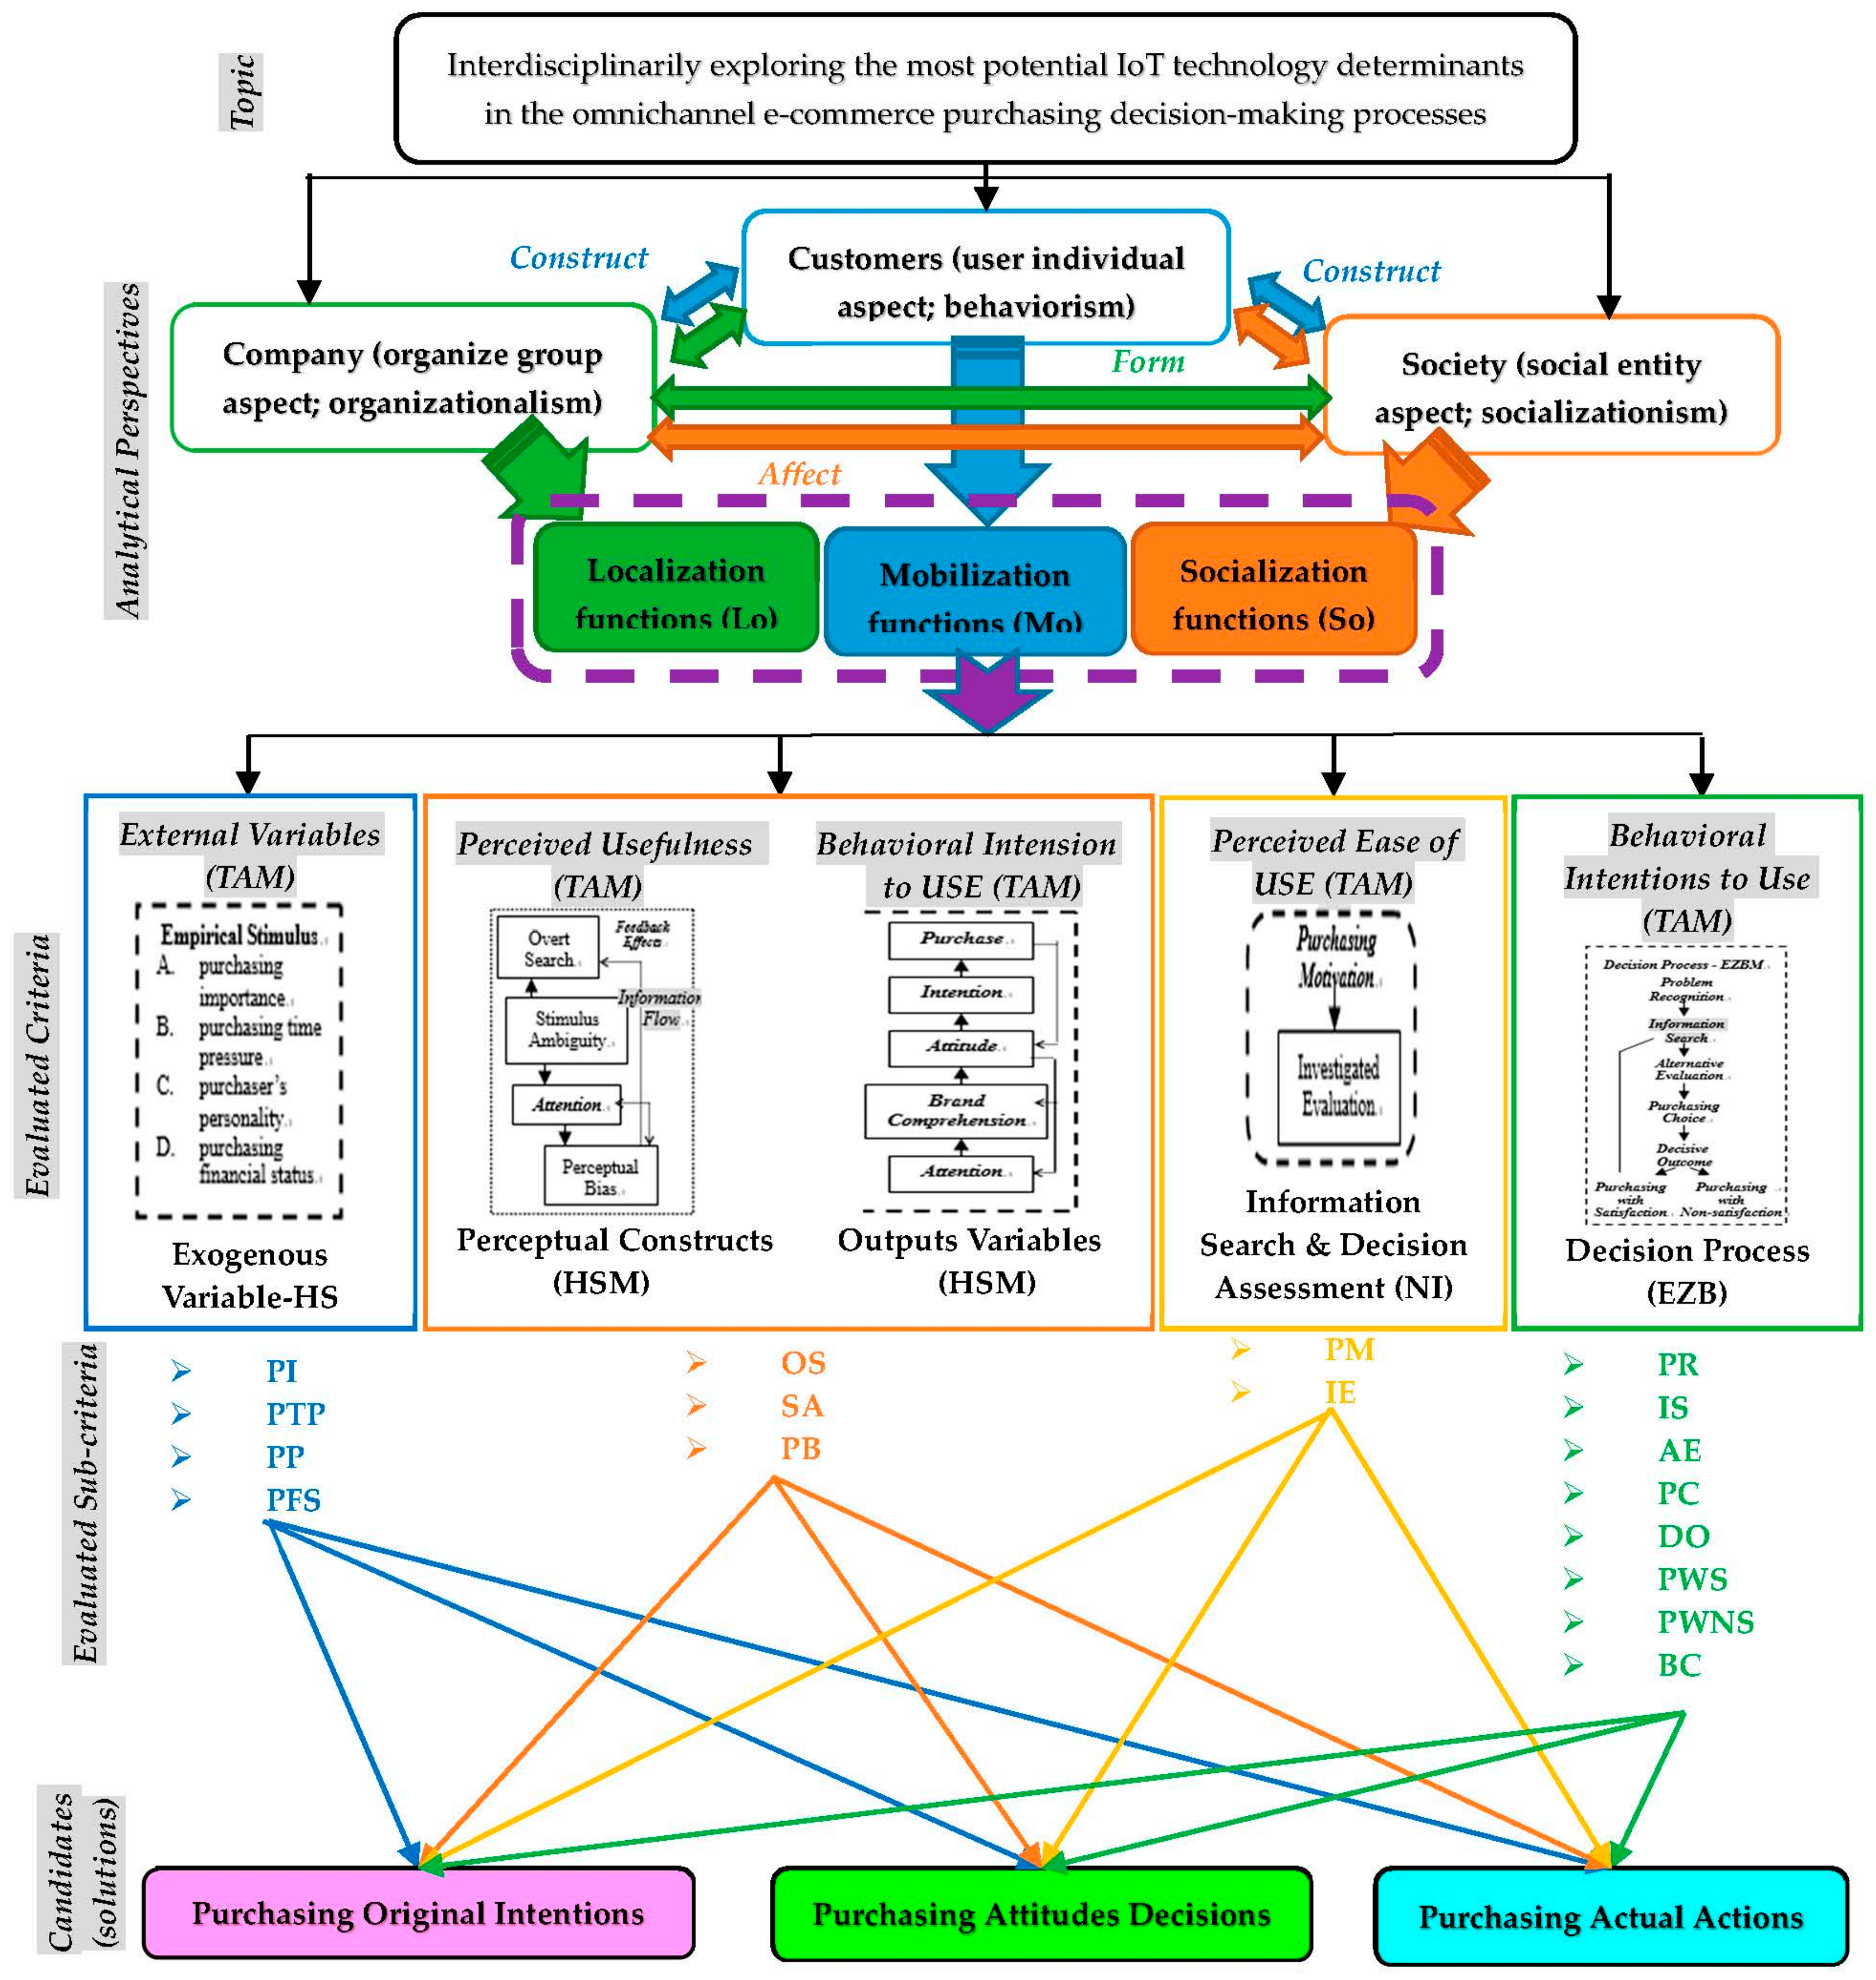
External Variables (TAM & Purchasing Process Measurements) in TAM model—according to the three purchasing-decision modes, the exogenous variables of HS purchasing-decision mode were integrated into external variables of TAM model and hence, Purchasing Importance (“PI”), Purchasing Time Pressure (“PTP”), Purchaser’s Personality (“PP”) and Purchasing Financial Status (“PFS”) [44,45,46] of IoT technological features were defined as evaluated criteria in external variables resulted from the exogenous variables of HS purchasing-decision mode.
Perceived Usefulness (TAM & Purchasing Process Measurements) in TAM model—according to the three purchasing-decision modes, the perceptual construct of the HS purchasing-decision model was precisely supplied as the perceived usefulness of TAM model with three evaluated criteria—Overt Search (“OS”), Stimulus Ambiguity (“SA”) and Perceptual Bias (“PB”) [47,48,49] of IoT technological features.
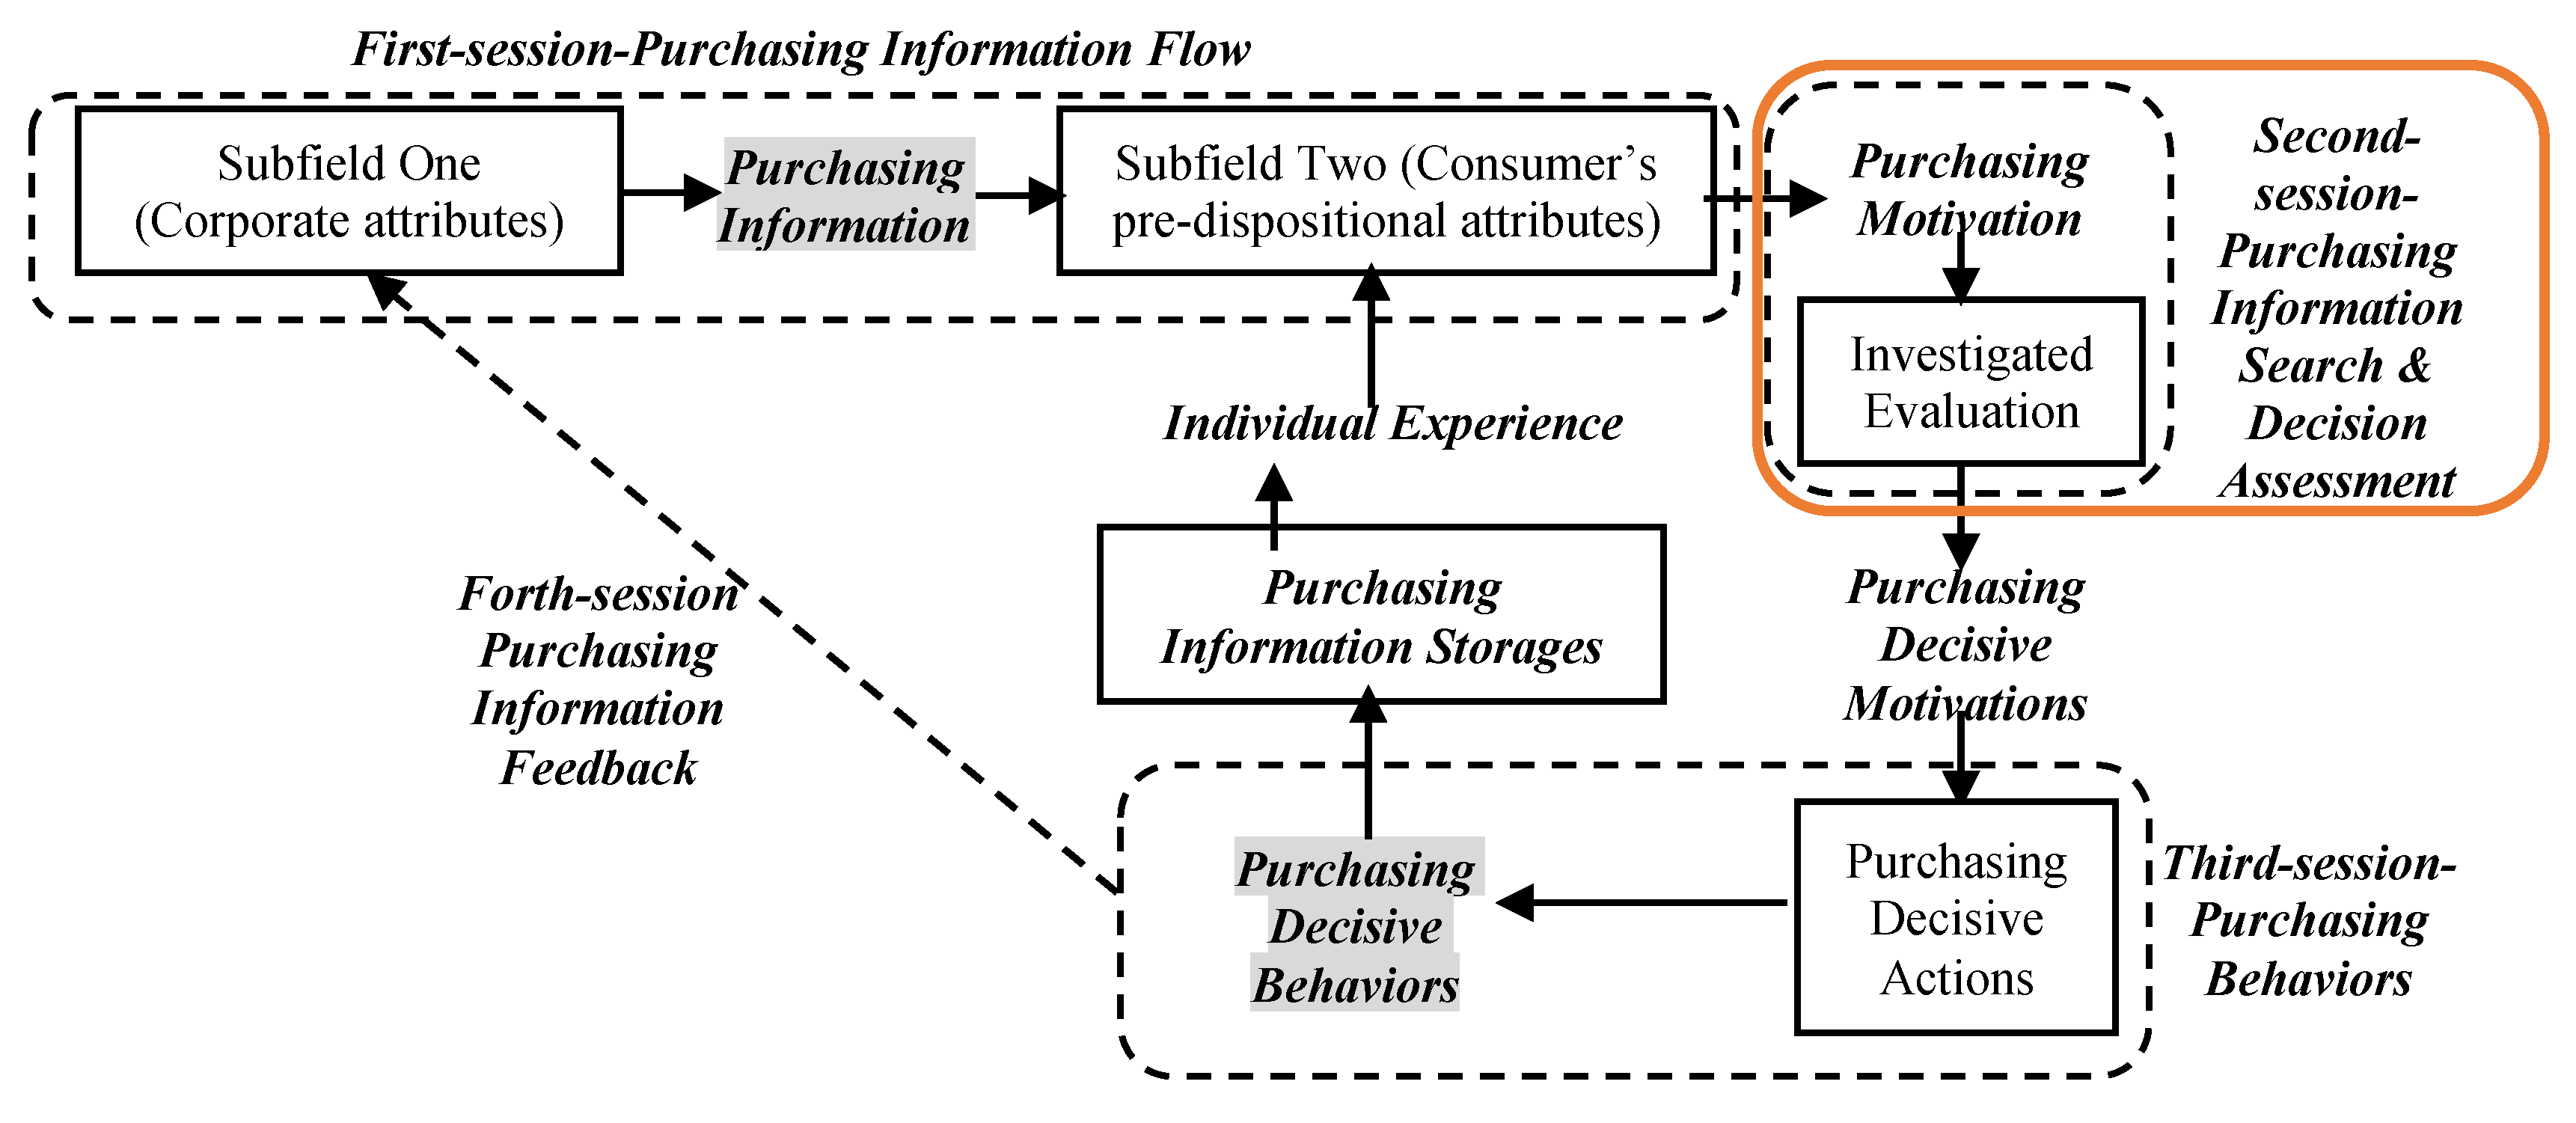
Perceived Ease of Use (TAM & Purchasing Process Measurements) in TAM model—In consideration with the three purchasing-decision modes, the Purchasing Motivation (“PM”) and Investigated Evaluation (“IE”) [50,51] of IoT technological features were resulted from the information search & decision assessment of HS mode.
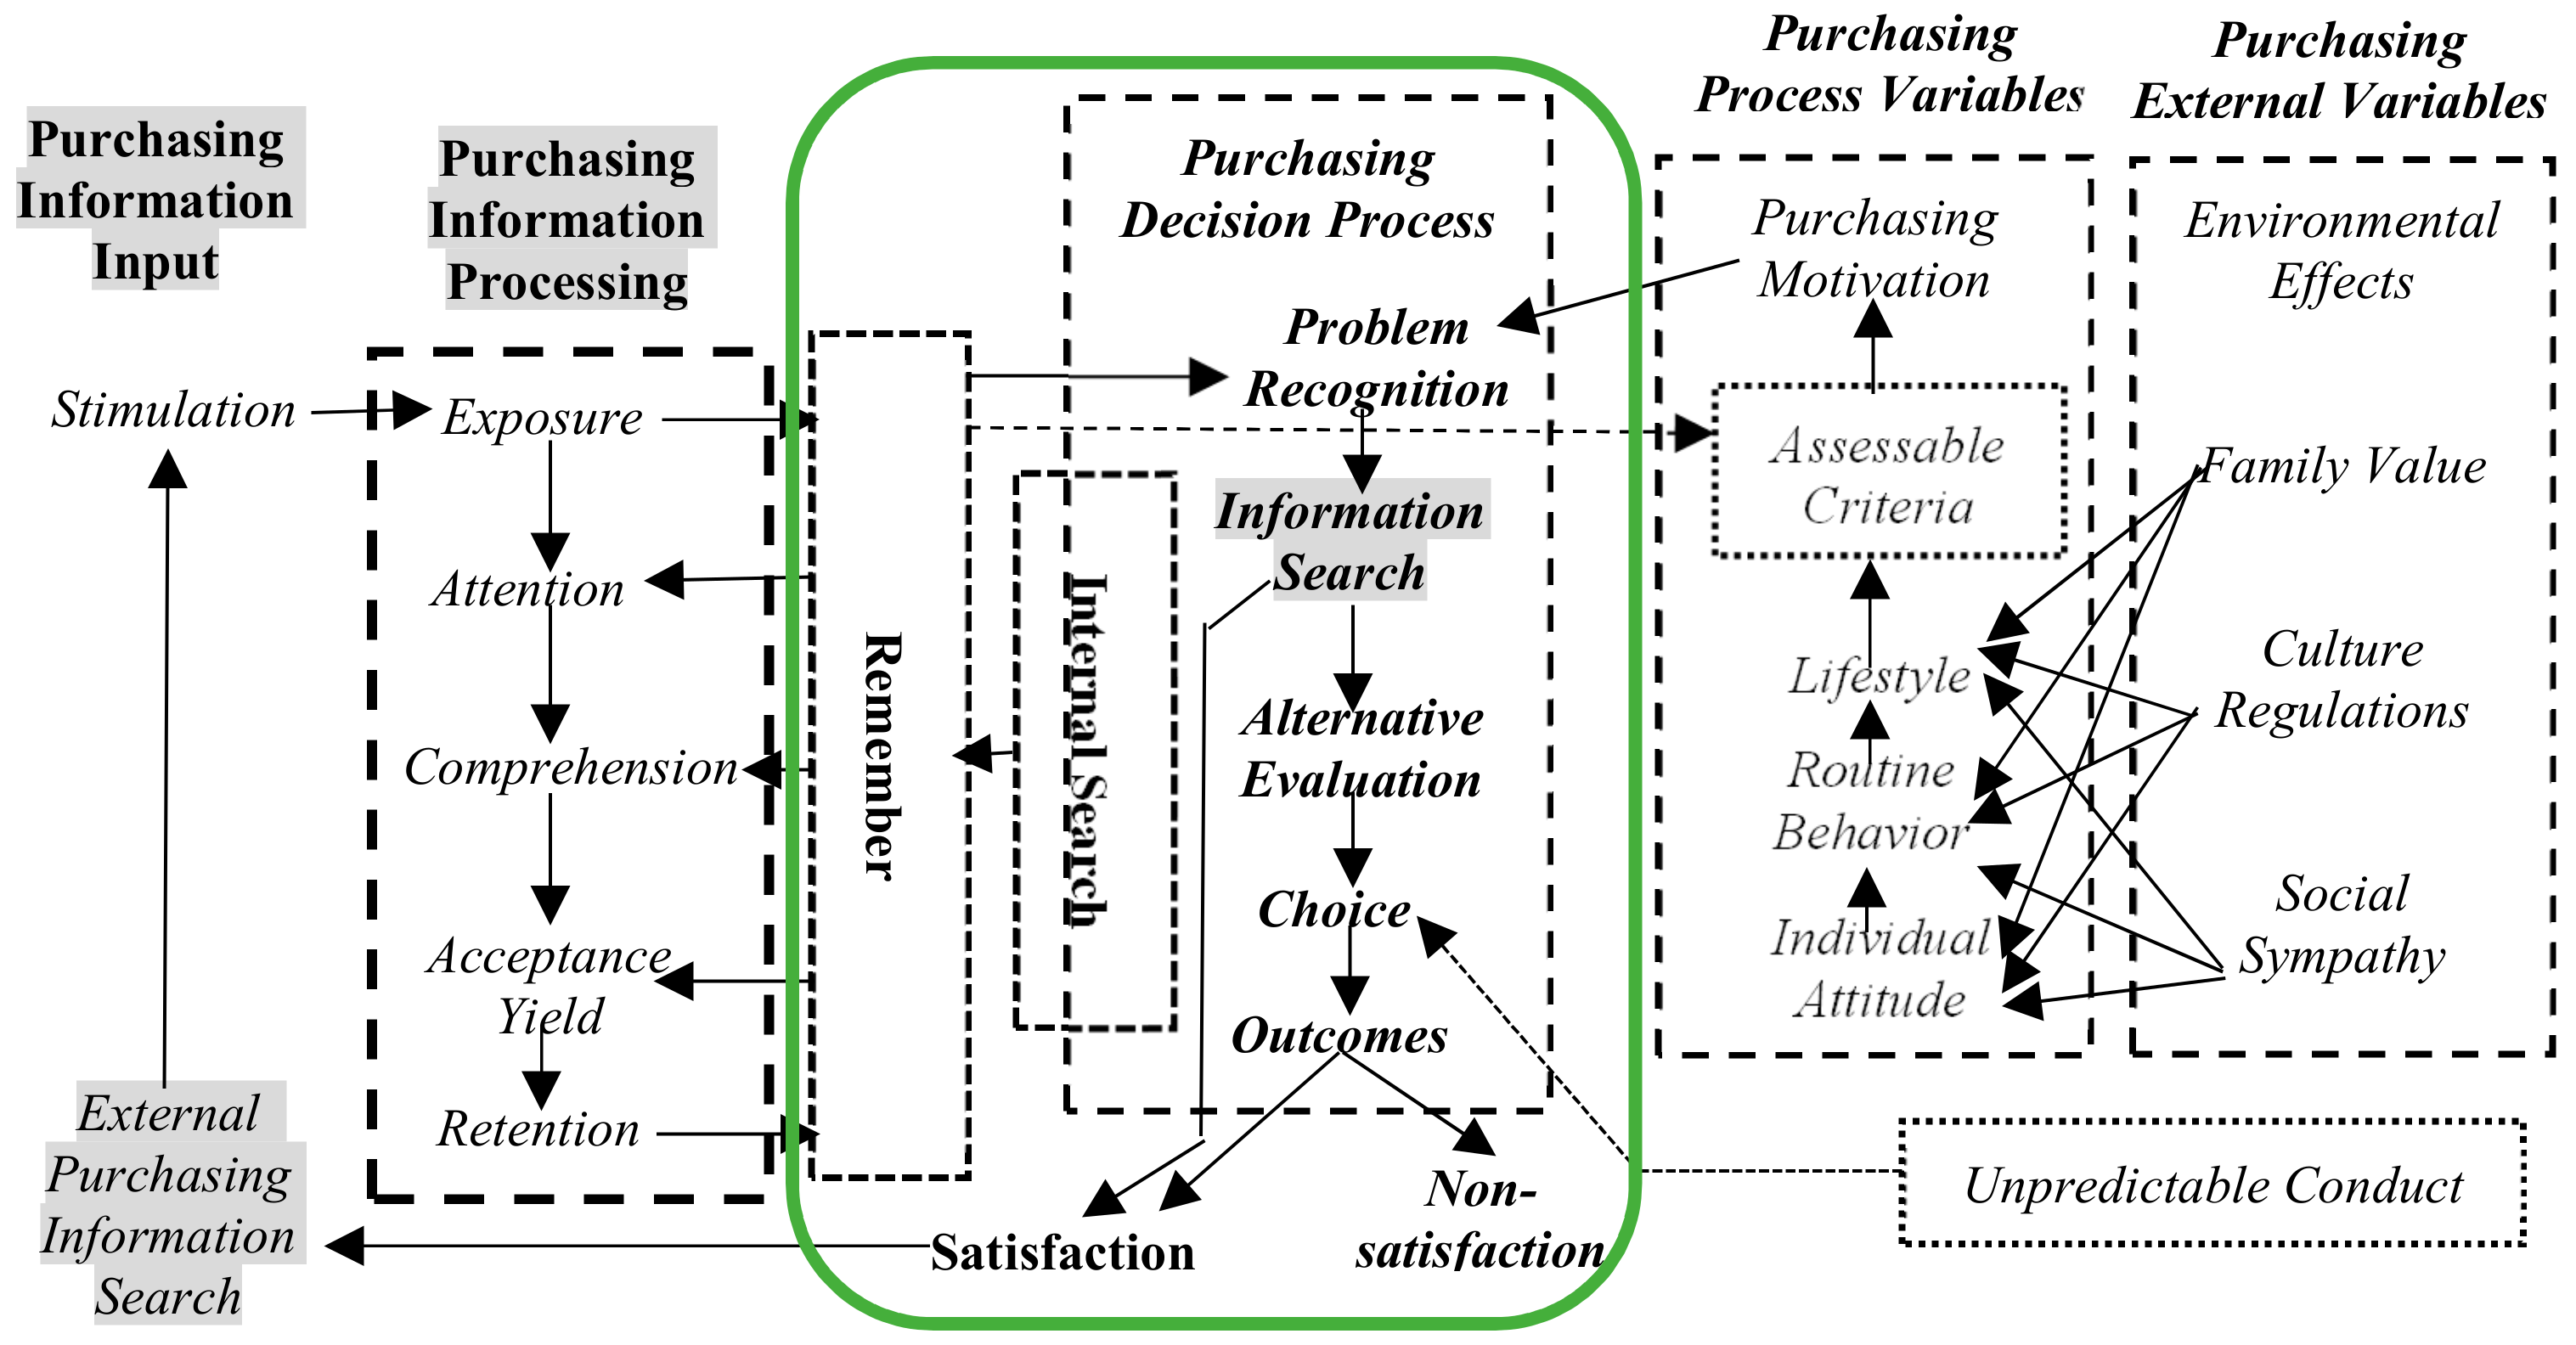
Behavioral Intentions to Use (TAM & Purchasing Process Measurements) in TAM model—In view of the three purchasing-decision modes, the decision process of the EZBM model was distinctly represented as the behavioral intentions to use of TAM model. These criteria are Problem Recognition (“PR”), Information Search (“IS”), Alternative Evaluation (“AE”), Purchasing Choice (“PC”), Decisive Outcome (“DO”), Purchasing with Satisfaction (“PWS”), Purchasing with Non-satisfaction (“PWNS”) and Brand Comprehension (“BC”) [52,53,54] of IoT technological features [55,56,57,58].

3.3. Evaluated Framework

There are the most critical five evaluated hierarchies of ANP model of qualitative analysis to identify the most potential IoTDPDOE as shown in Figure 7 and these hierarchies are (1) research topic, (2) research analytical perspectives from the combination of the three main characteristics of IoT technology “SoLoMo”, the three essential elements of SCT theory, the decisive dimensions of TAM model and essential procedures of the three purchasing process modes (3) four research criteria of the consolidation of TAM model and three purchasing-decision modes, (4) 17 measured sub-criteria of IoT technological features to be identified and induced (5) the best candidates (solutions) for delving into the most potential IoTDPDOE.

4. Evaluated Measurements

In accordance with the characteristic of the research MCDM methodology, the FA approach computed the questionnaire-weighted results from the 96 large-scale random e-commerce customers. The FA approach of quantitative analysis and ANP model and FST and GRA methods of qualitative were evaluated the professional questionnaire-weighted results from the 15 experts in this session in order to identify the most potential IoTDPDOE.

4.1. First Evaluated Step–FA Approach

Table 1 illustrates descriptive statistics of the 96 random surveyed e-commerce customers, including gender, age, education background, annual income (New Taiwan Dollars, “NTD”) and average online-use time per day and average e-commerce purchases per week.
Table 2 displays the mean and standard deviation of seventeen evaluated criteria of 96 random e-commerce customers’ interviewed questionnaires in statistic descriptive, according to the Equation (1) of FA approach.
Subsequently, based on the Equation (2), Table 3 expresses that the Kaiser-Meyer-Olkin Bartlett measure of sampling adequacy of the seventeen evaluated criteria (0.733) is higher than 0.7 and furthermore, the significance of the seventeen evaluated criteria is definitely lower than 0.05 which both means the FA approach is absolutely able to deal with the surveyed 96 random e-commerce customers in order to detect the complexity and dependences of each appraised factor by calculating the communalities of questionnaire weights.
In succession, Table 4 manifests the explained level of common evaluated factors of the seventeen evaluated criteria and then, the highest level of the three common evaluated factors are IE (0.825), PT (0.813) and PFS (0.763). On the contrary as well as the lowest of the three common evaluated factors are DO (0.384), PWS (0.578) and IS (0.602).

4.2. Second Evaluated Step–ANP Model

Based on Figure 7, Equation (3) were applied to deal with the weight-measurement of 15 experts’ questionnaires through computing the pairwise comparison matrix among three analytical attitudes in consolidation with the three main characteristics of IoT technology “SoLoMo” but also the three essential elements of SCT theory, four assessed criteria of three purchasing modes (External Variables Exogenous Variable-HS mode, Perceived Usefulness and Perceived Ease of USE-NI mode and Behavioral Intentions to Use-EKB mode), seventeen sub-criteria and final three candidates (Purchasing Original Intentions, Purchasing Attitude Decisions and Purchasing Actual Actions) with computing the communities of seventeen evaluated criteria of the AF approach and measured results of ANP model is demonstrated in Table 5.
The measured results of ANP model in Table 5 were the highest standardized SNIC (0.5797) was located at “Purchasing Original Intentions”. Specifically, the three highest evaluated scores were “Purchasing Importance-PI (0.2147), Purchasing Financial Status-PFS (0.1993) and Purchaser’s Personality-PP (0.1898)” in “purchasing original intentions”. On the contrary, the lowest evaluated score in “purchasing original intentions” are “Decisive Outcome-DO (0.0213), Purchasing with Satisfaction-PWS (0.0315) and Information Search-IS (0.0327)”. Based on the verification of research reliability, in order to testify the measured results of the ANP model, the C.R. numbers among each pairwise comparison matrix in the ANP model were lower than 0.1 as described in Table 6.

4.3. Third Evaluated Step–FST Approach into ANP Model

To purify the questionnaire results of fifteen experts in the ANP model of qualitative analysis for higher research reliability, the FST method was continuously employed to verify the measured consequences of the ANP model based on the Equation (3) of the FST method of qualitative analysis. The most critical reason is that the FST method were able to effectively minimize the linguistic ambiguousness of the experts’ questionnaire responses in order to exactly recognize the interviewees’ real comments. Hence, the triangular eigenvector number was 0.5 for forming the eigenvector of the triangular fuzzy numbers (S [A,B]), for example—(3.5, 4, 4.5) was the triangular eigenvector number of interviewee’s answers in questionnaire. As a result, the fuzzified standardized SNIC (S [A,B]) of three candidates (Purchasing Original Intentions, Purchasing Attitude Decisions and Purchasing Actual Actions) were 0.6485, 0.2762 and 0.0753 in Table 7. As a result, the highest standardized SNIC (0.5797) of the ANP model and the fuzzified standardized SNIC (S [A,B], 0.6485) of the FST method were located at “Purchasing Original Intentions.” Specifically, the highest eigenvectors of the fuzzified standardized SNIC of the S [A,B] were “purchasing original intentions-PI” (0.1282, 0.2147, 0.2331), “Purchasing Financial Status-PFS (0.1253, 0.1993, 0.2167)” and “Purchaser’s Personality-PP (0.1258, 0.1898, 0.2062)” that were family with the three highest evaluated scores of the ANP model (“Purchasing Importance-PI (0.2147)”, “Purchasing Financial Status-PFS (0.1993)” and “Purchaser’s Personality-PP (0.1898)” in “purchasing original intentions”).

4.4. Forth Evaluated Step–GRA Approach into ANP Model

Furthermore, in order to clearly reflect the questionnaire results of the fifteen experts for highest reliability, this research also applied GRA method of qualitative analysis to testify the measured consequences of the ANP model. The most crucial reason was that GRA method were able to efficiently diminish the semantic indistinct in the expression of professional expert’s weight-questionnaires and practically overcome a series of questionnaire collection mistakes, such as missing data, double answer and so forth. Therefore, FST and GRA methods of qualitative analyses indeed efficaciously increased the research accuracy and reliability. In statistic, three analytical research situations of GRA Equation (3) were applied to refine the measured consequences of ANP model and these three analytical research situations are (1) the analytical goal belongs efficient goal and satisfies the maximized analytical goal (LTB), (2) the analytical goal belongs cost goal and satisfies the minimized analytical goal (STB) and (3) The analytical goal belongs specific goal (NTB). The LTB was suitable for the interviewed questionnaire scale of the fifteen professional experts. Moreover, the identified coefficient ( G 1 , …. , G k ) of GRA method was settled as 0.5 based on the initial assumption. The grey relation have to be the equal weights among analytical impacts and then, these equations of the GRA method were utilized for three times—first usage time for calculating the weights of the grey relation coefficients between three assessable perspectives, second usage time for computing the weights of the grey relation coefficients between four assessable criteria, third usage time for counting up the weights of the grey relation coefficients between seventeen sub-criteria which matched in Figure 7. As a result, the greified numbers (Greified Standardized SNIC) of the seventeen sub-criteria were comprehensively demonstrated in Table 8, according to the Equation (4). The Greified standardized SNIC of the three candidates (Purchasing Original Intentions, Purchasing Attitude Decisions and Purchasing Actual Actions) were 0.3577, 0.3325 and 0.3098. The most specific measured results were the highest standardized SNIC (0.5797) of the ANP model, the fuzzified standardized SNIC (S [A,B], 0.6485) of the FST method and the greified standardized SNIC (0.3577) of GRA method were all located at “Purchasing Original Intentions.” Precisely, the three highest greified evaluated scores of evaluated sub-criteria were “Purchasing Importance-PI (0.1935)”, “Purchasing Financial Status-PFS (0.1893)” and “Purchaser’s Personality-PP (0.1352)” in “purchasing original intentions”) that were similar with the three highest evaluated scores of the ANP model (“Purchasing Importance-PI (0.2147)”, “Purchasing Financial Status-PFS (0.1993)” and “Purchaser’s Personality-PP (0.1898)” in “purchasing original intentions”) as well as the highest eigenvectors of the fuzzified standardized SNIC (S [A,B]) were “purchasing original intentions-PI” (0.1282, 0.2147, 0.2331), “Purchasing Financial Status-PFS (0.1253, 0.1993, 0.2167)” and “Purchaser’s Personality-PP (0.1258, 0.1898, 0.2062)”.

5. Conclusions and Recommendations

In sight of the swift development of IoT technology in omnichannel e-commerce era, the majority of e-commerce companies have devoted to detect, identify, analyze and assess IoTDPDOE for surviving in this hyper-competitive and hyper-dynamic e-commerce circumstance. Therefore, the most precise contributions of this research are described as
  • In order to detect, identify, analyze and assess IoTDPDOE, not only the three main characteristics of IoT technology “SoLoMo” the three essential elements of SCT theory but also the four dimensions of TAM model were consolidated into the hierarchical ANP model to comprehensively the most effective IoTDPOEEM to simultaneously analyze the most critical synergism, influences and correlations among customer’s individuals, consumer’s groups and entire society in consumer’s purchasing-decision processes of omnichannels e-commerce in order to resupplying the research gap between IoT technology and omnichannel e-commerce relative research fields as well as providing the most valuable recommendations for companies to develop the most valuable IoT Technology strategies in purchasing decision-making processes of omnichannel e-commerce.
  • Momentously, this research not only applied FA approach of quantitative analysis for assaying the weighted-questionnaire results of 96 valid random customers to discover the communities of seventeen sub-criteria with the higher research representativeness and validity but also cross-employed FST and GRA methods of qualitative analysis for purifying the computing consequences of weighted-questionnaire results from fifteen professional experts in a pairwise comparison matrix of hierarchical ANP model with higher research accuracy and reliability.
  • Significantly, as for a series of evaluated consequences expressed in Table 5, Table 7 and Table 8, the “Purchasing Original Intentions” has been the most critical purchasing factors in the omnichannel e-commerce purchasing decision-making processes which means current omnichannel e-commerce consumers have commenced to firstly and rationally think over before making purchasing decision and actions without any irrational consumptions.
  • Specifically, with reference to a series of analytical results shown in Table 5, Table 7 and Table 8, “Purchasing Importance-Purchasing Importance (PI)”, “Purchasing Financial Status-Purchasing Financial Status (PFS) and “Purchaser’s Personality-Purchaser’s Personality (PP)”were the three highest evaluated scales of the ANP model and FST and GRA methods. As a result, “Purchasing Importance (PI), Purchasing Financial Status (PFS) and Purchaser’s Personality (PP)” were directly and synthetically induced as the most potential IoT technology determinants in the omnichannel e-commerce purchasing decision-making processes.
  • Precisely, “Purchasing Importance (PI), Purchasing Financial Status (PFS) and Purchaser’s Personality (PP)” are the sub-criteria of the criteria consolidated the external variables of the TAM model and exogenous variable of the HS model which apparently induced (1) omnichannel e-commerce consumers have been rationally focused on what they demands without traditional emotional purchasing consumptions, (2) omnichannel e-commerce consumers have rationally considered their financial resources without impulsive purchasing consumptions and (3) omnichannel e-commerce consumers have rationally respected their personal characteristics and individual value without blindly purchasing consumptions.
After executing and completing this research, the measured consequences and analytical results of this research not only academically supply the research gap in correlations between IoT technology and purchasing decision-making processes in omnichannel e-commerce relative research fields but also empirically provide the most effective IoT technology development strategies for omnichannel e-commerce companies in order to detect current dynamic customer purchasing decision-making behavior. In terms of research restrictions, the more large-scale data and analytical methodology, such as multiple decision making criteria methodology and so on, are apparently going to be employed to identify and refine more core IoT technology determinants in purchasing decision-making processes of omnichannel e-commerce in order to detect the exact IoT e-commerce customers demand, wants and desires in the future research. Although the 100 e-commerce customers and 15 experts and the three analytical statistic methodology (FA approach of quantitative analysis and FST and GRA methods of qualitative analyses) have been systematically cross-employed in this research.

Acknowledgments

This research was partially supported by the research program (MOST 108-2511-H-142-009-) of Ministry of Science and Technology which provided insight and expertise that greatly assisted the research, although they may not agree with all of the interpretations and conclusions of this paper.

Conflicts of Interest

The author declares no conflict of interest.

Abbreviations

E-commerceElectronic Commerce
IoTIntern of Things
TAMTechnology Acceptance Model
SoSocialization
LoLocalization
MoMobilization
SCTSocial Cognitive Theory
ANPAnalytical Network Process
MCDMMultiple Criteria Decision Making
FAFactor Analysis
FSTFuzzy Set Theory
GRAGrey Relation Analysis
GSTGrey System Theory
LTBLarger the Better
STBSmaller the Better
NTBNominal the Best
HSHoward-Sheth
NINicosia
EKBEngel-Kollat-Blackwell
IoTDPOEEMIoT Technology Determinants in Purchasing Decision-making Processes of Omnichannel E-commerce Evaluated Model
IoTDPDOEIoT Technology Determinants in Purchasing Decision-making Processes of Omnichannel E-commerce
PIPurchasing Importance
PTPPurchasing Time Pressure
PPPurchaser’s Personality
PFSPurchasing Financial Status
OSOvert Search (“OS”)
SAStimulus Ambiguity
PBPerceptual Bias
PRProblem Recognition
ISInformation Search
AEAlternative Evaluation
PCPurchasing Choice
DODecisive Outcome
PWSPurchasing with Satisfaction
PWNSPurchasing with Non-satisfaction
BCBrand Comprehension

References

  1. Agrebi, S.; Jallais, J. Explain the intention to use smartphones for mobile shopping. J. Retail. Consum. Serv. 2015, 22, 16–23. [Google Scholar] [CrossRef]
  2. Badgaiyan, A.J.; Verma, A. Intrinsic factors affecting impulse buying behavior: Evidence from India. J. Retail. Consum. Serv. 2014, 21, 537–549. [Google Scholar] [CrossRef]
  3. Zeng, L.; Salvendy, G. How creative is your website. In Proceedings of the 2nd International Conference on Applied Human Factors and Ergonomics (AEI 2008), Las Vegas, NV, USA, 16–20 July 2008. [Google Scholar]
  4. Breen, J.; Burgess, S. E-services and Australian accounting practices. In E-Services, Self-Services, and Mobile Communications: New Concepts; IGI Global: Hershey, PA, USA, 2010; pp. 51–65. [Google Scholar]
  5. Chan, T.K.H.; Cheung, C.M.K.; Lee, Z.W.Y. The state of online impulse buying research: A literature analysis. Inf. Manag. 2017, 54, 204–217. [Google Scholar] [CrossRef]
  6. Chen, P.; Hsieh, H. Personalized mobile advertising: Its key attributes, trends, and social impact. Technol. Forecast. Soc. Chang. 2012, 79, 543–557. [Google Scholar] [CrossRef]
  7. Bekkers, V.; Edwards, A.; de Kool, D. Social media monitoring: Responsive governance in the shadow of surveillance. Gov. Inf. Q. 2013, 30, 335–342. [Google Scholar] [CrossRef] [Green Version]
  8. Xuan, S.; Zhang, Y.; Tang, H.; Chung, I.; Wang, W.; Yang, W. Hierarchically Authorized Transactions for Massive Internet-of-Things Data Sharing Based on Multilayer Blockchain. Appl. Sci. 2019, 9, 5159. [Google Scholar] [CrossRef] [Green Version]
  9. Chowdhury, M.Z.; Shahjalal, M.; Hasan, M.K.; Jang, Y.M. The Role of Optical Wireless Communication Technologies in 5G/6G and IoT Solutions: Prospects, Directions, and Challenges. Appl. Sci. 2019, 9, 4367. [Google Scholar] [CrossRef] [Green Version]
  10. Seok, B.; Park, J.; Park, J.H. A Lightweight Hash-Based Blockchain Architecture for Industrial IoT. Appl. Sci. 2019, 9, 3740. [Google Scholar] [CrossRef] [Green Version]
  11. Bagozzi, R.P. The legacy of the technology acceptance model and a proposal for a paradigm shift. J. Assoc. Inf. Syst. 2007, 8, 244–254. [Google Scholar] [CrossRef]
  12. Baptista, G.; Oliveira, T. Understanding mobile banking: The unified theory of acceptance and use of technology combined with cultural moderators. Comput. Hum. Behav. 2015, 50, 418–430. [Google Scholar] [CrossRef]
  13. Miller, N.E.; Dollard, J. Social Learning and Imitation; Yale University Press: New Haven, CT, USA, 1941. [Google Scholar]
  14. Pritchard, M.P.; Havitz, L.; Howard, D.R. Analyzing the commitment-loyalty link in service contexts. J. Acad. Mark. Sci. 1999, 27, 333–348. [Google Scholar] [CrossRef]
  15. Hsieh, M.Y. The Application of the SCT and the ANP Model to Refine the Most Critical ICT Determinants in Minimizing the Digital Divide. Math. Probl. Eng. 2014, 1, 1–9. [Google Scholar] [CrossRef]
  16. Bandura, A. Perceived Self Efficacy in Cognitive Development and Functioning. Educ. Psychol. 1993, 28, 117–148. [Google Scholar] [CrossRef]
  17. Lerner, J.S.; Li, Y.; Valdesolo, P. Emotion and Decision Making. Annu. Rev. Psychol. 2015, 66, 799–823. [Google Scholar] [CrossRef] [PubMed] [Green Version]
  18. Flavian, C.; Guinaliu, M.; Gurrea, R. The role played by perceived usability, satisfaction and consumer trust on website loyalty. Inf. Manag. 2006, 43, 1–14. [Google Scholar] [CrossRef]
  19. Reddick, C.; Anthopoulos, L. Interactions with e-government, new digital media and traditional channel choices: Citizen-initiated factors. Transforming Government: People. Process Policy 2014, 8, 398–419. [Google Scholar]
  20. Lengel, R.H.; Daft, R.L. The selection of Communication Media as an Executive Skill. Acad. Manag. Execut. 1989, 2, 225–232. [Google Scholar] [CrossRef]
  21. Zubcsek, P.; Katona, Z.; Sarvary, M. Predicting mobile advertising response using consumer colocation networks. J. Mark. 2017, 81, 109–126. [Google Scholar] [CrossRef]
  22. Lo, L.Y.; Lin, S.; Hsu, L. Motivation for online impulse buying: A two factor theory perspective. Int. J. Inf. Manag. 2016, 36, 759–772. [Google Scholar] [CrossRef]
  23. Medelyan, O.; Frank, E.; Witten, I.H. Human-competitive tagging using automatic keyphrase extraction. In Proceedings of the Conference of Empirical Methods in Natural Language Processing (EMNLP-2009), Singapore, 6–7 August 2009. [Google Scholar]
  24. Nicosia, F.M. Consumer Decision Processes: Marketing and Advertising Implication; Prentice Hill: Upper Saddle River, NJ, USA, 1968. [Google Scholar]
  25. Howard, J.A.; Sheth, J.N. The Theory of Buyer Behavior. J. Am. Stat. Assoc. 1969. [Google Scholar] [CrossRef]
  26. Hsieh, M.Y. The most potential principles of social media. Comput. Electr. Eng. 2016, 51, 376–388. [Google Scholar] [CrossRef]
  27. Engel, J.F.; Kollat, D.T.; Blackwell, R.D. Consumer Behavior, 4th ed.; Holt, Rinehart and Winston Company: New York, NY, USA, 1984. [Google Scholar]
  28. Kotler, P.; Armstrong, G. Marketing Management: Analysis, Planning, Implement and Control, 12th ed.; Prentice Hill: Upper Saddle River, NJ, USA, 2002. [Google Scholar]
  29. Kotler, P. Principles of Marketing, 14th ed.; Pearson-Prentice-Hall Inc: Upper Saddle River, NJ, USA, 2011. [Google Scholar]
  30. Spearman, C. The Abilities of Man; Macmillan: London, UK, 1927. [Google Scholar]
  31. Yang, M.S.; Hung, W.L.; Chang-Chien, S.L. On a similarity measure between LR-type fuzzy numbers and its application to database acquisition. Int. J. Intell. Syst. 2005, 20, 1001–1016. [Google Scholar] [CrossRef]
  32. Workman, M. Advancements in technology: New opportunities to investigate factors contributing to differential technology and information use. Int. J. Manag. Decis. Mak. 2007, 8, 318–342. [Google Scholar] [CrossRef]
  33. Wang, Y.S. Assessing e-commerce systems success: A respecification and validation of the DeLone and McLean model of IS success. Inf. Syst. J. 2008, 18, 529–557. [Google Scholar] [CrossRef]
  34. Saaty, T.L.; Cillo, B.A. Dictionary of Complex Decisions Using the Analytic Network Process; RWS Publications: Pittsburgh, PA, USA, 2009. [Google Scholar]
  35. Medelyan, O.; Witten, I. Measuring inter-indexer consistency using a thesaurus. In Proceedings of the 6th ACM/IEEE-CS Joint Conference on Digital Libraries, Chapel Hill, NC, USA, 11–15 June 2006; pp. 274–275. [Google Scholar]
  36. Sun, T.; Wu, G. TrAI technologies predictors of online impulse buying tendency: A hierarchical approach. J. Mark. Theory Pract. 2011, 19, 337–346. [Google Scholar] [CrossRef]
  37. Hsieh, M.Y. A study on the potential determinants of green idea in customer’s purchasing decision-making process through the grey analytical network process (GANP) evaluated model. Int. J. Electr. Cust. Relatsh. Manag. 2012, 6, 323–341. [Google Scholar] [CrossRef]
  38. Zadeh, L.A. Fuzzy sets. Inf. Control 1965, 8, 338–353. [Google Scholar] [CrossRef] [Green Version]
  39. Koubek, R.J.; Salvendy, G. Cognitive performance of super-experts on computer program modification tasks. Ergonomics 1991, 34, 1095–1112. [Google Scholar] [CrossRef]
  40. Chen, S.J.; Hwang, C.L. Fuzzy Multiple Attribute Decision Making: Methods and Applications; Springer: Secaucus, NJ, USA, 1992. [Google Scholar]
  41. Chen, S.H.; Lin, H.T.; Lee, H.T. Enterprise partner selection for vocational education: Analytical Network Process. Int. J. Manpow. 2004, 25, 643–655. [Google Scholar] [CrossRef]
  42. Deng, J. Introduction to grey system theory. J. Grey Syst. 1989, 1, 1–24. [Google Scholar]
  43. Dalkey, N.C.; Helmer, O. An experimental application of the Delphi method to the use of experts. Manag. Sci. 1963, 9, 458–467. [Google Scholar] [CrossRef]
  44. Wu, P.; Yeh, G.; Hsiao, C. The effect of store image and service quality on brand image and purchase intention for private label brands. Aust. Mark. J. 2011, 19, 30–39. [Google Scholar] [CrossRef]
  45. Dehghani, M.; Tumer, M. A research on effectiveness of Facebook advertising on enhancing purchase intention of consumers. Comput. Hum. Behav. 2015, 49, 597–600. [Google Scholar] [CrossRef]
  46. Dziak, D.; Jachimczyk, B.; Kulesza, W.J. IoT-Based Information System for Healthcare Application: Design Methodology Approach. Appl. Sci. 2017, 7, 596. [Google Scholar] [CrossRef]
  47. Fang, Z.; Pengju, L. The Mechanism of “Big Data” Impact on Consumer Behavior”. Am. J. Ind. Bus. Manag. 2014, 4, 45–50. [Google Scholar] [CrossRef] [Green Version]
  48. Jiang, L.; Jun, M.; Yang, Z. Customer-perceived value and loyalty: How do key service quality dimensions matter in the context of B2C e-commerce. Serv. Bus. 2015, 10, 301–317. [Google Scholar] [CrossRef]
  49. Kwon, J.-H.; Lee, H.-H.; Lim, Y.; Kim, E.-J. Dominant Channel Occupancy for Wi-Fi Backscatter Uplink in Industrial Internet of Things. Appl. Sci. 2016, 6, 427. [Google Scholar] [CrossRef] [Green Version]
  50. Russell, S.; Norvig, P. Artificial Intelligence: A Modern Approach, 3rd ed.; Prentice Hill: Upper Saddle River, NJ, USA, 2009. [Google Scholar] [CrossRef]
  51. Gubbi, J.; Buyya, R.; Marusic, S.; Palaniswami, M. Internet of Things (IoT): A vision, architectural elements, and future directions. Future Gener. Comput. Syst. 2013, 29, 1645–1660. [Google Scholar] [CrossRef] [Green Version]
  52. Schoemaker, P.J.H.; Tetlock, P.E. Building a more Intelligent Enterprise. Sch. Manag. Res. 2017, 58, 28–38. [Google Scholar]
  53. Charalabidis, Y.; Loukis, E.; Androutsopoulou, A. Passive crowdsourcing in government using social media. Transforming Government: People. Process Policy 2014, 8, 283–308. [Google Scholar]
  54. Loukis, E.; Charalabidis, Y.; Androutsopoulou, A. Promoting open innovation in the public sector through social media monitoring. Gov. Inf. Q. 2017, 34, 99–109. [Google Scholar] [CrossRef]
  55. Lee, C.-H.; Chen, C.-H.; Lin, C.; Li, F.; Zhao, X. Developing a Quick Response Product Configuration System under Industry 4.0 Based on Customer Requirement Modelling and Optimization Method. Appl. Sci. 2019, 9, 5004. [Google Scholar] [CrossRef] [Green Version]
  56. Zhang, J.; Xie, Y.; Liu, W.; Gong, X. Table Recognition for Sensitive Data Perception in an IoT Vision Environment. Appl. Sci. 2019, 9, 4162. [Google Scholar] [CrossRef] [Green Version]
  57. Pasetti, M.; Ferrari, P.; Silva, D.R.C.; Silva, I.; Sisinni, E. On the Use of LoRaWAN for the Monitoring and Control of Distributed Energy Resources in a Smart Campus. Appl. Sci. 2020, 10, 320. [Google Scholar] [CrossRef] [Green Version]
  58. Hsieh, M.Y. The Most Sustainable Niche Principles of Social Media Education in A Higher Education Contracting Era. Sustainability 2020, 12, 399. [Google Scholar] [CrossRef] [Green Version]
Figure 1. 2018 Statista report of global omnichannel e-commerce trend and statistic by Amasty Ltd.
Applsci 10 00603 g001
Figure 2. TAM model.
Applsci 10 00603 g002
Figure 3. Essential Purchasing Procedures of HS mode.
Applsci 10 00603 g003
Figure 4. The Main Purchasing Procedures of EZB mode.
Applsci 10 00603 g004
Figure 5. Basic analytical structure in purchasing procedure in NI mode.
Applsci 10 00603 g005
Figure 6. Brief analytical concept.
Applsci 10 00603 g006
Figure 7. Main evaluated hierarchies.
Applsci 10 00603 g007
Table 1. Descriptive statistics of the 96 random surveyed e-commerce customers.
GenderMale: 58 (60.42%); Female: 38 (39.58%)
AgeBelow 20 years-old: 17 (17.71%); 20–29 years-old: 38 (39.58%); 30–39 years-old: 34 (35.41%); 40 years-old or older: 7 (7.3%)
Education BackgroundBelow college: 23 (23.95%); College: 54 (56.25%); Master: 17 (17.71%); Doctorate: 2 (2.09%)
Annual Income (NTD)Below $200,000 NTD: 44 (45.83%); $200,000~$400,000NTD: 37 (38.54%); 400,000~$600,000NTD: 9 (9.37%); Higher than $600,000NTD: 6 (6.26%)
Average online-use per dayBelow 1 h: 6 (6.26%); 1–2 h: 32 (33.33%); 2–3 h: 48 (50%); Up 3 h: 10 (10.41%)
Average e-commerce purchases per weekBelow 1: 21 (21.87%), 2 times: 31 (32.29%), 3 times: 38 (39.58%), 4 times: 4 (4.16%); up 5 times: 2 (2.1%)
Table 2. Mean and standard deviation Statistics of the 96 random surveyed e-commerce customers.
Sub-CriteriaMeanStd. DeviationValid Interviewees
PI3.090.6596
PTP3.230.67296
PP3.190.79996
PFS3.210.79496
OS3.170.81696
SA3.20.74996
PB3.060.69396
PM3.140.67596
IE3.110.69496
PR3.190.77296
IS3.30.8696
AE3.080.73596
PC3.110.75296
DO3.160.79996
PWS3.130.79896
PWNS3.170.73596
BC3.190.7396
Extraction method: Principal component analysis.
Table 3. Kaiser-Meyer-Olkin and Bartlett’s test of FA approach.
Kaiser-Meyer-Olkin Bartlett Measure of Sampling Adequacy.0.733
Bartlett’s Test of SphericityApprox. Chi-Square1153.392
df136
Significance0.000
Table 4. Communities of the seventeen evaluated criteria of FA approach.
Sub-CriteriaInitialExtraction
PI10.813
PTP10.705
PP10.725
PFS10.763
OS10.672
SA10.66
PB10.665
PM10.716
IE10.825
PR10.769
IS10.602
AE10.74
PC10.682
DO10.384
PWS10.578
PWNS10.777
BC10.675
Extraction method: Principal component analysis.
Table 5. The standardizing SCIN measurement of ANP model.
CriteriaWeight-ANPSub-CriteriaCommunalities of FA ApproachPurchasing Original IntentionsPurchasing Attitude DecisionsPurchasing Actual Actions
WeightEvaluated ScoreWeightEvaluated ScoreWeightEvaluated Score
External Variables (TAM) & Exogenous Variable (HS)0.4542PI0.8130.58130.21470.2910.10750.12770.0472
PTP0.7050.57620.18450.29140.09330.13240.0424
PP0.7250.57630.18980.28760.09470.13620.0448
PFS0.7630.57520.19930.28760.09970.13490.0468
Perceived Usefulness (TAM) & Perceptual Constructs (HSM); Behavioral Intension (TAM) & Outputs Variables (HSM)0.2817OS0.6720.58990.11170.2860.05410.12410.0235
SA0.660.5830.10840.29060.0540.12640.0235
PB0.6650.5830.10920.29060.05440.12640.0237
Perceived Ease of USE (TAM) & Information Search & Decision Assessment (NI)0.1689PM0.7160.58810.07110.28660.03470.12530.0151
IE0.8250.58480.08150.28790.04010.12720.0177
Behavioral Intentions to Use (TAM) & Decision Process (EZB)0.0952PR0.7690.57770.04230.29320.02150.12910.0094
IS0.6020.57090.03270.29330.01680.13580.0078
AE0.740.57770.04070.28880.02040.13350.0094
PC0.6820.57280.03720.29130.01890.13590.0088
DO0.3840.58240.02130.28360.01040.1340.0049
PWS0.5780.57240.03150.29720.01640.13050.0072
PWNS0.7770.5720.04230.29110.02150.13690.0101
BC0.6750.58030.03730.28880.01860.13090.0084
Standardized SNIC 0.57970.28950.1307
Table 6. C.R. numbers of ANP model.
Pairwise-Comparison MatrixC.R. (All C.R. Were Lower Than 0.1)
Pattern customers (Mo)0.096
Pattern company (Lo)0.0927
Pattern society (So)0.0697
Criteria External0.079
Criteria Perceived Usefulness0.0673
Criteria Perceived Ease0.0647
Criteria Behavioral0.0631
Sub-criteria-PI0.0484
Sub-criteria-PTP0.0468
Sub-criteria-PP0.0356
Sub-criteria-PFS0.0389
Sub-criteria-OS0.0577
Sub-criteria-SA0.0556
Sub-criteria-PB0.0556
Sub-criteria-PM0.0469
Sub-criteria-IE0.0438
Sub-criteria-PR0.0248
Sub-criteria-IS0.0282
Sub-criteria-AE0.0338
Sub-criteria-PC0.0307
Sub-criteria-DO0.0191
Sub-criteria-PWS0.0467
Sub-criteria-PWNS0.0396
Sub-criteria-BC0.0507
Table 7. The fuzzified standardizing SCIN measurement of FST.
CriteriaWeight-ANPSub-CriteriaCommunalities of FA ApproachPurchasing Original IntentionsPurchasing Attitude DecisionsPurchasing Actual Actions
Fuzzified WeightFuzzified Evaluated ScoreFuzzified WeightFuzzified Evaluated ScoreFuzzified WeightFuzzified Evaluated Score
External Variables (TAM) & Exogenous Variable (HS)0.4542PI0.813(0.5313, 0.5813, 0.6313)(0.1282, 0.2147, 0.2331)(0.241, 0.291, 0.341)(0.089, 0.1075, 0.1259)(0.0777, 0.1277, 0.1777)(0.0287, 0.0472, 0.0656)
PTP0.705(0.5262, 0.5762, 0.6262)(0.1258, 0.1845, 0.2005)(0.2414, 0.2914, 0.3414)(0.0773, 0.0933, 0.1093)(0.0824, 0.1324, 0.1824)(0.0264, 0.0424, 0.0584)
PP0.725(0.5263, 0.5763, 0.6263)(0.1258, 0.1898, 0.2062)(0.2376, 0.2876, 0.3376)(0.0782, 0.0947, 0.1112)(0.0862, 0.1362, 0.1862)(0.0284, 0.0448, 0.0613)
PFS0.763(0.5252, 0.5752, 0.6252)(0.1253, 0.1993, 0.2167)(0.2376, 0.2876, 0.3376)(0.0823, 0.0997, 0.117)(0.0849, 0.1349, 0.1849)(0.0294, 0.0468, 0.0641)
Perceived Usefulness (TAM) & Perceptual Constructs (HSM); Behavioral Intension (TAM) & Outputs Variables (HSM)0.2817OS0.672(0.5399, 0.5899, 0.6399)(0.0821, 0.1117, 0.1211)(0.236, 0.286, 0.3360)(0.0447, 0.0541, 0.0636)(0.0741, 0.1241, 0.1741)(0.014, 0.0235, 0.033)
SA0.66(0.533, 0.583, 0.633)(0.08, 0.1084, 0.1177)(0.2406, 0.2906, 0.3406)(0.0447, 0.054, 0.0633)(0.0764, 0.1264, 0.1764)(0.0142, 0.0235, 0.0328)
PB0.665(0.533, 0.583, 0.633)(0.08, 0.1092, 0.1186)(0.2406, 0.2906, 0.3406)(0.0451, 0.0544, 0.0638)(0.0764, 0.1264, 0.1764)(0.0143, 0.0237, 0.033)
Perceived Ease of USE (TAM) & Information Search & Decision Assessment (NI)0.1689PM0.716(0.5381, 0.5881, 0.6381)(0.0489, 0.0711, 0.0771)(0.2366, 0.2866, 0.3366)(0.0286, 0.0347, 0.0407)(0.0753, 0.1253, 0.1753)(0.0091, 0.0151, 0.0212)
IE0.825(0.5348, 0.5848, 0.6348)(0.0483, 0.0815, 0.0884)(0.2379, 0.2879, 0.3379)(0.0331, 0.0401, 0.0471)(0.0772, 0.1272, 0.1772)(0.0108, 0.0177, 0.0247)
Behavioral Intentions to Use (TAM) & Decision Process (EZB)0.0952PR0.769(0.5277, 0.5777, 0.6277)(0.0265, 0.0423, 0.046)(0.2432, 0.2932, 0.3432)(0.0178, 0.0215, 0.0251)(0.0791, 0.1291, 0.1791)(0.0058, 0.0094, 0.0131)
IS0.602(0.5209, 0.5709, 0.6209)(0.0258, 0.0327, 0.0356)(0.2433, 0.2933, 0.3433)(0.0139, 0.0168, 0.0197)(0.0858, 0.1358, 0.1858)(0.0049, 0.0078, 0.0106)
AE0.74(0.5277, 0.5777, 0.6277)(0.0265, 0.0407, 0.0442)(0.2388, 0.2888, 0.3388)(0.0168, 0.0204, 0.0239)(0.0835, 0.1335, 0.1835)(0.0059, 0.0094, 0.0129)
PC0.682(0.5228, 0.5728, 0.6228)(0.026, 0.0372, 0.0404)(0.2413, 0.2913, 0.3413)(0.0157, 0.0189, 0.0222)(0.0859, 0.1359, 0.1859)(0.0056, 0.0088, 0.0121)
DO0.384(0.5324, 0.5824, 0.6324)(0.027, 0.0213, 0.0231)(0.2336, 0.2836, 0.3336)(0.0085, 0.0104, 0.0122)(0.084, 0.134, 0.184)(0.0031, 0.0049, 0.0067)
PWS0.578(0.5224, 0.5724, 0.6224)(0.026, 0.0315, 0.0342)(0.2472, 0.2972, 0.3472)(0.0136, 0.0164, 0.0191)(0.0805, 0.1305, 0.1805)(0.0044, 0.0072, 0.0099)
PWNS0.777(0.522, 0.572, 0.622)(0.0259, 0.0423, 0.046)(0.2411, 0.2911, 0.3411)(0.0178, 0.0215, 0.0252)(0.0869, 0.1369, 0.1869)(0.0064, 0.0101, 0.0138)
BC0.675(0.5303, 0.5803, 0.6303)(0.0268, 0.0373, 0.0405)(0.2388, 0.2888, 0.3388)(0.0153, 0.0186, 0.0218)(0.0809, 0.1309, 0.1809)(0.0052, 0.0084, 0.0116)
Fuzzified vectors of candidates (1.055, 1.5555, 1.6897)(0.6427, 0.7769, 0.9111)(0.2166, 0.3508, 0.485)
Standardized SNIC 0.64850.27620.0753
Table 8. The greified standardizing SCIN measurement of GRA.
CriteriaWeight-ANPSub-CriteriaCommunalities of FA ApproachPurchasing Original IntentionsPurchasing Attitude DecisionsPurchasing Actual Actions
Greified WeightGreified Evaluated ScoreGreified WeightGreified Evaluated ScoreGreified WeightGreified Evaluated Score
External Variables (TAM) & Exogenous Variable (HS)0.4542PI0.8130.52410.19350.52310.19320.41090.1317
PTP0.7050.40920.1310.54180.17350.58610.1677
PP0.7250.41050.13520.41330.13610.90230.2771
PFS0.76310.18930.41330.14320.76550.2453
Perceived Usefulness (TAM) & Perceptual Constructs (HSM); Behavioral Intension (TAM) & Outputs Variables (HSM)0.2817OS0.6720.39250.11360.37730.07140.33330.0431
SA0.660.57790.10750.50840.09450.37880.0504
PB0.6650.57790.10830.50840.09530.37880.051
Perceived Ease of USE (TAM) & Information Search & Decision Assessment (NI)0.1689PM0.7160.83990.10150.39070.04720.35550.023
IE0.8250.65250.09090.42240.05880.39870.0355
Behavioral Intentions to Use (TAM) & Decision Process (EZB)0.0952PR0.7690.4380.03210.63070.04620.450.013
IS0.6020.33330.01910.63770.03660.8520.0288
AE0.740.43730.03080.44850.03160.65260.026
PC0.6820.35740.02320.5340.03470.86890.0364
DO0.3840.55880.02040.33330.01220.68780.0051
PWS0.5780.35110.019310.0550.49920.0075
PWNS0.7770.34640.02560.52910.039110.054
BC0.6750.4960.03190.44710.02870.51880.0133
Greified Standardized SNIC0.35770.33250.3098

