Variance of the Gait Parameters and Fraction of Double-Support Interval for Determining the Severity of Parkinson’s Disease


Abstract
1. Introduction
2. Materials and Methods
2.1. Details of the Dataset
2.2. Data Analysis
2.3. Statistical Analysis
3. Results
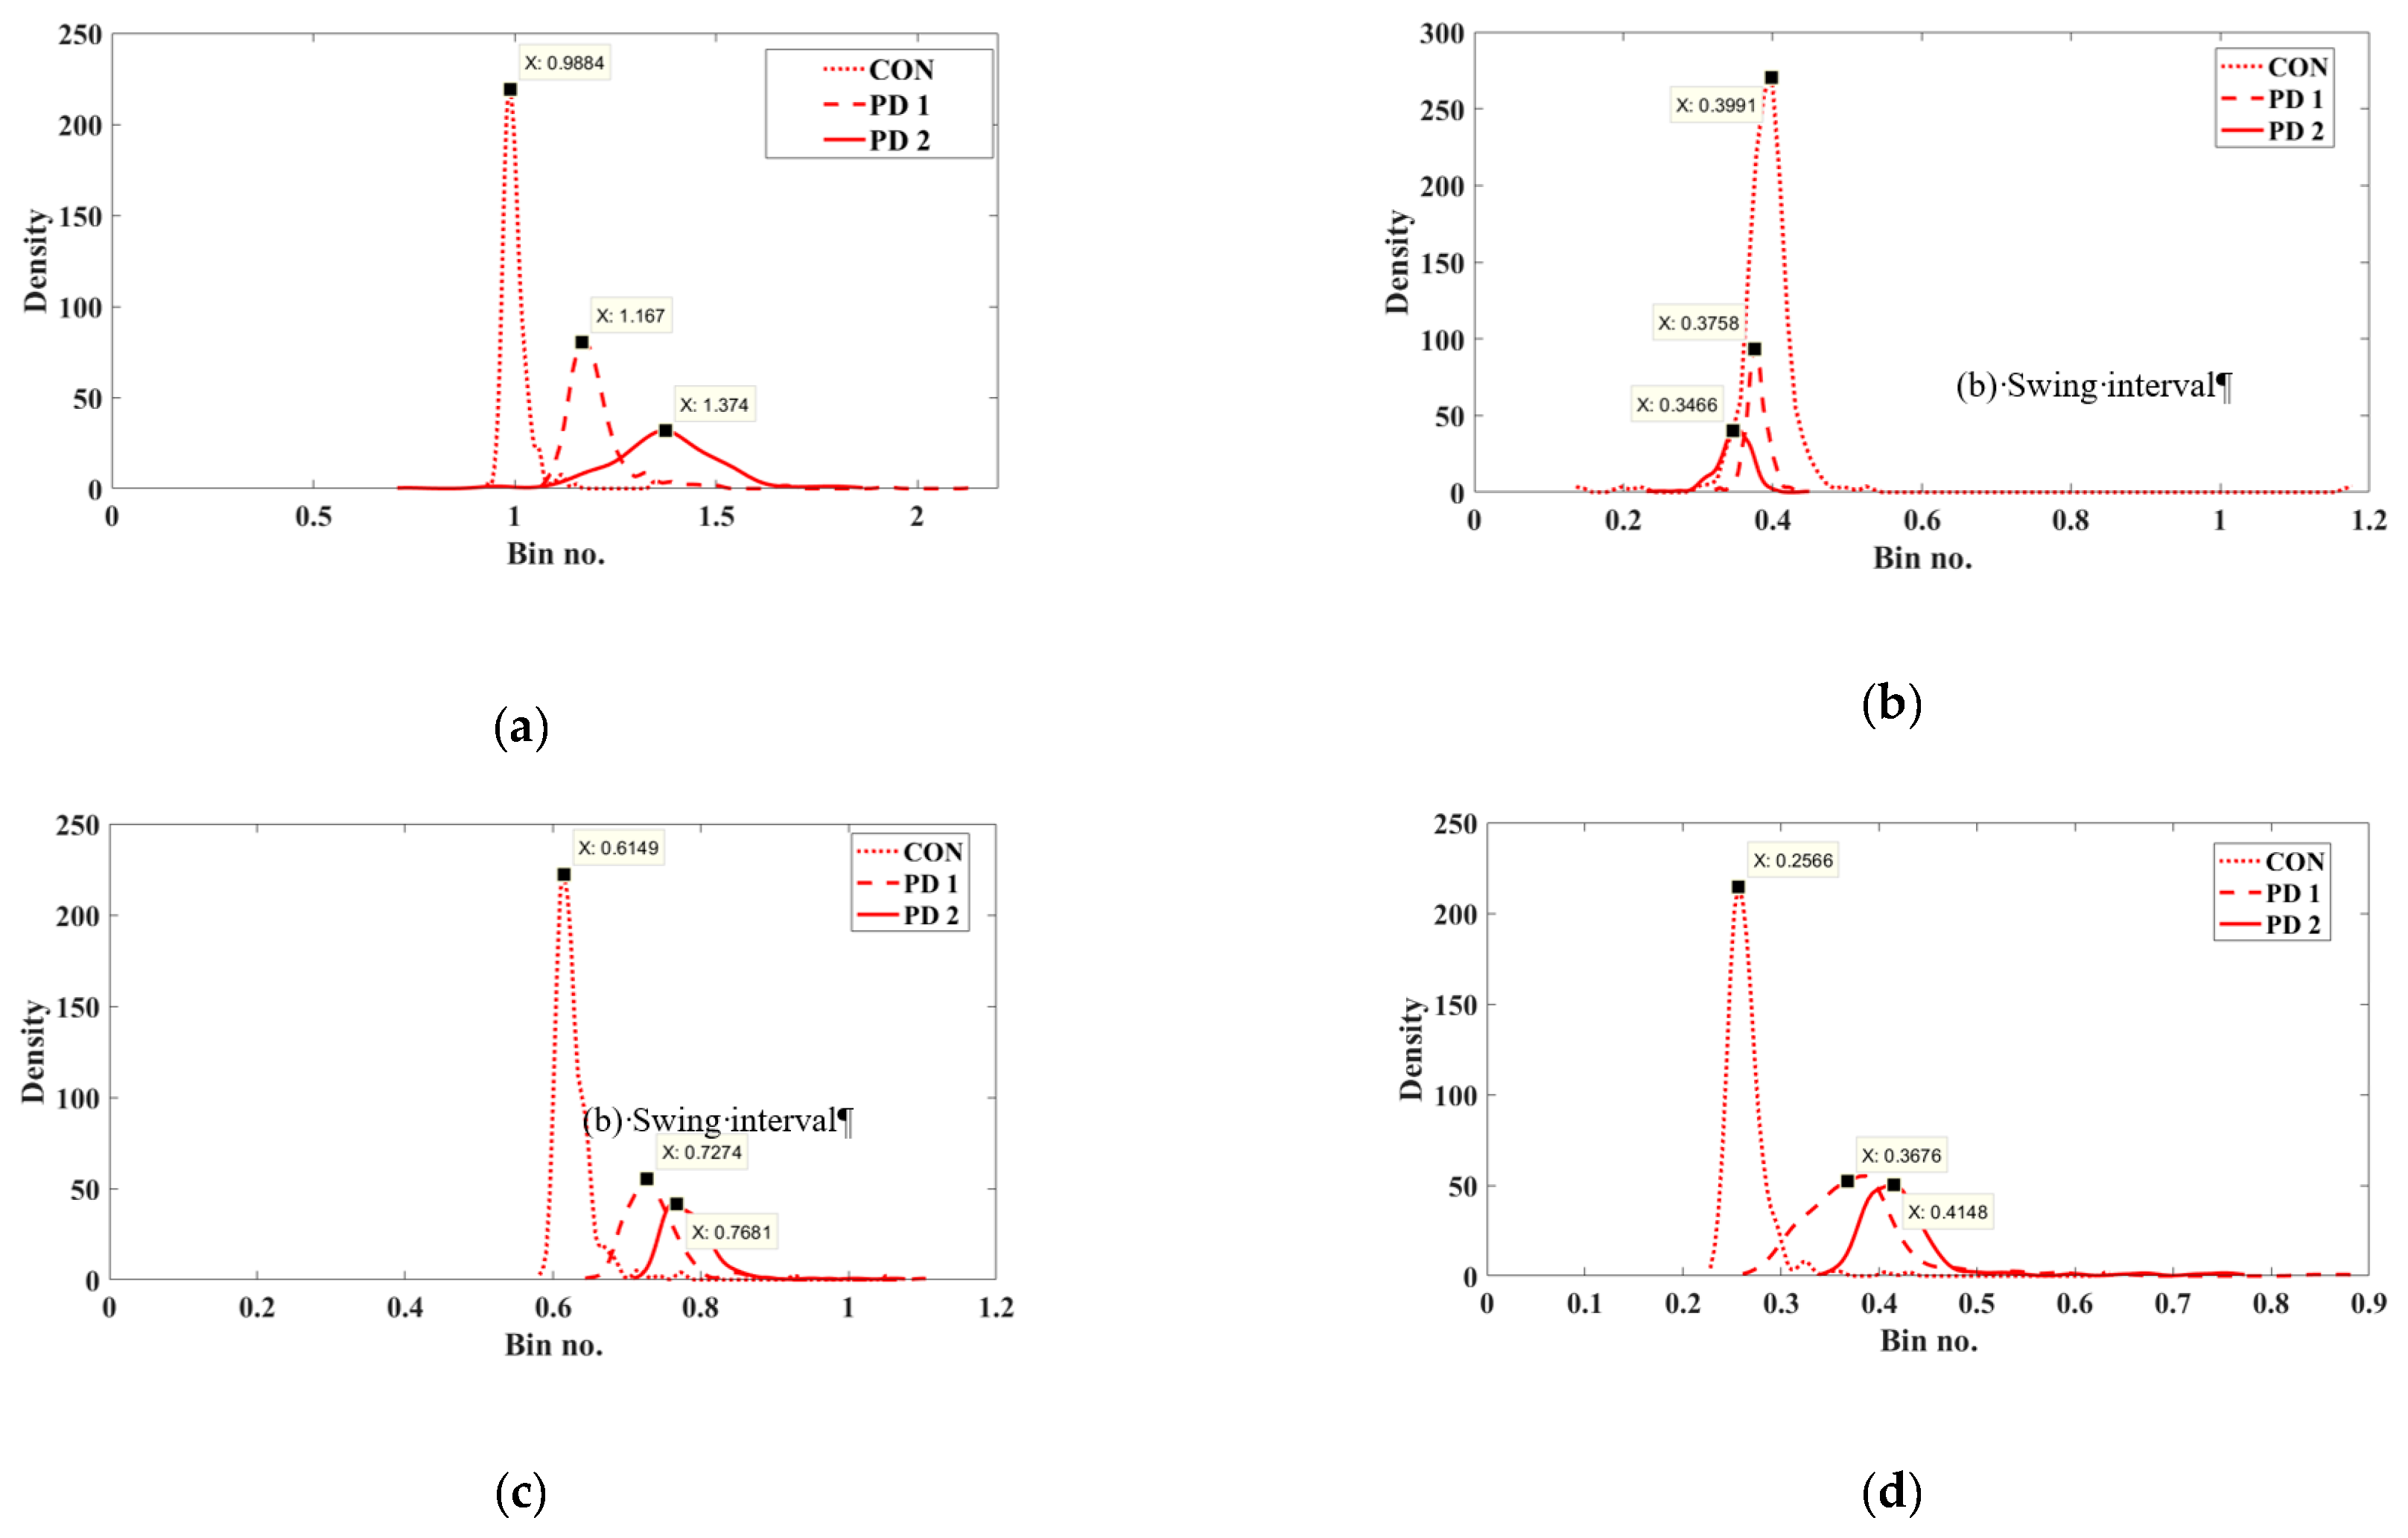
3.1. Histogram
3.2. Lateral Differences
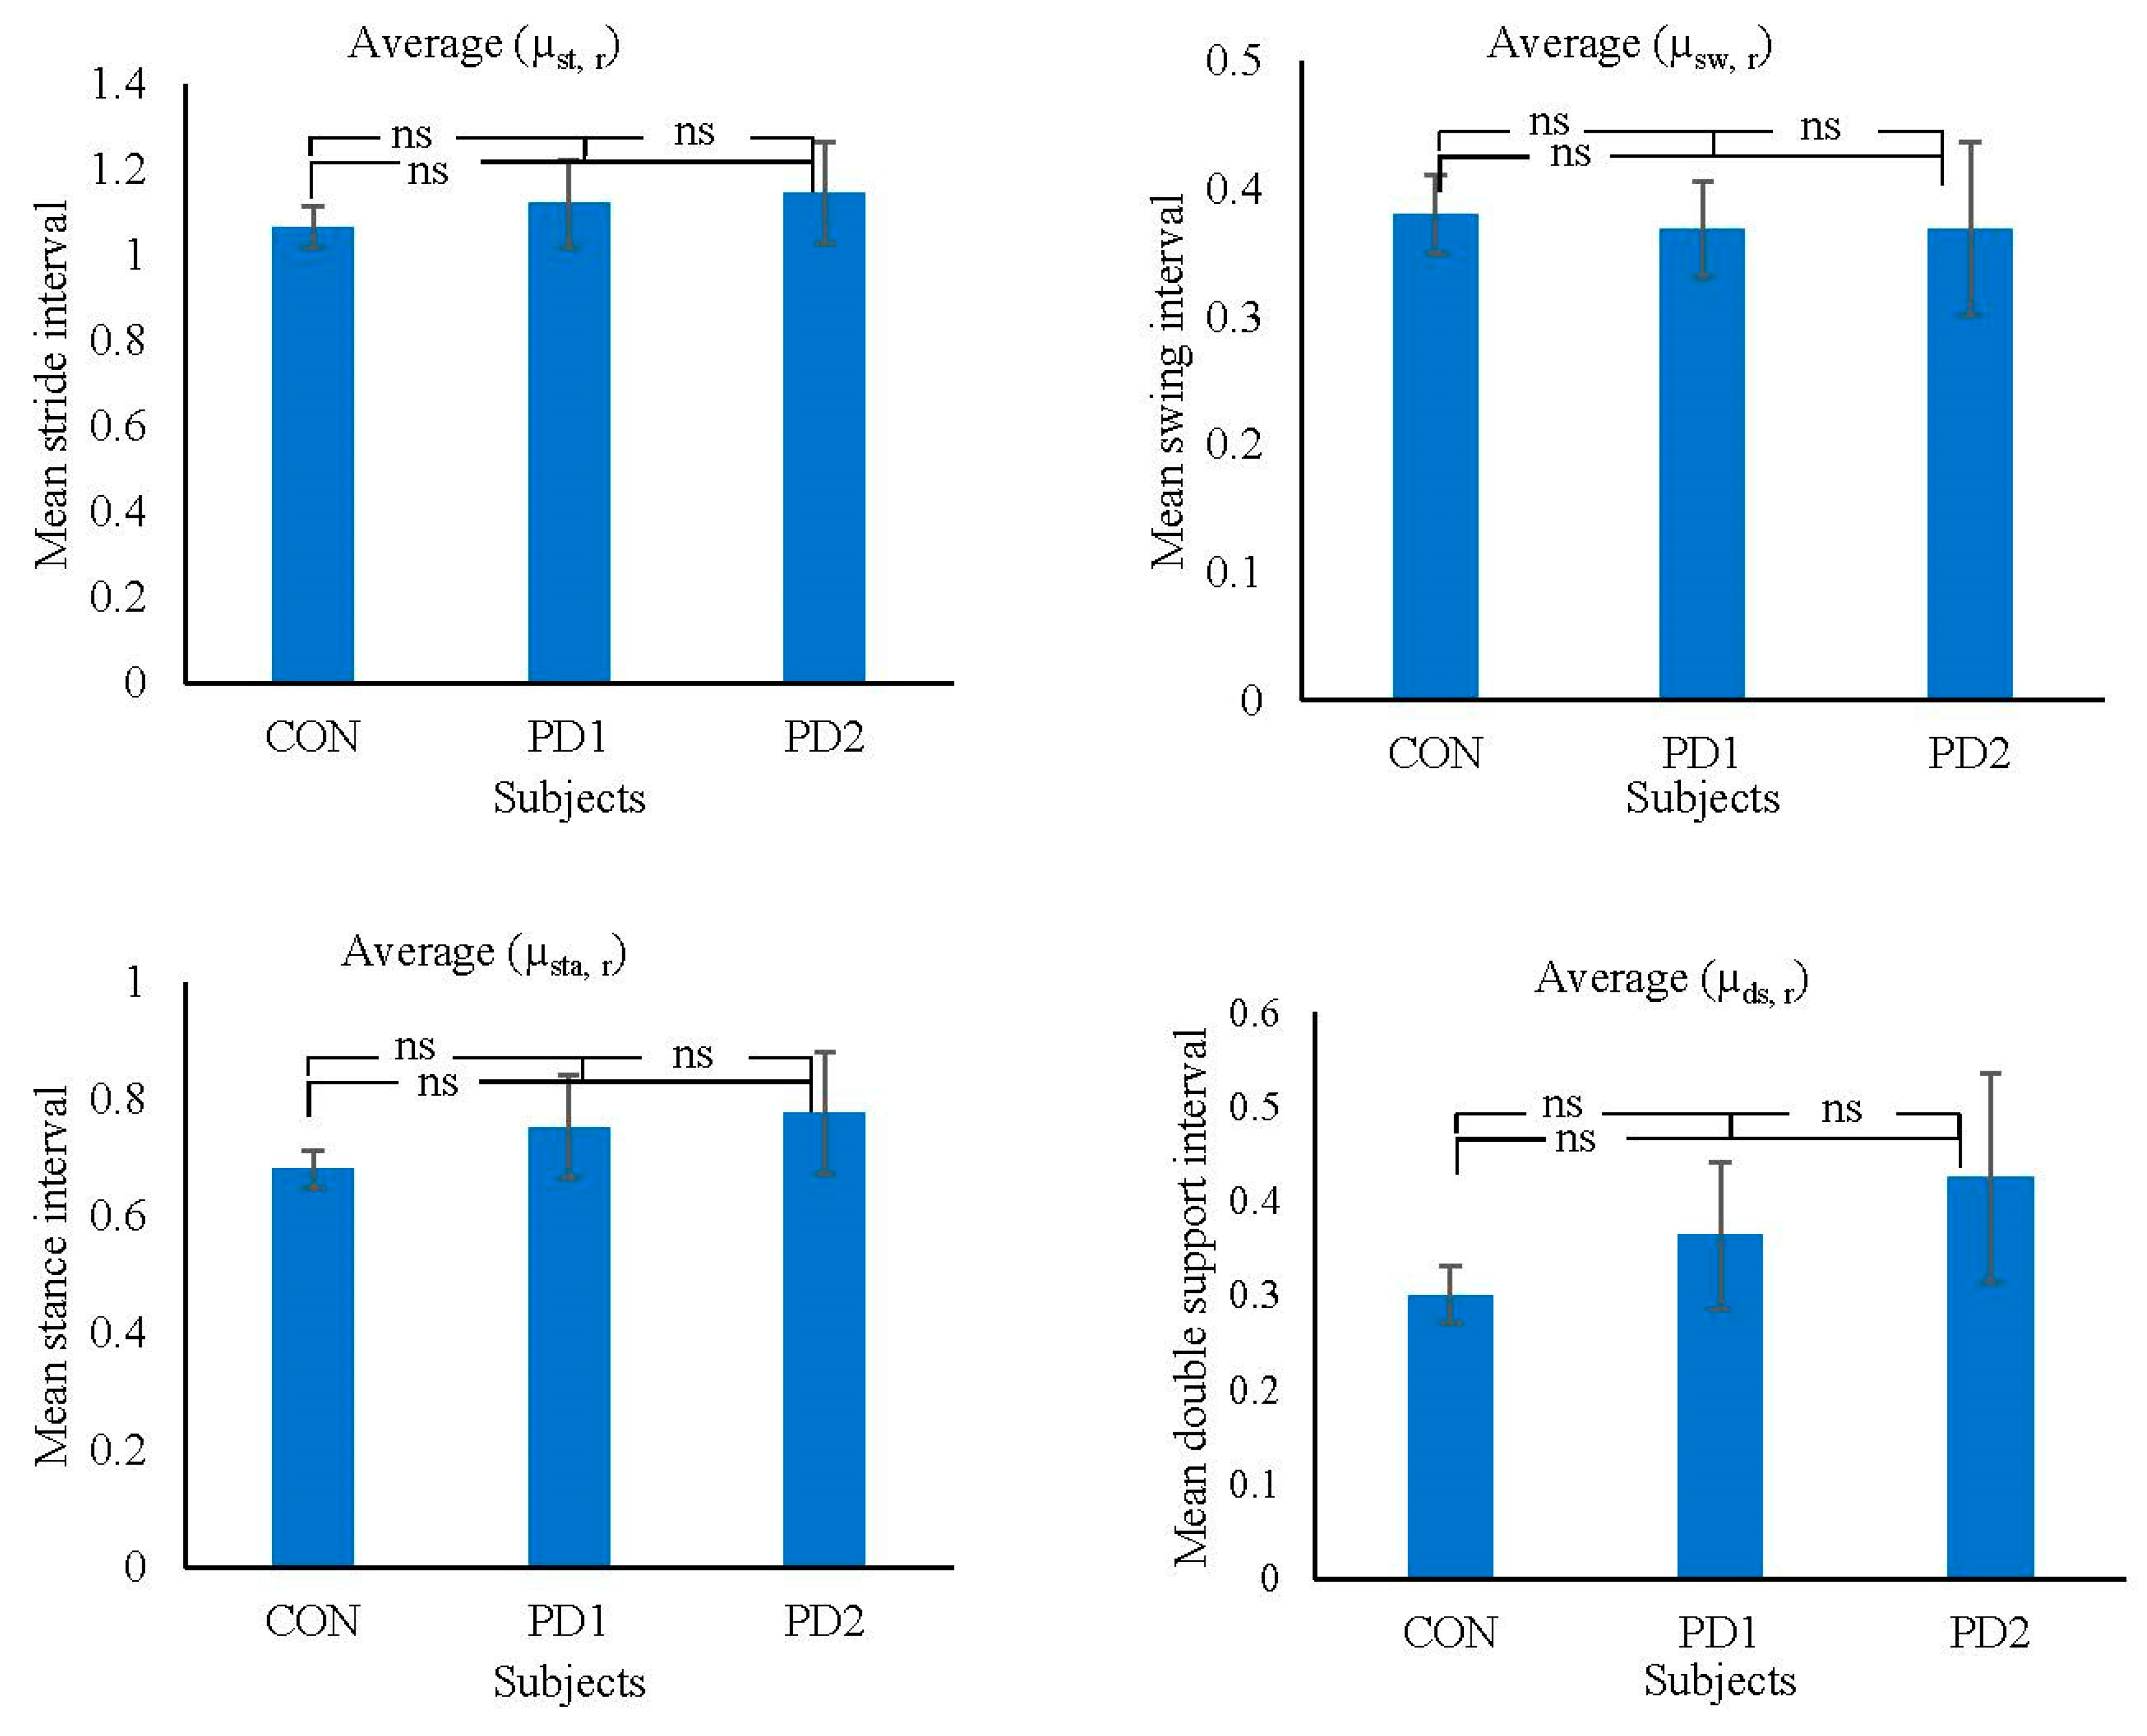
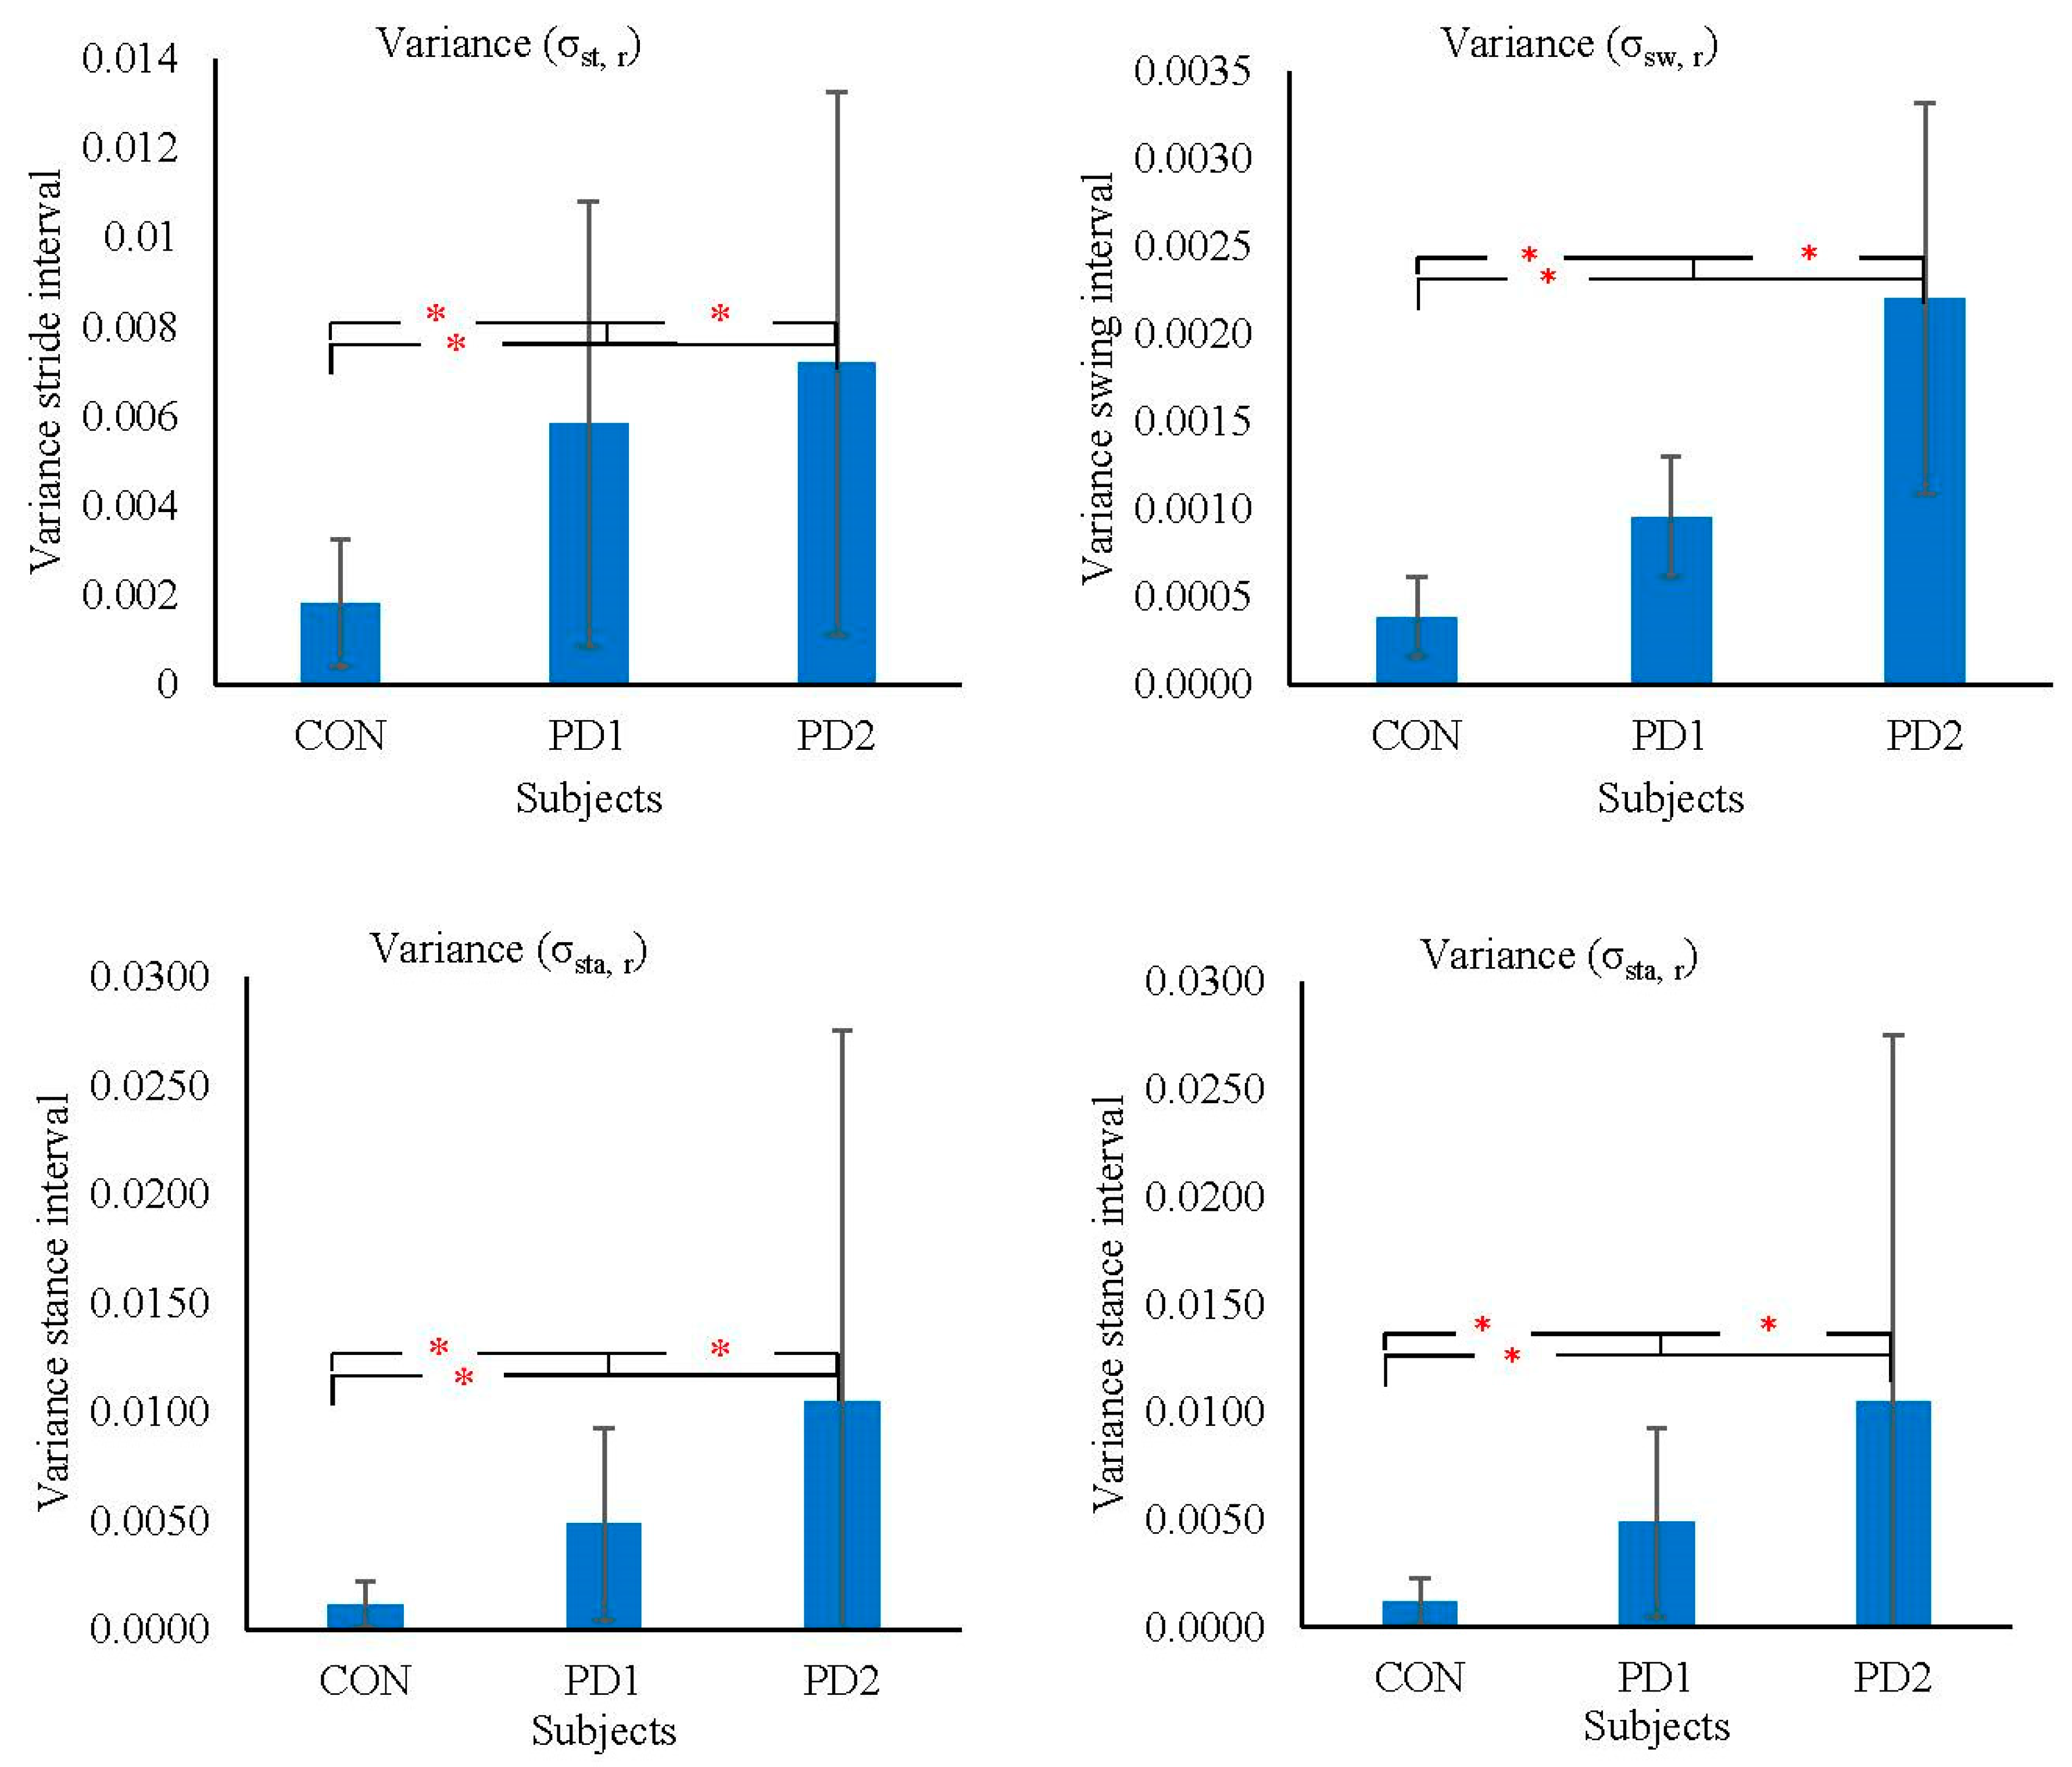
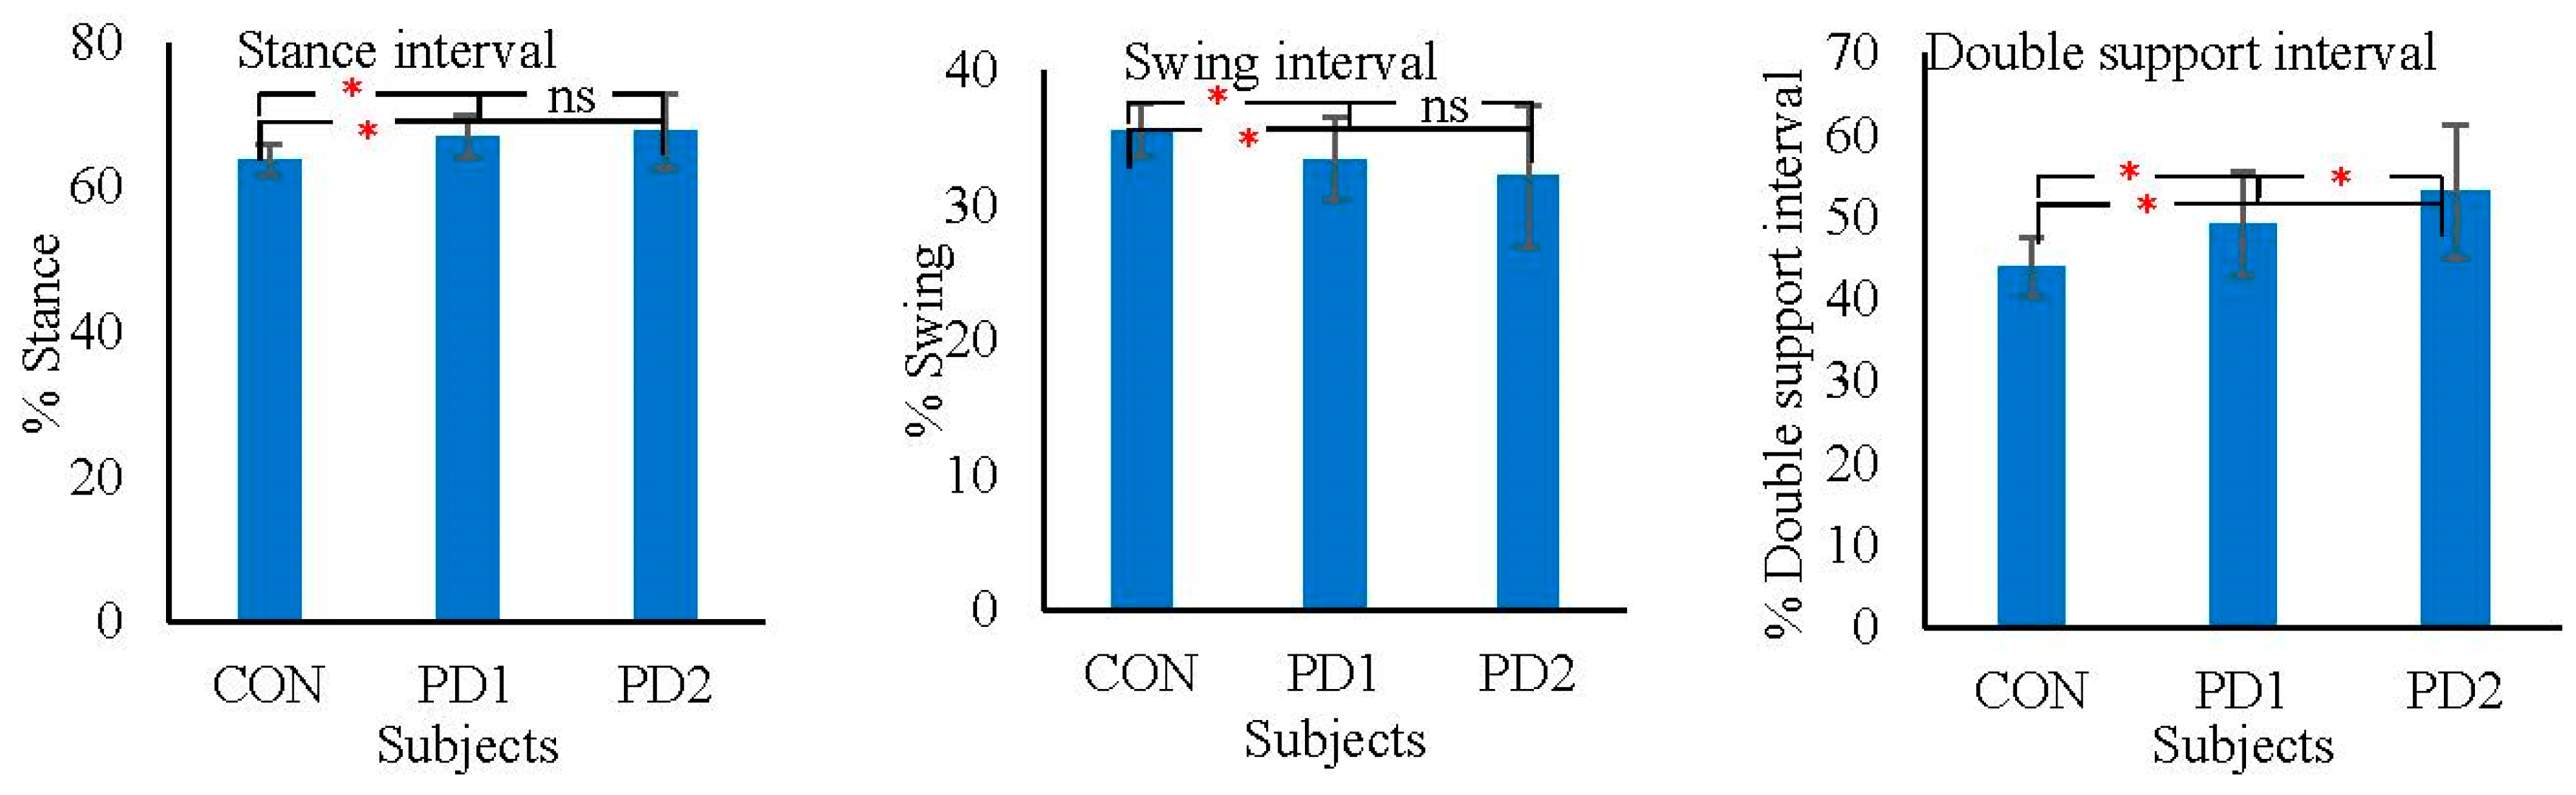
3.3. Features of Stride, Swing, Stance, and Double-Support Interval
- The mean of all the four gait parameters (stride interval, swing interval, stance interval, and double-support interval) was the lowest for CON, higher for PD1, and the maximum for PD2. However, the difference is not statistically significant when CON was compared with PD1, CON was compared with PD2, and PD1 was compared with PD2.
- The variance of all the four gait parameters (stride interval, swing interval, stance interval, and double-support interval) was the lowest for CON, higher for PD1, and the maximum for PD2. The group differences of all four parameters were statistically significant when CON was compared with PD1, CON was compared with PD2, and PD1 was compared with PD2.
4. Discussion
4.1. Lateral Differences
4.2. Features of Stride, Swing, Stance, and Double-Support Interval
4.3. Study Limitations
5. Conclusions
Author Contributions
Funding
Conflicts of Interest
References
- Peng, C.K.; Hausdorff, J.M.; Ladin, Z.; Wei, J.Y.; Goldberger, A.L. Is walking a random walk? Evidence for long-range correlations in stride interval of human gait. J. Appl. Physiol. 1995, 78, 349–358. [Google Scholar]
- Allcock, L.M.; Rowan, E.N.; Steen, I.N.; Wesnes, K.; Kenny, R.A.; Burn, D.J. Impaired attention predicts falling in Parkinson’s disease. Parkinsonism Relat. Disord. 2009, 15, 110–115. [Google Scholar] [CrossRef] [PubMed]
- Balash, Y.; Peretz, C.; Leibovich, G.; Herman, T.; Hausdorff, J.M.; Giladi, N. Falls in outpatients with Parkinson’s disease: frequency, impact and identifying factors. J. Neurol. 2005, 252, 1310–1315. [Google Scholar] [CrossRef] [PubMed]
- Bloem, B.R.; Grimbergen, Y.A.; Cramer, M.; Willemsen, M.; Zwinderman, A.H. Prospective assessment of falls in Parkinson’s disease. J. Neurol. 2001, 248, 950–958. [Google Scholar] [CrossRef]
- Contreras, A.; Grandas, F. Risk of falls in Parkinson’s disease: A cross-sectional study of 160 patients. Parkinson Dis. 2012, 2012, 1–10. [Google Scholar] [CrossRef]
- Latt, M.D.; Lord, S.R.; Morris, J.G.; Fung, V.S. Clinical and physiological assessments for elucidating falls risk in Parkinson’s disease. Mov. Disord. 2009, 24, 1280–1289. [Google Scholar] [CrossRef]
- Sofuwa, O.; Nieuwboer, A.; Desloovere, K.; Willems, A.M.; Chavret, F.; Jonkers, I. Quantitative gait analysis in Parkinson’s disease: comparison with a healthy control group. Arch. Phys. Med. Rehabil. 2005, 86, 1007–1013. [Google Scholar] [CrossRef]
- Morris, M.; Iansek, R.; Matyas, T.; Summers, J. Abnormalities in the stride length-cadence relation in parkinsonian gait. Mov. Disord. 1998, 13, 61–69. [Google Scholar] [CrossRef]
- Combs, S.A.; Diehl, M.D.; Filip, J.; Long, E. Short-distance walking speed tests in people with Parkinson disease: reliability, responsiveness, and validity. Gait. Posture. 2014, 39, 784–788. [Google Scholar] [CrossRef]
- Morris, M.E.; Lansek, R.; Matyas, T.A.; Summers, J.J. Ability to modulate walking cadence remains intact in Parkinson’s disease. J. Neurol. Neurosurg. Psychiatry 1994, 57, 1532–1534. [Google Scholar] [CrossRef]
- Morris, M.E.; Morris, S.; Iansek, R. Reliability of measurements obtained with the Timed "Up & Go" test in people with Parkinson disease. Phys. Ther. 2001, 81, 810–818. [Google Scholar] [PubMed]
- Ferrarin, M.; Lopiano, L.; Rizzone, M.; Lanotte, M.; Bergamasco, B.; Recalcati, M. Quantitative analysis of gait in Parkinson’s disease: a pilot study on the effects of bilateral sub-thalamic stimulation. Gait. Posture 2002, 16, 135–148. [Google Scholar] [CrossRef]
- Vieregge, P.; Stolze, H.; Klein, C.; Heberlein, I. Gait quantitation in Parkinson’s disease-locomotor disability and correlation to clinical rating scales. J. Neural Transmmision 1997, 104, 237–248. [Google Scholar] [CrossRef] [PubMed]
- Adams, S.T.; Leveson, S.H. Clinical prediction rules. Br. Med. J. 2012, 344, 8312–8320. [Google Scholar] [CrossRef]
- Kerr, G.K.; Worringham, C.J.; Cole, M.H.; Lacherez, P.F.; Wood, J.M.; Silburn, P.A. Predictors of future falls in Parkinson disease. J. Neurol. 2010, 75, 116–124. [Google Scholar] [CrossRef]
- Matinolli, M.; Korpelainen, J.T.; Sotaniemi, K.A.; Myllyla, V.V.; Korpelainen, R. Recurrent falls and mortality in Parkinson’s disease: A prospective two-year follow-up study. Acta Neurol. Scand. 2011, 123, 193–200. [Google Scholar] [CrossRef]
- Hausdorff, J.M.; Lowenthal, J.; Herman, T.; Gruendlinger, L.; Peretz, C.; Giladi, N. Rhythmic auditory stimulation modulates gait variability in Parkinson’s disease. Eur. J. Neurosci. 2007, 26, 2369–2375. [Google Scholar] [CrossRef]
- Hausdorff, J.M.; Cudkowicz, M.E.; Firtion, R.; Wei, J.Y.; Goldberger, A.L. Gait variability and basal ganglia disorders: stride-to-stride variations of gait cycle timing in Parkinson’s and Huntington’s disease. Mov. Disord. 1998, 13, 428–437. [Google Scholar] [CrossRef]
- Hausdorff, J.M.; Balash, J.; Giladi, N. Effects of cognitive challenge on gait variability in patients with Parkinson’s disease. J. Geriatr. Psychiatry Neurol. 2003, 16, 53–58. [Google Scholar] [CrossRef]
- Rios, D.A.; Hausdorff, J.M.; Edelberg, K.H. Gait variability and fall risk in community-living older adults: A 1-year prospective study. Arch. Phys. Med. Rehabil. 2001, 82, 1050–1060. [Google Scholar] [CrossRef]
- Hausdorff, J.M.; Schaafsma, J.D.; Balash, Y.; Bartels, A.L.; Gurevich, T.; Giladi Nagai, K. Impaired regulation of stride variability in Parkinson’s disease subjects with freezing of gait. Exp. Brain Res. 2003, 149, 187–194. [Google Scholar] [CrossRef] [PubMed]
- Solomont, J.; Kowall, N.; Hausdorff, J.M. Influence of executive function on locomotor function: divided attention increases gait variability in Alzheimer’s disease. J. Am. Geriatr. Soc. 2003, 51, 1633–1637. [Google Scholar]
- Frenkel-Toledo, S.; Giladi, N.; Peretz, C.; Herman, T.; Gruendlinger, L.; Hausdorff, J.M. Effect of gait speed on gait rhythmicity in Parkinson’s disease: variability of stride time and swing time respond differently. J. Neuroeng. Rehabil. 2005, 2, 23–26. [Google Scholar] [CrossRef] [PubMed]
- Blin, O.; Ferrandez, A.M.; Serratrice, G. Quantitative analysis of gait in Parkinson patients: Increased variability of stride length. J. Neurol. Sci. 1990, 98, 91–97. [Google Scholar] [CrossRef]
- Osamu, H.; Yoshitaka, S.; Toyokazu, S.; Harukazu, T. Spectral analysis of gait variability of stride interval time seires: Comparison of young, elderly and Parkinson’s disease patients. J. Phys. Ther. Sci. 2009, 21, 105–111. [Google Scholar]
- Krishnan, S.; Wu, Y. Statistical Analysis of Gait Rhythm in Patients With Parkinson’s Disease. IEEE Trans. Neural. Syst. Rehabil. Eng. 2010, 18, 150–158. [Google Scholar]
- Mena, D.; Mansour, J.M.; Simon, S.R. Analysis and synthesis of human swing leg motion during gait and its clinical applications. J. Biomech. 1981, 14, 823–832. [Google Scholar] [CrossRef]
- Mochon, S.; McMahon, T.A. Ballistic walking. J. Biomech. 1980, 13, 49–57. [Google Scholar] [CrossRef]
- Echeverria, J.C.; Rodriguez, E.; Velasco, A.; Alvarez-Ramirez, J. Limb dominance changes in walking evolution explored by asymmetric correlations in gait dynamics. Physica A 2010, 389, 1625–1634. [Google Scholar] [CrossRef]
- Mirek, E.; Rudzinska, M.; Szczudlik, A. The assessment of gait disorders in patients with Parkinson’s disease using the three-dimensional motion analysis system Vicon. Neurol. Neurochir. Pol. 2007, 41, 128–133. [Google Scholar]
- Dipaola, M.; Pavan, E.E.; Cattaneo, A.; Frazzitta, G.; Pezzoli, G.; Cavallari, P.; Frigo, C.A.; Isaias, I.U. Mechanical Energy Recovery during Walking in Patients with Parkinson Disease. PLoS ONE 2016, 3, 0156420. [Google Scholar] [CrossRef] [PubMed]
- Gabbard, C.; Hart, S. A question of foot dominance. J. Gen. Physiol. 1996, 123, 289–296. [Google Scholar] [CrossRef] [PubMed]
- Hirokawa, S. Normal gait characteristics under temporal and distance constraints. J. Biomed. Eng. 1989, 11, 449–456. [Google Scholar] [CrossRef]
- Sadeghi, H.; Allard, P.; Labelle, H.; Duhaime, M. Lower limb muscle powers contributions in bilateral able-bodied gait. Physiol. Ther. 2000, 80, 1188–1196. [Google Scholar] [CrossRef]
- Hausdorff, J.M.; Lertratanakul, A.; Cudkowicz, M.E.; Peterson, A.L.; Kaliton, D.; Goldberger, A.L. Dynamic markers of altered gait rhythm in amyotrophic lateral sclerosis. J. Appl. Physiol. 2000, 88, 2045–2053. [Google Scholar] [CrossRef]
- Moody, G.B.; Mark, R.G.; Goldberger, A.L. PhysioNet: A web-based resource for the study of physiologic signals. IEEE Eng. Med. Biol. Mag. 2001, 20, 70–75. [Google Scholar] [CrossRef]
- Ghasemi, A.; Zahediasl, S. Normality Tests for Statistical Analysis: A Guide for Non-Statisticians. Int. J. Endocrinol. Metab. 2012, 10, 486–489. [Google Scholar] [CrossRef]
- Siegel, C. Nonparametric Statistics for the Behavioral Sciences; McGraw-Hill: New York, NY, USA, 1988. [Google Scholar]
- Arora, P.; Srivastava, S.; Arora, K.; Bareja, S. Improved Gait Recognition Using Gradient Histogram Gaussian Image. Procedia Comput. Sci. 2015, 58, 408–413. [Google Scholar] [CrossRef][Green Version]
- Ota, L.; Uchitomi, H.; Hove, M.J.; Orimo, S. Evaluation of severity of Parkinson’s disease using stride interval variability. In Proceedings of the 2012 ICME International Conference on Complex Medical Engineering, Kobe, Japan, 1–4 July 2012; Volume 4, pp. 521–526. [Google Scholar]
- Olmo, D.; Cudeiro, J. Temporal variability of gait in Parkinson disease: effects of a rehabilitation programme based on rhythmic sound cues. Parkinsonism. Relat. Disord. 2005, 11, 25–33. [Google Scholar] [CrossRef]
- Hausdorff, J.M. Gait variability: Methods, modeling and meaning. J. Neuroeng. Rehabil. 2005, 2, 19. [Google Scholar] [CrossRef]
- Baltadjieva, R.; Giladi, N.; Gruendlinger, L.; Peretz, C.; Hausdorff, J.M. Marked alterations in the gait timing and rhythmicity of patients with de novo Parkinson’s disease. Eur. J. Neurosci. 2006, 24, 1815–1820. [Google Scholar] [CrossRef] [PubMed]
- Schaafsma, J.D.; Giladi, N.; Balash, Y.; Bartels, A.L.; Gurevich, T.; Hausdorff, J.M. Gait dynamics in Parkinson’s disease: relationship to Parkinsonian features, falls and response to levodopa. J. Neurol. Sci. 2003, 212, 47–53. [Google Scholar] [CrossRef]
- Gray, P.; Hildebrand, K. Fall risk factors in Parkinson’s disease. J. Neurosci. Nurs. 2000, 32, 222–228. [Google Scholar] [CrossRef] [PubMed]
- Plotnik, M.; Giladi, N.; Hausdorff, J.M. Postural instability and fall risk in Parkinson’s disease: impaired dual tasking, pacing, and bilateral coordination of gait during the ‘‘ON’’ medication state. Exp. Brain Res. 2011, 210, 529–538. [Google Scholar] [CrossRef]
- Weaver, T.B.; Robinovitch, S.N.; Laing, A.C.; Yang, Y. Falls and Parkinson’s Disease: Evidence from Video Recordings of Actual Fall Events. J. Am. Geriatr. Soc. 2016, 64, 96–101. [Google Scholar] [CrossRef]


| Anthropometric Parameter | CON (n = 16) | PD1 (n = 6) | PD2 (n = 9) |
|---|---|---|---|
| Age (years) | 45.66 ± 9.14 | 66 ± 14.3 | 67.33 ± 8.7 |
| Height (m) | 1.83 ± 0.085 | 1.88 ± 0.12 | 1.85 ± 0.17 |
| Weight (kg) | 68.935 ± 10.75 | 81.33 ± 14.3 | 70.88 ± 17.66 |
| Gender (male: female) | 2:14 | 1:5 | 4:5 |
| Gait Intervals | Statistical Parameter | CON | p-Value | PD1 | p-Value | PD2 | p-Value |
|---|---|---|---|---|---|---|---|
| Stride interval | µst, l | 1.095 ± 0.093 | 0.462 | 1.215 ± 0.271 | 0.872 | 1.153 ± 0.123 | 0.894 |
| µst, r | 1.071 ± 0.047 | 1.122 ± 0.102 | 1.147 ± 0.119 | ||||
| σst, l | 0.002 ± 0.003 | 0.497 | 0.005 ± 0.005 | 0.872 | 0.009 ± 0.010 | 0.964 | |
| σst, r | 0.001 ± 0.001 | 0.005 ± 0.004 | 0.007 ± 0.006 | ||||
| Swing interval | µsw, l | 0.396 ± 0.039 | 0.282 | 0.389 ± 0.035 | 0.109 | 0.364 ± 0.063 | 0.757 |
| µsw, r | 0.381 ± 0.030 | 0.368 ± 0.037 | 0.361 ± 0.067 | ||||
| σsw, l | 0.0004 ± 0.0002 | 0.763 | 0.0010 ± 0.0005 | 1 | 0.002 ± 0.001 | 0.825 | |
| σsw, r | 0.0004 ± 0.0002 | 0.0009 ±0.0003 | 0.002 ± 0.001 | ||||
| Stance interval | µsta, l | 0.682 ± 0.033 | 0.821 | 0.732 ± 0.078 | 0.336 | 0.791 ± 0.107 | 0.825 |
| µsta, r | 0.689 ± 0.032 | 0.753 ± 0.089 | 0.778 ± 0.104 | ||||
| σsta, l | 0.002 ± 0.002 | 0.174 | 0.0042 ± 0.003 | 0.872 | 0.005 ± 0.004 | 0.658 | |
| σsta, r | 0.001 ± 0.001 | 0.004 ± 0.004 | 0.010 ± 0.017 |
| Gait Intervals | Statistical Parameter | CON | PD1 | PD2 | p-Value |
|---|---|---|---|---|---|
| Stride interval | µst, r | 1.071 ± 0.047 | 1.122± 0.102 | 1.147 ± 0.119 | 0.194 |
| σst, r | 0.001 ± 0.001 | 0.005 ± 0.004 | 0.007 ± 0.006 | 0.0005 * | |
| Swing interval | µsw, r | 0.381 ± 0.030 | 0.368 ± 0.037 | 0.361 ± 0.067 | 0.518 |
| σsw, r | 0.0004 ± 0.0002 | 0.0009 ± 0.0003 | 0.002 ± 0.001 | 0.00003 * | |
| Stance interval | µsta, r | 0.689 ± 0.032 | 0.753 ± 0.089 | 0.778 ± 0.104 | 0.051 |
| σsta, r | 0.001 ± 0.001 | 0.004 ± 0.004 | 0.010 ± 0.017 | 0.0004 * | |
| Double support | µds, r | 0.301 ± 0.0308 | 0.363 ± 0.077 | 0.425 ± 0.1106 | 0.081 |
| σds, r | 0.0020 ± 0.003 | 0.00441 ± 0.0032 | 0.0090 ± 0.0094 | 0.005 * |
| Gait | CON (%) | PD1 (%) | PD2 (%) | p-Value |
|---|---|---|---|---|
| Stance interval | 63.85 ± 2.23 | 67.0 ± 3.08 | 67.76 ± 5.21 | 0.0295 * |
| Swing interval | 35.63 ± 1.73 | 33.04 ± 3.80 | 32.23 ± 5.2 | 0.0492 * |
| Double-support interval | 44.10 ± 3.58 | 49.20 ± 6.3 | 53.22 ± 8.15 | 0.0021 * |
© 2020 by the authors. Licensee MDPI, Basel, Switzerland. This article is an open access article distributed under the terms and conditions of the Creative Commons Attribution (CC BY) license (http://creativecommons.org/licenses/by/4.0/).
Share and Cite
Keloth, S.M.; Arjunan, S.P.; Kumar, D.K. Variance of the Gait Parameters and Fraction of Double-Support Interval for Determining the Severity of Parkinson’s Disease. Appl. Sci. 2020, 10, 577. https://doi.org/10.3390/app10020577
Keloth SM, Arjunan SP, Kumar DK. Variance of the Gait Parameters and Fraction of Double-Support Interval for Determining the Severity of Parkinson’s Disease. Applied Sciences. 2020; 10(2):577. https://doi.org/10.3390/app10020577
Chicago/Turabian StyleKeloth, Sana M., Sridhar P. Arjunan, and Dinesh K. Kumar. 2020. "Variance of the Gait Parameters and Fraction of Double-Support Interval for Determining the Severity of Parkinson’s Disease" Applied Sciences 10, no. 2: 577. https://doi.org/10.3390/app10020577
APA StyleKeloth, S. M., Arjunan, S. P., & Kumar, D. K. (2020). Variance of the Gait Parameters and Fraction of Double-Support Interval for Determining the Severity of Parkinson’s Disease. Applied Sciences, 10(2), 577. https://doi.org/10.3390/app10020577