Article

Variability of Physical and Chemical Properties of TLUD Stove Derived Biochars

by
Federico Masís-Meléndez
1,2,*,
Diana Segura-Chavarría
1,
Carlos A García-González
3,
Jaime Quesada-Kimsey
1,2 and
Karolina Villagra-Mendoza
4
1
School of Chemistry, Instituto Tecnológico de Costa Rica, Cartago 159-7050, Costa Rica
2
Centro de Investigación y de Servicios Químicos y Microbiológicos, CEQIATEC, Instituto Tecnológico de Costa Rica, Cartago 159-7050, Costa Rica
3
Departamento de Farmacología, Farmacia y Tecnología Farmacéutica, I+D Farma group (GI-1645), Facultad de Farmacia, Agrupación Estratégica de Materiales (AeMAT) and Health Research Institute of Santiago de Compostela (IDIS), Universidad de de Santiago de Compostela, E-15782 Santiago de Compostela, Spain
4
School of Agricultural Engineering, Instituto Tecnológico de Costa Rica, Cartago 159-7050, Costa Rica
*
Author to whom correspondence should be addressed.
Appl. Sci. 2020, 10(2), 507; https://doi.org/10.3390/app10020507
Submission received: 21 November 2019 / Revised: 2 January 2020 / Accepted: 3 January 2020 / Published: 10 January 2020
(This article belongs to the Special Issue Environmental Applications of Biochar)

Abstract

:
Biochar is a carbon-rich organic material, obtained by the thermochemical conversion of biomass in an oxygen-limited environment, used as a soil amendment to stimulate soil fertility and improve soil quality. There is a clear need in developing countries for access to low cost, low technology options for biochar production, for example, top-lit updraft (TLUD) stoves, which are popular and spread worldwide. However, TLUD biochars are inevitably very variable in their properties for a variety of reasons. We present laboratory triplicate tests carried out on TLUD biochars obtained from waste pinewood and a Guadua bamboo. Analyzed properties include specific surface area (A-BET), porosity, skeletal density, hydrophobicity, proximal and elemental composition, cation exchange capacity (CEC), relative liming capacity and pH. SEM images of the bamboo and wood biochars are compared. The biochars were mixed with composted human excreta at 5% and 10% biochar content, and available water content (AWC) was analyzed. Operating temperatures in the TLUD were recorded, showing different behaviors among the feedstocks during the process. Differences in operating temperatures during charring of the bamboo samples seem to have led to differences in A-BET, hydrophobicity and CEC, following unprecedented trends. For the mixtures of the biochars with compost, at 5% biochar no significant differences were observed for AWC. However, in the 10% biochar mixtures, bamboo biochar showed an unexpectedly high AWC. Overall, variations of chemical and physical properties between bamboo biochars were greater, while pinewood biochars showed similar properties, consistent with more homogeneous charring temperatures.

1. Introduction

In recent years, there has been an increasing interest in biochar for agricultural and environmental applications. This includes large-scale operations as well as small-scale, low technology and low budget production in developing countries. Knowledge of biochar properties is essential to maximize its potential benefits. When used as soil amendment, biochar serves for carbon sequestration [1], enhances the physical properties of the soil, improves water holding capacity [2], and acts as a sorbent for pollutants and nutrients [3]. These contributions of biochar vary with its quality. Biochar quality for soil amendment relies primarily on the volume and size of its pores and on the functional groups on the surface [4]. These aspects are driven by key factors; known as the feedstock type [5,6], the biochar particle size [7] and the pyrolysis conditions, for instance, the charring temperature, the heating rate and the residence or holding time [8].
Glaser et al. [9] considered biochar to be a key factor of the terra preta, which owes its name to the Amazonian dark earths, combined in the soil with massive amounts of nutrients and microbial processes. Biochar enhances soil quality by improving its holding capacity for nutrients and water, increasing their availability, augmenting populations of beneficial soil microorganisms and optimizing the water and air permeability of the soil [3]. A directly derived concept is terra preta sanitation (TPS) [10], which merges biochar with bio-waste management and sanitation. The bio-wastes comprehend human excreta collected in urine-diverting toilets [11] and animal excrements [9]. To ensure a thorough sanitization during composting, TPS relies on a lactic acid fermentation pathway for the wastes [12].
Probably, the major contributions that added biochar can make to the agronomic value of soils are the entailing improvements in the soil’s cation exchange capacity (CEC), the liming effect [6], and its water retention capacity [13]. CEC is a measure of the negative charges in a material, which allows it to retain positive exchangeable cations such as K+, Ca2+ and NH4+, and is therefore a desirable quality in a soil. Specific studies for application of biochars in soil remediation [14] have shown that pyrolysis conditions affect the chemical functional groups formed at the surface, determining their CEC. In fact, Mukherjee et al. [15] found evidence that a higher CEC provides better resistance against soil acidification. According to Glaser et al. [16], CEC can be mainly attributed to carboxyl groups (–COO–) formed by oxidation. Other functional groups such as carbonyl, phenolic hydroxyl, ether and hydroxyl, also contribute to CEC and hydrophobicity by acting as polar sites on an otherwise relatively non-polar and hydrophobic surface [17]. CEC depends on the amount of available surface and the density of charge on it, while the structure of a biochar determines its porosity and thereby its specific surface area (SSA); so CEC can be considered to be a combined effect of specific surface area, density of charge and porosity [18,19].
The porosity of a biochar determines its potentiality to interact with water and the nutrients it carries. The mesopores (i.e., diameters between 2 and 50 nm) are sorptive to liquids, while the macropores (i.e., >50 nm diameter) are retentive to plant-available water [20,21]. According to Verheijen et al. [22], porosity of biochars largely consists of micropores, being possible to find exceptions with a higher number of mesopores [23], and microporosity depends heavily on feedstock. However, microporosity does not contribute to the additional plant-available water content (AWC) that a biochar can lend to a soil, so a higher SSA in a biochar amendment may not entail a higher AWC in the amended soil.
Spokas et al. [1] purported that physical and chemical properties of a biochar are crucial to deliver benefits in a soil. However, those benefits rely on the intricate role of feedstock selection [6] and pyrolysis conditions (e.g., heating rate, holding time and temperature [7,8]). Additionally, once incorporated in a soil the biochar particle size [7] is of critical importance as well. A better understanding of this relation has been pursued by studying laboratory-produced biochars obtained from different source materials in different pyrolysis conditions [24]. Studies of adsorption on such biochars have been carried out with metal cations [25,26], soil-borne arsenic [27] and complex ions as nitrate, ammonium and phosphate [5,28].
The past years have seen increasing interest in laboratory produced biochars and lower interest in large-scale produced biochars. Advanced conversion systems allow precise control of operating conditions and, coupled with feedstock selection, permit customization of biochar physical and chemical properties [1]. This has led to a gap in current literature regarding quality control of biochar made by straightforward techniques commonly promoted for small scale agricultural environments, such as TLUD gasifier cook stoves [29,30]. In a TLUD stove, partial combustion of biomass allows production of heat, leaving behind residual biochar that can be incorporated along with the ashes into a soil [29,31]. However, highly variable pyrolysis conditions may lead to unpredictable qualities in these biochars.
This work discusses, in terms of their chemical and physical properties related to use in soils, the qualities of two biochars derived from Guadua angustifolia bamboo and pinewood, produced in a commercially available TLUD gasifier cook stove. It seeks a better understanding of how the TLUD stove production process affects these properties. Additionally, this work strives to demonstrate the enhancement of the soil water retention properties of a compost soil amendment produced from the TPS, achieved by the addition of biochar. This work can be useful to researchers and technicians who are researching or promoting the use of biochars in developing countries, obtained by means of TLUD stoves and other similar low technology methods for soil remediation.

2. Materials and Methods

2.1. Description of Source Materials

Triplicate lots, one from Guadua angustifolia bamboo (B) and one from construction waste pinewood (W) produced two biochars. The corresponding biochars were denoted as xBy, being x the feedstock source (B or W) and y the lot number (1, 2 or 3). The preparation of each material is described further on. The composted fecal waste was obtained by composting a mixture of coffee parchment skin and human feces for six months. The fecal waste was retrieved from a urine-diverting toiled (i.e., dry toilet) located in León Cortez province of San José, Costa Rica, after eight months of stabilization. The solid was kept in a closed compartment located below the toilet. The sample was stored inside a plastic bag and transported in cold directly to the laboratory. Soil improvers were prepared by mixing composted fecal waste with biochars (TPS) in several proportions, as described further on.

2.2. Biochar Preparation

The bamboo feedstock was stored in sections shorter than 150 cm during a period of six months in greenhouse conditions prior to charring. Guadua bamboo is known to reach a moisture content ranging 10–20% (dry base) under similar conditions [32,33]. The internode part of the bamboo was split in half and nodes put apart. The dried internodes were cut to pieces that would fit into the TLUD chamber. The pinewood feedstock was air dried in a greenhouse for at least 10 days and cut into rectangles of 20 cm × 10 cm. The preparation of the feedstocks took place on the same day for each and the material was mixed and stored to ensure homogeneity in the triplicate charring tests. Approximately 2–3 kg of feedstock material was loaded into the stove (SeaChar Deluxe Estufa Finca Farm Stove by Art Donnelly, USA) each time and lighted at the top. For biochar production, 60 min of carbonization in the stove were needed and approximately 60 min for cooling of the char in an airtight auxiliary container. The 60 min timespan employed for carbonization was chosen to ensure the absence of flames in the stove when collecting the char, as an evidence of completed pyrolysis. Temperature was monitored by means of two type K thermocouples 15 cm long inserted through the wall into the combustion chamber at 13 cm (I) and 18 cm height (II) from the bottom. They were connected to an Arduino Uno Rev3 controller, for data acquisition. The biochar obtained was ground, homogenized, and kept in airtight plastic bags for posterior use.

2.3. Biochar Physicochemical Analysis

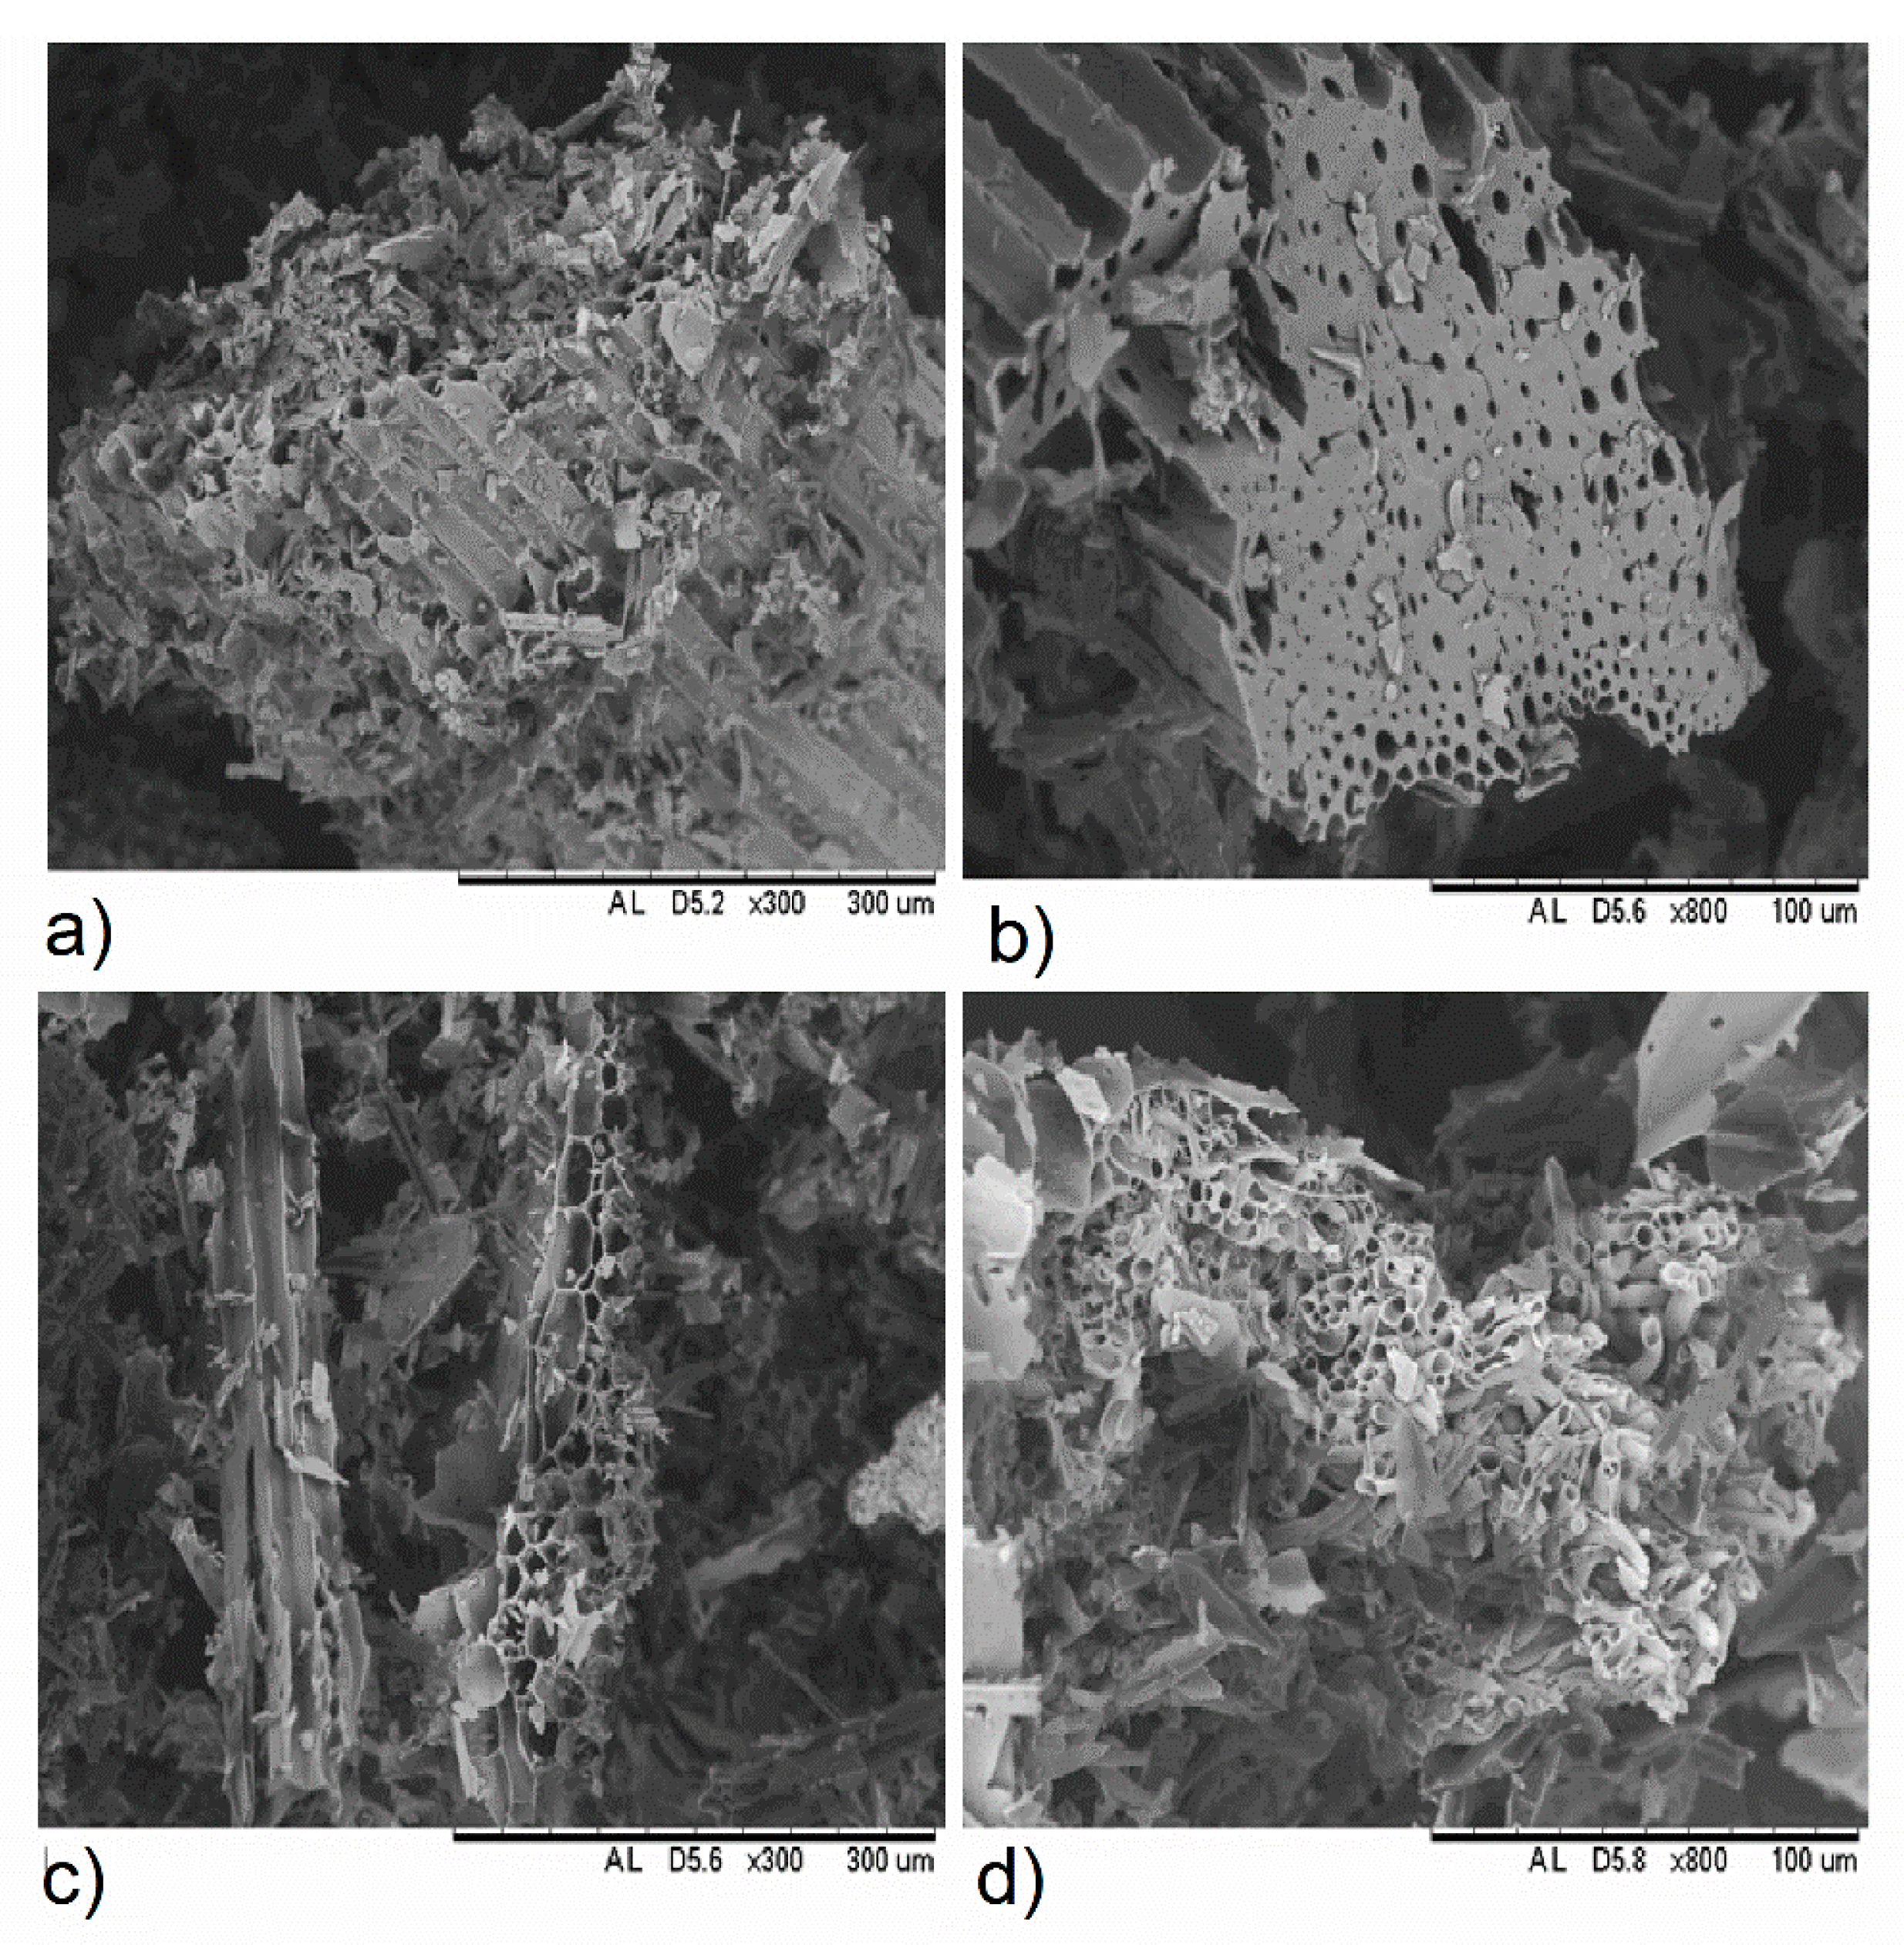
2.3.1. Scanning Electron Microscope (SEM)

Biochar structure and surface topography were analyzed by scanning electron microscopy (SEM), using an electron microscope, TM 3000, Hitachi Tabletop Microscope, TYO, Japan. The beam was directed at the biochar surface coated with a thin film of gold to improve contrast. Magnification ranged from 15× to 30,000×. Two biochar samples were chosen to contrast different structures, one from each group of biochars.

2.3.2. Brunauer–Emmett–Teller (BET) and Skeletal Density Analysis

N2 adsorption–desorption analyses were carried out using an ASAP 2000 instrument (Micromeritics Inc., Norcross, GA, USA) to determine the textural properties of the different biochars. Biochars were outgassed under vacuum (<1 mPa) and at 70 °C for 24 h before analysis. The specific surface areas (A-BET) of the biochars were calculated using the Brunauer–Emmett–Teller (BET) method. Specific pore volume was determined by the Barrett–Joyner–Halenda (BJH) method, as well as mean pore diameter (Dp,BJH-D) from the desorption curve data.
The skeletal density was determined using a helium-pycnometer from Quantachrome Inc. (Boynton Beach, FL, USA) Operating conditions were set at 25 °C (r.t.) and 1.01 bar. Skeletal density values were obtained from five replicates and expressed as mean ± standard deviation.

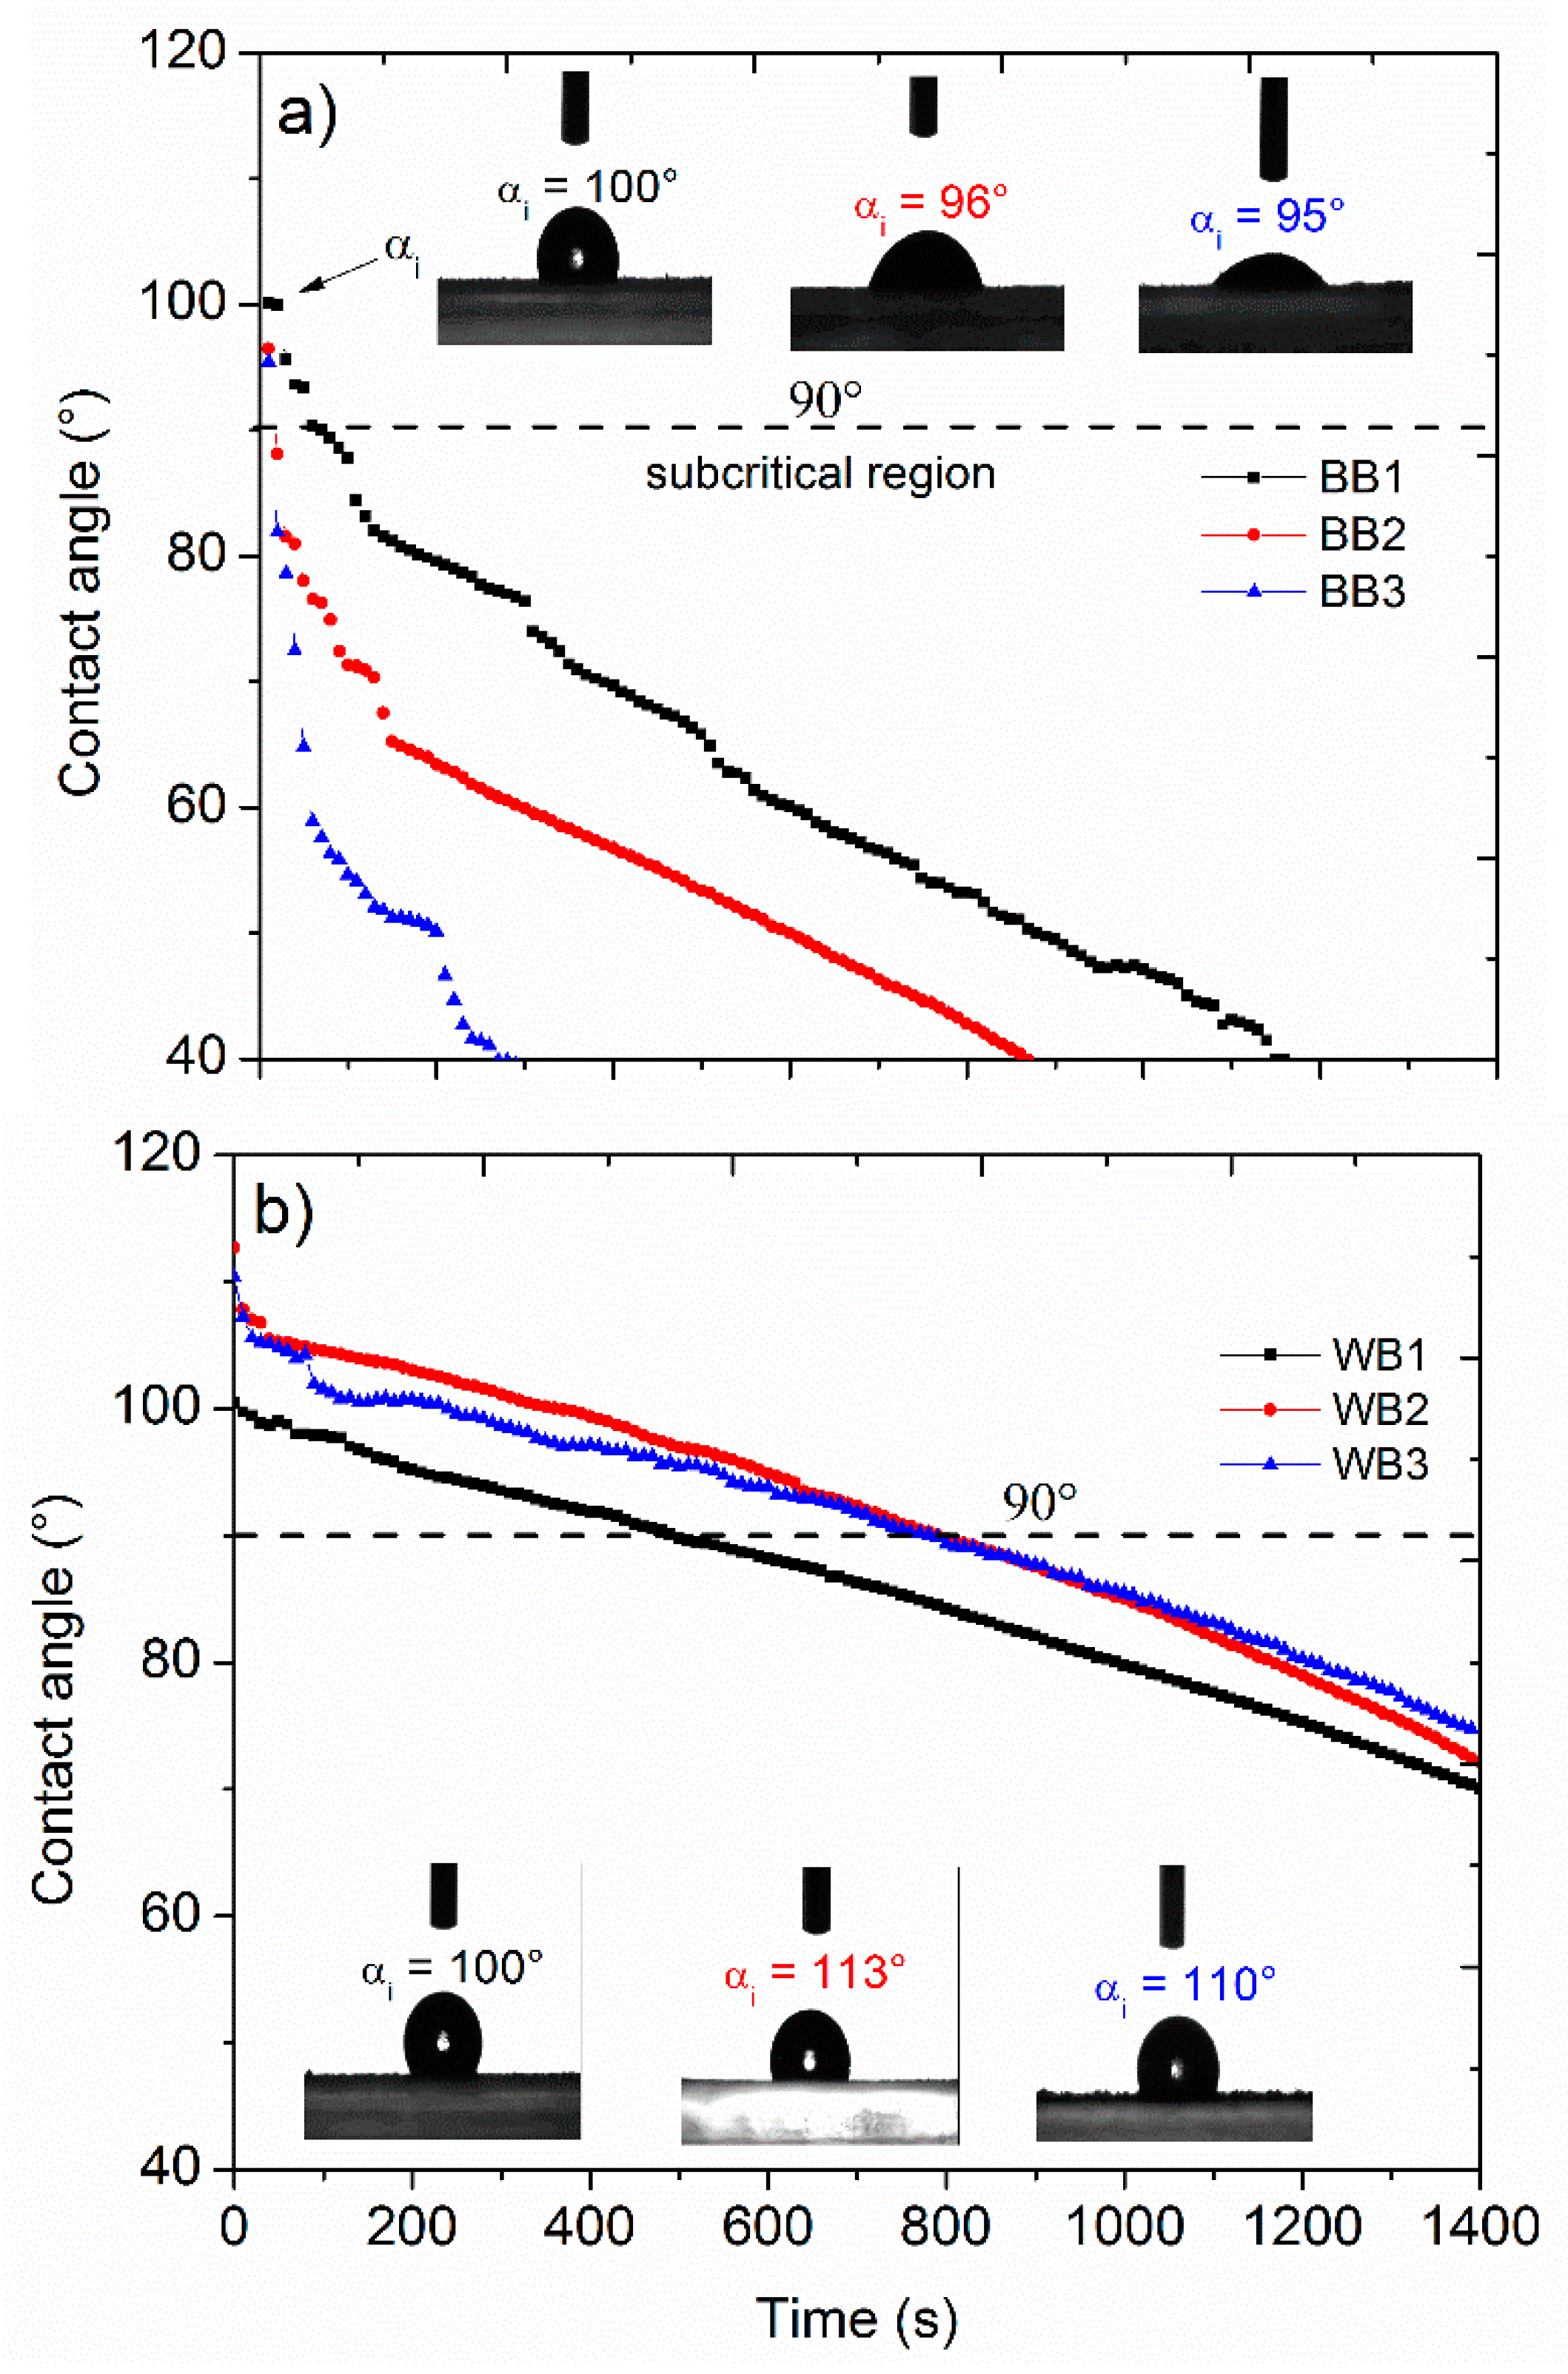
2.3.3. Hydrophobicity

The initial and time dependent contact angle of a small droplet (2 µL) on a surface covered with biochar dust (particle size fraction <63 µm) was measured at 20 °C according to the method of Bachmann et al. [34], which is the sessile drop contact angle method to assess the wetting properties of a solid. Biochar particles were spread out on a double-sided adhesive tape fastened to the frosted end of a microscope glass slide (24.4 mm × 76.2 mm); a weight of 100 g was used to press the biochar particles onto the tape during 5 s, after which the excess was removed by applying a light vibration. The water repellency of the material was measured by placing a small water droplet on the surface and recording the contact angle every 10 s during 1800 s (30 min) using an automated goniometer ramé-hart Model 590, ramé-hart instruments co, NJ, USA, with DROPimage software 2.5.02 by Finn Knut Hansen, OS, Norway, 2006.

2.3.4. Proximate Analysis

Fixed carbon (FC) and ash content were determined in the biochars according to the ASTM E1131-08 method, through thermogravimetric (TGA) analysis with a TA SDT Q600, TA Instruments, DE, USA. A mass of 8–11 mg of biochar was heated in a nitrogen atmosphere, with a mass flux of 50 mL/min until the temperature reached 110 °C at a rate of 50 °C/min; then following an isotherm of 5 min, a new rate of 10 °C/min was imposed until the temperature reached 600 °C. While keeping a mass flux of 50 mL/min, a new isotherm of 15 min was held; then the nitrogen atmosphere was changed to oxygen and a last isotherm of 10 min at 600 °C was held. A last gradient of 20 °C/min was applied to reach 900 °C. Afterwards, the results were examined with the Universal Analysis 2000 software, version 4.5A, Waters LLC, DE, USA, 2007, to obtain weights and temperatures.

2.3.5. Elemental Analysis

The analysis of C, H, N and S of the biochars was determined through a Vario MACRO cube analyzer, Elementar Americas Inc, NY, USA. The O content (weight %) was determined by mass balance: i.e., O = 100 − (C + H + N + S + ash), following the method proposed by Li et al. [5]. Duplicates were conducted for each sample.

2.3.6. pH and Electrical Conductivity

Three grams of biochar were weighed by duplicate in a 50 mL plastic flask with 30 mL of deionized water, and the mix was shook in an orbital shaker Hotech Instruments Corp. 702R, TPE, Taiwan, during 1 h at 30 ± 1 rpm and 25 ± 0.25 °C. Afterwards, the sample was filtered using Sartorius Stedim paper number 393. Conductivity of filtered solution was measured with a water conductivity meter Hanna Instruments HI98312, R.I, USA.

2.3.7. Liming or Neutralizing Capacity

The liming capacity was determined from duplicate analysis. Approximately, 1 g of biochar was weighed in a 100 mL glass flask, and 50 mL of HCl (ACS reagent, 37%, Sigma-Aldrich, Darmstadt, Germany) solution of approximately 0.5 mol/L was added. It was kept at 50 °C during 5 min, and the mix was cooled down and filtered through Sartorius Stedim paper number 393. An acid-base titration was performed over 10 mL of the filtered solution in order to neutralize the remaining HCl, using a sodium hydroxide solution 0.2672 mol/L (≥98%, pellets, Sigma Aldrich, Darmstadt, Germany), previously standardized against KHP (potassium hydrogen phthalate), Certipur® Reag. Ph Eur,Reag. USP, SUPELCO, Darmstadt, Germany. The relative liming effect (RLE) was calculated as the neutralized mmol H+ to the total mmol H+ applied ratio that 100 g of biochar can neutralize, following Equation (1) (for further details see Supplementary Data).
R e l a t i v e   l i m i n g   e f f e c t , = ( t o t a l   m m o l   H C l r e m a n e n t   m m o l   H C l ) t o t a l   m m o l   H C l × 100 .
Potential liming capacity (PLC) was accessed as the milliequivalent (meq) of H+ neutralized by one gram of biochar, following Equation (2):
n e u t r a l i z e d   m e q   H + g   b i o c h a r = ( t o t a l   m m o l   H C l r e m a n e n t   m m o l   H C l ) 1   g   b i o c h a r × 1 m e q   H + 1 m m o l   H + .

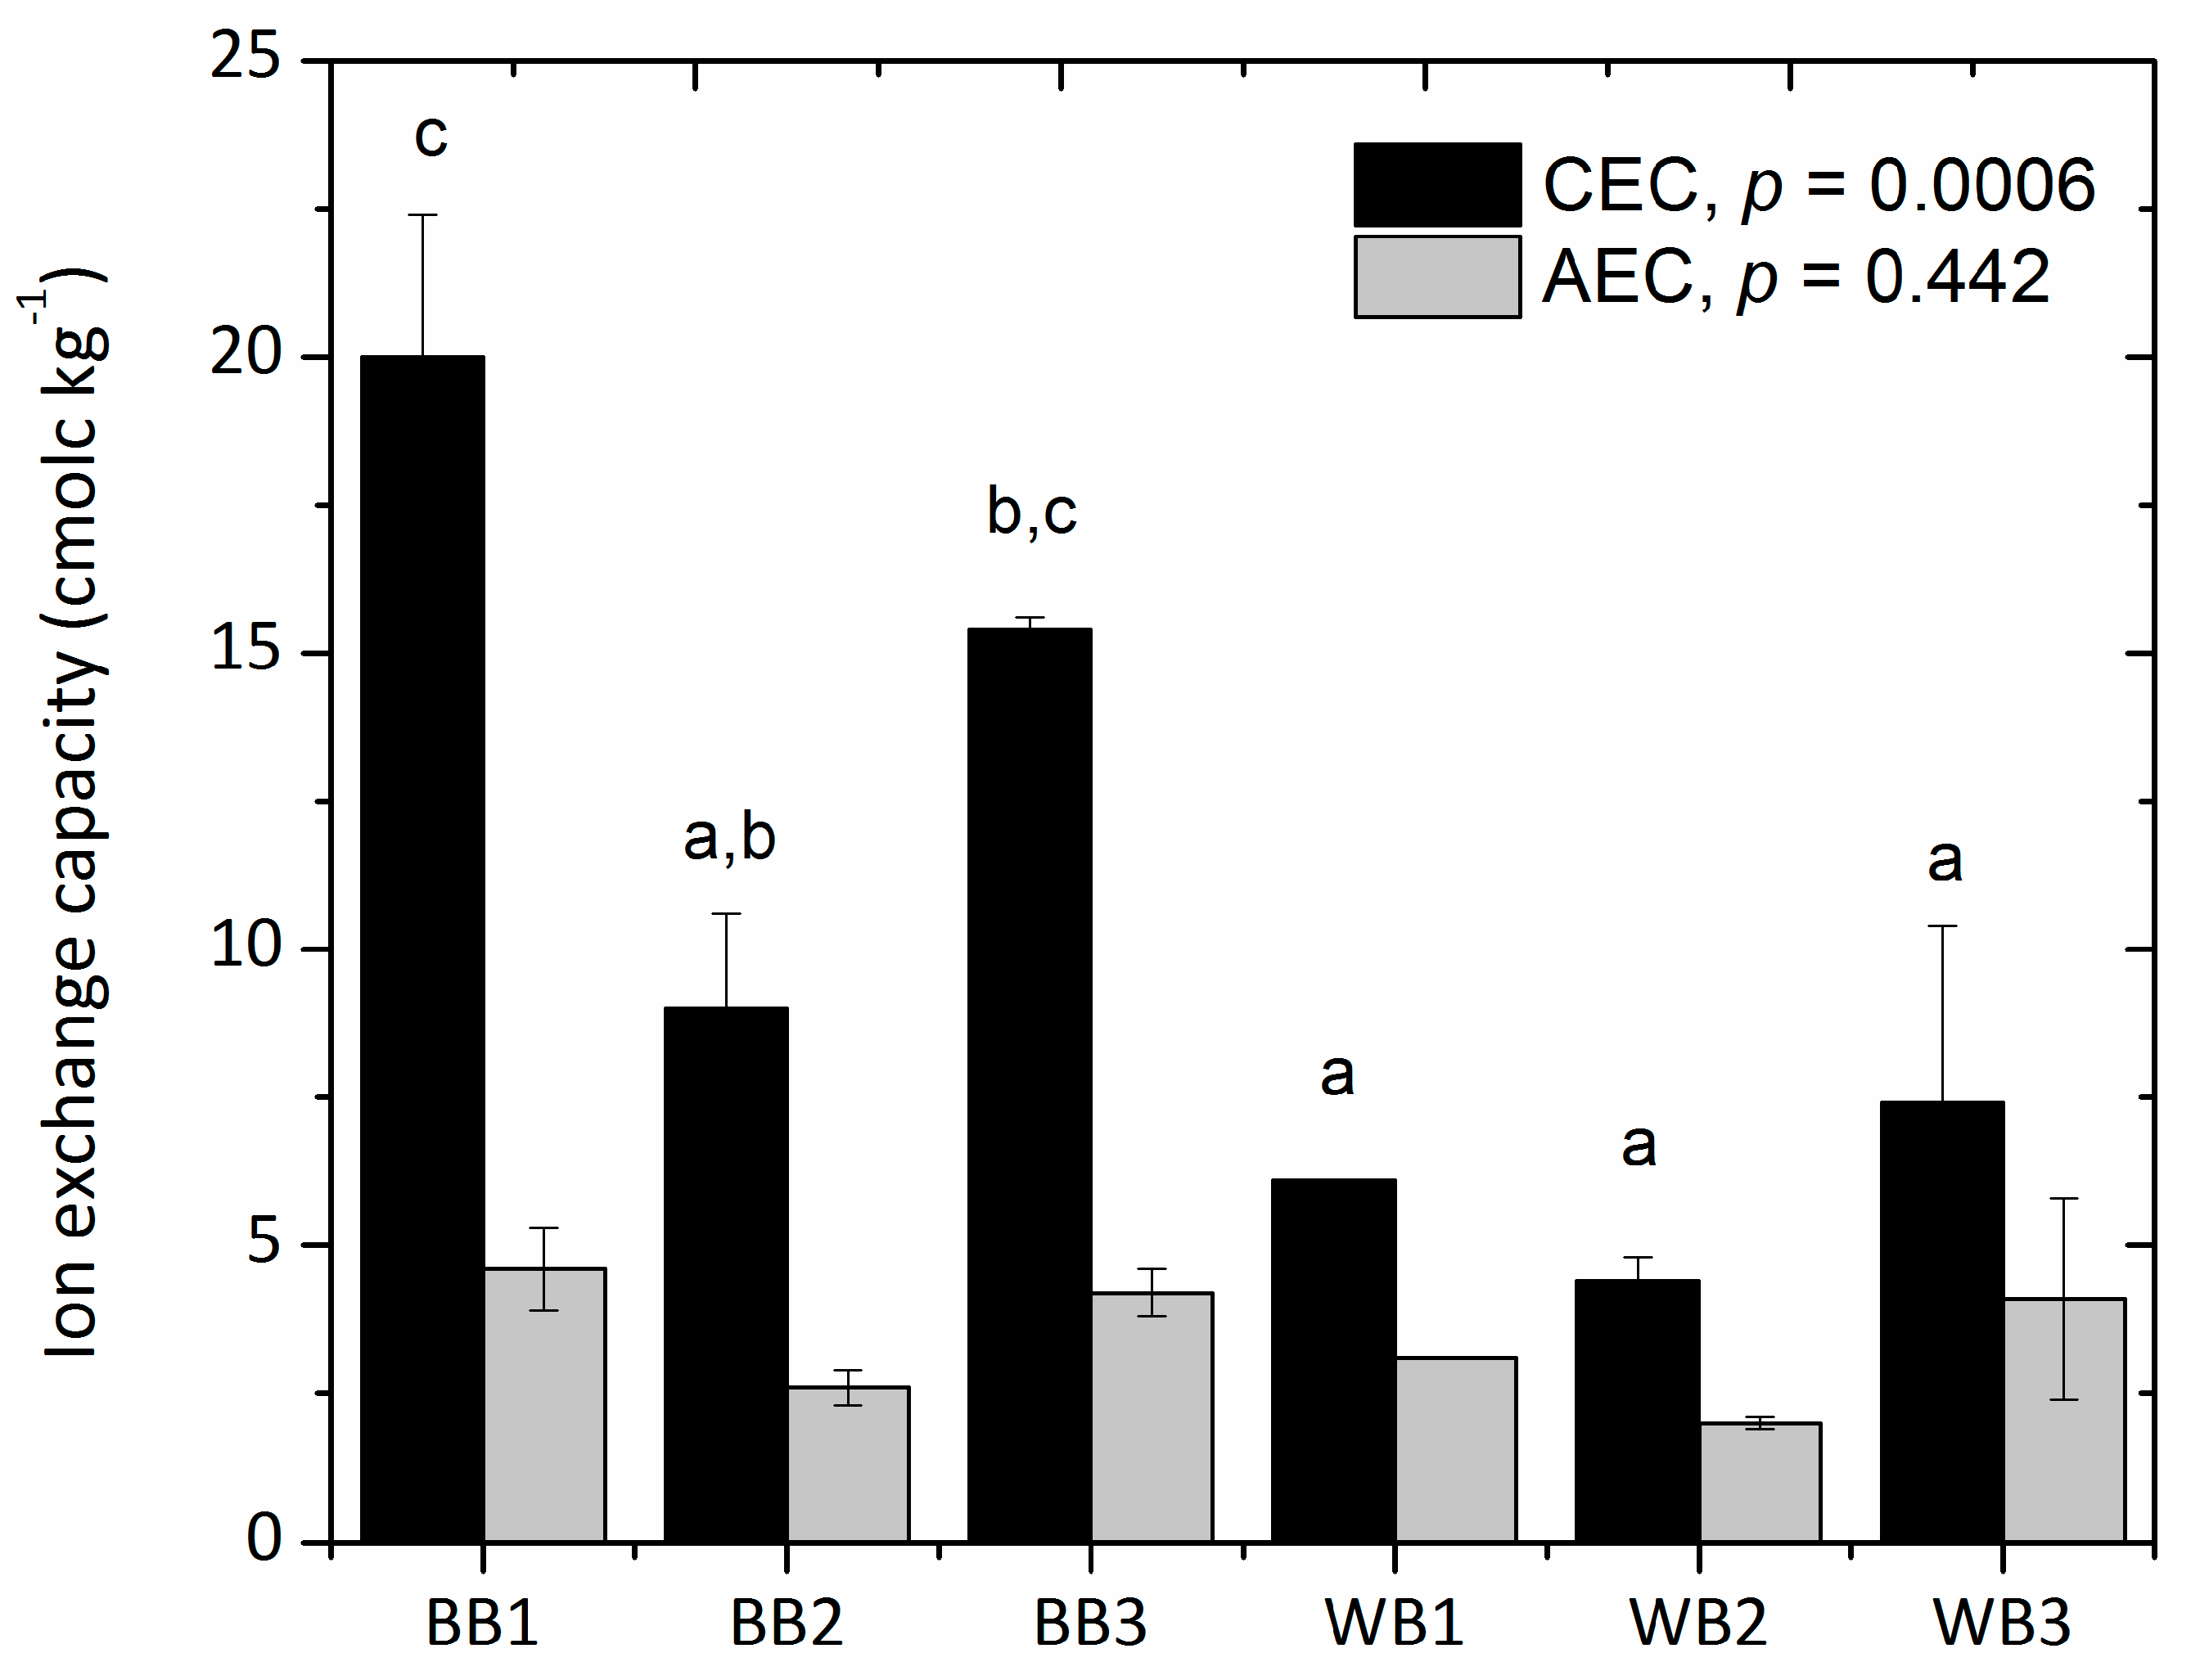
2.3.8. Cation and Anion Exchange Capacity

Ion exchange capacities were determined following the method proposed by Mukherjee et al. [15], by first displacing other ionic charge on the material with KCl (ACS reagent, 99.0–100.5%, Sigma Aldrich, Darmstadt, Germany), then rinsing excess solution with a diluted KCl solution, and finally displacing K+ and Cl ions from the material with NaNO3. Cl and K+ were determined in the resulting solution. A mass of 0.5 g biochar accurately weighed (analytical balance Precisa, 0.0001 g) was placed in 50 mL of a 1 mol/L KCl solution and mixed on an orbital shaker (Hotech 702R) for 60 min at (20 ± 1) rpm at 20.00 ± 0.25 °C. The material was filtered (Sartorius 393 quantitative grade paper), then placed in 50 mL of a 0.010 mol/L KCl solution on the orbital shaker in the same previous conditions and then rinsed once again with 0.010 mol/L KCl solution. Afterwards, the material was rinsed twice with deionized water during vacuum filtration. This material was quantitatively transferred to about 25 mL (exactly weighed on the analytical balance) of a 0.50 mol/L NaNO3 solution; then it was mixed on the orbital shaker in the same compositions as previously, with a lid, to avoid evaporation. The solution was filtered towards a clean, dry container. Chloride and potassium ions were determined in this solution on a Metrohm 930 Compact ion chromatograph, Metrohm AG, Herisau, Switzerland, and with an atomic absorption Perkin Elmer AAnalyst-800, MA, USA, respectively.

2.4. TPS Compost Analyses

2.4.1. Chemical Analyses of Composted Fecal Waste

Before chemical analysis was undertaken, the moisture of the solid material was determined in 10 g of composted manure by duplicate. Thus, samples were oven dried at 110 °C for over 24 h, until constant dry weight was reached. Duplicate samples for chemical analysis were oven dried at 80 °C until constant weight was achieved; afterwards, samples were milled and sieved below 1 mm mesh. Then 50 mL of deionized water and 3 g of the dry sieved sample were thoroughly mixed during 5 min on a horizontal shaker to get pH measurements. Electrical conductivity (EC) was determined weighing 10 g of dry and sieved manure and adding deionized water until a loose paste was formed. The slurry was thoroughly mixed for 5 min and then was left to settle for 30 min prior vacuum filtration. The EC was determined on the filtered liquid in mS/cm. Total carbon and nitrogen content were determined in samples of 85–95 mg of dry and milled manure, using a rapid N III, Elementar Analyzer. The chemical composition analysis of total P, Ca, Mg, K, S, Fe, Cu, Zn, Mn and B in 0.5 g of the dry manure followed a microwave digestion with 10 mL of concentrated nitric acid. A sequence digestion of tree steps involved 55 min at 200 °C each step. After digestion, the sample was transferred to a 100 mL flask, and diluted using deionized water. Samples were analyzed with an inductive coupled plasma (ICP) device, Perkin Elmer Optima 8300, LAS GmbH, Rodgau, Germany.

2.4.2. Available Water Content (AWC)

A completely randomized factorial experimental design involved the mixture of composted fecal waste (TPS) and biochar by quadruplicate using two doses of biochar (i.e., 5 and 10% w/w) and six treatments. The treatments were: TPS + BB1—5%, TPS + BB2—5%, TPS + BB3—5%, TPS + BB1—10%, TPS + BB2—10%, TPS + BB3—10%, TPS + WB1—5%, TPS + WB2—5%, TPS + WB3—5%, TPS + WB1—10%, TPS + WB2—10%, TPS + WB3—10%. Just as well, four replicates of the compost (TPS) without biochar were used as control; totaling 52 pots. Moisture was provided by capillarity using cellulose acetate cigarette filters inserted at the bottom of the pots, which were placed each on a shallow plate with deionized water. Each pot contained 100 g of the TPS-biochar mixture. The incubation time was of 4 weeks at 25 °C under laboratory conditions.
The gravimetric water content (g/g) of the mixture was determined by applying 3 g of the mixture inside a stainless-steel ring folded with a cloth and ribbon, and equilibrating during one week at −100 cm H2O (i.e., −10 kPa, pF 2.0) by means of the hanging water column method (i.e., Sand Box). This water content corresponded to the field capacity water potential (WFC). The corresponding gravimetric water content (g/g) of the permanent wilting point potential (WPWP), −15,000 cm H2O (i.e., −1500 kPa, pF 4.2), was determined using the chilled-mirror dew-point potentiometer technique (WP4C, METER, Germany). Since the dry compost normally exhibits potentials close to those shown by air-dried soil (pF = 5.0 to 6.0, (where pF = −log |−cm H2O|), a standard condition was needed for comparison. The mixtures were air dried for one week and small subsamples of 10 g were moistened by dripping deionized water on them. This was done to reach higher target water contents until the potential was around pF 3.0 (−100 kPa), after an equilibration time of one week. Four point curves for each mixture were obtained between pF 5.0 and 3.0 (−100.000 to −1000 kPa), determining the respective gravimetric water content after oven drying 24 h at 105 °C. The corresponding WPWP at pF 4.2 (−1500 kPa) was calculated by interpolation in the four-point curves. The available water content (AWC) was calculated by subtraction, where AWC = WFC − WPWP, and expressed as grams of available water per gram of the mixture of dry base.

2.5. Statistical Analysis

Mean and maximum temperatures of biochar production were computed with R version 3.3.3 (R Foundation for Statistical Computing software). One-way analysis of variance (ANOVA) for pH, RLE, PLC, EC, proximate and elemental analyses, ion exchange capacity of biochars and available water content (AWC) of the TPS-biochar mixture, was performed using the Origin Lab version 8.5 software, OriginLab Corporation, MA, USA. Differences between means were examined using Tukey’s test. A statistical significance level of p < 0.05 was used.

3. Results and Discussion

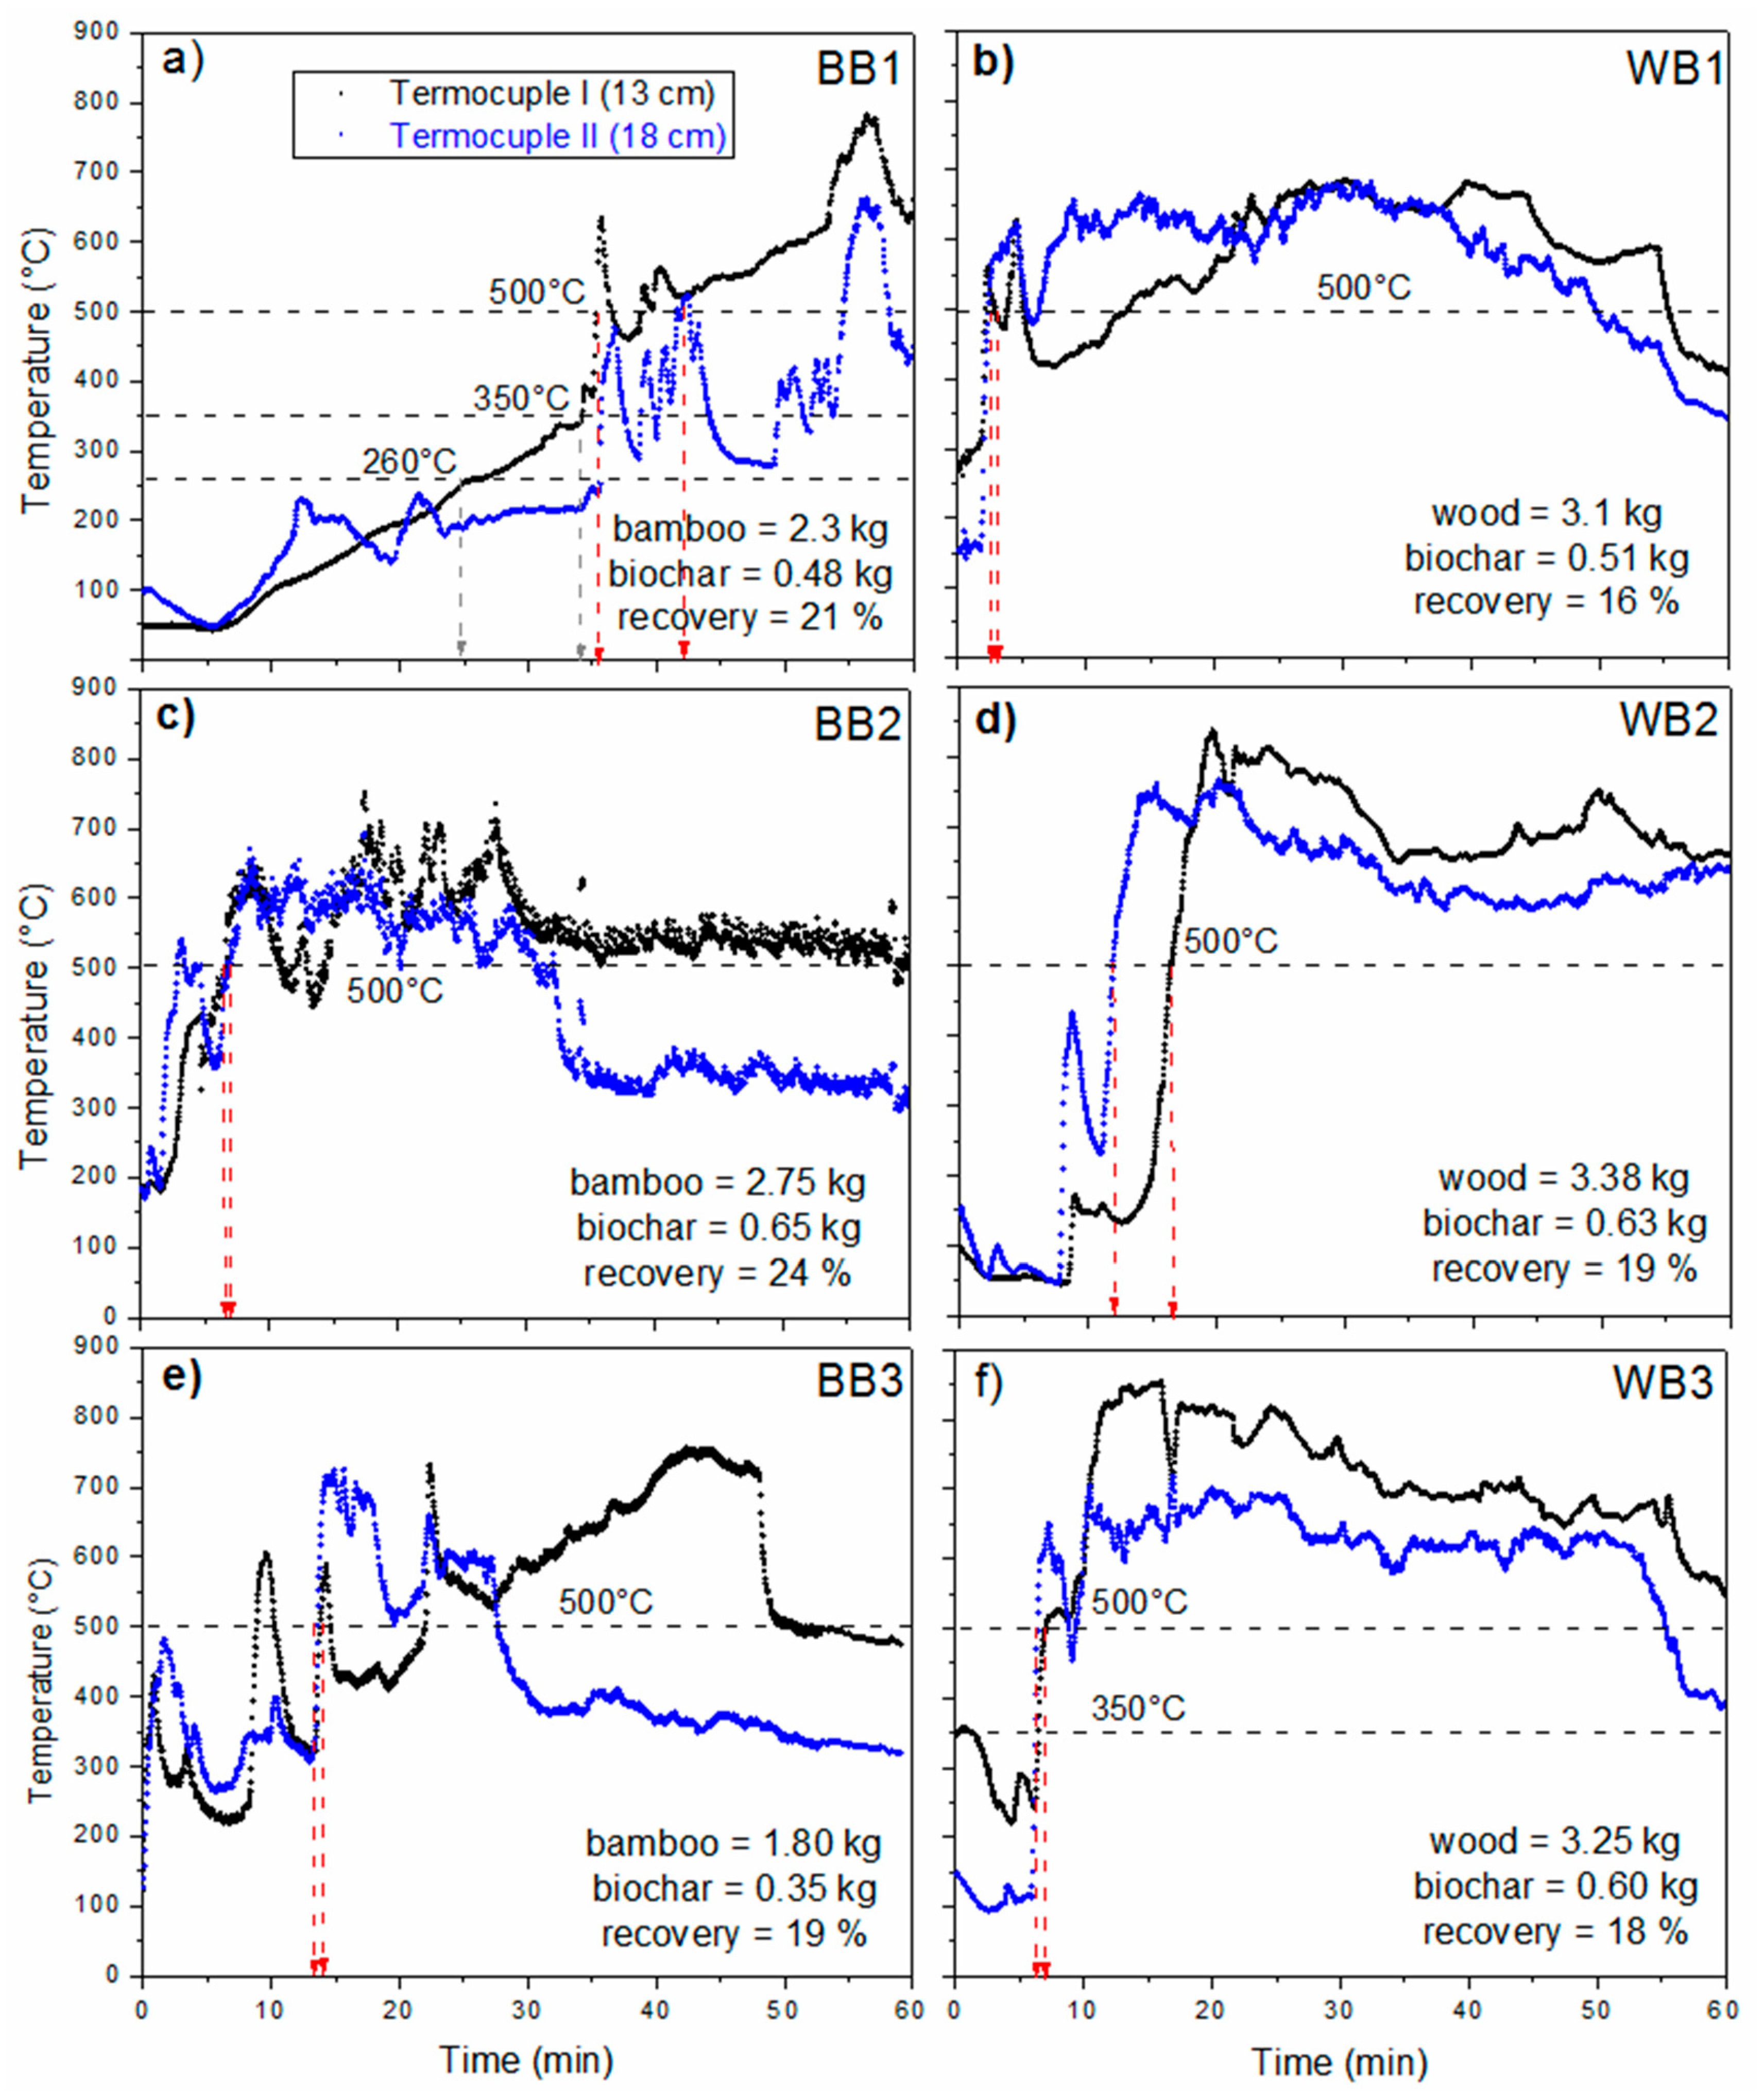
3.1. Biochar Production Process

Figure 1 shows the temperatures recorded in the TLUD combustion chamber during charring, for each biochar prepared (BB1, BB2 and BB3 for bamboo and WB1, WB2 and WB3 for pinewood). Each observation period lasted 60 min, including the holding time depended on the activation of the fire inside the chamber. These temperatures were recorded with thermocouples placed in the space above the charring material in the TLUD combustion chamber.
At first sight, it is apparent that, with pinewood, temperatures over 500 °C were reached within the first 20 min and maintained nearly until the end of the charring period. Meanwhile, the bamboo data show comparatively lower temperatures as well as lower reproducibility in the patterns and the overall temperatures. BB1 showed the most delayed heating process; temperatures rose above 260 °C only during the last 25 min, while BB2 and BB3 reached 500 °C much earlier. In all cases, overall temperatures recorded at 18 cm from the bottom were lower, possibly due to admixture of secondary air. It is not clear what may have caused the differences in the temperature patterns observed in the BB essays, as the sample feedstock was the same and was prepared in a single batch.
Yields of the biochars ranged from 16% to 24% (Figure 1), similar values to those (10–30) previously reported by Brewer [31]. No statistically significant differences between the groups were found (p = 0.0972).
In TLUD stoves, the heat required to drive pyrolysis is provided by combustion of the gases emitted by the heated material. A single load of biomass is placed in the combustion chamber and lit at its top, so the pyrolysis front advances downwards, driven by the heat produced by combustion of gases in and above the front. According to Nsamba et al. [35] the air supply drives the temperature gradient inside the TLUD, so total gasification can be reached within few minutes, depending on the incoming air flow. Partial combustion of the charred material also takes place, since primary air passes from the bottom of the material to its top. Secondary air enters above the biomass and mixes with the partially combusted gases to complete combustion. The temperatures recorded at thermocouple II, in a higher position above the feedstock, were generally lower, evidencing the entrainment of secondary air. Charring can be considered complete for most of the feedstock once the production of combustion gases seems to have ceased, taking the lack of a flame for evidence.
The temperature that the pieces of biochar undergo at their surface is that of the surroundings, but due to short charring times, the maximum temperature of the interior of the pieces could be lower if the feedstock pieces are large enough. A limited control of the reaction conditions is believed to produce variability in quality of the biochars [31], mostly depending on the amount of air entering the chamber [35]. However, the TLUD scheme necessarily leads to charring times that vary from less than 10 min, for the bottom material, to nearly the whole charring period, for the material at the top, thus producing an inherently and necessarily heterogeneous biochar anyway.
Charring temperature and time can have significant repercussions on surface chemistry and macroporosity of a char. However, composition of the feedstocks can have an influence on the process itself, and therefore on its results. Above 120 °C, organic materials begin to undergo some degree of thermal decomposition (pyrolysis), first losing chemically bound moisture. Hemicelluloses start to be pyrolyzed from 200 to 260 °C, cellulose at 240–350 °C, and lignin at 280–500 °C [13]. Above 500 °C there is a more intense oxidation of chemical functional groups and the aromaticity of surface biochar increases. The temperatures at which pyrolysis occurs for the predominant components of the feedstock can thereby determine the properties of the feedstock at the end of the process. Thus a lower content of lignin in bamboo may be an explanation for the lower overall temperatures recorded in our case for the bamboo biochars (Figure 1). Higher contents of cations in bamboo feedstocks may as well lead to lower pyrolysis temperatures, as discussed in previous works [36,37,38].
Table 1 provides characterization data of feedstocks from several bamboo and coniferous species, reported by other authors. While conifers produce wood, bamboos are giant grasses that produce a lignocellulosic material significantly different in its chemistry and structure. Nevertheless, Table 1 shows notable similarities in contents of cellulose and hemicellulose, as well as in heat values. The lignin contents in the conifers seem only slightly higher. The ash contents reported for the bamboo feedstocks, however, are around one order of magnitude higher. The influence of the presence of alkali cations on the temperatures and mechanisms of pyrolysis of lignocellulosic materials has been investigated since over three decades by now [36]. The presence of salts of alkali cations has been shown to considerably lower pyrolysis temperatures [37,38], and change the yields of char and of the different volatiles as well. As it depends on the drying method and time, as well as on the storage conditions, the comparison of moisture data is not sought.
Table 2 summarizes the temperatures in the TLUD stove during each 60 min of total residence time, including firing and charring time. The lowest average temperature registered was for BB1. Generally, pinewood temperatures were higher, with averages between 554 and 654 °C, while bamboo produced average temperatures between 258 and 534 °C, and BB1 shows the shortest holding time near 500 °C.

3.2. Physical Properties of the Biochars

Figure 2b shows SEM images of samples of biochars obtained from bamboo and pinewood. Visible macroporosity (<10 µm) inherently associated to the original structures of the xylem conducting tissue appear in BB1, in agreement with earlier observations [16,31]. Following Wildman and Derbyshire [21], no pretreatment was used for the removal of debris, in order to avoid artifacts. Observable fine particles below 3.0 µm were fragmented char derived from tissue walls, attributable to rapid devolatilization during pyrolysis. As can be seen in Figure 2b,d, greater and more irregular micro and mesoporosity was present in the pinewood biochar (see also Table 3). This might owe to higher temperatures during charring (see Table 2), though also to the structure and composition of the feedstock biomass.
A-BET specific surface area (SSA, A-BET) was higher for pinewood biochars, ranging from 234 to 267 m2/g, as compared to that of bamboo biochars, ranging from 54 to 144 m2/g (Table 3). Most of A-BET apparently corresponds to internal surface area of microporosity. These results are consistent with A-BET values found for wood biochar by Brewer et al. [20] at temperatures ranging from 600 to 700 °C and by Lawrinenko [17] for cellulose produced at 700 °C. On the contrary, Hale et al. [28] reported lower SSA values, from 18.6 to 36.4 m2/g, in unwashed biochars made of cocoa shell and corncob, using a kiln to produce biochar at 350 °C for 3.5 h. Mukherjee [15] pointed out that SSA usually increases with biochar production temperature along with the number of micropores (<2 nm diameter), which are more likely to significantly contribute to SSA, according to Wildman and Derbyshire [21]. Biochar skeletal densities exhibit values from 1.537 to 1.764 g/cm3, consistent with results of Lawrinenko [17], who reported 1.68 g/cm3 for cellulose biochar produced at 700 °C. According to Li et al. [5], raising the pyrolysis temperature led to raised total pore volume but lowered average pore size in biochars produced from switchgrass, water oak and biosolids.
Hydrophobicity of the biochars differed significantly. Figure 3 compares the time dependent contact angle of smooth planar surfaces covered with fine dust of the biochars, performed by the sessile drop method [50], as an approach to measure persistence of the surface repellency to a small drop of water. The longer the persistence, the higher hydrophobicity of the material. The 90-degree line defines a magnitude corresponding to a critical water repellency, so a material is hydrophilic when angles are below 90°, and hydrophobic if above (e.g., 110°). Complete wettability of a surface produced a null degree angle.
Overall, the initial contact angles (αi) were near 100° for the bamboo chars, and slightly above that for the pinewood chars. The bamboo biochars rapidly became hydrophilic (α < 90°), before 100 s, whereas the pinewood biochars became hydrophilic after 500–800 s. The pinewood biochars (WB) were clearly more hydrophobic (i.e., >90° up to 600 s) than the bamboo biochars (BB), and differences within the groups were smaller. BB3 was the least and BB1 the most hydrophobic of the bamboo biochars, as seen from the initial slopes in Figure 3. Greater hydrophobicity coincided with higher average stove temperatures for the bamboo biochars. For pinewood biochars, the stove temperatures were not significantly different. The trend in the hydrophobicity of the bamboo biochars mirrored the results in A-BET (Table 2), where BB3 showed the lowest A-BET as well as lowest hydrophobicity. For the pinewood biochars, A-BET values were very similar. The trend in the bamboo biochars marks a contrast to previous statements relating low specific surface area values to the presence of aliphatic functional groups and greater hydrophobicity [51,52]. Our results for the bamboo chars show that A-BET values do not necessarily hold a direct relationship to hydrophobicity, but can actually be inversely related.
Verheijen et al. [22] considered hydrophobicity induced by biochar in soils to be most significant in the first years after application, due to ‘fresh’ biochar comprising a great amount of hydrophobic surfaces. However, hydrophobicity is also affected by relative humidity, surface roughness and surface tension of liquid water, which can change with the osmotic force; these are factors that can contribute to reducing hydrophobicity of a biochar in a soil. Besides, the persistence of water repellency is time dependent and can reach the subcritical range in short times, causing the surface to be easily wetted. Moreover, exposure to water during analytical tests is short and does not reflect genuine environmental conditions as exposure time, surface tension, dissolved ions, dissolved organic matter, suspended particles as clays and other physical aspects. For instance, capillary water content in the soil and soil amendments can move into the macroporosity space.

3.3. Chemical Properties of the Biochars

The results obtained from the proximate and elemental analyses of the biochars are shown in Table 4. Higher fixed carbon values in the pine wood biochars contrast with the greater ash contents of bamboo biochars. The ash content in the wood biochars may have been affected by the presence of concrete that could have remained on the feedstock, because the pine wood was collected from construction wastes. The lowest value may be more representative. Note that the ash contents in the bamboo biochars were nevertheless notably higher than that in the wood biochars. As shown in Table 1, lignin contents of conifer woods may be higher than those of bamboo. According to Keiluweit et al. [53] decomposition of cellulose occurs rapidly at low temperatures (between 230 and 400 °C), while lignins decompose in a wider range of temperatures (160–900 °C). The differences in the patterns of stove temperatures between bamboo and wood, observed in Figure 1, may obey to differences in the biomass composition [4], due to the temperatures at which decomposition reactions take place, such as oxidation and dehydration. As previously discussed, higher contents of metallic cations have been related to lower pyrolysis temperatures [36,37,38].
The O:C ratios are significantly higher in the bamboo group, and within the latter group, they are directly related to higher and longer stove temperatures. The lower yield observed in BB3, and its significantly higher ash content and O:C ratio, may be a consequence of cellulose decomposition during the first minutes and oxidation during the intense peak of heat, sensed in minute 40 by thermocouple I. The latter seems to explain the inverted relation of SSA and hydrophobicity found in the bamboo biochars. In turn, the low O:C molar ratio presented in wood biochars agrees with low O:C ratios reported by Liang et al. [18] on wood biochar surfaces (O:C = 0–0.19). The greater hydrophobicity observed in the pinewood biochars in Figure 3 was consequent with its lower O:C ratios. This relation of hydrophobicity to low O:C ratios has been observed and discussed in other works as well [51,54]. In both groups of biochars, higher C:N ratios corresponded with higher stove temperatures, which could be explained by greater N volatilization. The H:C molar ratios were significantly similar between and within the groups. The elemental ratios H:C and O:C are indicators of the degree of dehydration and oxidation of the biochars respectively [55]. Low O:C ratios point to polycondensed aromatic structures, which are assumed to be resistant to microbial degradation due to chemical inertness [56], and consequently best suited for long-term soil carbon sequestration [1].
Table 5 presents the results obtained from the analysis of electrical conductivity (EC), relative liming effect (RLE), potential liming capacity (PLC) and pH. Significant differences (p < 0.05) between the two groups of biochars for EC, RLE and PLC were evidenced. Pinewood biochars (WB) were much more limey than bamboo biochars (BB), but their EC was less than half as large, in accordance with lower ash contents. Biochars generally have a substantial liming capacity, to an extent due to mineral content present in the feedstock [4]. Significant differences (p < 0.05) in pH were found between replicates showing higher values of pH in biochars with a higher degree of thermal alteration, in agreement with previous works (e.g., [15,21]). For example, the higher ash contents and stove temperatures (Figure 1) registered for BB3 suggest it was thermally altered to a higher extent, and BB3 showed higher pH values in all three solutions.
Cation and anion exchange capacities (CEC and AEC) show significant differences (p < 0.05) between the two groups of biochars (Figure 4). Overall, pinewood biochars exhibited lower CEC values, around 6 cmolc kg−1, a low value considering previous studies. According to Munera-Erreverri et al. [57], CEC of biochars reported in literature is highly variable, normally ranging from 5 to 50 cmolc kg−1, and rarely up to around 200 cmolc kg−1. Meanwhile, CEC values of soil organic matter range between 200 and 400 cmolc kg−1 [56]. In our case, BB1 presented the overall highest CEC, with 19.97 cmolc kg−1, followed by BB3 with 15.40 cmolc kg−1. General agreement exists that CEC in biochars is attributable to the presence of functional groups, such as carboxyl, rich in oxygen and negative charges, e.g., Lee et al. [58]. Mukherjee et al. [15] pointed out that lower temperature biochars tend to show higher CEC, while higher temperature biochars show higher pH; in other words, CEC varies inversely with charring temperature while pH varies directly. Most biochar studies focus on wood biochars. Our results show higher CEC values in the bamboo biochars (BB1 and BB3) coinciding well with higher O:C ratios, but seemingly also with higher pH. However, this trend is not observed among our pinewood biochars. Apparently, differences in feedstock can have an important influence on the CEC results. No significant differences were found in AEC values between the two groups of biochars.

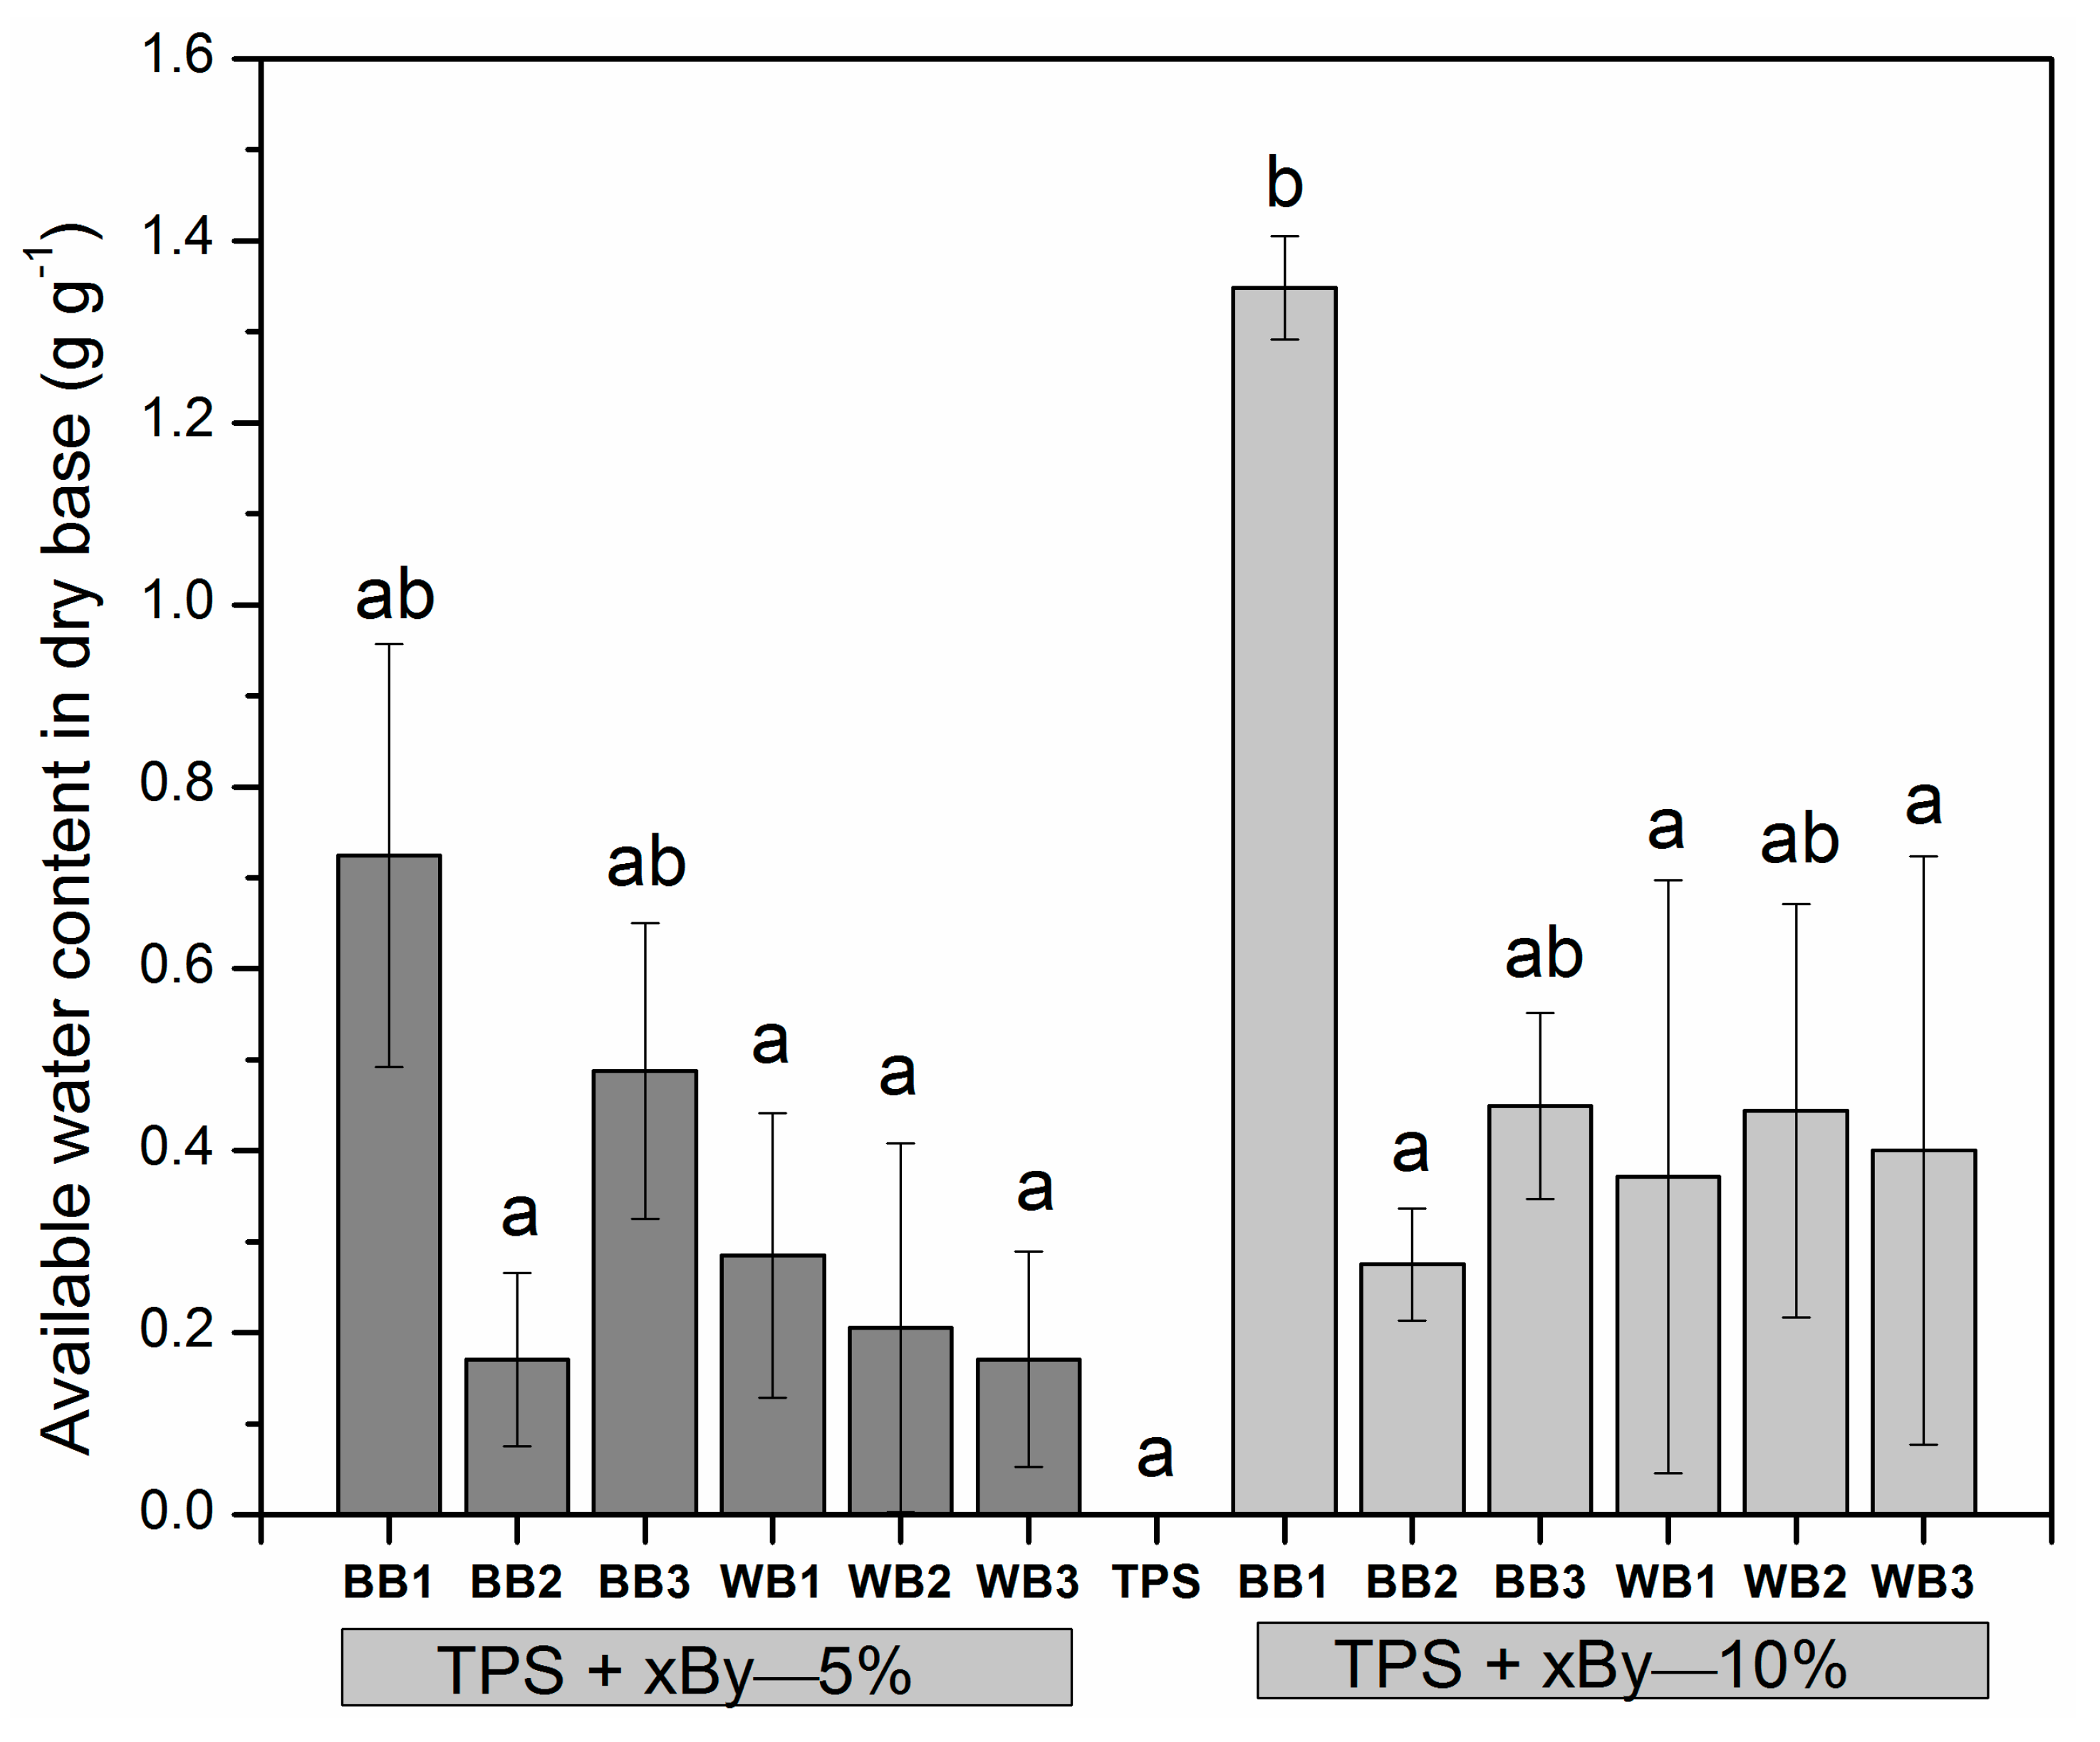
3.4. Use of Biochars Mixed with Compost

Total Nutrient Content of the TPS

A requirement to use organic amendments in a sustainable way is to quantify the amount of nutrients for plants that could be taken up by a crop [59]. Table 6 illustrates some of the main characteristics of the human compost (TPS) used to prepare the soil amendments before the addition of the biochars. The nutrients correspond to the total content in the compost. These results show that the compost is almost neutral and slightly saline. Comparing the C:N of 31.5 reported by Bettendorf et al. [60] for municipal solid organic waste and fecal matter, the C:N ratio obtained is quite low. This compost made of dry composted feces and coffee skin was relatively high in nitrogen content and therefore, suitable as a terra preta-type soil amendment. Besides nitrogen, plants use five other nutrients in relatively large amounts: phosphorus, potassium, sulphur, calcium and magnesium [61]. In terms of phosphorus and potassium content, the results showed medium values ranging between cow manure and vermicompost, as used by Naiji and Souri [62] in their investigation.
Figure 5 compares the experimental data of available water content (AWC), as the relative amount of water in grams retained per gram of soil amendment. The average AWC (n = 4) of twelve TPS + biochar treatments (mixtures) and a TPS control treatment without biochar addition (i.e., TPS), were compared at a 95% of confidence. The control TPS showed a total lack of water retention capacity. The most remarkable result is that TPS + BB1—10% showed by far the highest AWC, equivalent to 1.35 g g−1 (p < 0.05). Interestingly, BB1 had as well the highest CEC, the lowest charring temperature and the lowest holding time above 200 °C, which was approximately 25 min. The BB1 biochar had as well the highest SSA value in its group. Notwithstanding, SSA values in the wood biochars were much higher than those of the bamboo biochars, but their AWC values were not significantly different from those of the two bamboo chars with low AWC values. A dependency of AWC on O:C ratio and hydrophobicity is hereby suggested, which requires direct testing. The results for the rest of the biochars used in the soil amendments are not very encouraging, since the differences between them and the TPS control were not significant. However, as can be seen from Figure 5, there was a trend suggesting that, overall, biochar raised AWC from 20% to 50%. This increment in AWC agreed with data from Baronti et al. [63], who reported an increase of 45% in available soil water content compared to control soil using 44 ton ha−1 of application rate. It is therefore likely that biochar can bring potential benefits in terms of AWC and CEC, whether applied directly in soils or included within a soil amendment. Our results suggest that by reducing the holding times and temperatures for bamboo when charring, biochars similar to BB1 could be obtained, which could significantly improve the CEC and AWC of a soil. However, establishing the relationship of AWC and CEC to charring conditions requires specifically designed experiments that could not be carried out in TLUD stoves, and was therefore not the purpose of this article.

4. Conclusions

We believed that the applicability of this study might include TLUD stoves along with other low technology low budget setups for the production of biochar, where the presence of air and variability of the charring conditions are inherent. The intrinsically high variability of charring conditions of TLUD stoves had more marked consequences for the bamboo feedstock, leading to greater variations in the properties of the bamboo biochars. Interestingly, bamboo biochars not only exhibited higher variability, but also higher quality in terms of CEC and AWC. AWC and CEC values were significantly different between the pinewood and bamboo biochars. The overall charring temperatures recorded for the bamboo feedstocks were lower and much more variable than for the pinewood feedstock. The BB1 biochar, with the lowest overall charring temperature and the shortest holding time, showed the highest CEC (19.97 cmolc kg−1) among all the biochars. The oxygen-to-carbon molar ratio O:C and ash content are potentially good predictors of hydrophobicity in biochars. Hydrophobicity of the pinewood biochars, though greater, was not a potential constraint after 800 s for the biochars tested. This study found overall improvements of 50% in AWC for the mixtures TPS with 10% biochar, and a 100% increase with 10% of the BB1 bamboo biochar. Given the promising results obtained with the bamboo biochars, more research needs to be undertaken relating types of feedstock and charring times and temperatures, to the crucial quality aspects of biochars, AWC and CEC.

Supplementary Materials

The following are available online at https://www.mdpi.com/2076-3417/10/2/507/s1, Table S1: Relative liming effect (RLE) and potential liming capacity (PLC) calculation of different biochar samples and replicates, Table S2: Volume of NaOH used to neutralize the remaining HCl (mL), Figure S1: Relative liming effect (RLE) of biochars made of bamboo (BB) and pinewood (WB), Figure S2: Potential liming capacity (PLC) of biochars made of bamboo (BB) and pinewood (WB).

Author Contributions

Conceptualization, F.M.-M., J.Q.-K.; Methodology, F.M.-M., D.S.-C., C.A.G.-G.; Formal Analysis, C.A.G.-G. and J.Q.-K.; Investigation, D.S.-C., F.M.-M.; Resources, F.M.-M., K.V.-M., C.A.G.-G.; Writing—Original Draft Preparation, F.M.-M.; Writing—Review and Editing, J.Q.-K., C.A.G.-G., K.V.-M. and D.S.-C.; Supervision, J.Q.-K. and K.V.-M.; Funding Acquisition F.M.-M., C.A.G.-G. All authors have read and agreed to the published version of the manuscript.

Funding

This research was funded by Vice-rector of Research and Extension of the Instituto Tecnológico de Costa Rica (TEC), trough the project VIE 1460065 and by the national foundation FITTACORI (Fundación para el Fomento y Promoción de la Investigación y Transferencia de Tecnología Agropecuaria).

Acknowledgments

We thank Noemi Quiros, Sofía Infante and Andrey Caballero (CEQIATEC) for helping with potassium and chloride analysis, Elemer Briceño from Universidad Estatal a Distancia (UNED) for providing the bamboo and technical support, Fernando Alvarado-Hidalgo (Master’s degree of Medical Products) for help with TGA analysis, Carlos Olivares from (Laboratory for Wood Chemistry, Forestry of the Instituto Tecnológico de Costa Rica) for help with elemental analysis. Work supported by Xunta de Galicia [ED431F 2016/010 & ED431C 2016/008], MCIUN [RTI2018-094131-A-I00], AEMAT [ED431E 2018/08], Agencia Estatal de Investigación (AEI) and FEDER funds. C.A. García-González acknowledges to MINECO for a Ramón y Cajal Fellowship [RYC2014-15239].

Conflicts of Interest

The authors declare no conflict of interest.

References

  1. Spokas, K.A.; Cantrell, K.B.; Novak, J.M.; Archer, D.W.; Ippolito, J.A.; Collins, H.P.; Boateng, A.; Lima, I.M.; Lamb, M.C.; Mcaloon, A.J.; et al. Biochar: A Synthesis of Its Agronomic Impact beyond Carbon Sequestration. J. Environ. Qual. 2012, 41, 973–989. [Google Scholar] [CrossRef] [PubMed]
  2. Karhu, K.; Mattila, T.; Bergström, I.; Regina, K. Biochar addition to agricultural soil increased CH4 uptake and water holding capacity—Results from a short-term pilot field study. Agric. Ecosyst. Environ. 2011, 140, 309–313. [Google Scholar] [CrossRef]
  3. Ahmad, M.; Rajapaksha, A.U.; Lim, J.E.; Zhang, M.; Bolan, N.; Mohan, D.; Vithanage, M.; Lee, S.S.; Ok, Y.S. Biochar as a sorbent for contaminant management in soil and water: A review. Chemosphere 2014, 99, 19–23. [Google Scholar] [CrossRef] [PubMed]
  4. Gezahegn, S.; Sain, M.; Thomas, S. Variation in Feedstock Wood Chemistry Strongly Influences Biochar Liming Potential. Soil Syst. 2019, 3, 26. [Google Scholar] [CrossRef] [Green Version]
  5. Li, S.; Barreto, V.; Li, R.; Chen, G.; Hsieh, Y.P. Nitrogen retention of biochar derived from different feedstocks at variable pyrolysis temperatures. J. Anal. Appl. Pyrolysis 2018, 133, 136–146. [Google Scholar] [CrossRef]
  6. Lu, H.; Li, Z.A.; Fu, S.; Gascó, G.; Paz-Ferreiro, J. Effect of Biochar in Cadmium Availability and Soil Biological Activity in an Anthrosol Following Acid Rain Deposition and Aging Effect of Biochar in Cadmium Availability and Soil Biological Activity in an Anthrosol Following Acid Rain Deposition and Aging. Water Air Soil Pollut. 2015, 226, 164. [Google Scholar] [CrossRef]
  7. Liang, C.; Gascó, G.; Fu, S.; Méndez, A.; Paz-ferreiro, J. Biochar from pruning residues as a soil amendment: Effects of pyrolysis temperature and particle size. Soil Tillage Res. 2016, 164, 3–10. [Google Scholar] [CrossRef]
  8. Zhao, B.; Connor, D.O.; Zhang, J.; Peng, T.; Shen, Z.; Daniel, C.W.; Deyi Hou, T. Effect of pyrolysis temperature, heating rate, and residence time on rapessed steam derived biochar. J. Clean. Prod. 2017, 174, 977–987. [Google Scholar] [CrossRef]
  9. Glaser, B. Potential and constraints of Terra preta products for soil amelioration and climate change mitigation. In Terra Preta Sanitation; Bettendorf, T., Wendland, C., Otterpohl, R., Eds.; Deutsche Bundesstiftung Umwelt: Osnabrück, Germany, 2014; ISBN 978-3-00-046586-4. [Google Scholar]
  10. Factura, H.; Bettendorf, T.; Buzie, C.; Pieplow, H.; Reckin, J.; Otterpohl, R. Terra Preta Sanitation: Re-discovered from an ancient Amazonian civilisation—Integrating sanitation, bio-waste management and agriculture. Water Sci. Technol. 2010, 61, 2673–2679. [Google Scholar] [CrossRef] [Green Version]
  11. Krause, A.; Nehls, T.; George, E.; Kaupenjohann, M. Organic wastes from bioenergy and ecological sanitation as soil fertility improver: A field experiment in a tropical Andosol. Soil 2015, 2, 1221–1261. [Google Scholar]
  12. Anderson, C.; Malambo, D.H.; Perez, M.E.G.; Nobela, H.N.; de Pooter, L.; Spit, J.; Hooijmans, C.M.; van de Vossenberg, J.; Greya, W.; Thole, B.; et al. Lactic acid fermentation, urea and lime addition: Promising faecal sludge sanitizing methods for emergency sanitation. Int. J. Environ. Res. Public Health 2015, 12, 13871–13885. [Google Scholar] [CrossRef] [PubMed] [Green Version]
  13. Lehmann, J.; Stephen, J. Biochar for Environmental Management; Routledge: London, UK; Sterling, VA, USA, 2009; ISBN 9781849770552. [Google Scholar]
  14. Tang, J.; Zhu, W.; Kookana, R.; Katayama, A. Characteristics of biochar and its application in remediation of contaminated soil. J. Biosci. Bioeng. 2013, 116, 653–659. [Google Scholar] [CrossRef] [PubMed]
  15. Mukherjee, A.; Zimmerman, A.R.; Harris, W. Surface chemistry variations among a series of laboratory-produced biochars. Geoderma 2011, 163, 247–255. [Google Scholar] [CrossRef]
  16. Glaser, B.; Balashov, E.; Haumaier, L.; Guggenberger, G.; Zech, W. Anthropogenic Dark Earths as Carbon Stores and Sinks. Black Carbon Density Fractions Anthr. Soils Braz. Amaz. Reg. 2000, 31, 669–678. [Google Scholar]
  17. Lawrinenko, M. Anion exchange capacity of biochar. Green Chem. 2014, 17, 4628–4636. [Google Scholar] [CrossRef] [Green Version]
  18. Liang, B.; Lehmann, J.; Solomon, D.; Kinyangi, J.; Grossman, J.; O’Neill, B.; Skjemstad, J.O.; Thies, J.; Luizão, F.J.; Petersen, J.; et al. Black carbon increases cation exchange capacity in soils. Soil Sci. Soc. Am. J. 2006, 70, 1719–1730. [Google Scholar] [CrossRef] [Green Version]
  19. Guo, L.; Lin, S.; Liu, T.; Cao, C.; Li, C. Effects of Conservation Tillage on Topsoil Microbial Metabolic Characteristics and Organic Carbon within Aggregates under a Rice (Oryza sativa L.)—Wheat (Triticum aestivum L.) Cropping System in Central. PLoS ONE 2016, 11, e0146145. [Google Scholar] [CrossRef] [Green Version]
  20. Brewer, C.E.; Chuang, V.J.; Masiello, C.A.; Gonnermann, H.; Gao, X.; Dugan, B.; Driver, L.E.; Panzacchi, P.; Zygourakis, K.; Davies, C.A. New approaches to measuring biochar density and porosity. Biomass Bioenergy 2014, 66, 176–185. [Google Scholar] [CrossRef]
  21. Wildman, J.; Derbyshire, F. Origins and functions of macroporosity in activated carbons from coal and wood precursors. Fuel 1991, 70, 655–661. [Google Scholar] [CrossRef]
  22. Verheijen, F.; Jeffery, S.; Bastos, A.C.; van der Velde, M.; Diafas, I. Biochar Application to Soils A Critical Scientific Review of Effects on Soil Properties, Processes and Functions; European Commission: Luxembourg, 2010; p. 149. [Google Scholar]
  23. Lu, H.; Li, Z.; Fu, S.; Méndez, A.; Gascó, G.; Paz-Ferreiro, J. Can Biochar and Phytoextractors Be Jointly Used for Cadmium Remediation? PLoS ONE 2014, 9, e95218. [Google Scholar] [CrossRef]
  24. Yargicoglu, E.N.; Sadasivam, B.Y.; Reddy, K.R.; Spokas, K. Physical and chemical characterization of waste wood derived biochars. Waste Manag. 2015, 36, 256–268. [Google Scholar] [CrossRef] [PubMed]
  25. Uchimiya, M.; Chang, S.C.; Klasson, K.T. Screening biochars for heavy metal retention in soil: Role of oxygen functional groups. J. Hazard. Mater. 2011, 190, 432–441. [Google Scholar] [CrossRef] [PubMed]
  26. Odey, E.A.; Li, Z.; Zhou, X.; Yan, Y. Optimization of lactic acid fermentation for pathogen inactivation in fecal sludge. Ecotoxicol. Environ. Saf. 2018, 157, 249–254. [Google Scholar] [CrossRef] [PubMed]
  27. Alozie, N.; Heaney, N.; Lin, C. Biochar immobilizes soil-borne arsenic but not cationic metals in the presence of low-molecular-weight organic acids. Sci. Total Environ. 2018, 630, 1188–1194. [Google Scholar] [CrossRef] [PubMed]
  28. Hale, S.E.; Alling, V.; Martinsen, V.; Mulder, J.; Breedveld, G.D.; Cornelissen, G. The sorption and desorption of phosphate-P, ammonium-N and nitrate-N in cacao shell and corn cob biochars. Chemosphere 2013, 91, 1612–1619. [Google Scholar] [CrossRef] [PubMed]
  29. McLaughlin, H.; Shields, F.; Jagiello, J.; Thiele, G. Analytical options for biochar adsorption and surface area. In Proceedings of the North American Biochar Conference, Sonoma, CA, USA, 29 July–1 August 2012; pp. 1–19. [Google Scholar]
  30. Jegajeevagan, K.; Mabilde, L.; Gebremikael, M.T.; Ameloot, N.; De Neve, S.; Leinweber, P.; Sleutel, S. Artisanal and controlled pyrolysis-based biochars differ in biochemical composition, thermal recalcitrance, and biodegradability in soil. Biomass Bioenergy 2016, 84, 1–11. [Google Scholar] [CrossRef]
  31. Brewer, C.E. Biochar Characterization and Engineering. Master’s Thesis, Iowa State University, Ames, Iowa, 2012; p. 12284. [Google Scholar]
  32. Montoya-Arango, J.A.; Jimenez-Arias, E. Determinacion de la curva de secado al aire libre, mediante modelacion matemática y experimental de la. Sientia Tech. 2006, 415–419. [Google Scholar] [CrossRef]
  33. Morales-Pinzón, T.; Durán, L.F.; Alzate, C.A. Contenido de Humedad en Guadua Rolliza Preservada y Secada en Invernadero; CATIE: Turrialba, Costa Rica, 2012. [Google Scholar]
  34. Bachmann, J.; Horton, R.; Van Der Ploeg, R.R.; Woche, S. Modified sessile drop method for assessing initial soil-water contact angle of sandy soil. Soil Sci. Soc. Am. J. 2000, 64, 564–567. [Google Scholar] [CrossRef]
  35. Nsamba, H.K.; Hale, S.E.; Cornelissen, G.; Bachmann, R.T. Sustainable Technologies for Small-Scale Biochar Production—A Review. J. Sustain. Bioenergy Syst. 2015, 5, 10–31. [Google Scholar] [CrossRef] [Green Version]
  36. Pan, W.-P.; Richards, G.N. Influence of metal ions on volatile of pyrolysis of wood products. J. Anal. Appl. Pyrolysis 1989, 16, 117–126. [Google Scholar] [CrossRef]
  37. Mašek, O.; Buss, W.; Brownsort, P.; Rovere, M.; Alberto, T. Potassium doping increases biochar carbon sequestration potential by 45%, facilitating decoupling of carbon sequestration from soil improvement. Sci. Rep. 2019, 9, 5514. [Google Scholar] [CrossRef] [PubMed]
  38. Shah, M.H.; Deng, L.; Bennadji, H.; Fisher, E.M. Pyrolysis of Potassium-Doped Wood at the Centimeter and Submillimeter Scales. Energy Fuels 2015, 29, 7350–7357. [Google Scholar] [CrossRef]
  39. Fryda, L.; Daza, C.; Pels, J.; Janssen, A.; Zwart, R. Lab-scale co-firing of virgin and torrefied bamboo species Guadua angustifolia Kunth as a fuel substitute in coal fired power plants. Biomass Bioenergy 2014, 65, 28–41. [Google Scholar] [CrossRef] [Green Version]
  40. Ardila, C.R.; Folgueras, M.B.; Fernández, F.J. Oxidative pyrolysis of Guadua angustifolia Kunth. Energy Rep. 2019, 22–25. [Google Scholar] [CrossRef]
  41. Folgeras, M.B.; Fernández, F.J.; Ardila, C.R.; Alonso, M.; Lage, S. Fast pyrolisis of Guadua angustifolia-Kunth. Energy Procedia 2017, 136, 60–65. [Google Scholar] [CrossRef]
  42. González, P.G.; Pliego-Cuervo, Y.B. Physicochemical and microtextural characterization of activated carbons produced from water steam activation of three bamboo species. J. Anal. Appl. Pyrolysis 2013, 99, 32–39. [Google Scholar] [CrossRef]
  43. Salas-Enríquez, B.G.; Torres-Huerta, A.M.; Conde-Barajas, E.; Domínguez-Crespo, M.A.; Días-García, L.; Negrete-Rodríguez, M.X. Activated carbon production from the Guadua amplexifolia using a combination of physical and chemical activation. J. Therm. Anal. Calorim. 2016, 124, 1383–1398. [Google Scholar] [CrossRef]
  44. Sadiku, N.A.; Oluyege, A.O.; Sadiku, I.B. Lignocellulose. Lignocellylose 2016, 5, 34–49. [Google Scholar]
  45. Scurlock, J.M.O.; Dayton, D.C.; Hames, B. Bamboo: An overlooked biomass resource? Biomass Bioenergy 2000, 19, 229–244. [Google Scholar] [CrossRef] [Green Version]
  46. Folgeras, M.B.; Fernández, F.J.; Ardila, C.R.; Alonso, M.; Lage, S. Fast pyrolysis of Guadua angustifolia-Kunth. In Proceedings of the 4th International Conference on Energy and Environment Research, ICEER 2017, Porto, Portugal, 17–20 July 2017. ScienceDirect 2017. [Google Scholar]
  47. Antal, M.J.; Allen, S.G.; Dai, X.; Shimizu, B.; Tam, M.S.; Grønli, M. Attainment of the Theoretical Yield of Carbon from Biomass. Ind. Eng. Chem. Res. 2000, 39, 4024–4031. [Google Scholar] [CrossRef]
  48. Darmawan, S.; Wistara, N.J.; Pari, G.; Maddu, A.; Syafii, W. Characterization of Lignocellulosic Biomass as Raw Material for the Production of Porous Carbon-based. BioResources 2016, 11, 3561–3574. [Google Scholar] [CrossRef]
  49. Puente-Urbina, A.; Gaitán-Álvadez, J.; Rodríguez-Zúñiga, A. Torrefaction analysis of woody biomasses from fast-growing plantations of costa rica. In Proceedings of the 25th European Biomass Conference and Exhibition, Stockholm, Sweden, 12–15 June 2017; pp. 12–15. [Google Scholar]
  50. Bachmann, J.; Ellies, A.; Hartge, K.H. Development and application of a new sessile drop contact angle method to assess soil water repellency. J. Hydrol. 2000, 231, 66–75. [Google Scholar] [CrossRef]
  51. Zornoza, R.; Moreno-Barriga, F.; Acosta, J.A.; Muñoz, M.A.; Faz, A. Stability, nutrient availability and hydrophobicity of biochars derived from manure, crop residues, and municipal solid waste for their use as soil amendments. Chemosphere 2016, 144, 122–130. [Google Scholar] [CrossRef] [PubMed]
  52. Das, O.; Sarmah, A.K. The love-hate relationship of pyrolysis biochar and water: A perspective. Sci. Total Environ. 2015, 512–513, 682–685. [Google Scholar] [CrossRef] [PubMed]
  53. Keiluweit, M.; Nico, P.S.; Johnson, M.G.; Kleber, M. Dynamic Molecular Structure of Plant Biomass-Derived Black Carbon (Biochar). Environ. Sci. Technol. 2010, 44, 1247–1253. [Google Scholar] [CrossRef] [Green Version]
  54. Suguihiro, T.M.; de Oliveira, P.R.; de Rezende, E.I.P.; Mangrich, A.S.; Marcolino Junior, L.H.; Bergamini, M.F. An electroanalytical approach for evaluation of biochar adsorption characteristics and its application for Lead and Cadmium determination. Bioresour. Technol. 2013, 143, 40–45. [Google Scholar] [CrossRef] [Green Version]
  55. Baldock, J.A.; Smernik, R.J. Chemical composition and bioavailability of thermally altered Pinus resinosa (Red pine) wood. Org. Geochem. 2002, 33, 1093–1109. [Google Scholar] [CrossRef]
  56. Glaser, B.; Lehmann, J.; Zech, W. Ameliorating physical and chemical properties of highly weathered soils in the tropics with charcoal—A review. Biol. Fertil. Soils 2002, 35, 219–230. [Google Scholar] [CrossRef]
  57. Munera-Echeverri, J.L.; Martinsen, V.; Strand, L.T.; Zivanovic, V.; Cornelissen, G.; Mulder, J. Cation exchange capacity of biochar: An urgent method modification. Sci. Total Environ. 2018, 642, 190–197. [Google Scholar] [CrossRef] [Green Version]
  58. Lee, J.W.; Kidder, M.; Evans, B.R.; Paik, S.; Buchanan, A.C.; Garten, C.T.; Brown, R.C. Characterization of biochars produced from cornstovers for soil amendment. Environ. Sci. Technol. 2010, 44, 7970–7974. [Google Scholar] [CrossRef] [Green Version]
  59. Hanč, A.; Tlustoš, P.; Száková, J.; Balík, J. The influence of organic fertilizers application on phosphorus and potassium bioavailability. Plant Soil Environ. 2008, 54, 247–254. [Google Scholar] [CrossRef] [Green Version]
  60. Bettendorf, T.; Stoeckl, M.; Otterpohl, R. Vermicomposting of municipal solid organic waste and fecal matter as part of Terra Preta Sanitation a process and product assessment. In Terra Preta Sanitation; Wendland, C., Otterpohl, R., Eds.; Deutsche Bundesstiftung Umwelt: Osnabrück, Germany, 2014; pp. 1–8. ISBN 9783000465864. [Google Scholar]
  61. FAO. Manual on Fertilizer Statistics Food and Agriculture Organization of the United Nations Rome; FAO: Roma, Italy, 1991; ISBN 925103074X. [Google Scholar]
  62. Naiji, M.; Souri, M.K. Nutritional value and mineral concentrations of sweet basil under organic compared to chemical fertilization. Acta Sci. Pol. Hortorum Cultus 2018, 17, 167–175. [Google Scholar] [CrossRef]
  63. Baronti, S.; Vaccari, F.P.; Miglietta, F.; Calzolari, C.; Lugato, E.; Orlandini, S.; Pini, R.; Zulian, C.; Genesio, L. Impact of biochar application on plant water relations in Vitis vinifera (L.). Eur. J. Agron. 2014, 53, 38–44. [Google Scholar] [CrossRef]
Figure 1. Pattern of temperatures of the triplicate charring lots during production of two biochars made of Guadua bamboo (BB), (a) BB1, (c) BB2 and (e) BB3, and pinewood waste (WB), (b) WB1, (d) WB2 and (f) WB3.
Applsci 10 00507 g001
Figure 2. Comparison of the SEM micrograph magnifications at 300× and 800× of BB1 and WB1 as examples of bamboo biochar (a,b) and pinewood biochar (c,d), respectively. Scanning electron microscope image of sample BB1 at (a) 300 µm and (b) 100 µm resolution and sample WB1 at (c) 300 µm and (d) 100 µm resolution.
Applsci 10 00507 g002
Figure 3. Hydrophobicity analysis by sessile drop method (SDM) of (a) bamboo biochars, BB and (b) pinewood biochars, WB. The drop size was 2 µL. Notice that initial contact angle was determined at initial time.
Applsci 10 00507 g003
Figure 4. Cation exchange capacity (CEC) and anion exchange capacity (AEC) of six biochar samples. Notice that BB and WB indicate bamboo and pinewood biochar, respectively. Different letters mean statistical significant differences using Tukey’s test (p < 0.05).
Applsci 10 00507 g004
Figure 5. Available water content at mixtures of TPS and twelve biochars made of bamboo and pinewood applying two doses (5% and 10% dry wt). Different letters show statistically significant differences between variables using Tukey’s test (p < 0.05). Notice that the corresponding biochars in the mixture were denoted as xBy, being x the feedstock source (B or W) and y the lot number (1, 2 or 3).
Applsci 10 00507 g005
Table 1. Comparison of selected properties from selected feedstocks.
FeedstockCellulose %Hemicellulose %Lignin %Moisture %Volatiles %Ash %hhv (mj/kg)Cite
Guadua angustifolia Kunthn.a.n.a.n.a.9755.718.8[39]
52.619.727.6n.an.an.an.a[40]
n.a.n.a.n.a.7.875.83.819.1[41]
n.a.n.a.n.a.9.174.12.9n.a.[42]
Guadua amplexifolia47.826.321.58.186.82.2 [43]
Bambusa vulgarisn.an.an.a7.1474.351.49n.a[44]
Phyllosctachys44.2–47.726.7–28.625.4–27.3n.a.80–840.50–1.319.1–19.6[45]
Dendrocalamus giganteus Munro47.515.3526.259.3770.312.57n.a.[46]
Pine wood42.127.725.0n.a.n.a.n.a.n.a.[47]
Pine wood43.7416.2029.14n.a84.05.31n.a.[48]
Cupressus lusitanica64.7Under cellulose31.4n.a.n.a.0.18n.a.[49]
Spruce wood41.120.928.0n.a.n.a.0.3019.25[47]
Table 2. Summary of temperatures and time to reach 500 °C in a TLUD stove, during preparation of biochars from bamboo (BB) and pinewood (WB).
BB1BB2BB3WB1WB2WB3p-Value
Temperature (°C)
Thermocouple I (13 cm)Average3355345195585466540.1643
Maximum7827527566858368540.6300
Thermocouple II (18 cm)Average2584394175545495470.0351 *
Maximum6626947266837677180.4015
Time to reach 500 °C (min)
Thermocouple I (13 cm) 3671431770.6193
Thermocouple II (18 cm) 4271431270.4782
*: is the p-value with significant difference (p < 0.05). One-way ANOVA was measured between the two groups BB and WB.
Table 3. Porosity and specific surface area of bamboo biochar (BB) and pinewood biochar (WB) with three replicates each (1, 2 and 3).
Specific Surface AreaPore VolumeMean Pore SizeSkeletal Density
SampleA-BET (m2/g)Micropore (m2/g)BJH (cm3/g)Micropores (cm3/g)Dp,BJH-D (nm)(g/cm3)
BB1144 ± 7108 ± 50.0090.0504.41.764 ± 0.010
BB281 ± 450 ± 20.0070.0234.81.690 ± 0.013
BB354 ± 331 ± 20.0050.0143.41.656 ± 0.013
WB1267 ± 13159 ± 80.0210.0744.01.591 ± 0.013
WB2264 ± 13199 ± 100.0240.0924.01.609 ± 0.015
WB3234 ± 12169 ± 80.0270.0784.91.537 ± 0.012
A-BET: specific surface area by Brunauer–Emmett–Teller method, BJH specific pore volume by the Barrett-Joyner-Halenda method, Dp,BJH-D: mean pore diameter by the Barrett-Joyner-Halenda method from the desorption curve data.
Table 4. Proximate and elemental analysis of bamboo biochar (BB), pinewood biochar (WB) and replicates (1, 2 and 3).
BB1BB2BB3WB1WB2WB3
Proximate analysis
Fixed carbon %58.658.142.173.480.764.8
Ash content %20.017.436.19.41.715.4
Elemental analysis
C %66.7 bc61.5 b38.3 a74.5 cd75.1 cd75.8 d
N %0.45 a0.51 a0.61 a0.20 a0.22 a0.20 a
H %2.1 b2.2 bc1.6 a2.2 cd2.3 d2.6 e
S %0.15 a0.23 a0.25 a0.09 a0.11 a0.17 a
O * %10.6 ab18.1 bcd23.2 d13.6 abc20.6 cd5.8 a
C:N molar177 a148 a97 a434 b402 b454 b
H:C molar0.37 a0.42 a0.39 a0.35 a0.36 a0.40 a
O:C molar0.12 ab0.22 b0.45 c0.14 ab0.21 b0.06 a
Distinct letters in a variable for the different treatments means that they are significantly different (p < 0.05).
Table 5. Electrical conductivity (EC), relative liming effect (RLE), potential liming capacity (PLC) and pH analysis of bamboo biochar (BB) and pinewood biochar (WB) replicates.
BB1BB2BB3WB1WB2WB3
EC (mS cm−1)2.5 ab2.5 a2.4 b0.9 c1.0 d1.2 e
RLE5.0 a0.6 a1.9 a11.5 b9.6 b10.9 b
PLC1.0 a0.1 a0.4 a2.4 b2.0 b2.3 b
pH H2O7.6 a10.0 b10.3 bc9.8 b7.3 a10.6 c
pH KCl10.1 ab9.8 a10.1 ab10.4 b10.4 b11.3 c
pH CaCl28.0 a9.8 b10.2 d8.8 c8.7 c10.5 d
Distinct letters in a variable for the different treatments means that they are significantly different (p < 0.05).
Table 6. Chemical analysis of the terra preta sanitation (TPS).
AnalysisResults
Moisture %67
pH H2O (1:2)6.7
EC (mS/cm)8.10
C:N 12.50
C %45.23
N %3.61
P %0.48
K %1.37
S %0.36
Ca %0.89
Mg %0.36
Fe (mg/kg)1631
Cu (mg/kg)34
Zn (mg/kg)122
Mn (mg/kg)159
B (mg/kg)14

