Effects of Manure Waste Biochars in Mining Soils


Abstract
:1. Introduction
2. Materials and Methods
2.1. Selected Manure Wastes and Biochar Production
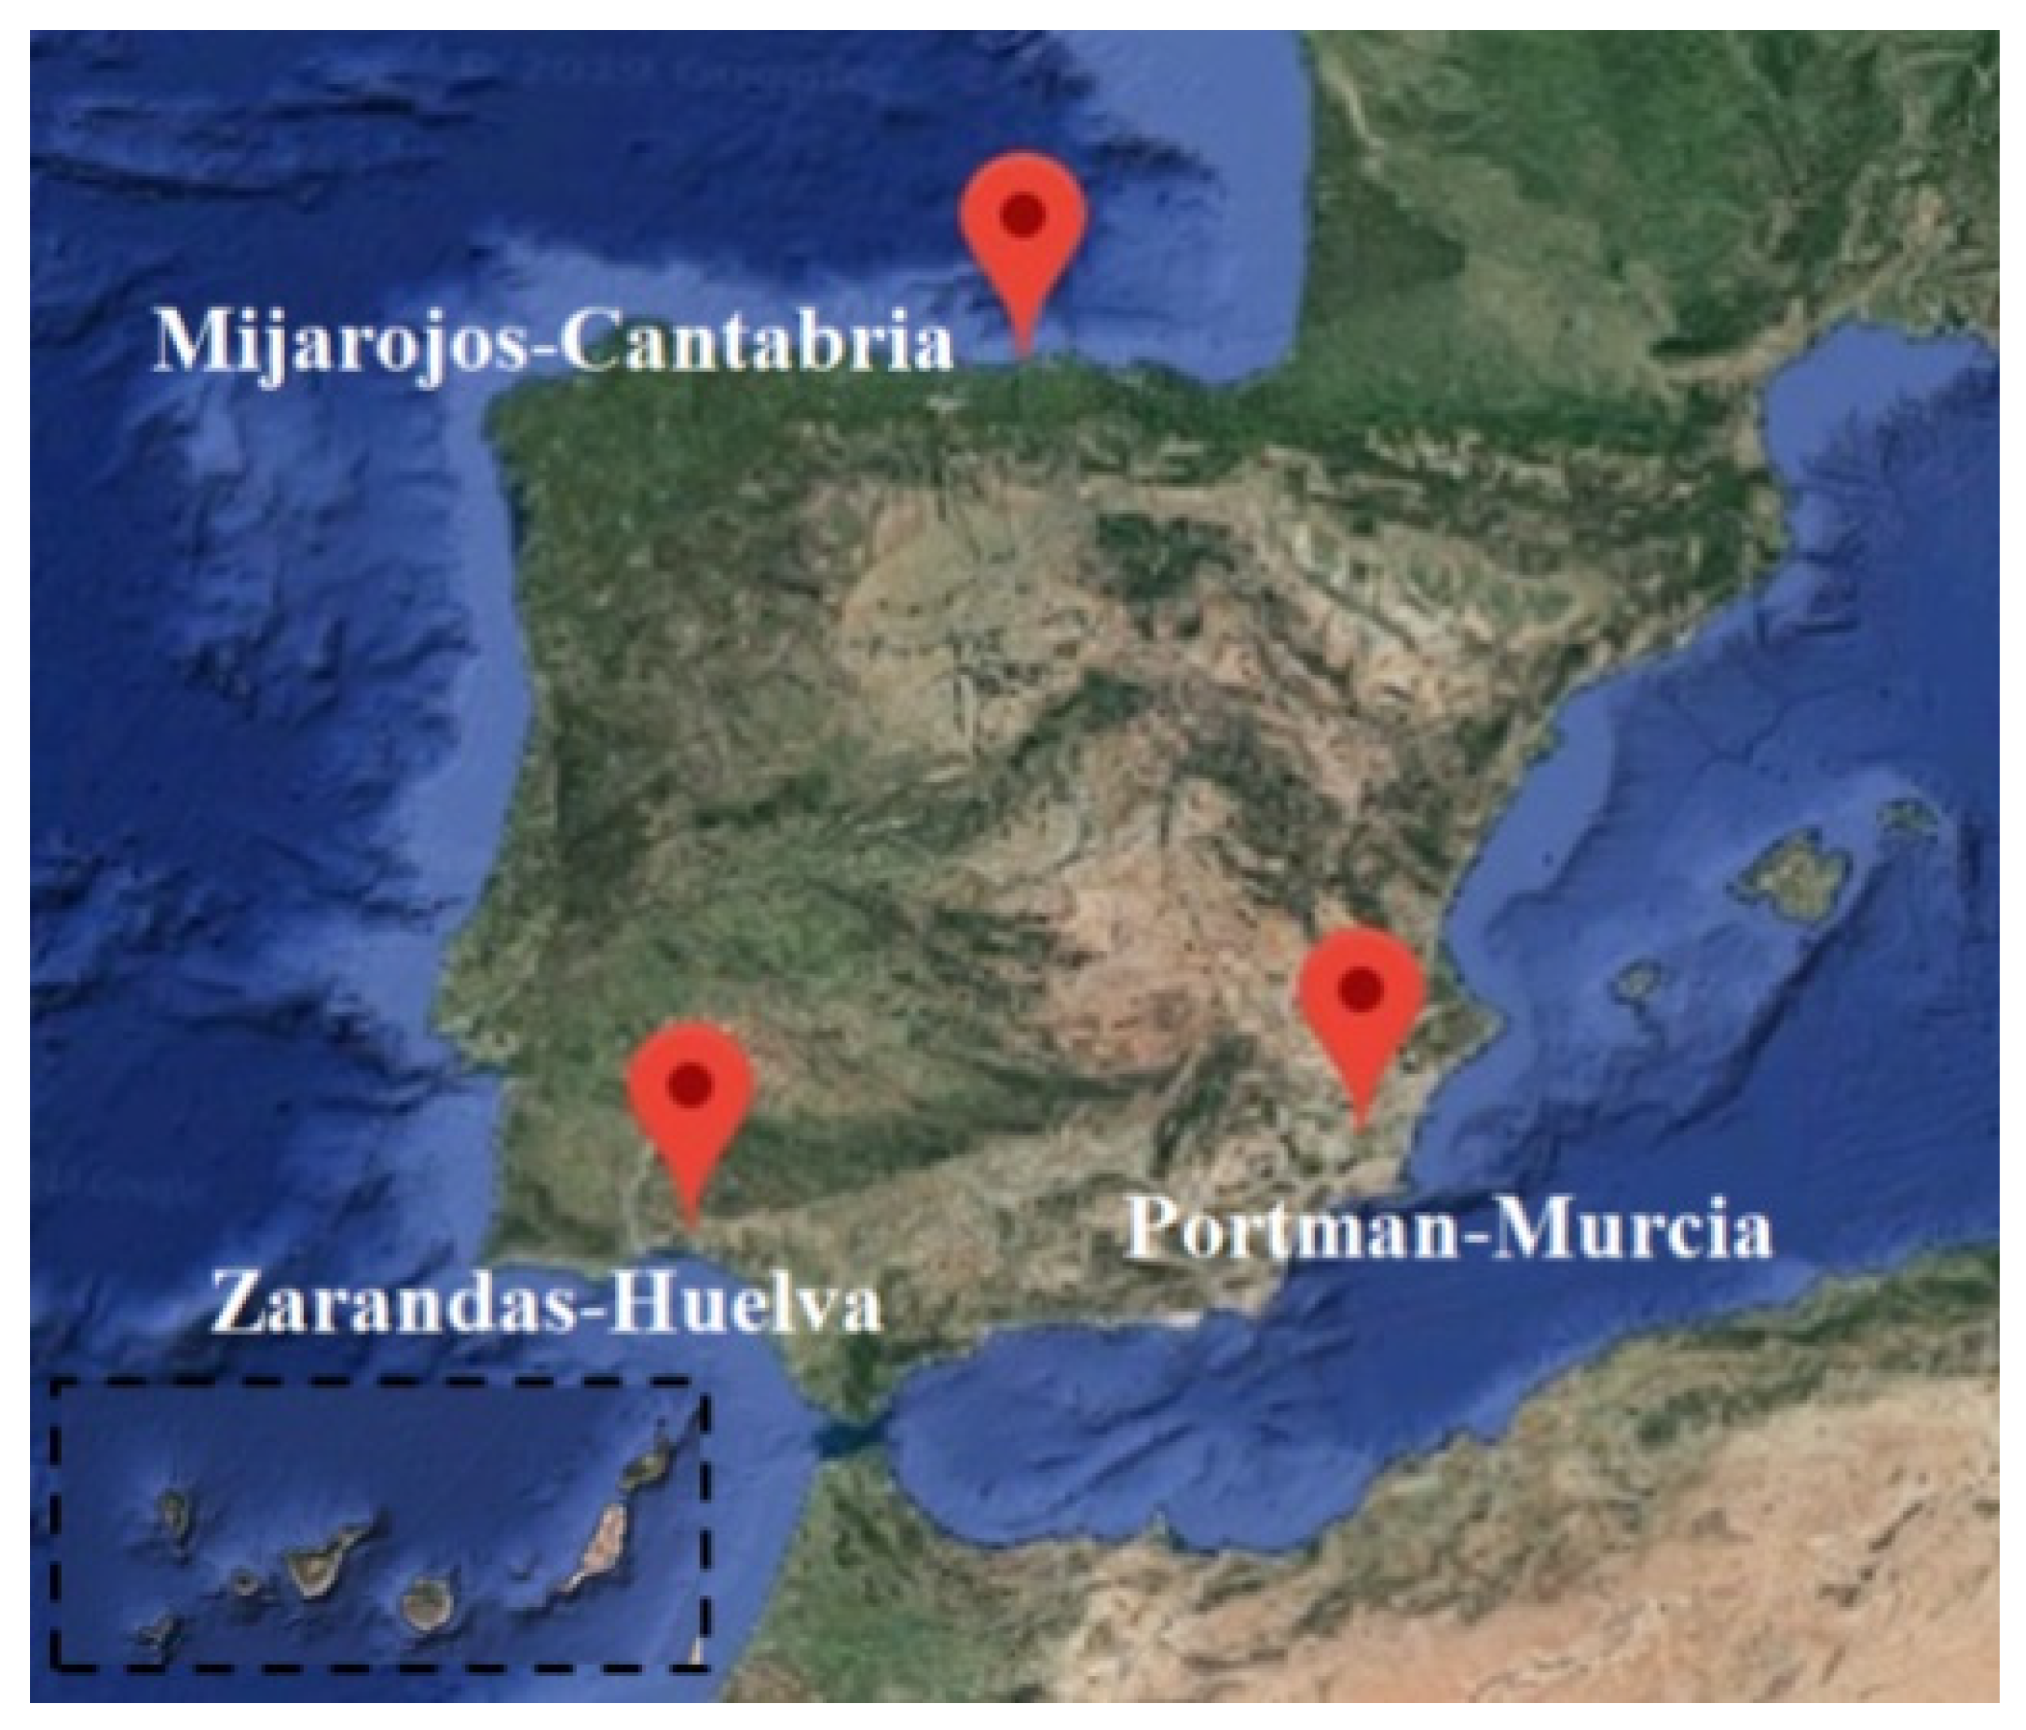
2.2. Selected Mining Soils
2.3. Material Characterization
2.3.1. Raw Materials and Biochars
2.3.2. Mining Soils
2.4. Incubation Experiment
2.5. Statistical Analysis
3. Results
3.1. Material Characterization
3.1.1. Raw Materials and Biochars
3.1.2. Soil Characterization
3.2. Characterization of Amended Mining Soils: Trace Metal Mobility
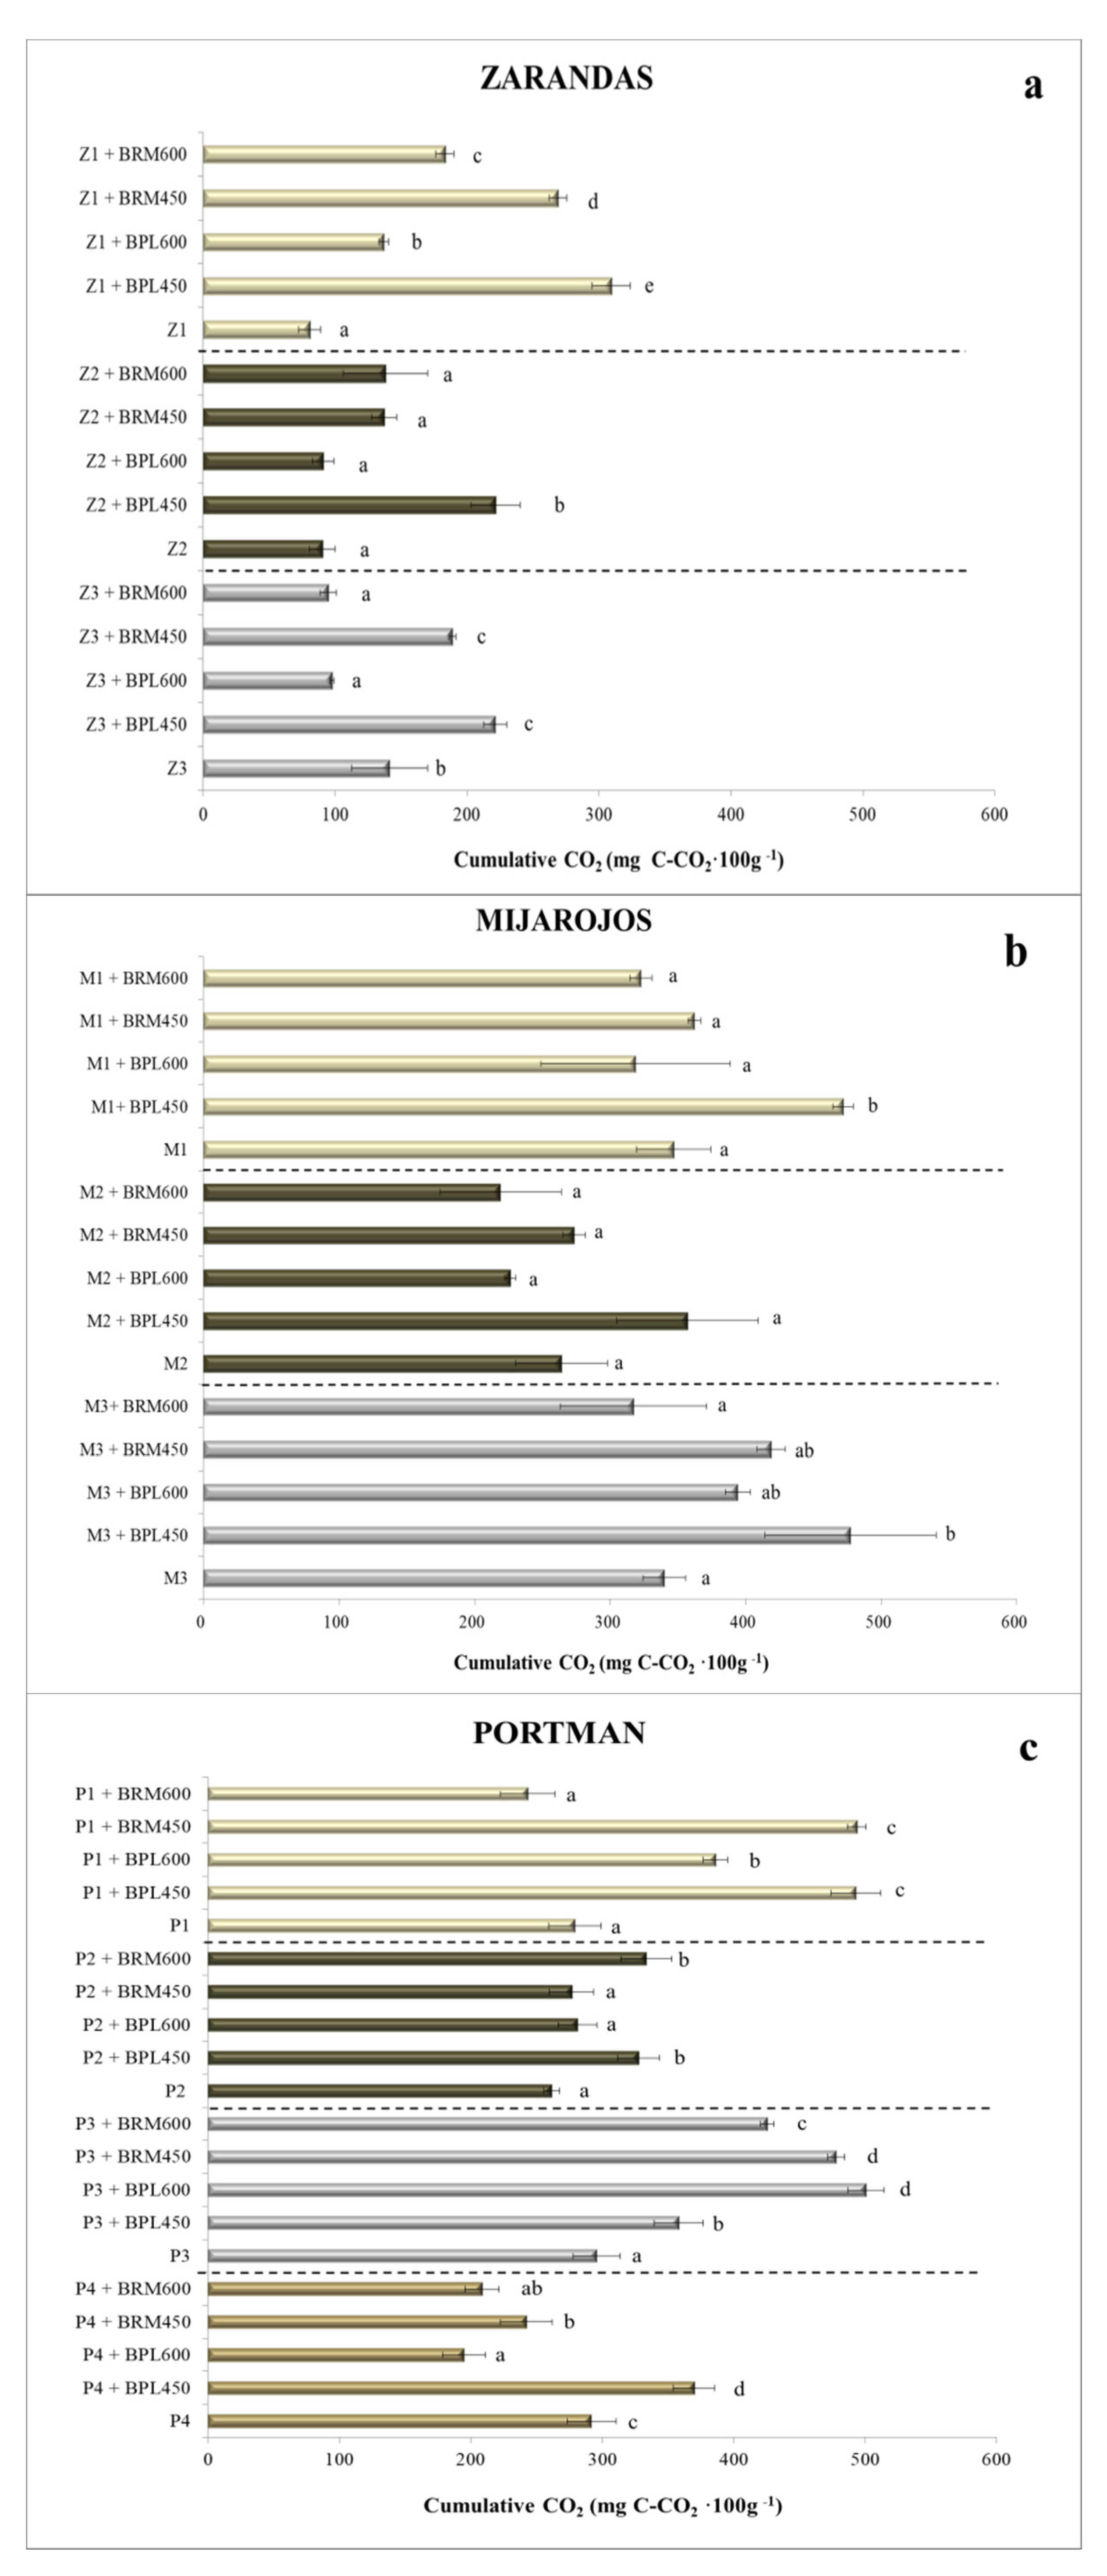
3.3. CO2 Emissions and qCO2 Quotient in Amended Mining Soils
- For the Zarandas-Andalusia area (Figure 2a):Soil Z1: Z1 (81 mg·100 g−1) < Z1 + BPL600 (+69%) < Z1 + BRM600 (125%) < Z1 + BRM450 (232%) < Z1 + BPL450 (+281%);Soil Z2: Z2 (90 mg·100 g−1) ≈ Z2 + BPL600 ≈ Z2 + BRM600 ≈ Z2 + BRM450 < Z2 + BPL450 (+145%);Soil Z3: Z3 + BPL600 (−30%) ≈ Z3 + BRM600 (−32%) < Z3 (141 mg·100 g−1) < Z3 + BRM450 ≈ Z3 + BPL450 (+34%).
- For the Mijarojos-Cantabria area (Figure 2b):Soil M1: M1 (347 mg·100 g−1) ≈ M1 + BRM600 ≈ M1 + BPL600 ≈ M1 + BRM450 < M1 + BPL450 (+26%);Soil M2 (264 mg·100 g−1): there was no significant difference among treatments for soil M2;Soil M3: M3 (340 mg·100 g−1) ≈ M3 + BRM600 ≤ M3 + BPL600 (+15%) ≈ M3 + BRM450 ≤ M3 + BPL450 (+40%).
- For the Portman-Murcia area (Figure 2c):Soil P1: P1 (279 mg·100 g−1) ≈ P1 + BRM600 < P1 + BPL600 (+38%) < P1 + BRM450 (77%) ≈ P1 + BPL450;Soil P2: P2 (261 mg·100 g−1) ≈ P2 + BPL600 ≈ P2 + BRM450 < P2 + BRM600 (+25%) ≈ P2 + BPL450;Soil P3: P3 (295 mg·100 g−1) < P3 + BPL450 (+21%) < P3 + BRM600 (+44%) < P3 + BRM450 (62%) ≈ P3 + BPL600;Soil P4: P4 + BPL600 (−33%) < P4 + BRM600 (−28%) < P4 + BRM450 (−17%) < P4 (291 mg·100 g−1) < P4 + BPL450 (+27%).
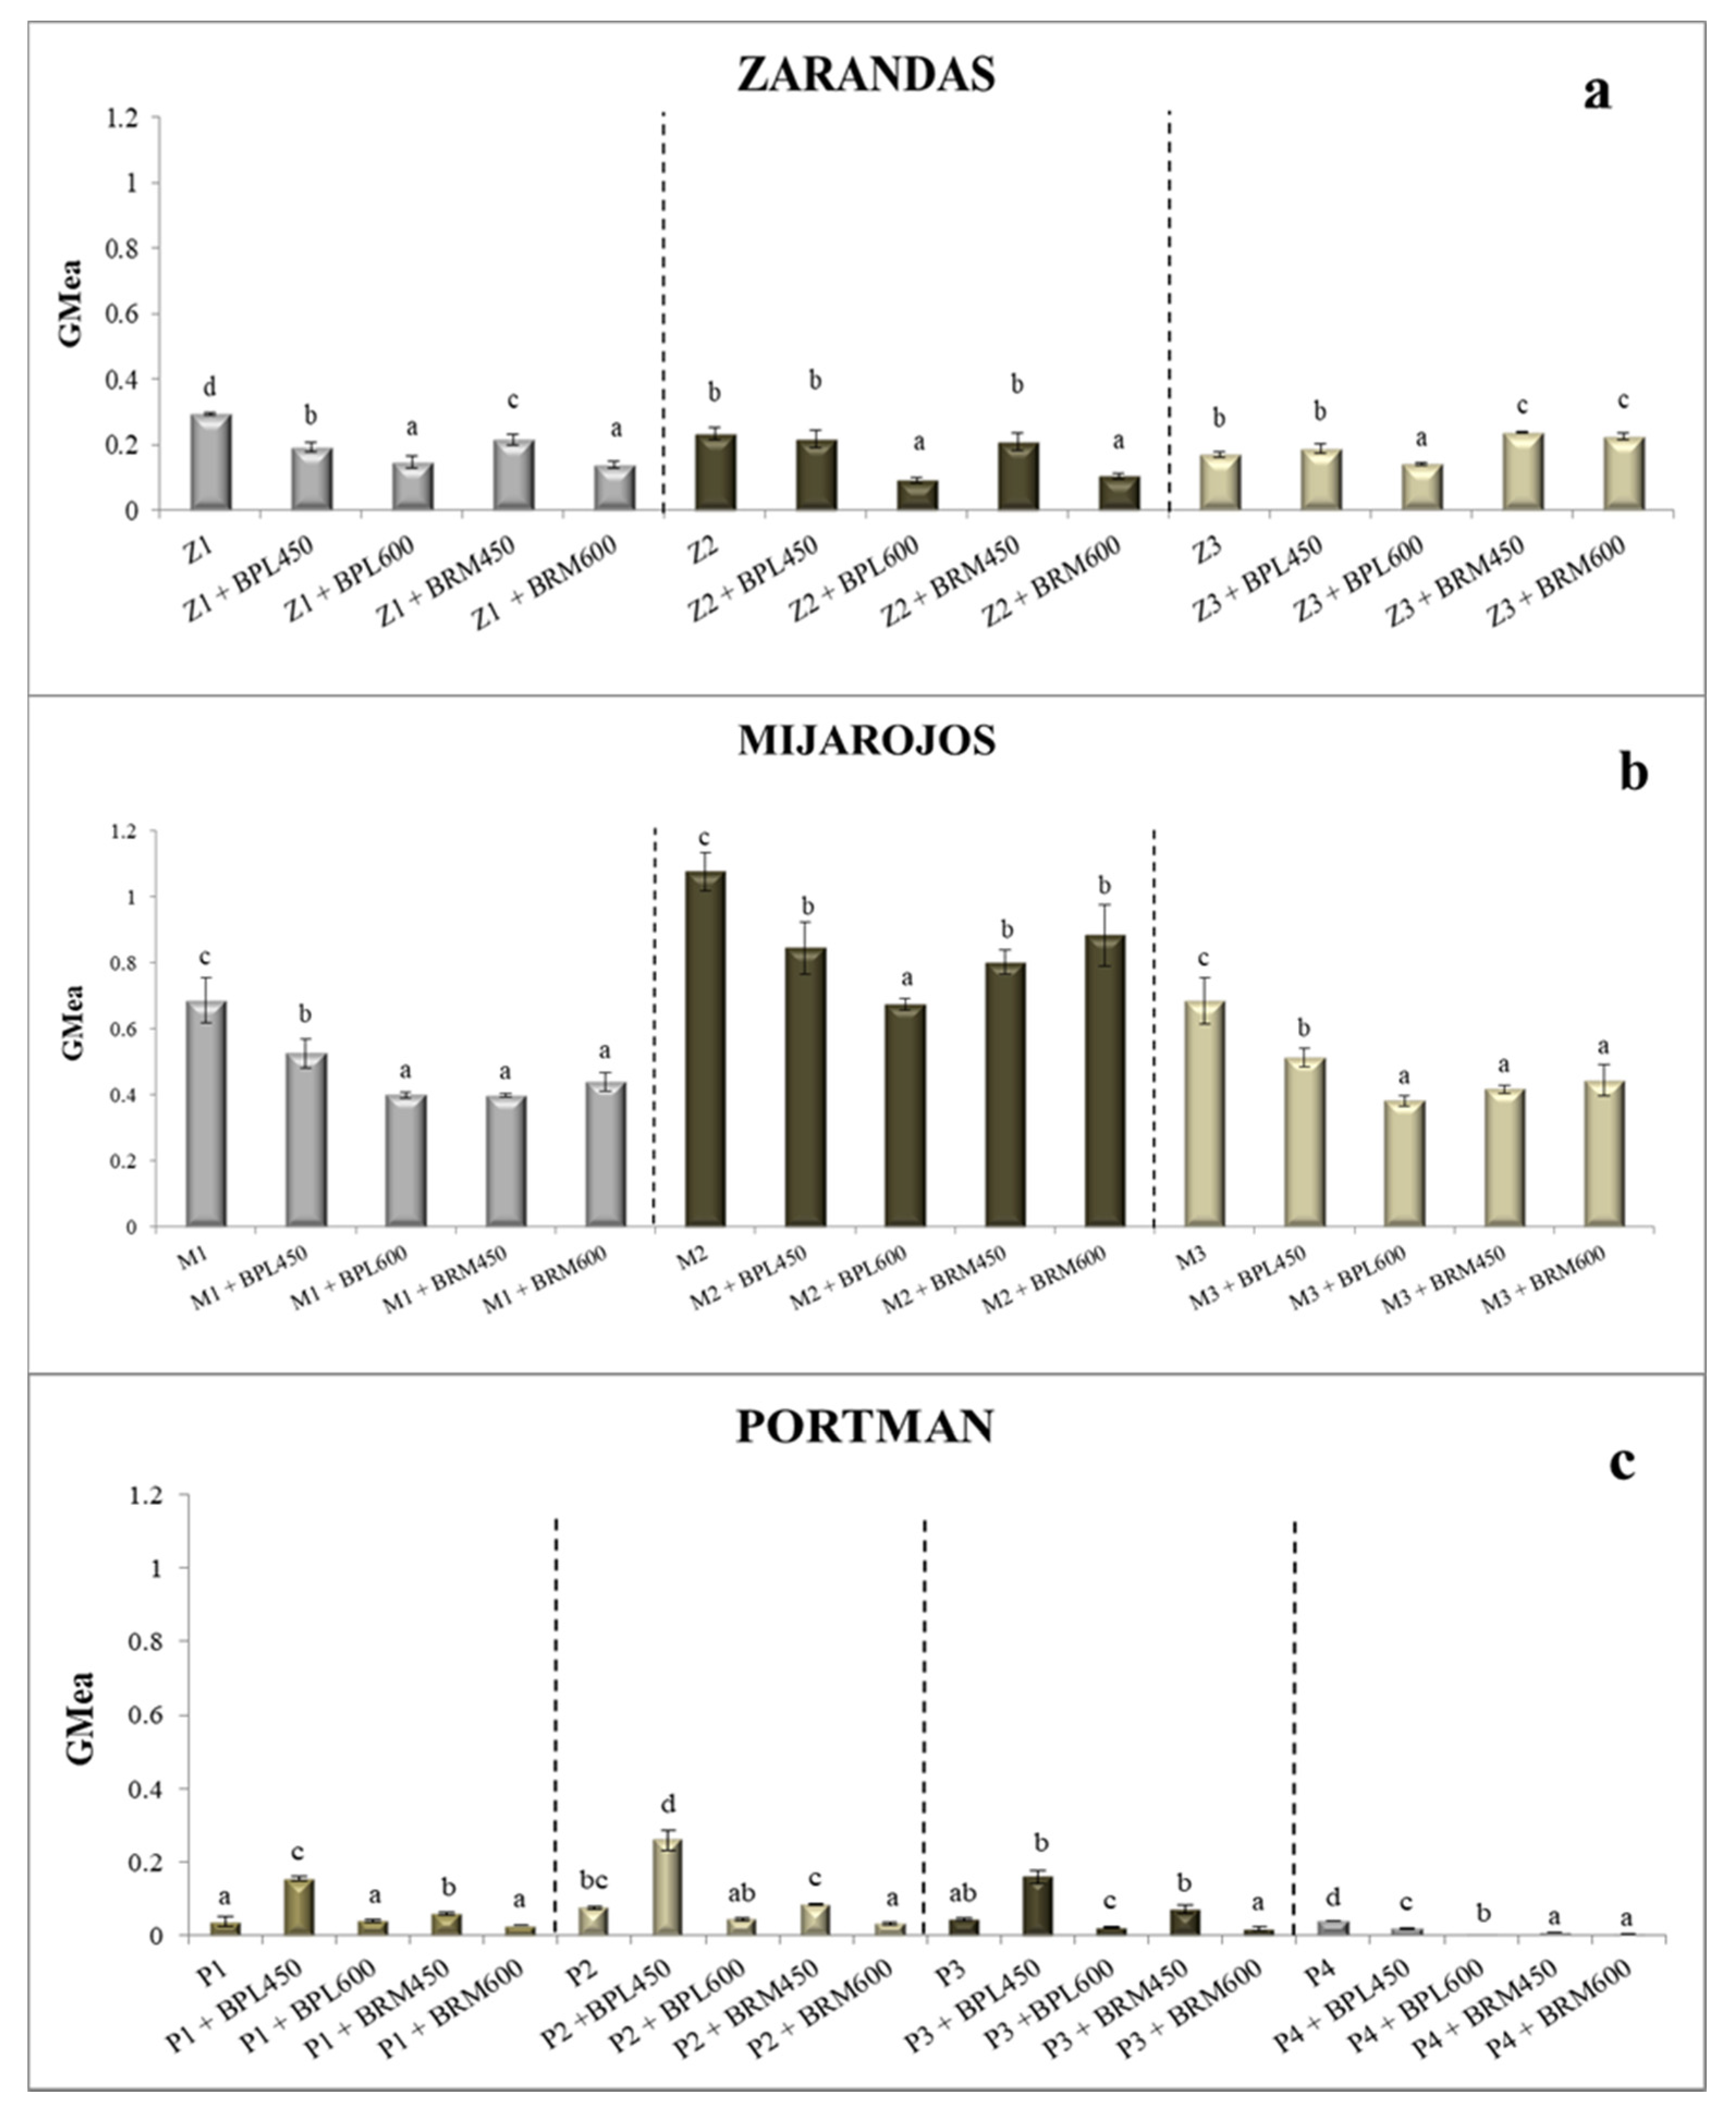
- For the Zarandas-Andalusia area (Figure 4a):Soil Z1: Z1 + BRM450 (−27%) < Z1 + BPL450 (−35%) < Z1 + BPL600 (−50%) ≈ Z1 + BRM600 < Z1 (0.29);Soil Z2: Z2 + BRM600 (−56%) ≈ Z2 + BPL600 (-61%) < Z2 (0.23) ≈ Z2 + BPL450 ≈ Z2 + BRM450;Soil Z3: Z3 + BPL600 (−18%) < Z3 (0.17) ≈ Z3 + BPL450 < Z3 + BRM450 (40%) ≈ Z3 + BRM600.
- For the Mijarojos-Cantabria area (Figure 4b):Soil M1: M1 + BRM600 (−35%) ≈ M1+BRM450 ≈ M1 + BPL600 < M1 (0.69) < M1 + BPL450 (23%);Soil M2: M2 + BPL600 (−37%) < M2 + BRM600 (−18%) ≈ M2 + BPL450 ≈ M3 + BRM450 < M2 (1.08);Soil M3: M3 + BRM600 (−35%) ≈ M3 + BRM450 ≈ M3 + BPL600 < M3 + BPL450 (−25%) < M3 (0.69).
- For the Portman-Murcia area (Figure 4c):Soil P1: P1 (0.03) ≈ P1 + BRM600 ≈ P1 + BPL600 < P1 + BRM450 (62%) < P1 + BPL450 (323%);Soil P2: P2 + BRM600 (−57%) < P2 + BPL600 (−42%) ≤ P2 (0.07) < P2 + BRM450 (+11%) < P2 + BPL450 (+239%);Soil P3: P3 + BPL600 (−50%) ≈ P3 + BRM600 < P3 (0.04) < P3 + BRM450 (60%) > P3 + BPL450 (264%);Soil P4: P4 + BRM450 (−92%) ≈ P4 + BRM600 < P4 + BPL450 (−50%) < P4 + BPL600 < P4 (0.04).
4. Discussion
4.1. Materials Characterization
4.1.1. Raw Materials and Biochar Characterization
4.1.2. Soils Characterization
4.2. Metal Mobility in Amended Mining Soils
4.3. CO2 Emissions, qCO2 Quotient, and GMea Index
5. Conclusions
Author Contributions
Funding
Conflicts of Interest
References
- Torres, K.C.; Johnson, M.L. Bioaccumulation of metals in plants, arthropods, and mice at a seasonal wetland. Environ. Toxicol. Chem. 2001, 20, 2617–2626. [Google Scholar] [CrossRef] [PubMed]
- Jain, P.; Powell, J.; Smith, J.L.; Townsend, T.G.; Tolaymat, T. Life Cycle Inventory & Impact Evaluation of Mining Municipal Solid Waste Ladfills. Environ. Sci. Technol. 2014, 48, 2920–2927. [Google Scholar] [PubMed]
- Johansson, N.; Krook, J.; Eklund, M.; Berglund, B. An integrated review of concepts and initiatives for mining the technosphere: Towards a new taxonomy. J. Clean Prod. 2013, 55, 35–44. [Google Scholar] [CrossRef] [Green Version]
- Gill, R.T.; Harbottle, M.J.; Smith, J.W.N.; Thornston, S.F. Electrokinetic-enhanced bioremediation of organic contaminants: A review of processes and environmental applications. Chemosphere 2014, 107, 31–42. [Google Scholar] [CrossRef] [Green Version]
- Quaghebeur, M.; Laenen, B.; Geysen, D.; Nielsen, P.; Pontikes, Y.; Van Gerven, T.; Spooren, J. Characterization of landfilled materials: Screening of the enhanced landfill mining potential. J. Clean Prod. 2013, 55, 72–83. [Google Scholar] [CrossRef]
- Khan, F.I.; Husain, T.; Hejazi, R. An overview and analysis of site remediation technologies. J. Environ. Manag. 2004, 71, 95–122. [Google Scholar] [CrossRef]
- Hasegava, H.; Rahman, I.M.M.; Rahman, M.A. Environmental Remediation Technologies for Metal- Contaminated Soils; Springer: Tokyo, Japan, 2016; Volume 254, pp. 1–254. [Google Scholar]
- Ortiz, I.; Sanz, J.; Dorado, M.; Villar, S. Técnicas de Recuperación de Suelos Contaminados: Informe de Vigilancia Tecnológica m i+d; Universidad de Alcalá: Alcalá de Henares, Spain, 2007; pp. 6–108. [Google Scholar]
- Porcar Orti, J. Recuperación de los Metales Tóxicos Presentes en la Biomasa de Programas de Fitorremediación. ES Patent 2423708 B1, 25 November 2014. [Google Scholar]
- Jorba, M.; Andres, P. Effects of sewage sludge on the establishment of the herbaceous ground cover after soil restoration. J. Soil Water Conserv. 2000, 55, 322–327. [Google Scholar]
- Párraga-Aguado, I.; Álvarez-Rogel, J.; González-Alcaraz, M.N.; Conesa, H.M. Metal mobility assessment for the application of an urban organic waste amendment in two degraded semiarid soils. J. Geochem. Explor. 2017, 173, 92–98. [Google Scholar] [CrossRef]
- Tejada, M.; Hernandez, M.T.; Garcia, C. Soil restoration using composted plant residues: Effects on soil properties. Soil Tillage Res. 2009, 102, 109–117. [Google Scholar] [CrossRef]
- Khalid, S.; Shahid, M.; Niazi, N.K.; Murtaza, B.; Bibi, I.; Dumat, C. A comparison of technologies for remediation of heavy metal contaminated soils. J. Geochem. Explor. 2017, 182, 247–268. [Google Scholar] [CrossRef] [Green Version]
- Amlinger, F.; Pollak, M.; Favoino, E. Heavy Metals and Organic Compounds from Wastes Used as Organic Fertilisers: Study on Behalf of the European Commission ENV.A.2./ETU/2001/0024; Directorate-General Environment: Wien, Austria, 2004; pp. 1–213. [Google Scholar]
- Weissengruber, L.; Möller, K.; Puschenreiter, M.; Friedel, J.K. Long-term soil accumulation of potentially toxic elements and selected organic pollutants through application of recycled phosphorus fertilizers for organic farming conditions. Nutr. Cycl. Agroecosyst. 2018, 110, 427–449. [Google Scholar] [CrossRef] [Green Version]
- Czajczyńska, D.; Anguilano, L.; Ghazal, H.; Krzyżyńska, R.; Reynolds, A.J.; Spencer, N.; Jouhara, H. Potential of pyrolysis processes in the waste management sector. Therm. Sci. Eng. Prog. 2017, 3, 171–197. [Google Scholar] [CrossRef]
- Van Zwieten, L.; Kimber, S.; Morris, S.; Chan, K.Y.; Downie, A.; Rust, J.; Joseph, S.; Cowie, A. Effects of biochar from slow pyrolysis of papermill waste on agronomic performance and soil fertility. Plant. Soil 2009, 327, 235–246. [Google Scholar] [CrossRef]
- Glover, M. Taking biochar to market: Some essential concepts for commercial success. In Biochar for Environmental Management; Lehmann, J., Joseph, S., Eds.; Routledge: New York, NY, USA, 1999; pp. 375–392. [Google Scholar]
- Zhu, Q.; Peng, X.; Huang, T.; Xie, Z.; Holden, N.M. Effect of biochar addition on maize growth and nitrogen use efficiency in acidic red soils. Pedosphere 2014, 24, 699–708. [Google Scholar] [CrossRef]
- Puga, A.P.; Melo, L.C.A.; de Abreu, C.A.; Coscione, A.R.; Paz-Ferreiro, J. Leaching and fractionation of heavy metals in mining soils amended with biochar. Soil Tillage Res. 2016, 164, 25–33. [Google Scholar] [CrossRef]
- Cely, P.; Tarquis, A.M.; Paz-Ferreiro, J.; Méndez, A.; Gascó, G. Factors driving the carbon mineralization priming effect in a sandy loam soil amended with different types of biochar. Solid Earth 2014, 5, 585–594. [Google Scholar] [CrossRef] [Green Version]
- Yuan, P.; Wang, J.; Pan, Y.; Shen, B.; Wu, C. Review of biochar for the management of contaminated soil: Preparation, application and prospect. Sci. Total Environ. 2018, 659, 473–490. [Google Scholar] [CrossRef]
- Cely, P.; Gascó, G.; Paz-Ferreiro, J.; Méndez, A. Agronomic properties of biochars from different manure wastes. J. Anal. Appl. Pyrolysis 2015, 111, 173–182. [Google Scholar] [CrossRef] [Green Version]
- Gascó, G.; Paz-Ferreiro, J.; Álvarez, M.L.; Saa, A.; Méndez, A. Biochars and hydrochars prepared by pyrolysis and hydrothermal carbonisation of pig manure. Waste Manag. 2018, 79, 395–403. [Google Scholar] [CrossRef]
- Higashikawa, F.S.; Conz, R.F.; Colzato, M.; Cerri, C.E.P.; Alleoni, L.R.F. Effects of feedstock type and slow pyrolysis temperature in the production of biochars on the removal of cadmium and nickel from water. J. Clean Prod. 2016, 137, 965–972. [Google Scholar] [CrossRef]
- Kumar, A.; Joseph, S.; Tsechansky, L.; Privat, K.; Schreiter, I.J.; Schüth, C.; Graber, E.R. Biochar aging in contaminated soil promotes Zn immobilization due to changes in biochar surface structural and chemical properties. Sci. Total Environ. 2018, 626, 953–961. [Google Scholar] [CrossRef] [PubMed]
- Ebadnejad, N.; Rostamina, M.; Valizadeh Kakhki, F.; Bazgir, M. Chicken-manure biochar as a soil amendment to immobilize and detoxify cadmium and lead in two different soils. Agrochimica 2018, 62, 33–47. [Google Scholar]
- Rhoades, J.D. Salinity: Electrical conductivity and total dissolved solids. In Methods of Soil Analysis. Part 3. Chemical Methods; Bigham, J.M., Ed.; Soil Science Society America: Madison, WI, USA, 1996; pp. 417–435. [Google Scholar]
- Thomas, G.W. Soil pH and soil acidity. In Methods of Soil Analysis. Part 3. Chemical Methods; Bigham, J.M., Ed.; Soil Science Society America: Madison, WI, USA, 1996; pp. 475–490. [Google Scholar]
- ISO 23470. Soil Quality-Determination of Effective Cation Exchange Capacity (CEC) and Exchangeable Cations Using a Hexaminecobalt Trichloride Solution; ISO: Geneva, Switzerland, 2018.
- Watanabe, F.S.; Olsen, S.R. Test of an ascorbic acid method for determining phosphorus in water and NaHCO3 extracts from soils. Soil Sci. Soc. Am. Proc. 1965, 29, 677–678. [Google Scholar] [CrossRef]
- Nelson, D.; Sommers, L. Total carbon, organic carbon and organic matter. In Methods of Soil Analysis. Part 3. Chemical Methods; Bigham, J.M., Ed.; Soil Science Society America: Madison, WI, USA, 1996; pp. 961–1010. [Google Scholar]
- USEPA. Method 3051a: Microwave Assisted Acid Dissolution of Sediments, Sludges, Soils, and Oils; USDA: Washington, DC, USA, 1997. [Google Scholar]
- Gee, G.W.; Bauder, J.W. Particle size analysis In Methods of Soil Analysis: Part 1; Klute, A., Ed.; American Society of Agronomy (Agronomy 9): Madison, WI, USA, 1986; pp. 383–411. [Google Scholar]
- Cárdenas-Aguiar, E.; Gascó, G.; Paz-Ferreiro, J.; Méndez, A. The effect of biochar and compost from urban organic waste on plant biomass and properties of an artificially copper polluted soil. Int. Biodeterior. Biodegrad. 2017, 124, 223–232. [Google Scholar] [CrossRef] [Green Version]
- Cárdenas-Aguiar, E.; Ruiz, B.; Fuente, E.; Gascó, G.; Méndez, A. Improving mining soil phytoremediation with Sinapis alba by addition of hydrochars and biochar from manure wastes. Waste Biomass Valoriz. 2020. [Google Scholar] [CrossRef]
- García, C.; Hernández, T. Técnicas de Análisis de Parámetros Bioquímicos en Suelos: Medida de Actividades Enzimáticas y Biomasa Microbiana; Ediciones Mundi-Prensa: Madrid, Spain, 2003; p. 371. [Google Scholar]
- Paz-Ferreiro, J.; Gascó, G.; Gutiérrez, B.; Méndez, A. Soil biochemical activities and the geometric mean of enzyme activities after application of sewage sludge and sewage sludge biochar to soil. Biol. Fertil. Soils 2012, 48, 511–517. [Google Scholar] [CrossRef]
- Vance, E.D.; Brookes, P.C.; Jenkinson, D.J. An extraction method for measuring soil microbial biomass carbon. Soil Biol. Biochem. 1987, 19, 703–707. [Google Scholar] [CrossRef]
- Camiña, F.; Trasar-Cepeda, C.; Gil-Sotres, F.; Leirós, M.C. Measurement of dehydrogenase activity in acid soils rich in organic matter. Soil Biol. Biochem. 1998, 30, 1005–1011. [Google Scholar] [CrossRef]
- Consejería de Medio Ambiente y Ordenación del territorio de Andalucía. Decreto 18/2015, de 27 de Enero, por el que se Aprueba el Reglamento que Regula el Régimen Aplicable a los Suelos Contaminados; BOJA: Andalusia, Spain, 2015; Volume 38, pp. 28–65. [Google Scholar]
- Boente, C.; Martín-Méndez, I.; Bel-Lan, A.; Gallego, J.R. A novel and synergistic geostatistical approach to identify sources and cores of Potentially Toxic Elements in soils: An application in the region of Cantabria (Northern Spain). J. Geochem. Explor. 2020, 208, 106397. [Google Scholar] [CrossRef]
- Kabata-Pendias, A. Trace Elements in Soils and Plants, 3rd ed.; CRC Press: Boca Raton, FL, USA, 2001; p. 403. [Google Scholar]
- Cárdenas-Aguiar, E.; Gascó, G.; Paz-Ferreiro, J.; Méndez, A. Thermogravimetric analysis and carbon stability of chars produced from slow pyrolysis and hydrothermal carbonization of manure waste. J. Anal. Appl. Pyrol. 2019, 140, 3434–3443. [Google Scholar] [CrossRef] [Green Version]
- Domingues, R.R.; Trugilho, P.F.; Silva, C.A.; De Melo, I.C.N.A.; Melo, L.C.A.; Magriotis, Z.M.; Sánchez-Monedero, M.A. Properties of biochar derived from wood and high-nutrient biomasses with the aim of agronomic and environmental benefits. PLoS ONE 2017, 12, 1–19. [Google Scholar] [CrossRef] [PubMed] [Green Version]
- Li, H.; Dong, X.; da Silva, E.B.; de Oliveira, L.M.; Chen, Y.; Ma, L.Q. Mechanisms of metal sorption by biochars: Biochar characteristics and modifications. Chemosphere 2017, 178, 466–478. [Google Scholar] [CrossRef]
- Espinoza, L.; Slaton, N.A.; Mozaffari, M. Understanding the Numbers on Your Soil Test Report. FSA2118; University of Arkansas: Fayetteville, NC, USA, 2012. [Google Scholar]
- Cantrell, K.B.; Hunt, P.G.; Uchimiya, M.; Novak, J.M.; Ro, K.S. Impact of pyrolysis temperature and manure source on physicochemical characteristics of biochar. Bioresour. Technol. 2012, 107, 419–428. [Google Scholar] [CrossRef]
- Adhikari, S.; Gascó, G.; Méndez, A.; Surapaneni, A.; Jegatheesan, V.; Shah, K.; Paz-Ferreiro, J. Influence of pyrolysis parameters on phosphorus fractions of biosolids derived biochar. Sci. Total. Environ. 2019, 695, 133846. [Google Scholar] [CrossRef] [PubMed]
- Paz-Ferreiro, J.; Nieto, A.; Méndez, A.; Askeland, M.P.J.; Gascó, G. Biochar from biosolids pyrolysis: A review. Int. J. Environ. Res. Public Health 2018, 15, 956. [Google Scholar] [CrossRef] [Green Version]
- Glaser, B.; Lehr, V.I. Biochar effects on phosphorus availability in agricultural soils: A meta-analysis. Sci. Rep. 2019, 9, 9338. [Google Scholar] [CrossRef] [Green Version]
- Wang, Y.T.; Zhang, T.Q.; Halloran, I.P.O.; Hu, Q.C.; Tan, C.S.; Speranzini, D.; Macdonald, I.; Patterson, G. Agronomic and environmental soil phosphorus tests for predicting potential phosphorus loss from Ontario soils. Geoderma 2015, 242, 51–58. [Google Scholar] [CrossRef]
- Yang, Y.; Meehan, B.; Shah, K.; Surapaneni, A.; Hughes, J.; Fouché, L.; Paz-Ferreiro, J. Physicochemical properties of biochars produced from biosolids in Victoria, Australia. Int. J. Environ. Res. Public Health 2018, 15, 1459. [Google Scholar] [CrossRef] [Green Version]
- Heckrath, G.; Brookes, P.C.; Poulton, P.R.; Goulding, K.W.T. Phosphorus leaching from soils containing different phosphorus concentrations in the broadbalk experiment. J. Environ. Qual. 1995, 24, 904–910. [Google Scholar] [CrossRef]
- Horta, C. The Olsen P method as an agronomic and environmental test for predicting phosphate release from acid soils. Nutr. Cycl. Agroecosyst. 2007, 77, 283–292. [Google Scholar] [CrossRef]
- Xu, Y.; Fang, Z. Advances on remediation of heavy metal in the soil by biochar. J. Environ. Eng. 2015, 33, 156–159. [Google Scholar]
- Paz-Ferreiro, J.; Lu, H.; Fu, S.; Méndez, A.; Gascó, G. Use of phytoremediation and biochar to remediate heavy metal polluted soils: A review. Solid Earth 2014, 5, 65–75. [Google Scholar] [CrossRef] [Green Version]
- Baltazar, C.; Igarashi, T.; Villacorte-tabelin, M.; Park, I.; Opiso, E.M. Arsenic, selenium, boron, lead, cadmium, copper and zinc in naturally contaminated rocks: A review of their sources, modes of enrichment, mechanisms of release and mitigation strategies. Sci. Total Environ. 2018, 645, 1522–1553. [Google Scholar]
- Beesley, L.; Marmiroli, M. The immobilisation and retention of soluble arsenic, cadmium and zinc by biochar. Environ. Pollut. 2011, 159, 474–480. [Google Scholar] [CrossRef]
- Houben, D.; Evrard, L.; Sonnet, P. Beneficial effects of biochar application to contaminated soils on the bioavailability of Cd, Pb and Zn and the biomass production of rapeseed (Brassica napus L.). Biomass Bioenerg. 2013, 57, 196–204. [Google Scholar] [CrossRef]
- Mesquita, M.E.; Silva, J.M.V.E.; Branco, M.A.C.; Sequeira, E.M. Copper and zinc competitive adsorption: Desorption in calcareous soils. Arid Soil Res. Rehabil. 2000, 14, 27–41. [Google Scholar] [CrossRef]
- Al-Wabel, M.I.; Usman, A.R.A.; Al-Farraj, A.S.; Ok, Y.S.; Abduljabbar, A.; Al-Faraj, A.I.; Sallam, A.S. Correction to: Date palm waste biochars alter a soil respiration, microbial biomass carbon, and heavy metal mobility in contaminated mined soil. Environ. Geochem. Health. 2009, 41, 1809. [Google Scholar] [CrossRef] [Green Version]
- Wardle, D.A.; Ghani, A. A critique of the microbial metabolic quotient (qCO2) as a bioindicator of disturbance and ecosystem development. Soil Biol. Biochem. 1995, 27, 1601–1610. [Google Scholar] [CrossRef]
- Odum, E.P. Trends Expected in Stressed Ecosystems. BioScience 1985, 35, 419–422. [Google Scholar] [CrossRef]
- Zheng, J.; Chen, J.; Pan, G.; Liu, X.; Zhang, X.; Li, L.; Bian, R.; Cheng, K.; Zheng, J. Biochar decreased microbial metabolic quotient and shifted community composition four years after a single incorporation in a slightly acid rice paddy from southwest China. Sci. Total Environ. 2016, 15, 206–217. [Google Scholar] [CrossRef] [PubMed]
- Lu, H.; Li, Z.; Fu, S.; Méndez, A.; Gascó, G.; Paz-Ferreiro, J. Combining phytoextraction and biochar addition improves soil biochemical properties in a soil contaminated with Cd. Chemosphere 2015, 119, 209–216. [Google Scholar] [CrossRef] [PubMed]
- Mierzwa-Hersztek, M.; Gondek, K.; Baran, A. Effect of poultry litter biochar on soil enzymatic activity, ecotoxicity and plant growth. Appl. Soil Ecol. 2016, 105, 144–150. [Google Scholar] [CrossRef]
- Netherway, P.; Gascó, G.; Méndez, A.; Surapaneni, A.; Reichman, S.; Shah, K.; Paz-Ferreiro, J. Using phosphorus-rich biochars to remediate lead-contaminated soil: Influence on soil enzymes and extractable P. Agronomy 2020, 10, 454. [Google Scholar] [CrossRef] [Green Version]


| PL | BPL450 | BPL600 | RM | BRM450 | BRM600 | |
|---|---|---|---|---|---|---|
| pH | 9.01a 1 | 10.07b | 10.73c | 9.14a | 10.59c | 10.88c |
| EC (dS·m−1) | 0.44ab | 0.47bc | 0.50c | 0.36a | 0.40a | 0.47bc |
| C-oxi (%) | 12.9c | 11.4b | 4.30a | 25.8d | 11.6bc | 4.99a |
| SOC (%) | 1.14d | 0.36b | 0.10a | 0.57c | 0.15a | 0.04a |
| CEC (mmol·kg−1) | 89a | 123b | 131c | 139d | 151e | 132c |
| P-Olsen (mg·kg−1) | 3214c | 2427b | 2123b | 3296c | 959a | 751a |
| K (kg·kg−1) | 4.87a | 19.26c | 20.73d | 7.01b | 19.31c | 18.72c |
| Ash (%) | 48.26 | 61.02 | 60.23 | 41.69 | 54.44 | 62.74 |
| C (%) | 33.79 | 32.71 | 25.27 | 45.67 | 29.13 | 24.99 |
| H (%) | 4.55 | 2.70 | 0.84 | 6.17 | 1.76 | 1.22 |
| N (%) | 2.06 | 2.19 | 1.20 | 4.01 | 1.50 | 0.38 |
| O (%) | 10.87 | 0.91 | 12.10 | 1.69 | 12.79 | 10.31 |
| S (%) | 0.47 | 0.47 | 0.36 | 0.77 | 0.38 | 0.36 |
| H/C ratio (%) | 1.62 | 0.99 | 0.40 | 1.62 | 0.73 | 0.64 |
| O/C ratio (%) | 0.24 | 0.02 | 0.36 | 0.03 | 0.33 | 0.31 |
| BET surf. area (m2·g−1) | - | 4.28 | 7.03 | - | 5.68 | 35.97 |
| Adsorp. average pore width (Å) | - | 245.56 | 199 | - | 166.23 | 104.81 |
| Amicro (m2·g−1) | - | 1.14 | 2.37 | - | 1.79 | 4.20 |
| Vmicro (cm3·g−1) | - | 0.03 | 0.03 | - | 0.02 | 0.09 |
| Vmeso (cm3·g−1) | - | 0.05 | 0.07 | - | 0.04 | 0.07 |
| Vmacro (cm3·g−1) | - | 1.25 | 1.03 | - | 1.65 | 2.12 |
| Porosity (%) | - | 66.19 | 63.95 | - | 75.25 | 72.72 |
| Cd (mg·kg−1) | 0.03a | 0.24c | 0.33d | 0.06b | 0.36e | 0.35de |
| Cr (mg·kg−1) | 2.01b | 4.48c | 4.72c | 0.97a | 8.22d | 8.33d |
| Cu (mg·kg−1) | 33.9a | 53.79c | 65.7d | 44.3b | 73.7e | 61.1d |
| Fe (mg·kg−1) | 2833a | 6763c | 8715e | 5657b | 7991d | 14,916f |
| Ni (mg·kg−1) | 2.85a | 4.63c | 5.58d | 4.34b | 6.66e | 7.93f |
| Pb (mg·kg−1) | 7.43a | 15.4d | 13.6c | 7.95a | 9.59b | 11.0b |
| Zn (mg·kg−1) | 468a | 546b | 701d | 623c | 870f | 753e |
| Z1 | Z2 | Z3 | P1 | P2 | P3 | P4 | M1 | M2 | M3 | |
|---|---|---|---|---|---|---|---|---|---|---|
| pH | 4.68c 1 | 4.34b | 3.63a | 8.16i | 8.09h | 7.90g | 7.89g | 5.67d | 5.84e | 7.30f |
| EC (dS·m−1) | 0.06a | 0.09a | 0.22bc | 0.19b | 0.35d | 1.49f | 2.24g | 0.49e | 0.23c | 0.25c |
| C-oxi (%) | 1.34c | 0.22a | 0.10a | 0.78b | 0.92b | 0.39a | 0.25a | 1.73d | 5.38e | 1.83d |
| CEC (mmol·kg−1) | 11.7e | 3.64a | 2.88a | 23.9f | 12.2e | 9.90c | 10.6cd | 10.2c | 7.10b | 11.3de |
| P-Olsen (mg·kg−1) | 1307bc | 1949c | 988ab | 10001e | 6632d | 424a | 722ab | 1915c | 706ab | 961ab |
| K (g·kg−1) | 0.12a | 0.10a | 0.09a | 5.05c | 4.97c | 6.13d | 8.33g | 4.34b | 7.21f | 6.93e |
| Texture | Loamy | Loamy | Sandy loam | Sandy loam | Sandy clay loam | Sandy clay loam | Sandy loam | Sandy loam | Loamy sand | Sandy loam |
| Z1 | Z2 | Z3 | P1 | P2 | P3 | P4 | Ref. Values 1 | M1 | M2 | M3 | Ref. Values 2 | Critical Values 5 | |
|---|---|---|---|---|---|---|---|---|---|---|---|---|---|
| (dry mg·kg−1, except Fe in dry g·kg−1) | |||||||||||||
| Cd | 0.5 | 0.5 | 0.5 | 5.84 | 20.1 | 8.62 | 16.4 | 750 | 12.7 | 0.99 | 1.81 | 1.0 | 3–8 |
| Cr | 97.3 | 2.56 | 2.42 | 61.5 | 39.2 | 50.9 | 43.2 | 10,000 3 100 4 | 72.0 | 43.8 | 44.4 | 118.0 | 75–100 |
| Cu | 183 | 374 | 248 | 34.3 | 207 | 35.1 | 47.0 | 10,000 | 13.6 | 11.2 | 9.12 | 34.0 | 60–125 |
| Fe | 58.9 | 91.6 | 98.0 | 113 | 175 | 153 | 185 | - | 201 | 26.6 | 43.1 | - | - |
| Ni | 27.5 | 2.47 | 2.13 | 44.8 | 39.9 | 29.5 | 31.4 | 10,000 | 43.1 | 8.80 | 27.2 | 52.0 | 100 |
| Pb | 104 | 296 | 422 | 5072 | 2848 | 2321 | 2770 | 2750 | 3295 | 82.2 | 174 | 58.0 | 100–400 |
| Zn | 130 | 219 | 81.4 | 2575 | 8573 | 3580 | 6373 | 10,000 | 11,035 | 180 | 758 | 272.0 | 70–400 |
| As | 65.5 | 236 | 528 | 144 | 1183 | 234 | 530 | 40 | 110 | 19.3 | 44.4 | 38.0 | 20–50 |
| pH | EC | Cr | Cu | Ni | Fe | Zn | Cd | Pb | |
|---|---|---|---|---|---|---|---|---|---|
| dS·m−1 | mg·kg−1 | kg·kg−1 | mg·kg−1 | ||||||
| Z1 | 5.81a | 0.16a | 0.56b | 0.41b | 6.10c | 5.22d | 1.46b | 0.07a | 6.89d |
| Z1 + BPL450 | 8.44d | 2.23c | 0.35a | 0.50c | 3.81a | 1.84a | 0.32a | 0.07a | 2.78a |
| Z1 + BPL600 | 8.46d | 2.24c | 0.31a | 0.65d | 3.74a | 3.48c | 0.32a | 0.06b | 2.28ab |
| Z1 + BRM450 | 8.07b | 1.61b | 0.73c | 0.61d | 3.98ab | 2.61b | 0.28a | 0.06b | 3.62bc |
| Z1 + BRM600 | 8.21c | 1.65b | 0.70c | 0.15a | 4.66b | 2.15ab | 0.28a | 0.07a | 4.17c |
| Z2 | 5.10a | 0.09a | 1.07d | 0.54b | 0.54c | 6.84d | 1.37c | 0.07a | 6.35c |
| Z2 + BPL450 | 9.43e | 2.29c | 0.23a | 0.21a | 0.29a | 3.10c | 0.13a | 0.06b | 5.93b |
| Z2 + BPL600 | 9.18d | 2.50d | 0.70c | 0.18a | 0.40b | 1.96a | 0.28b | 0.06b | 5.38b |
| Z2 + BRM450 | 7.73b | 2.05b | 0.50b | 0.24a | 0.29a | 2.16ab | 0.16a | 0.05b | 3.75a |
| Z2 + BRM600 | 7.97c | 2.25c | 1.08d | 0.21a | 0.34a | 2.70bc | 0.18a | 0.05b | 4.08a |
| Z3 | 3.86a 1 | 0.24a | 1.51d | 0.45b | 0.17e | 0.54a | 0.77d | 0.07a | 5.25d |
| Z3 + BPL450 | 7.29b | 3.49c | 0.78b | 0.15a | 0.46b | 0.34b | 0.22b | 0.05b | 3.57a |
| Z3 + BPL600 | 7.66c | 3.61c | 0.46a | 0.18a | 0.63c | 0.31b | 0.14a | 0.05b | 4.80c |
| Z3 + BRM450 | 8.13d | 2.94b | 0.79b | 0.11a | 0.01a | 0.41b | 0.40c | 0.06b | 4.11ab |
| Z3 + BRM600 | 8.08e | 2.75b | 1.20c | 0.15a | 0.85d | 0.35b | 0.43c | 0.06b | 4.32bc |
| pH | EC | Cr | Cu | Ni | Fe | Zn | Cd | Pb | |
|---|---|---|---|---|---|---|---|---|---|
| dS·m−1 | mg·kg−1 | kg·kg−1 | mg·kg−1 | ||||||
| P1 | 8.42a 1 | 0.37a | 0.24a | 0.38a | 1.22d | 11.69b | 0.21a | 0.83a | 14.24b |
| P1 + BPL450 | 8.63b | 2.21c | 0.11a | 0.38a | 1.67e | 15.46c | 0.25a | <0.01b | 12.09ab |
| P1 + BPL600 | 8.82c | 2.35c | 0.42b | 0.32a | 1.07c | 7.29a | 0.51b | <0.01b | 5.72a |
| P1 + BRM450 | 8.63b | 2.00bc | 0.10a | 0.30a | 0.15a | 9.90b | 0.18a | <0.01b | 5.84a |
| P1 + BRM600 | 8.72d | 1.46b | 0.08a | 0.42a | 0.91b | 14.41c | 0.28ab | <0.01b | 6.07a |
| P2 | 5.06a | 1.21a | <0.01b | 0.30ab | 0.59c | 8.18a | 0.37ab | 2.84c | 6.49a |
| P2 + BPL450 | 7.50b | 3.43c | 0.27a | 0.22a | 1.60e | 8.04a | 0.86c | <0.01b | 4.76a |
| P2 + BPL600 | 7.86c | 2.93bc | <0.01b | 0.46bc | 0.84d | 8.40a | 0.26a | 0.75ab | 5.66a |
| P2 + BRM450 | 7.76bc | 2.42b | <0.01b | 0.49c | 0.32b | 4.79a | 0.56b | 0.49a | 5.22a |
| P2 + BRM600 | 7.60bc | 2.57b | <0.01b | 0.46bc | 0.01a | 12.53b | 0.30a | 1.50b | 5.67a |
| P3 | 7.69a | 2.28a | <0.01a | 0.14ab | <0.01c | 1.74a | 0.45c | 0.79a | 4.74ab |
| P3 + BPL450 | 8.65d | 3.95b | <0.01a | 0.23bc | <0.01c | 19.01c | 0.41c | 1.53ab | 8.23c |
| P3 + BPL600 | 8.19c | 5.21b | <0.01a | 0.10a | 1.29b | 6.00b | 0.06a | 1.54ab | 9.74c |
| P3 + BRM450 | 7.91ab | 3.70ab | <0.01a | 0.27c | 0.99a | 17.20c | 0.15b | 2.27b | 3.55ab |
| P3 + BRM600 | 8.03bc | 3.92b | <0.01a | 0.29c | 0.81a | 4.98ab | 0.10a | 1.30ab | 1.29a |
| P4 | 7.57a | 3.10a | <0.01a | 0.24b | 1.24bc | 8.28a | 0.16a | 0.47a | 3.62b |
| P4 + BPL450 | 8.02b | 5.41c | <0.01a | 0.20ab | 1.47c | 9.00ab | 0.36b | 1.18bc | 8.17c |
| P4 + BPL600 | 8.22bc | 5.36c | <0.01a | 0.18a | 0.19a | 7.50a | 0.30b | 0.42a | <0.01d |
| P4 + BRM450 | 8.59c | 4.48bc | <0.01a | 0.38c | 0.08a | 14.91b | 0.56c | 1.45c | 2.50a |
| P4 + BRM600 | 8.10b | 4.10b | <0.01a | 0.28b | 0.96b | 9.69ab | 0.24a | 0.81ab | <0.01d |
| pH | EC | Cr | Cu | Ni | Fe | Zn | Cd | Pb | |
|---|---|---|---|---|---|---|---|---|---|
| dS·m−1 | mg·kg−1 | kg·kg−1 | mg·kg−1 | ||||||
| M1 | 7.91a 1 | 0.90a | 0.20a | 0.08ab | 2.98a | 4.20c | 1.97b | 4.93c | 8.35b |
| M1 + BPL450 | 7.96a | 3.11b | 0.85d | 0.04a | 3.12a | 2.09b | 0.28a | 1.46a | 6.85b |
| M1 + BPL600 | 7.59a | 3.14b | 0.96d | 0.14ab | 6.56b | 1.99b | 0.43a | 1.10a | 5.19a |
| M1 + BRM450 | 7.49a | 3.05b | 0.54c | 0.16b | 7.37b | 1.43a | 0.30a | 2.94b | 16.57d |
| M1 + BRM600 | 7.43a | 2.43b | 0.40b | 0.15b | 5.65b | 1.05a | 0.55a | 2.50ab | 14.38c |
| M2 | 8.23a | 0.40a | 0.31a | 0.08a | 5.45ab | 3.81b | 3.37b | 0.40a | 6.43b |
| M2 + BPL450 | 9.30e | 1.80ab | 0.37ab | 0.16b | 5.61ab | 2.74ab | 0.20a | 0.37a | 6.34b |
| M2 + BPL600 | 8.88b | 1,72ab | 0.39ab | 0.38d | 3.43a | 1.71a | 0.50a | 0.28ab | 4.00a |
| M2 + BRM450 | 9.04c | 2.13b | 0.61c | 0.19b | 4.39a | 1.58a | 0.16a | 0.23b | 15.73c |
| M2 + BRM600 | 9.18d | 1.73ab | 0.47b | 0.26c | 7.23b | 3.56b | 0.40a | 0.34a | 15.33c |
| M3 | 7.24a | 0.53a | 0.31a | 0.12b | 4.87a | 1.55bc | 0.41a | 0.33a | 7.10b |
| M3 + BPL450 | 8.57b | 2.44d | 0.37a | 0.37c | 3.78a | 1.10ab | 0.32a | 0.26a | 5.95ab |
| M3 + BPL600 | 8.05ab | 2.70e | 0.39a | 0.09ab | 6.75b | 0.86a | 0.35a | 0.13b | 7.63b |
| M3 + BRM450 | 7.71ab | 1.58b | 0.61b | 0.05a | 8.80c | 1.64c | 0.30a | 0.21a | 4.86a |
| M3 + BRM600 | 8.67b | 1.73c | 0.43a | 0.07ab | 7.34b | 2.70d | 0.27a | 0.27a | 7.64b |
© 2020 by the authors. Licensee MDPI, Basel, Switzerland. This article is an open access article distributed under the terms and conditions of the Creative Commons Attribution (CC BY) license (http://creativecommons.org/licenses/by/4.0/).
Share and Cite
Álvarez, M.L.; Méndez, A.; Paz-Ferreiro, J.; Gascó, G. Effects of Manure Waste Biochars in Mining Soils. Appl. Sci. 2020, 10, 3393. https://doi.org/10.3390/app10103393
Álvarez ML, Méndez A, Paz-Ferreiro J, Gascó G. Effects of Manure Waste Biochars in Mining Soils. Applied Sciences. 2020; 10(10):3393. https://doi.org/10.3390/app10103393
Chicago/Turabian StyleÁlvarez, María Luisa, Ana Méndez, Jorge Paz-Ferreiro, and Gabriel Gascó. 2020. "Effects of Manure Waste Biochars in Mining Soils" Applied Sciences 10, no. 10: 3393. https://doi.org/10.3390/app10103393
APA StyleÁlvarez, M. L., Méndez, A., Paz-Ferreiro, J., & Gascó, G. (2020). Effects of Manure Waste Biochars in Mining Soils. Applied Sciences, 10(10), 3393. https://doi.org/10.3390/app10103393