Article

Self-Mixing Interferometry-Based Micro Flow Cytometry System for Label-Free Cells Classification

1
Institute of Laser Engineering, Beijing University of Technology, Beijing 100124, China
2
Key Laboratory of Trans-Scale Laser Manufacturing Technology (Beijing University of Technology), Ministry of Education, Beijing 100124, China
3
Beijing Key Laboratory of Environmental & Viral Oncology, College of Life Science & Bioengineering, Beijing University of Technology, Beijing 100124, China
4
LAAS-CNRS, Université de Toulouse, CNRS, INP, 31062 Toulouse, France
*
Author to whom correspondence should be addressed.
Appl. Sci. 2020, 10(2), 478; https://doi.org/10.3390/app10020478
Submission received: 16 December 2019 / Revised: 7 January 2020 / Accepted: 8 January 2020 / Published: 9 January 2020
(This article belongs to the Section Applied Physics General)

Abstract

:
In this paper, we present a novel optical microfluidic cytometry scheme for label-free detection of cells that is based on the self-mixing interferometry (SMI) technique. This device enables simple, fast and accurate detection of the individual cell characteristics and efficient cell type classification. We also propose a novel parameter to classify the cell or particle size. Artificial polystyrene beads and human living cells were measured using this system, and the SMI signal properties were statistically evaluated. The capability of the proposed cytometer for cell type discrimination and size classification has been validated by the measurement results. Our study can provide a very simple technique for cell enumeration and classification without any extra devices such as high-speed camera, photomultiplier and spectrometer. Moreover, the fluorescence staining operation which is necessary in traditional flow cytometry methods is not required either in our system.

1. Introduction

With the development of microfluidic and optoelectronics techniques, flow cytometry (FC) has become a fundamental tool for the characterization and the analysis of cells or other micro-scale biological entities. This technique has been widely used in the life science, clinical diagnosis and biotechnology for more than 50 years [1,2]. Traditional cytometers retrieve the forward/side scattering properties of particles and/or the fluorescence emission intensity, thus requiring various devices such as a photomultiplier (PMT), multiple-wavelength light sources and spectroscopy. As a consequence, these systems are often bulky and mechanically complicated. Furthermore, the conventional FC techniques need tricky fluorescence labeling pretreatment step with specific expensive dyes, and the valuable cell samples can be destroyed. Therefore, a label-free cell assay undertaking non-invasive and fast identification of cells is of major interest.
So far, there are three well-established methods mainly used as label-free microfluidic FC system.
The first technique is optical flow cytometry (OFC) which is the most common non-intrusive cell interrogation method. Multiple implementations have been proposed such as light-scattering imaging [3], reflectance confocal microscopy [4], holographic microscopy [5,6] and 2D scattering pattern imaging [7], diffraction phase microscopy [8], common-path interferometry [9] and single-shot color quantitative phase imaging [10] that have been demonstrated to operate label-free single-cell characterization.
The second technique is the impedance-based cytometry (IFC) technique. By measuring the impedance change between two microelectrodes embedded inside the channel when the cells pass through the measurement volume, the dielectric properties of the cells and the internal components can be retrieved. IFC devices have various advantages over others, for example, they are self-contained, highly integrated in the micro channel and easy to operate [11,12,13].
The third label-free cytometry technique is photoacoustic cytometry (PAFC) [14]. The principle of PAFC is based on photoacoustic effect when the tissue absorbs a short laser pulse sequence, the photon energy transforms it into heat and then the ultrasonic acoustic waves are generated due to thermo-elastic effect. The time-resolved acquisitions of the acoustic waves are performed through an ultrasound transducer, and the properties of the cells can be extracted from the ultrasound signal analysis. The most important advantage of PAFC is in vivo measurement capability such as melanoma detection in skin [15] or red blood cell aggregate in vessels and even cancer cells in the bone tissue [16].
In spite of the outstanding performance and vast application domains of these three label-free FC techniques, there are still some limitations in practice: (1) expensive devices are required, such as high-speed camera for instantaneous imaging, and ultrasound transducer for acoustic wave detection; (2) most of these systems are mechanically complex, and difficult to integrate in the microfluidic chip.
To solve the shortcomings mentioned, a simple, commercial, accurate and reliable single-cell detection method is still strongly desired. Self-mixing interferometry (SMI) as a new laser interferometry technique has been widely used in various metrology applications [17,18,19]. Considering the intrinsic advantages of SMI, such as compacity, low-consumption, self-alignment, and the same half-wavelength resolution as compared with the traditional two-path interferometry, SMI is adaptable for operation as a fully integrated micro-nano particle-sensing technique in microfluidic systems. However, to our knowledge, most of the existing related works have described the collective properties of a population of samples. One major SMI-based micro particle characterization research aspect is particle size distribution estimation by analyzing the signal frequency power spectrum subjected to the dynamic scattering light from the particle population [20,21,22,23]. Another perspective is developing the device or data processing algorithm for particle flowing velocity spatial distribution profile via Doppler frequency spectrometer [24,25,26,27,28]. Neither focus on the individual particle properties, and to date only a few works have reported the characteristics of a single object. Moreira et al. designed a single particle detection system based on SMI technique for the first time [29]. More recently, Herbert et al. have developed a numerical simulation model for an SMI-based particle-sensing technique [30]. In 2019, we employed Hilbert transform in SMI detection to measure the micro particle size, by counting the interferometric fringe number, where we observed that a 300 nm resolution can be approached [31]. So far, no relevant work has been reported in actual human living cells for clinical diagnosis or detection.
In this paper, for the first time, we propose an SMI-based optical flow cytometry system for single cell classification without fluorescence labeling. Based on the known self-mixing theory framework, we propose a model to describe the SMI burst signal properties that occurs while the cell passes through the laser beam. A custom-made optofluidic cytometer system was designed, and all the components—including the laser sensor, hydrodynamic focusing platform and signal processing—are described in detail. In order to investigate the reliability of our detection system, a series of experimental validations with both artificial beads and human living cells were performed and the results of a large number of individual particle/cell measurements are analyzed with a statistical approach.

2. Theory

When the individual micro particle or cell inside the channel flows through the laser beam volume, part of the scattered light re-enters the laser cavity. The interaction between the back-scattered light and the original light inside the cavity gives rise to a modulation of the laser output power. Meanwhile, due to the Doppler effect, the output power signal presents a spectral shift in the frequency domain, which depends on the flowing cell velocity.
In order to describe the self-mixing behavior in the presence of individual cell, we proposed a novel theoretical framework based on the well-known three-mirror model as shown in Figure 1 [32]. The entire system consists of two cavities: the first cavity is the laser cavity of length Lc between the two cavity mirrors (M1, M2) of reflectivity r1 and r2, respectively; and the other is the external cavity of length Lext from M2 to the cell; where rc is the electric field amplitude ratio of the scattered light from the cell re-entering the cavity over the original laser output.
The laser output power subjected to the self-mixing effect P(t) can be expressed as [25]:
P ( t ) = P 0 [ 1 + m cos ( 2 π f D · t ) ]
m = 4 r c ( 1 r 2 2 ) r 2 · τ p τ l
P0 is the laser initial output power without self-mixing effect, m is the modulation parameter which is critical for representing the modulation strength and the SMI signal level. Taking into consideration the cell dimension, rc is extremely low, thus the SMI operates generally in the weak feedback regime [25]. τp is the photon lifetime, τl is the round-trip time inside the laser cavity. When the cell crosses the laser emission area with a constant velocity V, a Doppler frequency shift fD is induced. The absolute value of the frequency shift can be expressed in the following form [33]:
f D = 2 V · sin θ λ
where θ is the incident angle, λ is the laser wavelength.
Considering a spheroid cell flowing through the laser beam over a period w as depicted in Figure 2, the amount of scattering light coupling into the cavity is at its maximum when the cell center is on the beam central axis (Figure 2b). Here, the value of the modulation index m reaches the maximum as well, resulting in the maximal amplitude of signal P(t). In order to describe the amplitude variation over the passage, we propose the following hypothesis: the laser irradiation profile obeys a Gaussian distribution, and the self-mixing interference is only generated when the cell enters the laser beam volume from point-in-time t0 to t0 + w, the SMI signal amplitude then varies as a Gaussian function [34]:
P ( t ) = P 0 [ 1 + m cos ( 2 π f D · t ) ] exp ( ( t t 0 ) 2 2 w 2 )
We can expect that the total amount of light re-entering the laser cavity will be impacted by the particle nature: for example it will be greater for a larger particle, or for a particle with a large refractive index difference with the carrying fluid. It can also be expected that the cell membrane nature, the surface roughness, or the intracellular contents influence the SMI signal parameters.

3. Experiment Setup and Material

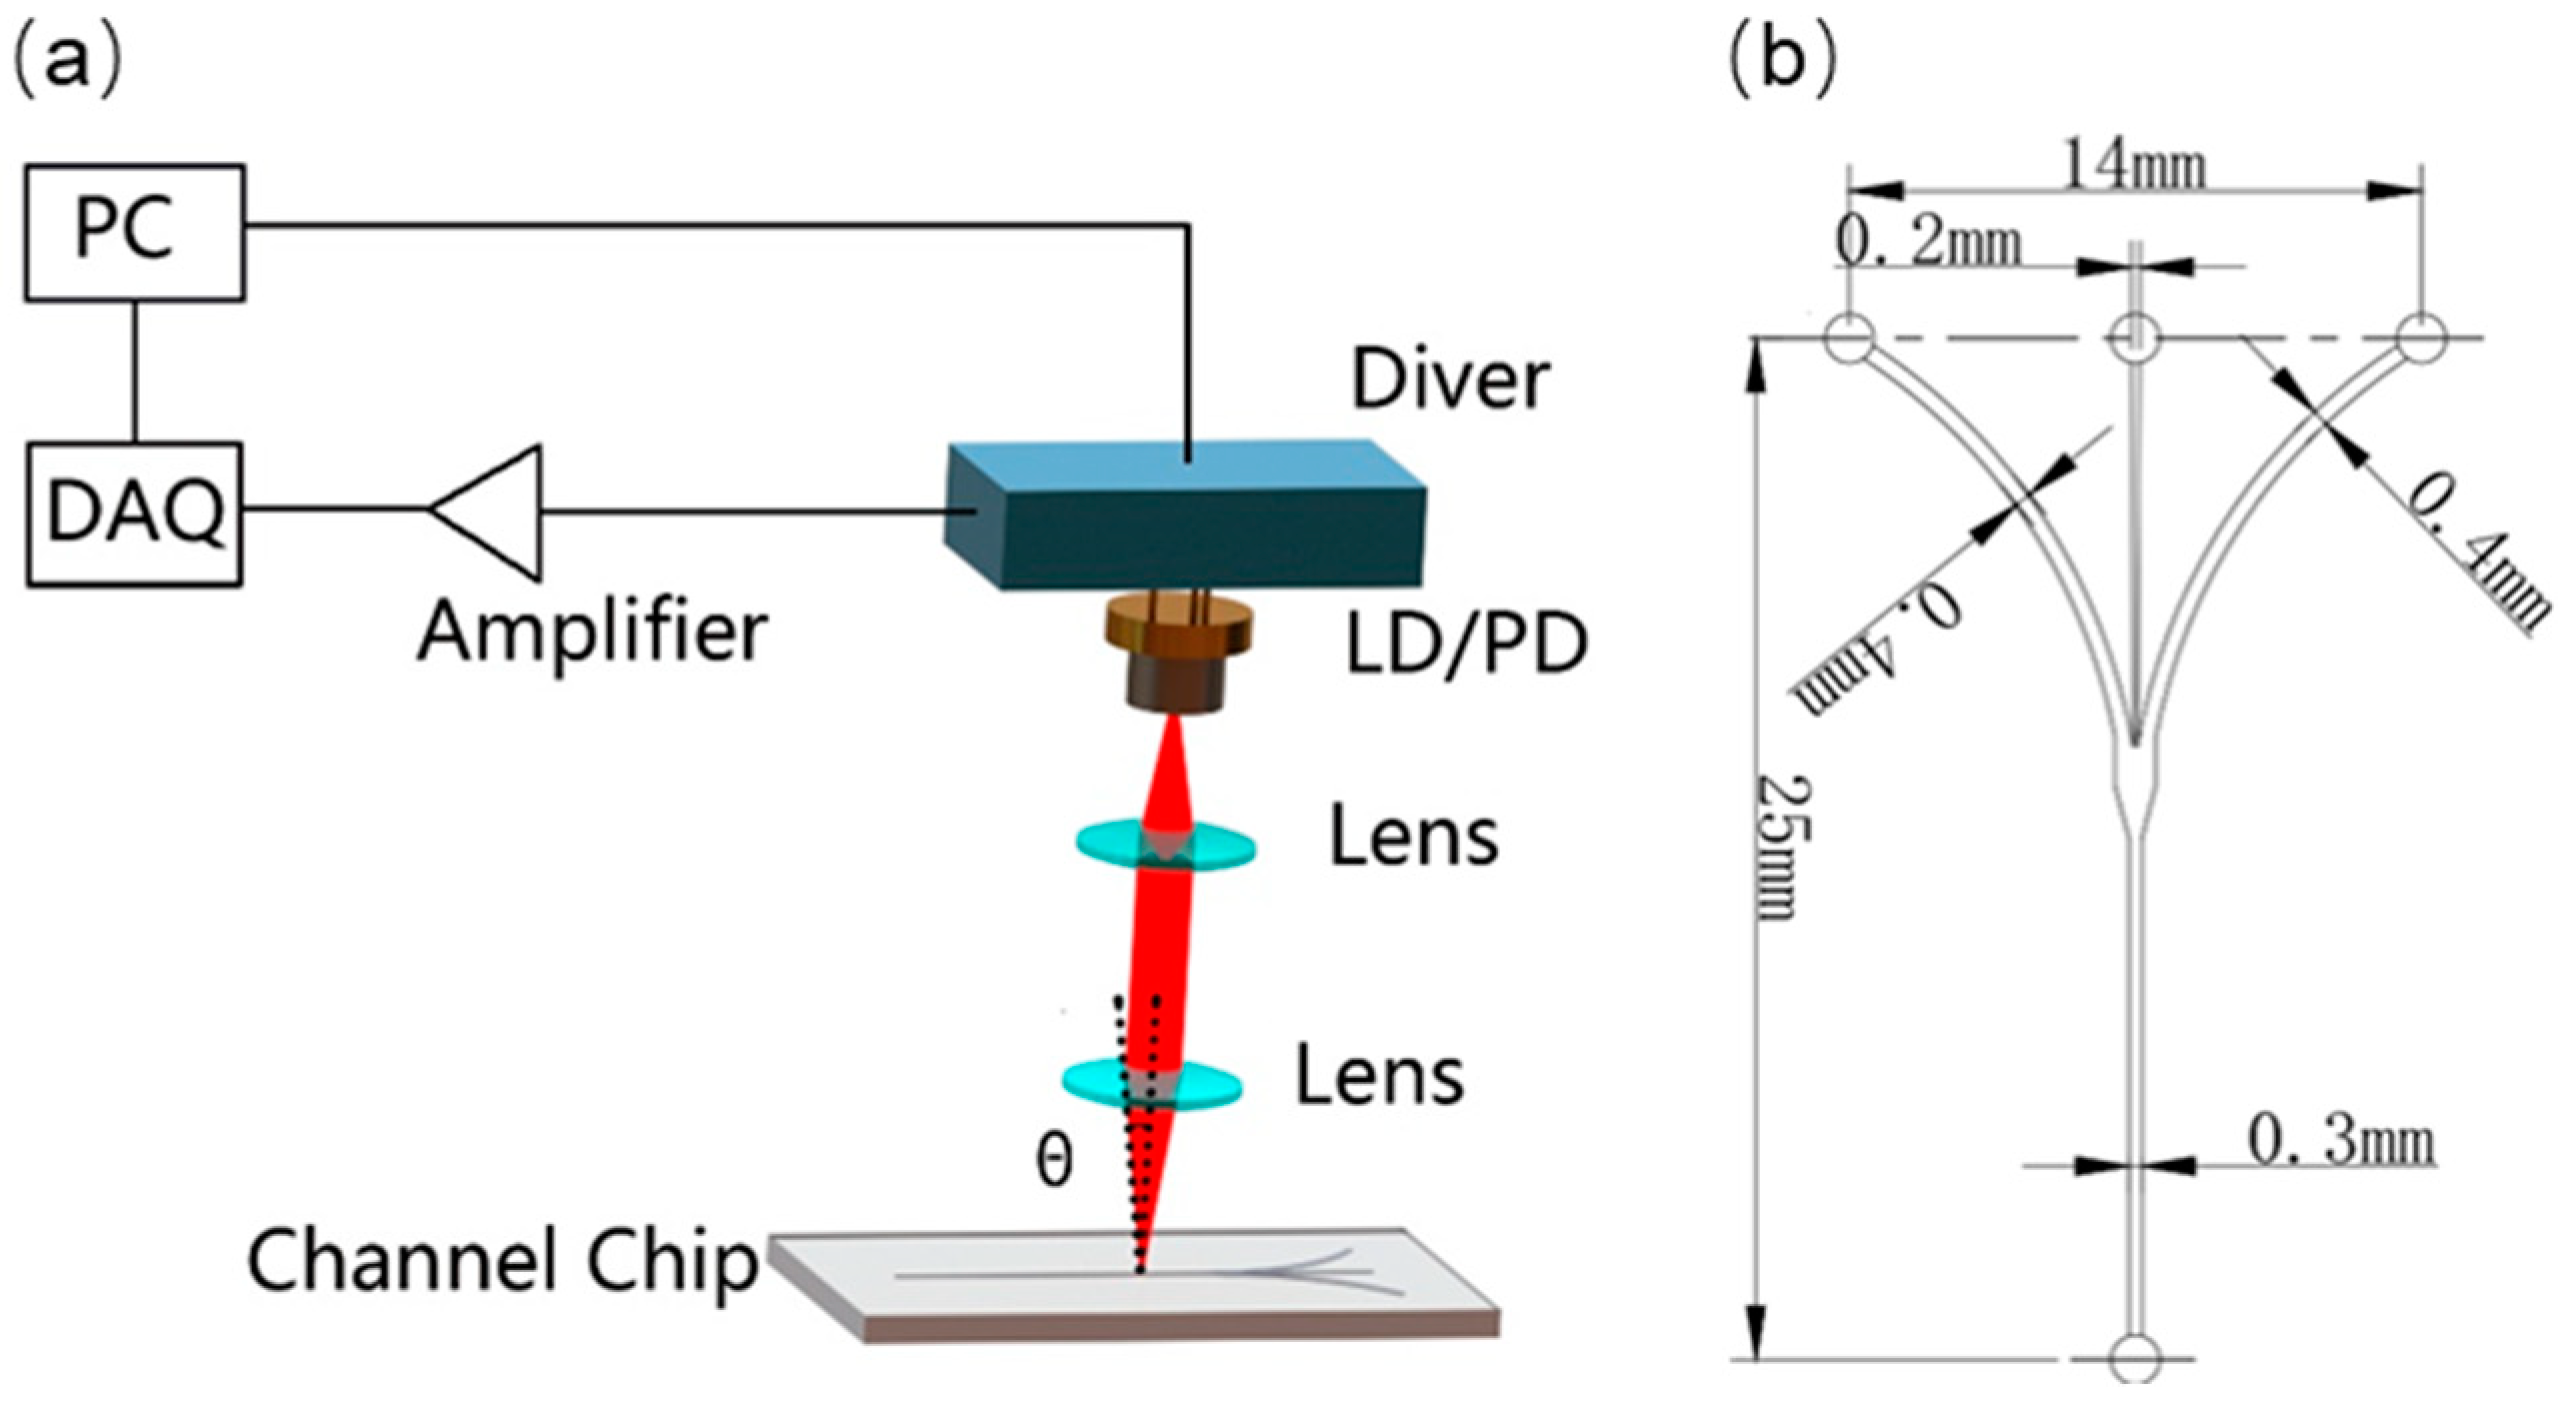
3.1. Laser Sensor and Microfluidic Chip

The entire optofluidic cytometry system is shown in Figure 3a. A commercial 1310 nm distributed feedback (DFB) laser diode (Allwave Lasers Device Inc., Xian, China) packaged with a monitoring photodiode was employed as the laser source and the sensor. The laser diode was supported by a DC power driver (Rigo Inc., Suzhou, China), and the initial output power was measured to be around 500 μW. The laser propagation axis realizes an angle of 82° with the flow direction (thus the incident angle with respect to the perpendicular to the chip plane is 8°). In order to obtain sufficient power density and thus a higher SMI signal level, the laser beam was tightly focused using a 1:1 doublet imaging system (C240TME-C, Thorlabs Inc., Newton, MA, USA) of 8 mm focal length. The laser sensor and the optical arrangement were mounted on a 3D stage (Zolix Inc., Beijing, China) for precise alignment. By moving the laser diode, the laser focal spot was positioned exactly at the channel center, and the focused laser spot size was calculated as 5 μm × 1 μm.
The SMI signal was acquired through the monitor photodiode current variation. Then, the photodiode current was amplified using a home-made trans-impedance amplification circuit for signal enhancement, meanwhile, the current signal was transformed into voltage. Afterward, the voltage signal was captured using a high-speed data acquisition card (NI-6361 USB, NI Inc., Austin, TX, USA) at 2 MHz sampling frequency. All the data processing operation was controlled by a custom-made LabVIEW routine.
As shown in Figure 3b, a homemade hydrodynamic channel was fabricated on polydimethylsiloxane (PDMS) by means of photolithography, and then thermally bonded on a glass substrate. To protect the living cell, the phosphate buffer saline (PBS) was employed as the solvent and the sheath liquid. The cell samples and the sheath liquids were injected into the channel by two high-precision string pumps. The sample fluid was focused into a narrow stream using two sheath fluids on both sides, thus ensuring the cells or particles enter the optical detection region one-by-one [35].
To achieve stable laminar flows for hydrodynamic focusing in the channel, 20–5–20 μL/min sheath/sample/sheath flow rates was set to maintain a small Reynolds number (Re < 2000) [36]. The core liquid width was measured to be around 30 μm, which was comparable with the maximum particle and cell diameters. Furthermore, such hydrodynamic focusing chip increases the detection throughput efficiently.

3.2. Particle Suspension Preparation and Cell Culture

In the current work, polystyrene sphere (PS) particles and two types of spheroid living cells were employed to investigate our system performance. Polystyrene sphere suspensions of 2 μm and 5 μm diameter (Zhongkeleiming, Beijing, China) at different concentrations were prepared by dilution and ultrasonication of the original PS aqueous solution with ultrapure water. The PS particles have good dimension uniformity (diameter coefficient of variation values was better than 3%). Two types of human living cells were also cultured and prepared elaborately for living cell characterizations. One type is the human breast cancer cell line (MCF7) of 15 μm average diameter and the other is the human embryonic kidney (293) of 11 μm average diameter, all the average dimension values are estimated from the Harvard BioNumbers database [37]. Both cells were obtained from the American Type Culture Collection (ATCC) and cultured in Dulbecco’s modified eagle medium (DMEM) supplemented with 10% fetal bovine serum (FBS), 1% penicillin / streptomycin, 1% glutamine, 10 ug/mL insulin and 1 mM sodium pyruvate. The Cells were maintained at 37 °C temperature and 5% humidified CO2 atmosphere.

4. Results and Discussion

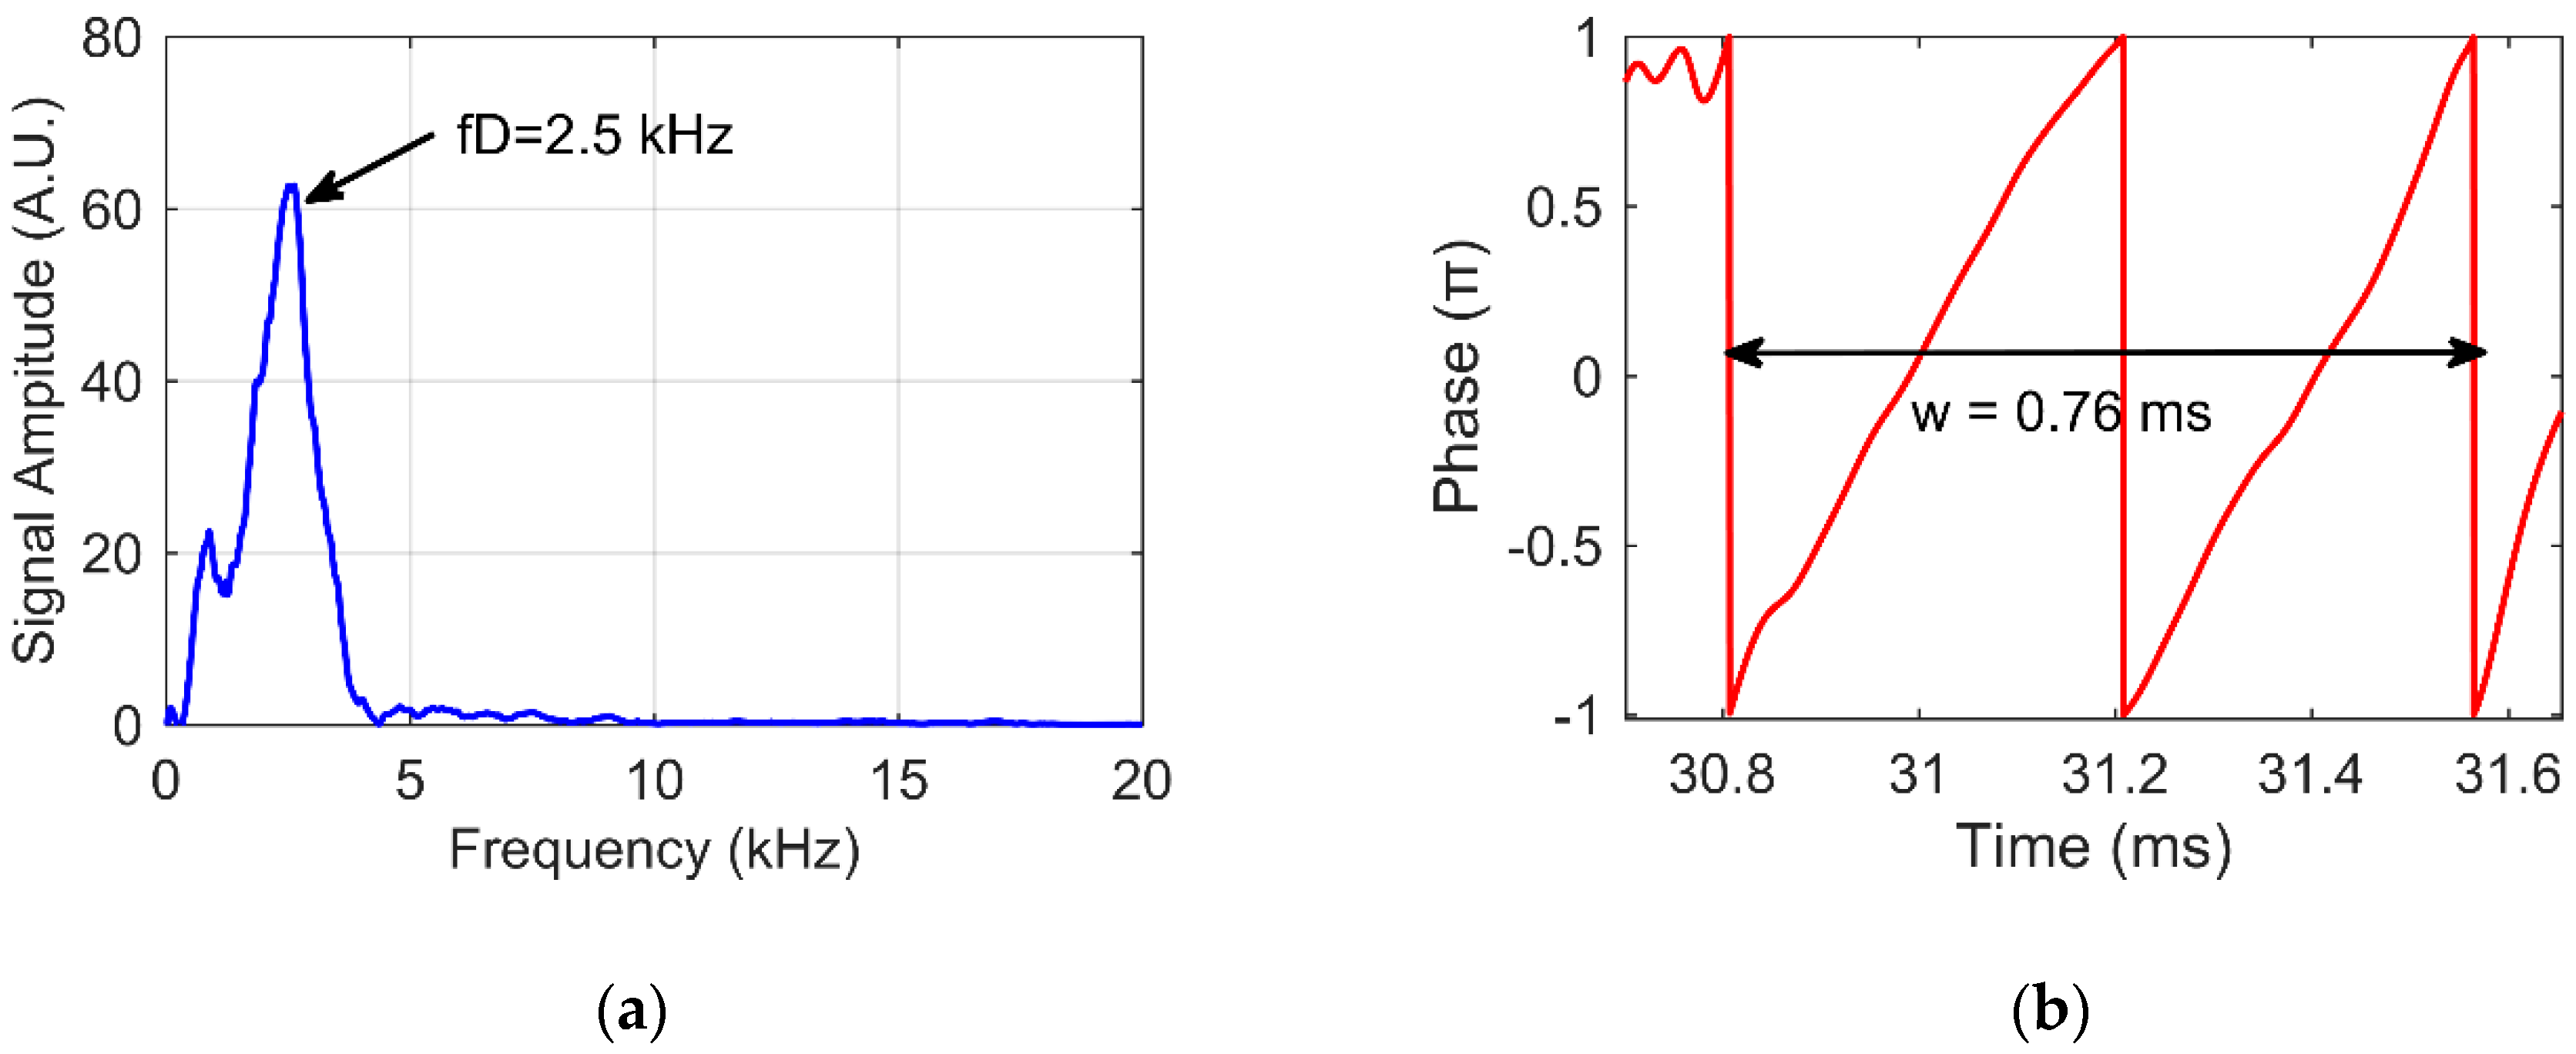
4.1. Signal Purity Identification

Before the classification measurements with micro particles and cells, in order to clarify if there were some micro scale objects that can induce unwanted SMI bursts thus inducing confusion with the meaningful ones from the cells, the PBS sheath liquid and the DMEM culture medium were characterized using our system over 2 h. As expected, none of the liquids generated extra bursts, and these results validate the particle/cell-induced signal purity in the measurements.

4.2. Particle Concentration Classification

Firstly, the concentration differentiation performance of the device was demonstrated. We investigated a series of detection rates (number of detected signal burst per minute) using 5 μm PS particle aqueous solutions at various concentrations, ranging from 106 to 107 events per milliliter. Then, the sensing performance of our optofluidic cytometry system was evaluated. Figure 4a illustrated the SMI signal trace over a short acquisition period, where individual particle detection events (marked with red arrows) could be observed very clearly. The noise floor was measured to be around 100 mV, and the maximal signal level (marked with black dashed lines) could approach 2.5 V, 25 times the noise floor. From Figure 4b, the detection rate increased with the particle concentration, and good linear fitting results (R2 = 0.98) was obtained. Such results validate the good concentration-classifying capability of our cytometer system.

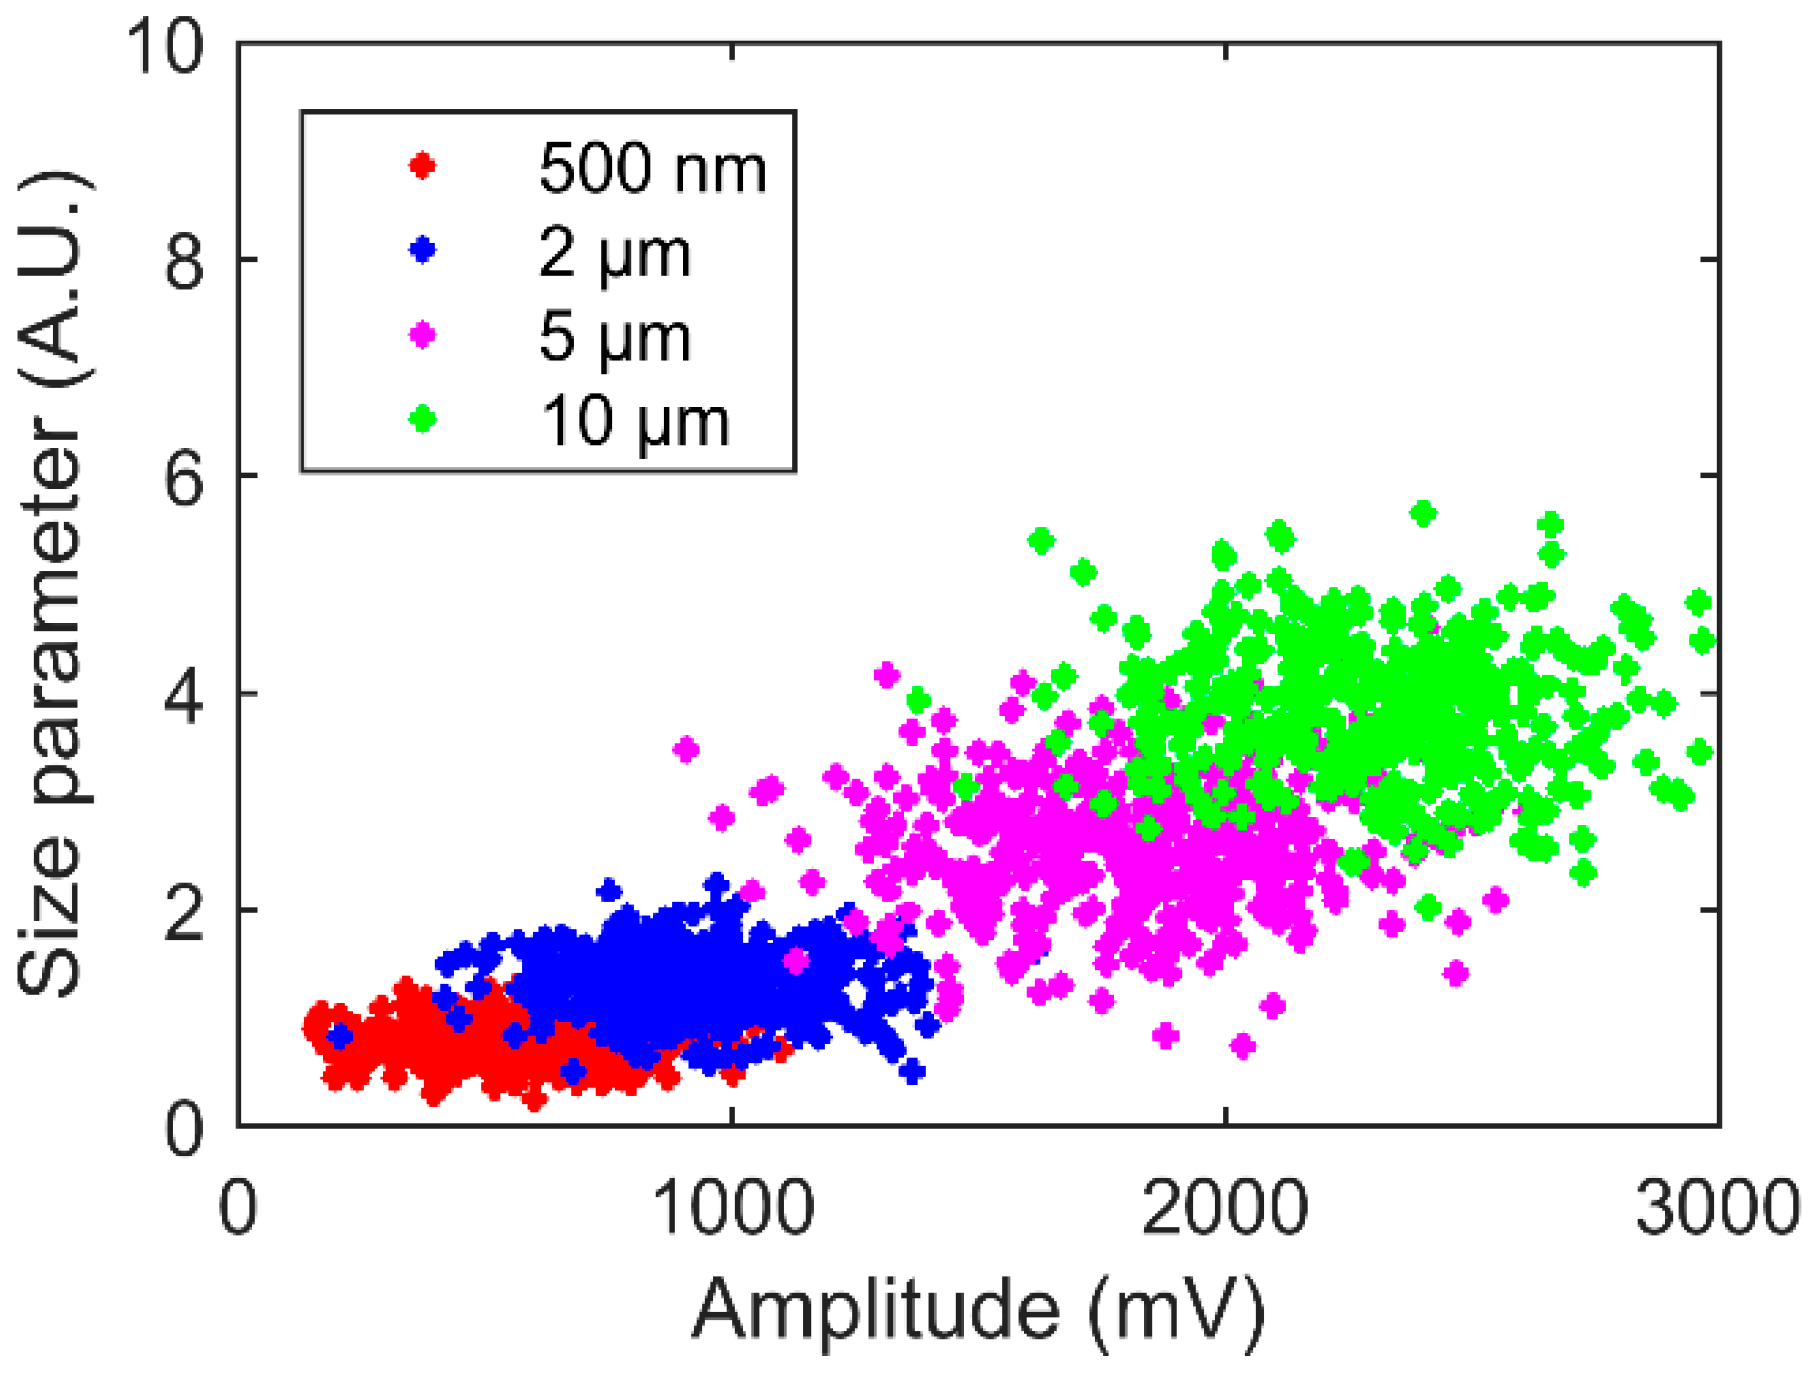
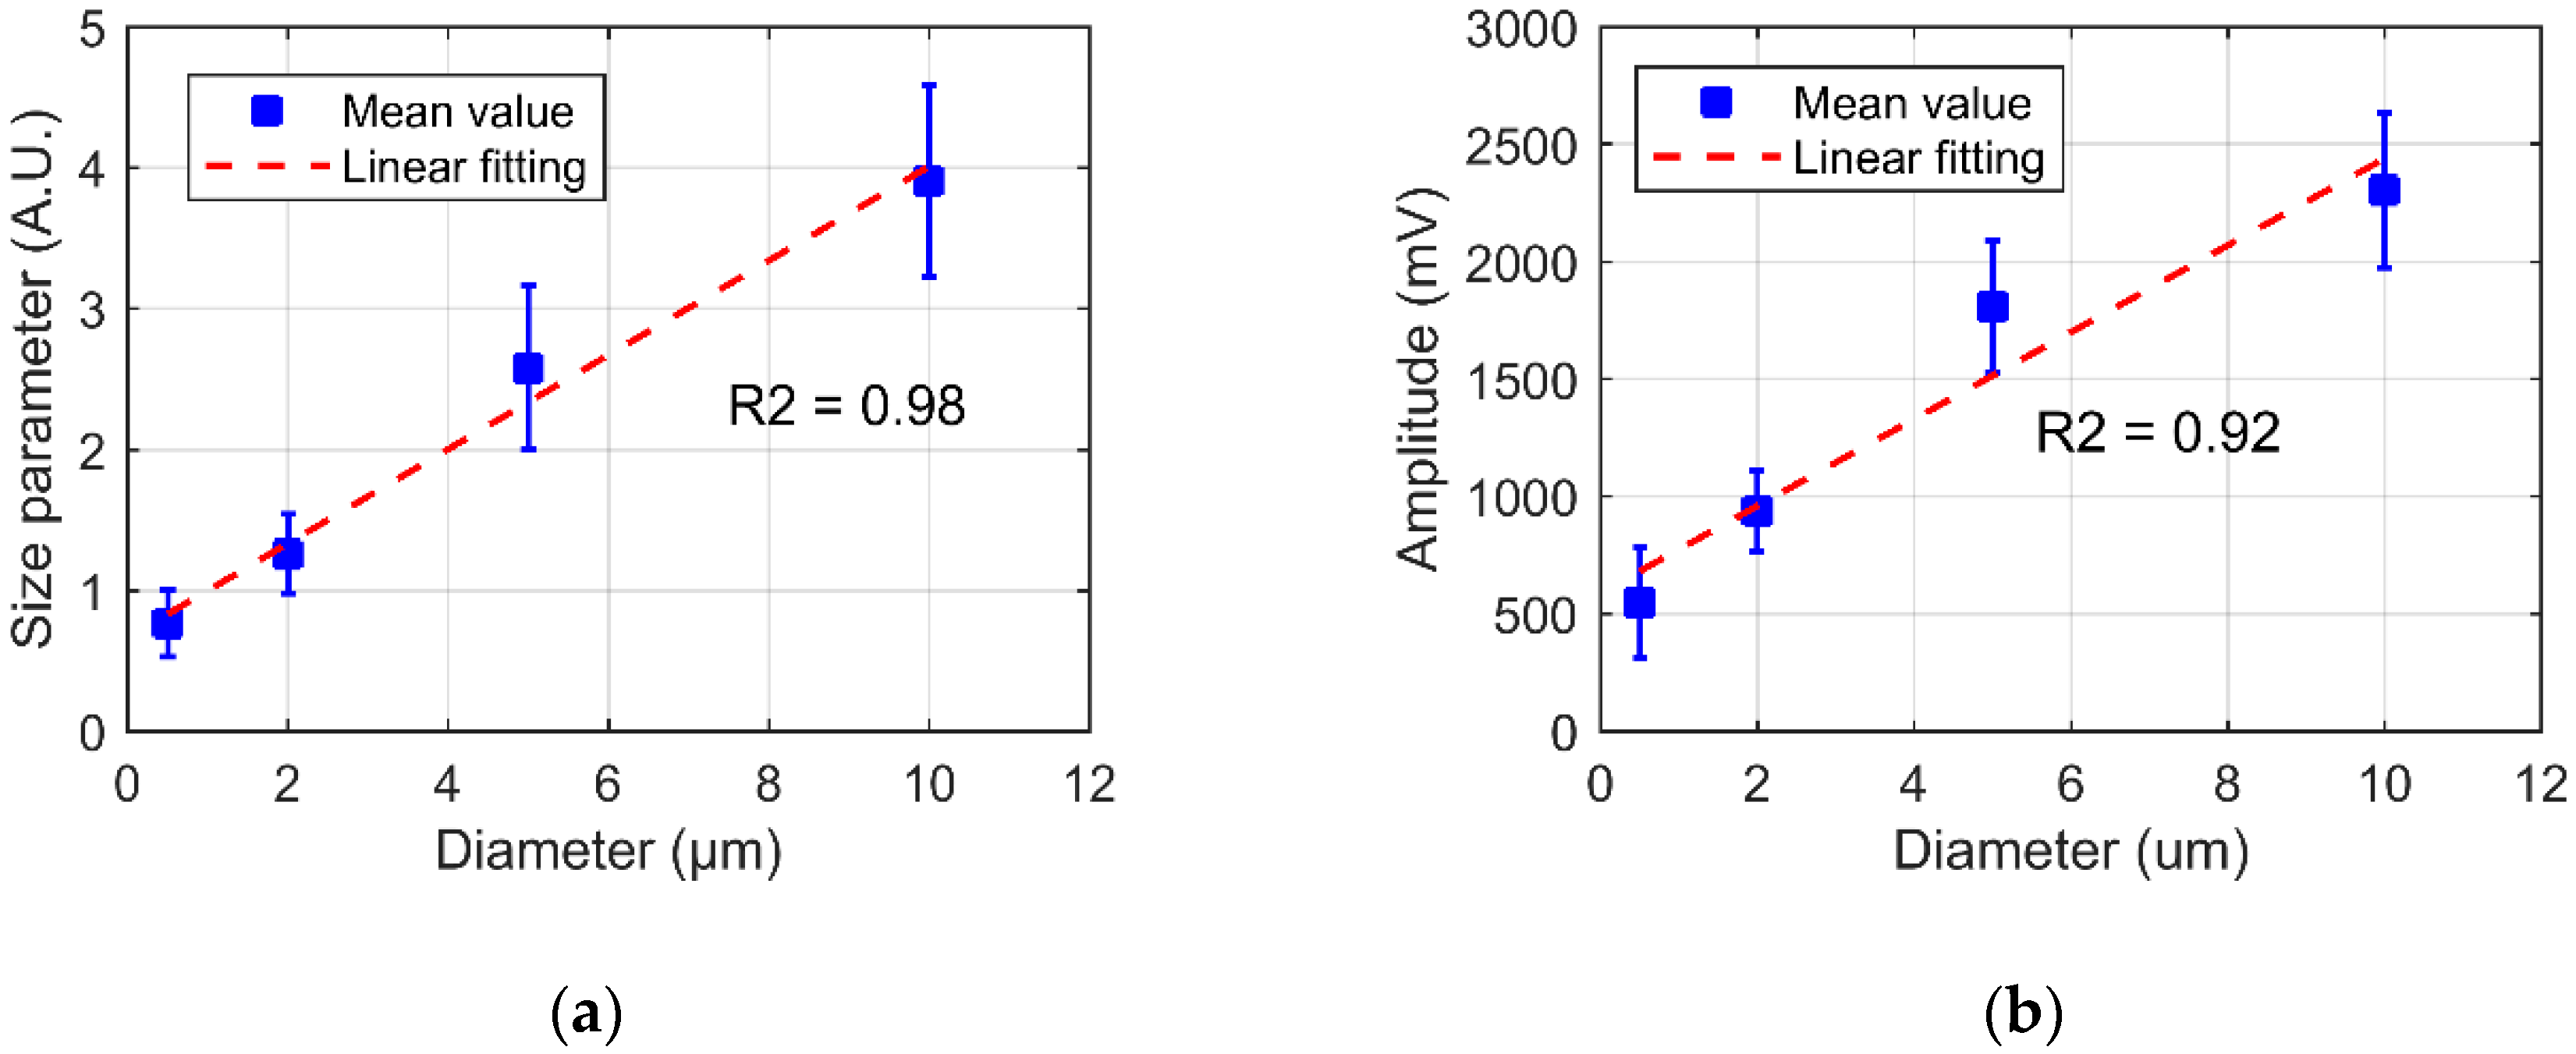
4.3. Size Classification Calibration

In order to evaluate the size sensitivity of the device, the PS suspensions with different diameters (500 nm, 2 μm, 5 μm and 10 μm) were prepared and employed as the micro targets here for calibration purposes. All the particle suspensions were diluted with deionized water in order to obtain the same particle number concentration of ~106 per milliliter. Each particle population was injected into the channel chip, and the resulting signal bursts were acquired subsequently. Figure 5 showed the SMI signal bursts induced by the flowing PS particles of 2 μm diameter (Figure 5a) and 5 μm (Figure 5b). It was noted that the bursts show several well-resolved interferometric fringes, and the fringe number N presented an obvious particle size dependence: the larger particles (5 μm diameter) induced 8 interferometric fringes, more than the smaller 2 μm PS particle, which produced 3 fringes.
Another point of interest from Figure 5 is that for 5 μm particles provided more than 2500 mV signal amplitude is observed which is higher than the one of 2 μm particles. This aspect can be explained by the particle size also determining the particle scattering cross-section, so larger particle scatters more light feeding back into the laser cavity and resulting in a bigger modulation index m value and higher SMI signal amplitude level [33].
The fringe counting method’s feasibility for PS spherical particle sizing has been proved [31]. However, this technique really depends on the target geometry and surface properties, according to the practical nonspherical living cells, the fringe series might be irregular and fringe counting difficult to achieve. Here, we propose a novel alternative to characterize the particle or cell dimension. The scattering target dimension passing through the laser beam can be calculated in first approximation as the product of the passage duration w and the velocity V.
S = w · V
From Equation (3), the Doppler frequency is proportional to the flow velocity. We introduce a non-dimensional parameter K which value is proportional to the cell or particle dimension, and the value can be expressed from the passage duration w and Doppler frequency fD.
K = w · f D
In this work, fast Fourier transform (FFT) was computed as shown in Figure 6a. The sharp peak locus denotes the value of Doppler frequency shift fD. In Figure 5 there were some ambiguities in the burst edge, the w value was difficult to measure directly. In order to extract w more precisely, we used the Hilbert transform (HT) thus retrieving the instantaneous phase information [31,38,39]. Figure 6b illustrated two 2π phase periods, clearly implying the beginning and ending time points of the individual particle-induced burst, of 0.76 ms duration (w) were measured from the phase oscillation.
We correlated the size parameter K and the signal amplitude for size discrimination, and the plots of around 1600 detections were shown in Figure 7, where each dot denotes a detected PS particle. In this figure the dots were grouped into four clusters, corresponding to each particle dimension (red: 500 nm, blue: 2 μm, pink: 5 μm, green: 10 μm). The dot groups induced by 500 nm and 2 μm overlapped significantly and could not be distinguished easily. By contrast, 2 μm, 5 μm and 10 μm groups were significantly distinct. And one can observe that the larger particles producing a bigger K value and a higher signal amplitude level, which was consistent with our preliminary hypothesis.
The size parameter K and the signal amplitude were evaluated statistically by means of histograms to analyze the detection results of different particle sizes further. Four well-resolved Gaussian-shaped peaks were found in Figure 8a,b. A Gaussian fitting by the function described in Equation (7) was performed on each PS population to analyze the mean value μ and standard deviation σ:
y = A 2 π σ · exp ( ( x μ ) 2 2 σ 2 )
where A is the amplitude fitting factor. The coefficient of variation (CV) value was calculated by dividing σ (the mean value) by μ (the standard deviation). In Figure 9, the evolution of the mean value μ of K value and of the burst amplitude were plotted (blue marks) as a function of the particle diameter D, and the error bars denote the standard deviation value σ. A linear fitting was applied to both measurements (red dashed line) as well. From the figure, both profiles presented a good linear dependence on the diameter D, R2 = 0.98 in Figure 9a and R2 = 0.92 in Figure 9b, respectively. Both factors can discriminate the particle sizes efficiently.

4.4. Human Living Cell Discrimination

After calibration, the measurements were also performed using two different types of human living cells, MCF7 and 293, that were suspended in phosphate-buffered saline (PBS) for maintaining cell activity. The liquids were expected to have a similar composition with the normal clinically relevant samples in commercial CF measurement. The concentration of each suspension was about 5 × 10⁴ per milliliter. The bursts induced by each cell type were shown in Figure 10, indicating a comparable signal amplitude level with the PS beads. However, the cell bursts of the two types cells were quite different as compare to the PS beads-induced bursts. Most of those obtained with the MCF7 cells exhibited quite irregular fringe amplitude distribution and the envelope was no longer Gaussian-shaped. The bursts from 293 cells mostly presented single dominating fringe. The probable explanation is that the cell membrane surface is not as smooth as the beads, the random defects results in such fringe arrangement irregularity that can be observed in Figure 10a.
The statistic correlation results of SMI signal amplitude and size parameter K from cells population samples were depicted in Figure 11. Similar to what was observed for the PS particles, there were two clusters of dots in the figure coinciding with the two cell types. However, the clusters overlapped significantly, with a large distribution dispersion, especially in the case of MCF7 cells.
Histogram plots of the size parameter K and the signal amplitude of the measurement are shown in Figure 12. The size parameter K distribution remains reliable for cell types discrimination as two groups of cells can be recognized in Figure 12a. The CV values of K distribution were 52% and 17%, were dramatically larger than those of PS particles, resulting in a lower sensing accuracy. The broadening of the distribution from the cells as compared with the PS beads is likely attributed to the considerable cell morphologic dispersion. Another possible explanation is that during the measurement, the cell samples contained some apoptosis cells or aggregations of which the sizes were different than the normal living cells. Nevertheless, the results indicated the mean measured dimension of the MCF is bigger than 293, which is coherent with the data from the reference 28. However, the mean K value ratio between two cells μ2/μ1 is around 4 which is much higher than the realistic cell dimension ratio 15 μm/11 μm. Thus, in cell size characterization measurement, our system can only discriminate the cell type while not providing accurate cell sizing. The amplitude distribution of both cells is quite confusing in Figure 12b and such a larger amplitude dispersion can probably be attributed to the variable cell reflectivity impacting the modulation index m.

5. Conclusions

In summary, a novel compact, label-free single and low-cost cell characterization methodology was implemented based on laser self-mixing interferometry technology. Compared with the bulky and expensive devices in use for conventional flow cytometry systems, our novel optofluidic cytometry system only consists of a commercial laser diode, a homemade circuit and a PDMS microfluidic chip. This approach allowed us to achieve high-sensitivity target-by-target characterization of various micro-scale biological samples. Moreover, this method does not need fluorescence staining or any other operations which can be harmful to the valuable samples. A series of measurements were applied using both living cells and artificial polystyrene beads. The characteristics of the SMI signal in the presence of the target particle were investigated in detail, and a statistical approach was used for micro object classification. The results were consistent with our expectation, validating the cell or particle size differentiation capability of our system.
Considering this work is the first attempt to exploit the SMI technique on the single cell characterization, there are some shortcomings in our system: it can classify the cell type by size differentiation but it is still inadequate for accurate cell size characterization with significant resolution, and more effort must be made in data processing and theory. In spite of the various shortcomings, this method open new opportunities for in on-site bio-medical detection or other sensing applications.

Author Contributions

The contribution of the authors to this work is detailed as follows: investigation, conceptualization and writing: Y.Z., J.L., R.d.C.M.; experimental validation and visualization: X.S., M.Z., J.Y.; Reviewing: X.W., J.P.; supervision: T.C. All authors have read and agreed to the published version of the manuscript.

Funding

This research was funded by National Natural Science Foundation of China, Grant Number 61905005; Beijing municipal Natural Science Foundation, Grant Number 4194071 and L182011. Key project of Science and Technology of Beijing Municipal Education Commission, Grant No. KZ201910005009. Scientific Research Project of Beijing Educational Committee (Grant No. KM201910005004).

Acknowledgments

The authors acknowledge Yanfeng Gao to PDMS microfluidic channel fabrication processing. The authors also express gratitude to Yang Li and Manyu Liu for cells culture.

Conflicts of Interest

The authors declare no conflict of interest.

References

  1. Yang, R.-J.; Fu, L.-M.; Hou, H.-H. Review and perspectives on microfluidic flow cytometers. Sens. Actuators B Chem. 2018, 266, 26–45. [Google Scholar] [CrossRef]
  2. Aebisher, D.; Bartusik, D.; Tabarkiewicz, J. Laser flow cytometry as a tool for the advancement of clinical medicine. Biomed. Pharmacother. 2017, 85, 434–443. [Google Scholar] [CrossRef]
  3. Xie, L.; Yang, Y.; Sun, X.; Qiao, X.; Liu, Q.; Song, K.; Kong, B.; Su, X. 2D light scattering static cytometry for label-free single cell analysis with submicron resolution. Cytometry A 2015, 87, 1029–1037. [Google Scholar] [CrossRef] [PubMed] [Green Version]
  4. Zeidan, A.; Yelin, D. Reflectance confocal microscopy of red blood cells: Simulation and experiment. Biomed. Opt. Express 2015, 6, 4335. [Google Scholar] [CrossRef] [PubMed] [Green Version]
  5. Choi, Y.S.; Lee, S.J. Three-dimensional volumetric measurement of red blood cell motion using digital holographic microscopy. Appl. Opt. 2009, 48, 2983–2990. [Google Scholar] [CrossRef]
  6. Memmolo, P.; Miccio, L.; Merola, F.; Gennari, O.; Netti, P.A.; Ferraro, P. 3D morphometry of red blood cells by digital holography. Cytometry A 2014, 85, 1030–1036. [Google Scholar] [CrossRef]
  7. Lin, M.; Qiao, X.; Liu, Q.; Shao, C.; Su, X. Light-sheet-based 2D light scattering cytometry for label-free characterization of senescent cells. Biomed. Opt. Express 2016, 7, 5170–5181. [Google Scholar] [CrossRef] [Green Version]
  8. Bhaduri, B.; Edwards, C.; Pham, H.; Zhou, R.; Nguyen, T.H.; Goddard, L.L.; Popescu, G. Diffraction phase microscopy: Principles and applications in materials and life sciences. Adv. Opt. Photonics 2014, 6, 57. [Google Scholar] [CrossRef]
  9. Machikhin, A.; Ramazanova, A.; Polschikova, O.; Pozhar, V. Lens-in-lens common-path interferometer for quantitative phase imaging. J. Opt. 2019, 21, 125801. [Google Scholar] [CrossRef]
  10. Machikhin, A.; Polschikova, O.; Vlasova, A.; Lyashenko, A.; Dmitriev, I.; Batshev, V.; Bulatov, M.; Pozhar, V. RGB laser based on an optical parametric oscillator for single-shot color digital holographic microscopy. Opt. Lett. 2019, 44, 5025. [Google Scholar] [CrossRef]
  11. Xie, P.; Cao, X.; Lin, Z.; Talukder, N.; Emaminejad, S.; Javanmard, M. Processing gain and noise in multi-electrode impedance cytometers: Comprehensive electrical design methodology and characterization. Sensors Actuators B Chem. 2017, 241, 672–680. [Google Scholar] [CrossRef]
  12. Joo, S.; Kim, K.H.; Kim, H.C.; Chung, T.D. A portable microfluidic flow cytometer based on simultaneous detection of impedance and fluorescence. Biosens. Bioelectron. 2010, 25, 1509–1515. [Google Scholar] [CrossRef] [PubMed]
  13. Haandbæk, N.; With, O.; Bürgel, S.C.; Heer, F.; Hierlemann, A. Resonance-enhanced microfluidic impedance cytometer for detection of single bacteria. Lab Chip 2014, 14, 3313. [Google Scholar] [CrossRef] [PubMed]
  14. Galanzha, E.I.; Zharov, V.P. Photoacoustic flow cytometry. Methods 2012, 57, 280–296. [Google Scholar] [CrossRef] [Green Version]
  15. Wang, L.V. Multiscale photoacoustic microscopy and computed tomography. Nat. Photonics 2009, 3, 503–509. [Google Scholar] [CrossRef] [Green Version]
  16. Loghavi, S.; Wang, S.A.; Jeffrey Medeiros, L.; Jorgensen, J.L.; Li, X.; Xu-Monette, Z.Y.; Miranda, R.N.; Young, K.H. Immunophenotypic and diagnostic characterization of angioimmunoblastic T-cell lymphoma by advanced flow cytometric technology. Leuk. Lymphoma 2016, 57, 2804–2812. [Google Scholar] [CrossRef] [Green Version]
  17. Giuliani, G.; Norgia, M.; Donati, S.; Bosch, T. Laser diode self-mixing technique for sensing applications. J. Opt. A Pure Appl. Opt. 2002, 4, S283–S294. [Google Scholar] [CrossRef] [Green Version]
  18. Bosch, T.; Bes, I.C.; Scalise, L.; Plantier, G. Optical Feedback Interferometry. In Encyclopedia of Sensors; American Scientific Publishers: Valencia, CA, USA, 2006; pp. 1–20. [Google Scholar]
  19. Taimre, T.; Nikolić, M.; Bertling, K.; Lim, Y.L.; Bosch, T.; Rakić, A.D. Laser feedback interferometry: A tutorial on the self-mixing effect for coherent sensing. Adv. Opt. Photonics 2015, 7, 570–631. [Google Scholar] [CrossRef]
  20. Sudo, S.; Miyasaka, Y.; Nemoto, K.; Kamikariya, K.; Otsuka, K. Detection of small particles in fluid flow using a self-mixing laser. Opt. Express 2007, 15, 8135–8145. [Google Scholar] [CrossRef]
  21. Otsuka, K.; Ohtomo, T.; Makino, H.; Sudo, S.; Ko, J.-Y. Net motion of an ensemble of many Brownian particles captured with a self-mixing laser. Appl. Phys. Lett. 2009, 94, 241117. [Google Scholar] [CrossRef]
  22. Wang, H.; Shen, J. Fast and economic signal processing technique of laser diode self-mixing interferometry for nanoparticle size measurement. Appl. Phys. B Lasers Opt. 2014, 115, 285–291. [Google Scholar] [CrossRef]
  23. Zakian, C.; Dickinson, M.; King, T. Particle sizing and flow measurement using self-mixing interferometry with a laser diode. J. Opt. A Pure Appl. Opt. 2005, 7, S445–S452. [Google Scholar] [CrossRef]
  24. Nikolic, M.; Hicks, E.; Lim, Y.L.; Bertling, K.; Raki, A.D. Self-mixing laser Doppler flow sensor: An optofluidic implementation. Appl. Opt. 2013, 52, 8128–8133. [Google Scholar] [CrossRef]
  25. Zhao, Y.; Perchoux, J.; Campagnolo, L.; Camps, T.; Atashkhooei, R.; Bardinal, V. Optical feedback interferometry for microscale-flow sensing study: Numerical simulation and experimental validation. Opt. Express 2016, 24, 23849–23861. [Google Scholar] [CrossRef] [PubMed]
  26. Campagnolo, L.; Nikolić, M.; Perchoux, J.; Lim, Y.L.; Bertling, K.; Loubiere, K.; Prat, L.; Rakić, A.D.; Bosch, T. Flow profile measurement in microchannel using the optical feedback interferometry sensing technique. Microfluid. Nanofluidics 2013, 14, 113–119. [Google Scholar] [CrossRef] [Green Version]
  27. Atashkhooei, R.; Ramirez-Miquet, E.E.; da Costa Moreira, R.; Quotb, A.; Royo, S.; Perchoux, J. Optical Feedback Flowmetry: Impact of Particle Concentration on the Signal Processing Method. IEEE Sens. J. 2018, 18, 1457–1463. [Google Scholar] [CrossRef]
  28. Ramrez-Miquet, E.E.; Perchoux, J.; Loubière, K.; Tronche, C.; Prat, L.; Sotolongo-Costa, O. Optical feedback interferometry for velocity measurement of parallel liquid-liquid flows in a microchannel. Sensors 2016, 16, 1223. [Google Scholar] [CrossRef] [Green Version]
  29. Da Costa Moreira, R.; Perchoux, J.; Zhao, Y.; Tronche, C.; Jayat, F.; Bosch, T. Single nano-particle flow detection and velocimetry using optical feedback interferometry. In Proceedings of the 2017 IEEE SENSORS, Glasgow, UK, 29 October–1 November 2017; pp. 1–3. [Google Scholar]
  30. Herbert, J.; Bertling, K.; Taimre, T.; Rakić, A.D.; Wilson, S. Microparticle discrimination using laser feedback interferometry. Opt. Express 2018, 26, 25778. [Google Scholar] [CrossRef]
  31. Zhao, Y.; Zhang, M.; Zhang, C.; Yang, W.; Chen, T.; Perchoux, J. Micro Particle Sizing Using Hilbert Transform Time Domain Signal Analysis Method in Self-Mixing Interferometry. Appl. Sci. 2019, 9, 5563. [Google Scholar] [CrossRef] [Green Version]
  32. Wang, W.M.; Grattan, K.T.V.; Palmer, A.W.; Boyle, W.J.O. Self-mixing interference inside a single-mode diode laser for optical sensing applications. J. Light. Technol. 1994, 12, 1577–1587. [Google Scholar] [CrossRef]
  33. Zhao, Y.; Camps, T.; Bardinal, V.; Perchoux, J. Optical Feedback Interferometry Based Microfluidic Sensing: Impact of Multi-Parameters on Doppler Spectral Properties. Appl. Sci. 2019, 9, 3903. [Google Scholar] [CrossRef] [Green Version]
  34. Zhao, Y. Optical Feedback Sensing in Microfluidics: Design and Characterization of VCSEL-Based Compact Systems; INSA: Toulouse, France, 2017. [Google Scholar]
  35. Chang, C.-C.; Yang, R.-J. Hydrodynamic Focusing Effect on Two-Unmixed-Fluid in Microchannels. Int. J. Nonlinear Sci. Numer. Simul. 2008, 9, 213–220. [Google Scholar] [CrossRef]
  36. Wereley, S.T.; Meinhart, C.D. Recent Advances in Micro-Particle Image Velocimetry. Annu. Rev. Fluid Mech. 2010, 42, 557–576. [Google Scholar] [CrossRef] [Green Version]
  37. Milo, R.; Jorgensen, P.; Moran, U.; Weber, G.; Springer, M. BioNumbers The database of key numbers in molecular and cell biology. Nucleic Acids Res. 2009, 38 (Suppl. S1), D750–D753. [Google Scholar] [CrossRef] [PubMed] [Green Version]
  38. Zhang, Z.; Li, C.; Huang, Z. Vibration measurement based on multiple Hilbert transform for self-mixing interferometry. Opt. Commun. 2019, 436, 192–196. [Google Scholar] [CrossRef]
  39. Arriaga, A.L.; Bony, F.; Bosch, T. Speckle-insensitive fringe detection method based on Hilbert transform for self-mixing interferometry. Appl. Opt. 2014, 53, 6954. [Google Scholar] [CrossRef]
Figure 1. The schematic of three-mirror model.
Applsci 10 00478 g001
Figure 2. The individual cell passage through the laser beam at time point of (a) t1, (b) t2, (c) t3.
Applsci 10 00478 g002
Figure 3. The schematic graphs of the system. (a) The optofluidic flow cytometry system. (b) The hydrodynamic channel chip.
Applsci 10 00478 g003
Figure 4. Particle concentration classification measurement results. (a) Time-domain self-mixing interferometry (SMI) signal trace. The red arrows denote the individual detection events and the black dashed lines denote the noise floor level. (b) The detection rate profile as a function of particle concentration. The dashed line denotes the linear fitting results.
Applsci 10 00478 g004
Figure 5. The SMI signal bursts polystyrene sphere (PS) particles in (a) 2 μm diameter (b) 5 μm diameter.
Applsci 10 00478 g005
Figure 6. The signal processing of the detected SMI signal burst from a PS bead. (a) Fast Fourier transform (FFT) on the frequency domain. (b) Hilbert transform (HT) on the time domain.
Applsci 10 00478 g006
Figure 7. Correlation dot pilot of the PS beads detection. with different particle diameters: 500 nm (red); 2 μm (blue); 5 μm (pink); 10 μm (green).
Applsci 10 00478 g007
Figure 8. The histogram of the PS beads measurements. (a) Size parameter K. (b) SMI signal amplitude.
Applsci 10 00478 g008
Figure 9. The profiles of the measurement results as a function of PS particle diameter. (a) Size particle K. (b) SMI signal amplitude.
Applsci 10 00478 g009
Figure 10. The SMI bursts of individual human living cells: (a) MCF7 cells; (b) 293 cells.
Applsci 10 00478 g010
Figure 11. Scatter plot of the detection results obtained from MCF7 cells (in red); 293 cells (in blue).
Applsci 10 00478 g011
Figure 12. The histogram of MCF7 cells (in red); 293 cells (in blue). (a) Size parameter K distribution; (b) SMI signal amplitude distribution.
Applsci 10 00478 g012

