1. Introduction
The CRTS-II ballastless slab track high-speed railway is a new track structure composed of the track bed, the CA mortar filling layer, the prefabricated track slab, the fasteners and the rails. With its advantages of high smoothness, high stability and reduced maintenance cost, the CRTS-II slab ballastless track has been widely used worldwide [
1,
2,
3]. However, under a long-term complex environment and complex loads, the track structure will inevitably experience damage and aging problems, which endanger the driving safety and comfort. Field investigations have shown that structural diseases such as the cracking of the track bed, the cracking of the track slab and interlayer interface cracks (among which interlayer interface cracks between the track slab and the CA mortar are the most common) have appeared on the ballastless slab track operating line [
4,
5,
6,
7]. The longitudinal continuous structure characteristics of the CRTS-II slab ballastless track make the structure very sensitive to the temperature effect. The main causes of the structural diseases in the CRTS-II slab ballastless track structure are the variation of the ambient temperature and the difference in thermal behavior between the CA mortar and the concrete [
8]. Thus, the influence of the temperature on the mechanical performance of the track structure cannot be ignored [
9].
Recently, Chinese and foreign scholars have carried out theoretical and experimental studies on the damage evolution of the ballastless track structures under long-term train loads. Yang Yang [
10] obtained the failure mode and mechanism of the track slab under static load through bearing capacity and fatigue tests of the CRTS-II track slab; Kang Chongjie et al. [
11,
12] used a full-scale model to test the mechanical characteristics of the CRTS-II slab ballastless track structure under vertical static train load; Zhou Lingyu [
13] established a 3D finite element model of the ballastless track-bridge multilayer structural system and analyzed the effect of the beam stiffness degradation on the mechanical properties of the structural system under the train load.
In recent years, a large number of theoretical studies have been carried out on the temperature load mode of the track structure and the mechanism and regularity of the structural diseases such as the interlayer interface cracks under temperature load, and some good results have been obtained. Ou Zumin et al. [
14,
15] established the temperature field equation of the ballastless track structure based on the thermal principle and the simplified meteorological boundary conditions; the temperature profile of the ballastless track structure was analyzed by validating the measured temperature distribution data. Zhao Lei et al. [
16,
17,
18] obtained the time-dependent law of the temperature field in the ballastless track through long-term observation of the field temperature. Based on statistical fitting methods, the vertical temperature load model of the ballastless track was obtained. Tian Dongmei et al. [
19] carried out high–low temperature cycling tests on a composite specimen of CA mortar layer and concrete to investigate the temperature effect on the interfacial bond between the CA mortar layer and the concrete layer. Zhu Shengyang et al. [
20,
21,
22] used the interfacial cohesion model as the basis to simulate the complex interlayer bond–debond contact relationship between the track slab and the CA mortar. A three-dimensional finite element model of the interlayer shear failure of the CRTS-II slab ballastless track was established, and the mechanism of the interlayer shear failure of the track and the effect of the interfacial damage on the dynamic structural performance was analyzed. He Chuan et al. [
23,
24,
25] used the finite element method to simulate the interlayer interface relationship of the track structure by using a contact element and studied the influence of different locations and sizes of the interlayer gap on the mechanical properties of the track structure.
Throughout the existing research, the ballastless track test studies that have been carried out have only considered the train load and ignored the thermal effect. Most of the studies on temperature were based on finite element numerical analysis and lack relevant test verification. The experimental studies on the crack initiation law in the ballastless track structures under repeated temperature loads and their effects on the mechanical properties of structures are even more important. In this paper, a 1/4 scale model of the CRTS-II slab ballastless track-32-m standard prefabricated simply supported box girder bridge with three spans and two high-speed railway lines was created, and repeated thermal loading tests were carried out. A static loading test was carried out before and after the thermal loading tests. The initiation and expansion of the interlayer gap under repeated thermal loading and the effects of the interlayer interface cracks on the strain, displacement and stiffness of the CRTS-II ballastless track slab simply supported bridge were studied. The obtained experimental results can provide reference for the related theoretical research on the ballastless track interlayer damage under repeated temperature load.
2. Experimental Program
2.1. Specimen Design and Fabrication
2.1.1. Prototype Structure
In this paper, a CRTS-II ballastless slab track structure on a 3 × 32 m standard prestressed simply supported concrete box bridge was selected as the test prototype [
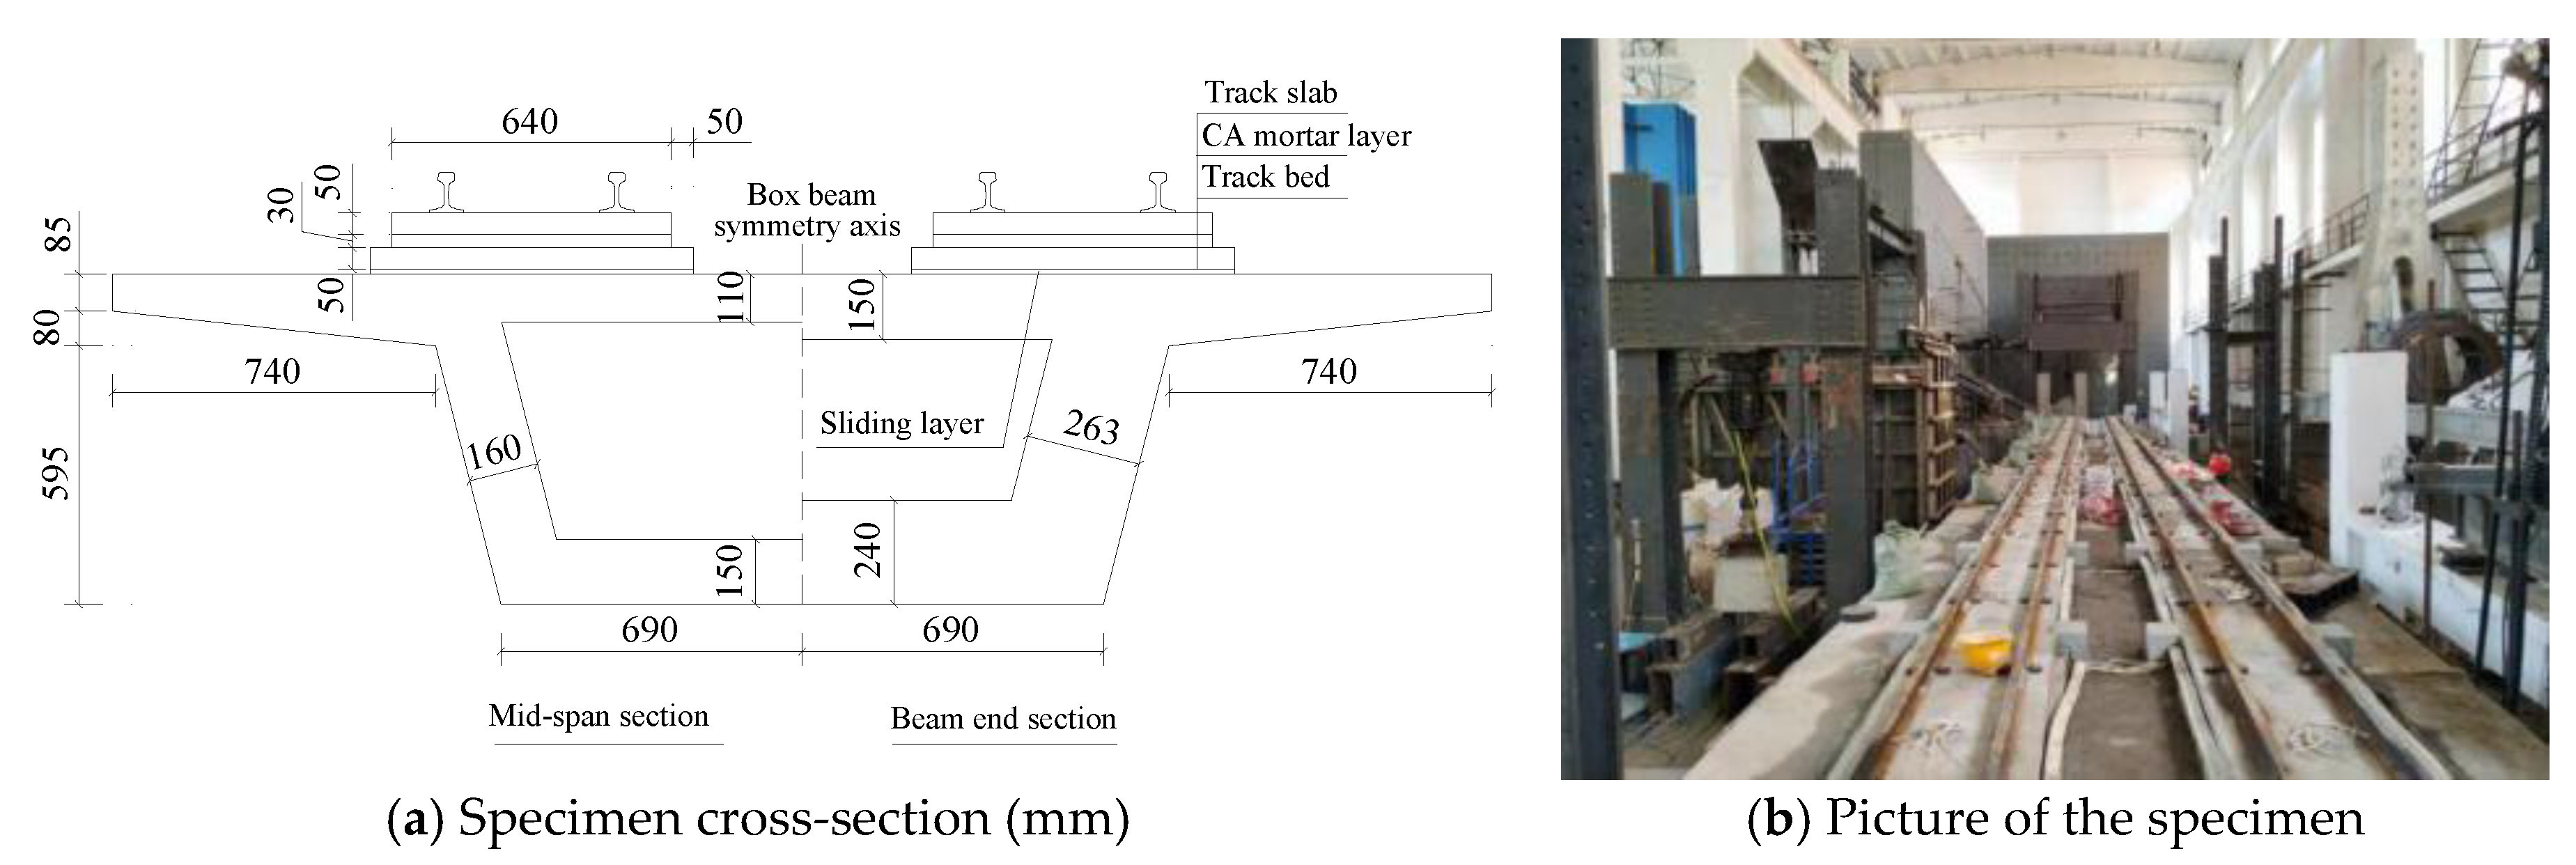
26]. The width, thickness and length of a standard track slab are 2550 mm, 200 mm, and 6450 mm, respectively. The design thickness of the CA mortar filling layer is 30 mm. The track bed (base plate) has a width and thickness of 2950 mm and 200 mm, respectively.
2.1.2. Specimen Design
Considering the test requirements and the limitations of the test site conditions, the scale of 1:4 was selected for the test specimen which, according to the principle of stress equivalence, was designed with similarity to the prototype structure with the following details: ① the geometry of the specimen is consistent with that of the prototype structure and the geometric similarity condition was satisfied; ② the mid-span stress of the specimen at the upper and lower edges of the concrete is equal to that of the prototype structure under the self-weight, prestressing force and other external loads; ③ the boundary conditions of the specimen and those of the prototype structure are consistent; ④ the specimen and the prototype structure adopted the same concrete materials, cement emulsified asphalt mortar and steel material with identical heat transfer coefficients. The similarity ratio of specimen is shown in
Table 1.
After the scale reduction, the width, thickness and length of a single-tracks slab were 640 mm, 50 mm and 1600 mm, respectively. The track bed (base plate) was 740 mm wide and 50 mm thick. The CA mortar layer had a width of 640 mm. Because the thickness of the CA mortar layer in the prototype structure was only 30 mm and considering the needs of the specimen construction and the sensors embedding operation, the thickness direction of the CA mortar layer of the specimen was not scaled. Meanwhile, the author also analyzed the thickness of the CA mortar layer of the specimen structure and found that its influence was insignificant and could be ignored for the following reason: the CA mortar as the filling layer was mainly used to adjust the position of track structure accurately. The size of CA mortar layer was the smallest among the track system layers, and its elastic modulus was 1/4 less than that of the concrete materials such as the track plate and base plate. Therefore, the effect of the CA mortar layer on the mechanical properties of the structure is insignificant. The specimen structure is shown in
Figure 1.
2.1.3. Construction of the Specimen
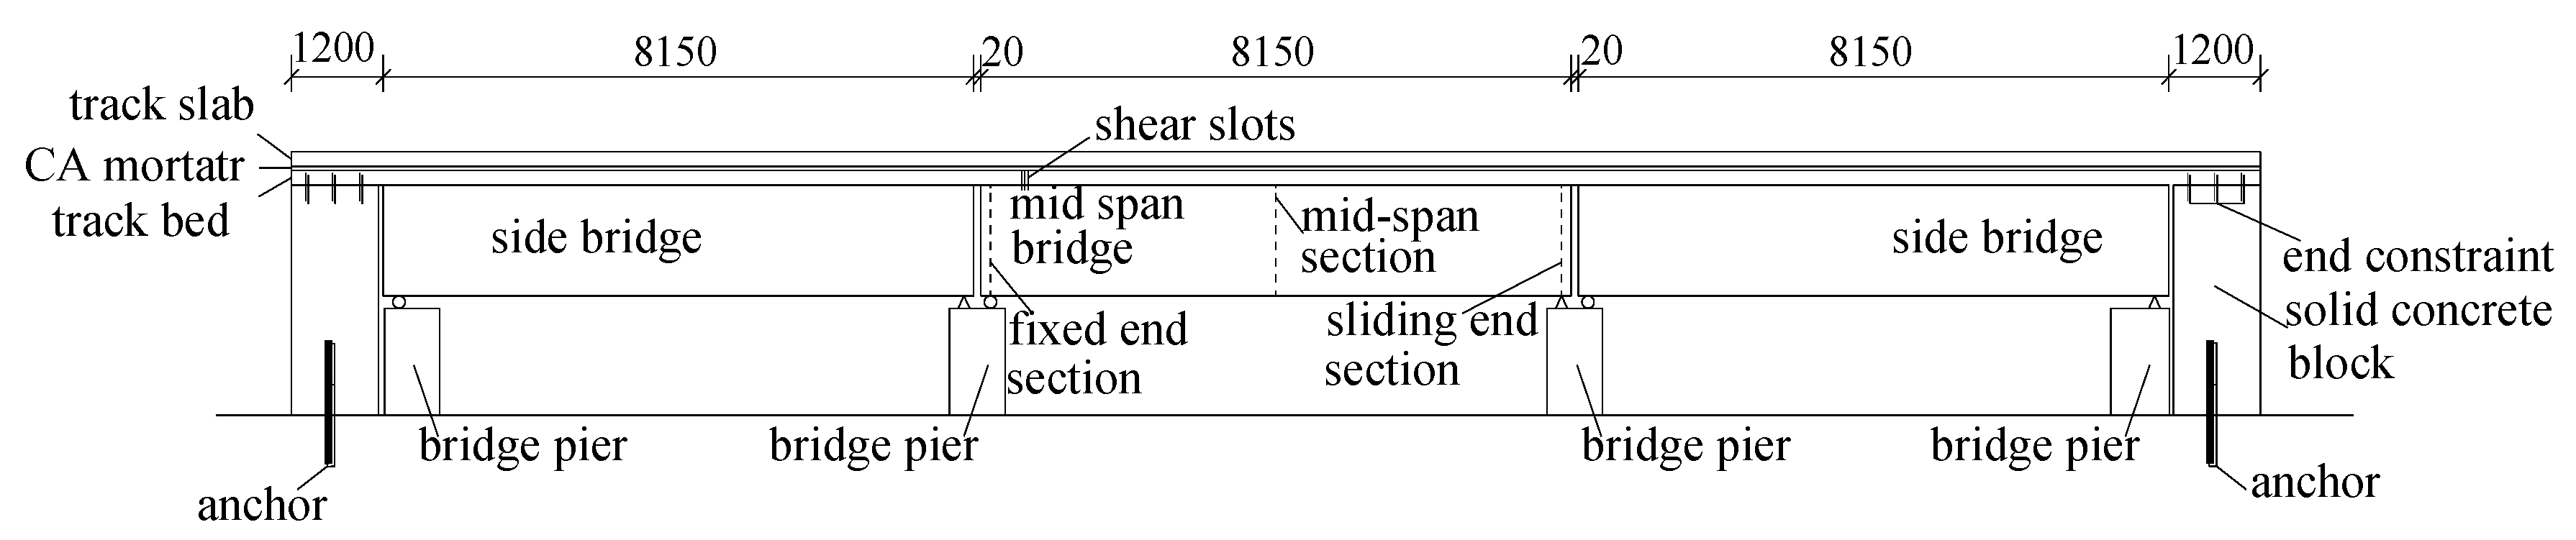
After the simply supported concrete box beam was completed, the shear groove was reserved near the fixed supports on each bridge deck and the “dual textile-one membrane” geotextile sliding layers were laid. The track bed and the CA mortar were cast in situ to ensure their longitudinal continuity, while the track slab was a precast concrete slab. After hoisting and positioning, the refined threaded steel bars were reserved at the joints for welding, and then the concrete at the joints was poured to realize the longitudinal continuity of the track slab. To simulate the infinite boundary conditions of the track structure, a three-span simply supported beam was fabricated. After the track structure was laid, the middle track-bridge structural system that met the continuous boundary conditions was selected for the test. The elevation view of specimen structure is shown in
Figure 2.
2.2. Temperature Load
2.2.1. Temperature Loading System
The test simulates the temperature load experienced by the track structure under extreme weather conditions. With the daily temperature fluctuation, there will be three parts of thermal load within the track structure: the overall temperature, the linear thermal gradient and the nonlinear thermal gradient [
27]. The temperature load within the track structure mainly depends on the change of the surrounding environment temperature. According to the existing literature on the relationship between the track slab top surface temperature and the ambient temperature, the maximum track slab top surface temperature is close to 60 °C when the daytime temperature reaches 40 °C [
28,
29,
30]. Therefore, during the test, the track slab top surface was taken as the thermal loading control point and the maximum applied temperature load was limited to 60 °C. Due to the limitation of the experimental conditions, it is difficult to apply a temperature load lower than room temperature; therefore, the test was scheduled to be carried out at night in winter, taking advantage of the lower ambient temperature (approximately 8 °C) to achieve a higher temperature rise range and obtain a larger thermal response of the structure.
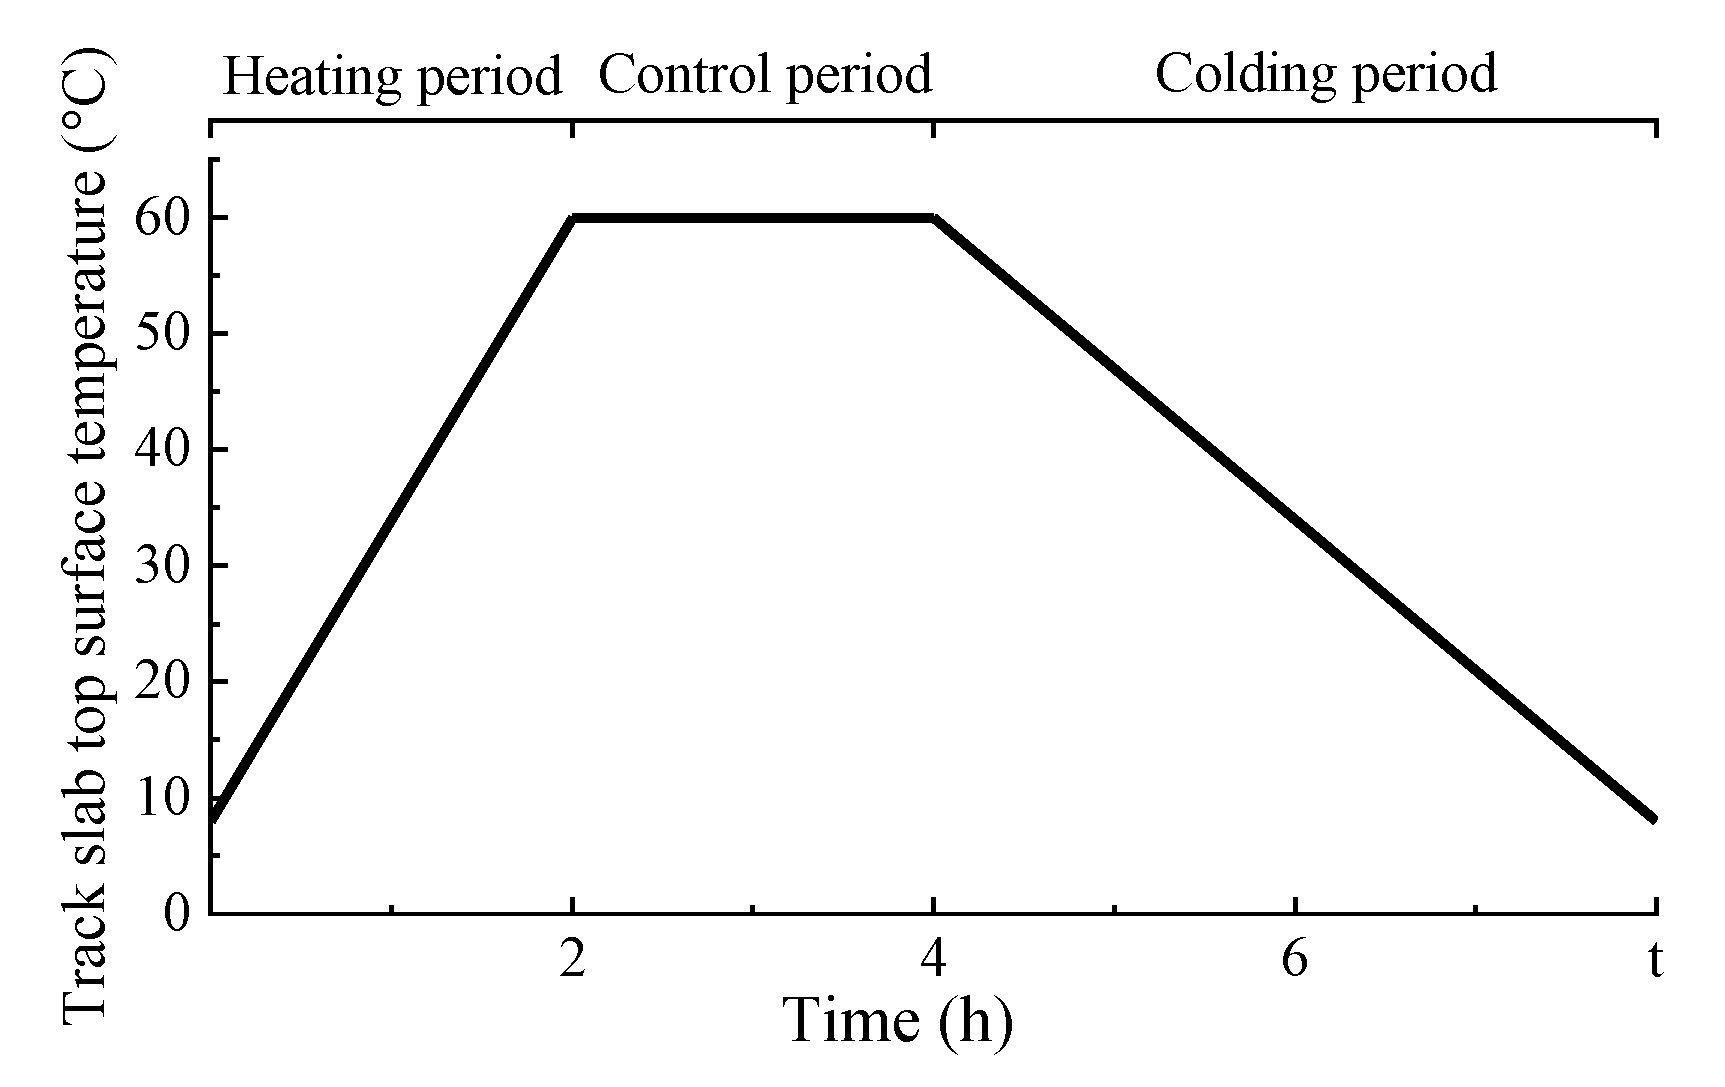
The temperature load was increased from 8 °C to 60 °C for 2 h and then cooled naturally to room temperature as a cycle process. Each cycle loading process was divided into three stages: the temperature rising (heating) period, the temperature control period and the temperature drop period. The normal sunshine temperature generally starts from 8:00 and reaches the highest temperature after approximately 6 h at 14:00. To shorten the test time, the heating rate was controlled by adjusting the power, quantity and heat preservation measures of the heating lamps. The time required to control the heating period of the test is approximately 2 h, simulating the rapid temperature rise under the rapid extreme weather condition. In the temperature control period, the time was maintained to 2 h through the temperature control equipment. The design temperature loading system is shown in
Figure 3.
2.2.2. Temperature Load Implementation Method
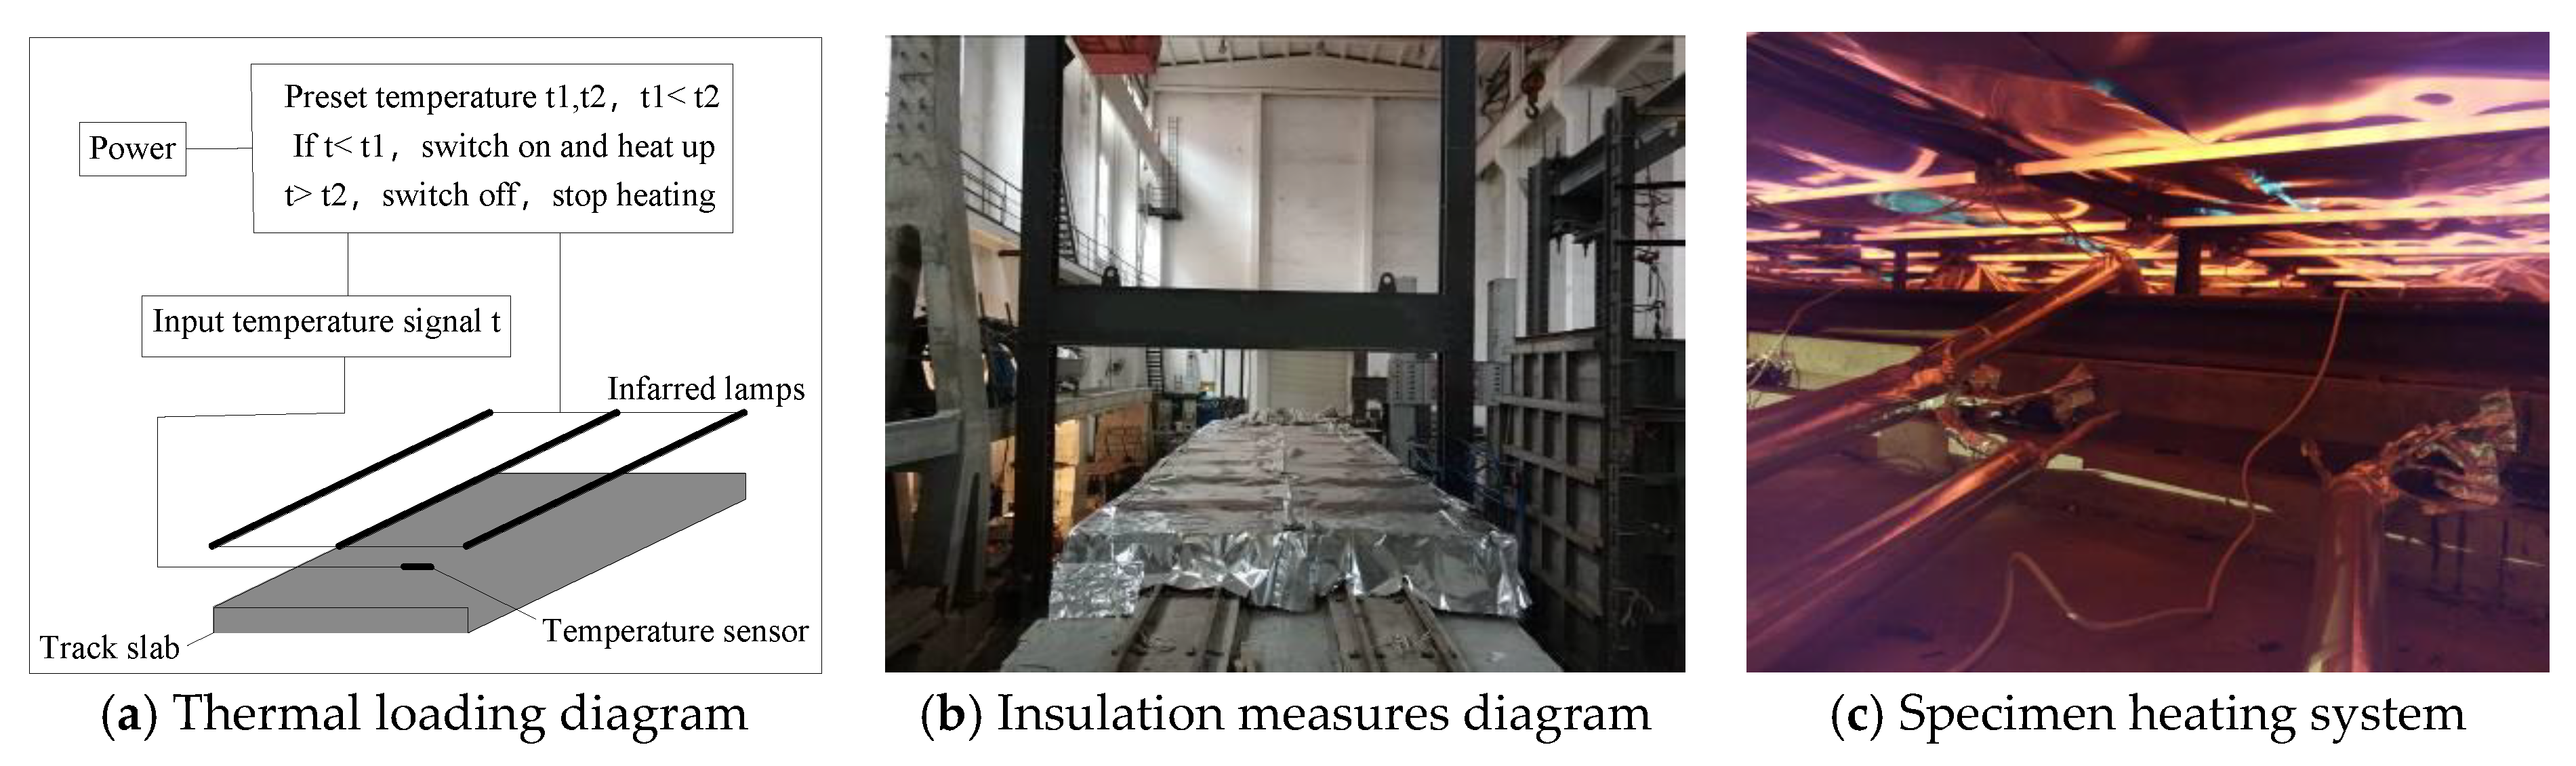
With the far infrared heating lamp, the temperature control switch and the temperature sensor, a set of temperature loading equipment capable of heating and controlling the temperature of the track structure was designed, as shown in
Figure 4a. The infrared heating lamps were 1.2 m long with a power of 1.2 kw. In total, 48 lamps were arranged at a distance of 0.2 m above the track slab top surface. The lamp tubes were divided into 8 groups along the longitudinal direction of the bridge. The entire length of the middle bridge was covered, with an extension of 1 m on each side bridge. In each group, six lamps were arranged side by side along the transverse direction of the bridge with a spacing of 0.5 m. A temperature sensor was arranged on the surface of the track slab under each group of lamps and was connected with the temperature control switch to control the track slab top surface temperature.
To improve the temperature loading efficiency, shorten the time required for temperature rise, mitigate the energy dissipation and achieve a good temperature rising effect, tin foil paper and aluminum silicate fiber blankets which have insulation and heat-resistant properties were used around the lamp holder, as shown in
Figure 4b. To effectively use the lower natural environment temperature at night to cool down the structure, the thermal loading started at 18:00. The temperature control switch parameters of t1 = 59 °C and t2 = 60 °C were preset. When the control switch is on, the infrared lamp heats up the surrounding environment of the track structure. After a temperature rising period of approximately 2 h, when the temperature sensor on the track slab top surface measures the maximum preset temperature t2, the temperature control switch automatically switches off to stop the temperature rise, and the temperature gradually decreases to t1, at which point the temperature control switch automatically switches on to raise the temperature to t2. This is repeated over a time period of approximately 2 h, achieving a temperature control phase. Finally, the power switch is turned off and the cooling period starts. The temperature loading on the test site is shown in
Figure 4c.
2.3. Experiment Content and Methodology
2.3.1. Temperature Monitoring
The JMT-36B temperature sensor was used for the temperature measurement. The JMT-36B temperature sensor uses the conductivity of a semiconductor (PN junction) to change regularly with the change of temperature. The PN junction is packaged as a chip to achieve high precision, high reliability and high stability of the temperature measurement [
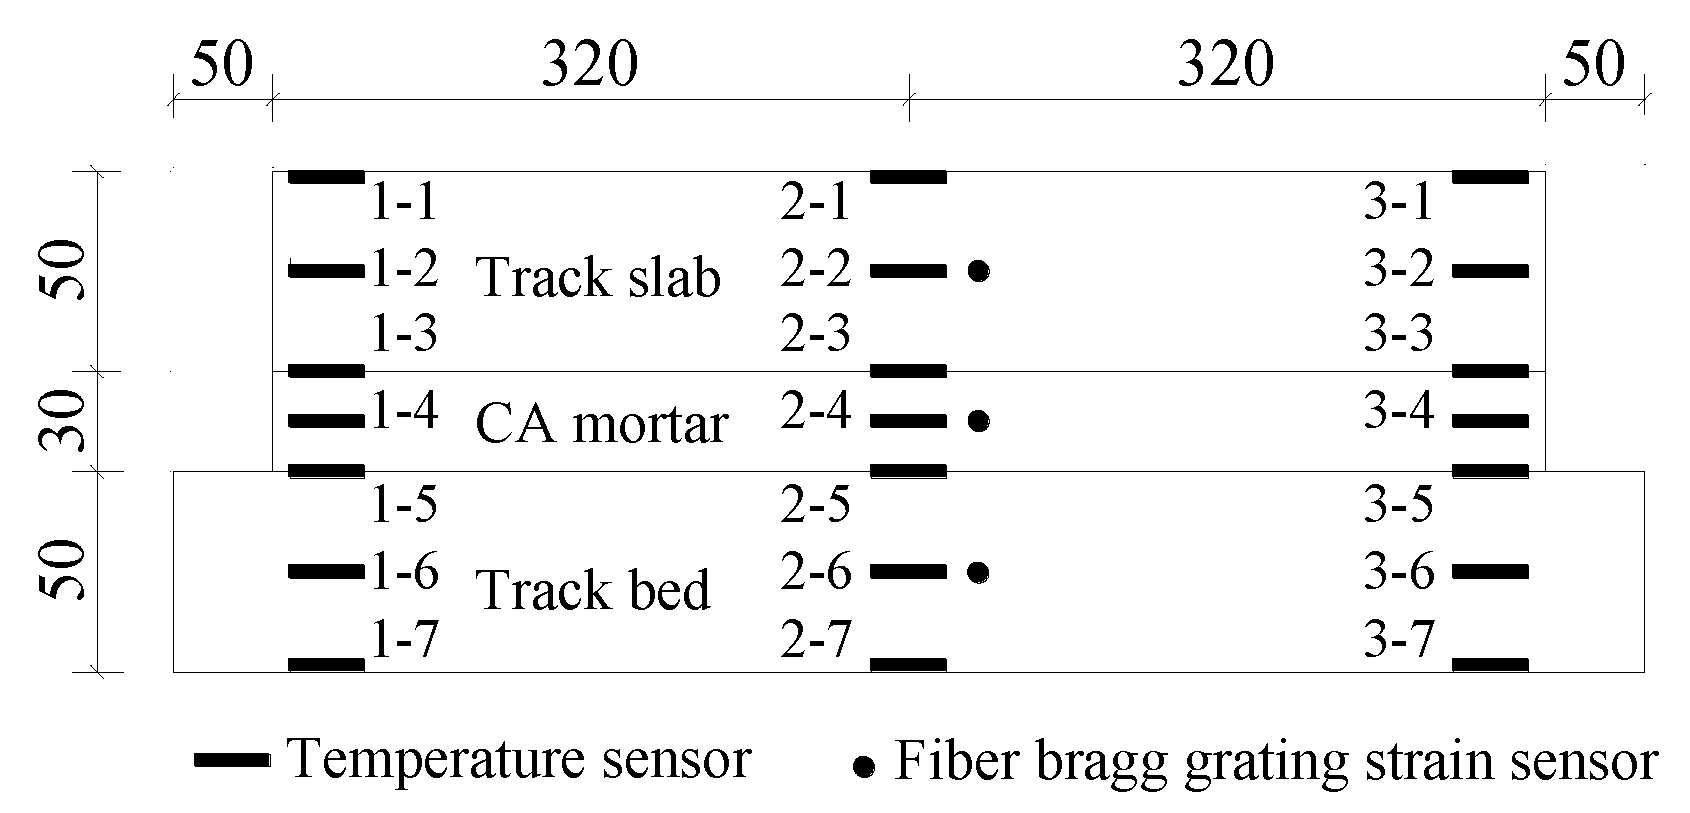
31]. Because the structure of the two track lines and the thermal load to which they are subjected are completely symmetrical, one of the lines was selected to embed the temperature measurement point. Three rows of temperature measuring points were buried at the mid-span section and the end section of the middle bridge. In each section, three columns of temperature measuring points were arranged horizontally and three columns of temperature measuring points were arranged vertically in each of the structural layers, as shown in
Figure 5. Temperature data were collected every 3 min using a JMZX-3001 comprehensive tester.
2.3.2. Strain Monitoring
Strain measuring points were arranged at the mid-span section, 1/4-span section, and support section of both track lines. The strain of the slab-track concrete and the CA mortar were measured by the distributed Fiber Bragg Gratings (FBG) strain sensor. The FBG strain sensor was embedded before the concrete pouring or the CA mortar infusion. The moi-sm130 FBG demodulator was used for the data acquisition. The layout of the strain measuring points is shown in
Figure 4.
2.3.3. Displacement Monitoring
The 5G10X-series linear displacement gauge and the DH3820 collector were used to measure and collect the displacement data, including the overall camber and the relative displacement between the ballastless track-bridge structural system layers under the thermal load. A displacement gauge was installed at the bottom of the concrete box girder to measure the overall camber of the structure. Displacement measuring points were arranged at the support sections of the beam, 1/4-span section, 3/4-span section and mid-span section of both sides of the concrete box girder transverse section.
The relative displacements between the track system structural layers include the vertical and horizontal relative displacement between the track slab and the CA mortar, the CA mortar and the track bed, and the track bed and the concrete box beam, which are also measured by displacement gauges. When measuring the relative displacement between the layers, the displacement gauge is fixed on one of the track structure layers by a rigid pad, and the top bar of the displacement gauges is in contact with the steel pad fixed on the other layer, as shown in
Figure 6.
2.4. Static Loading before and after the Repeated Thermal Loading
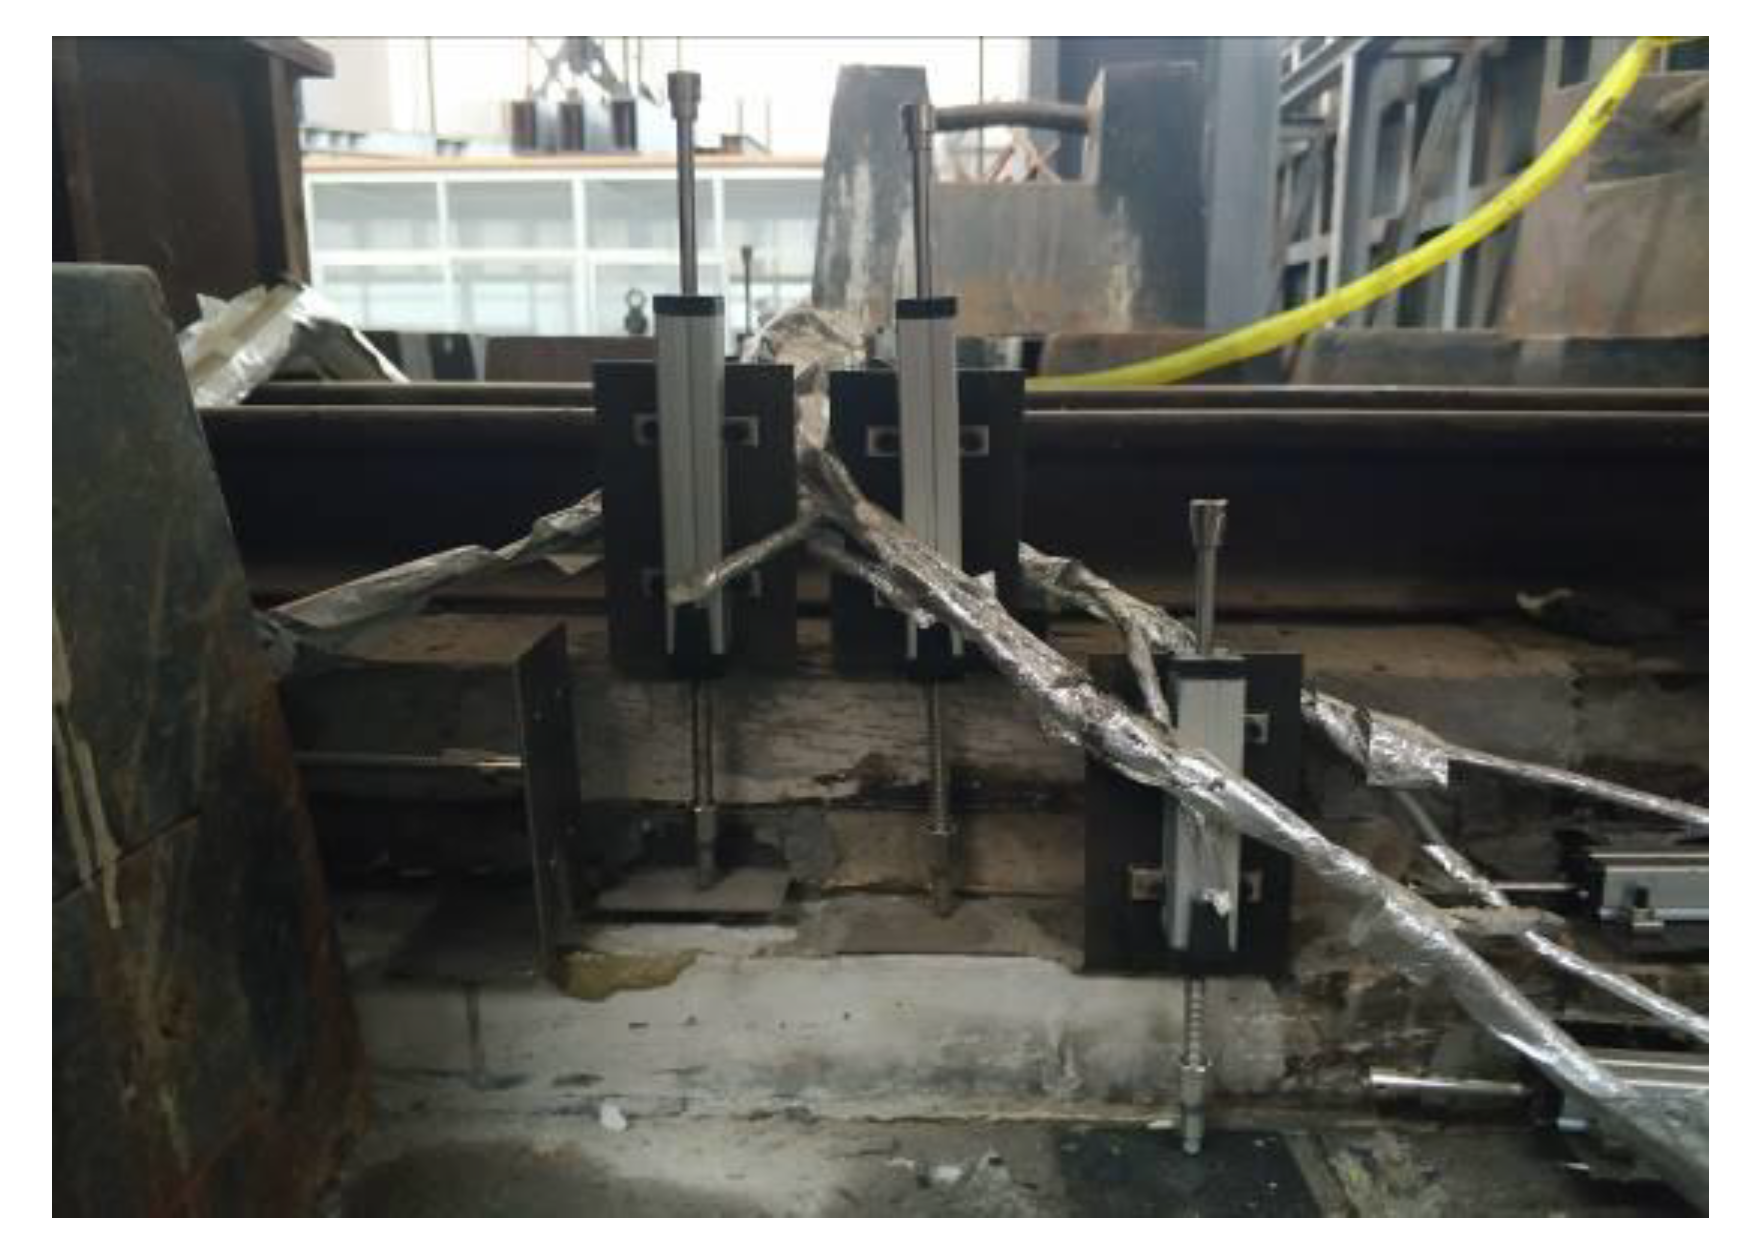
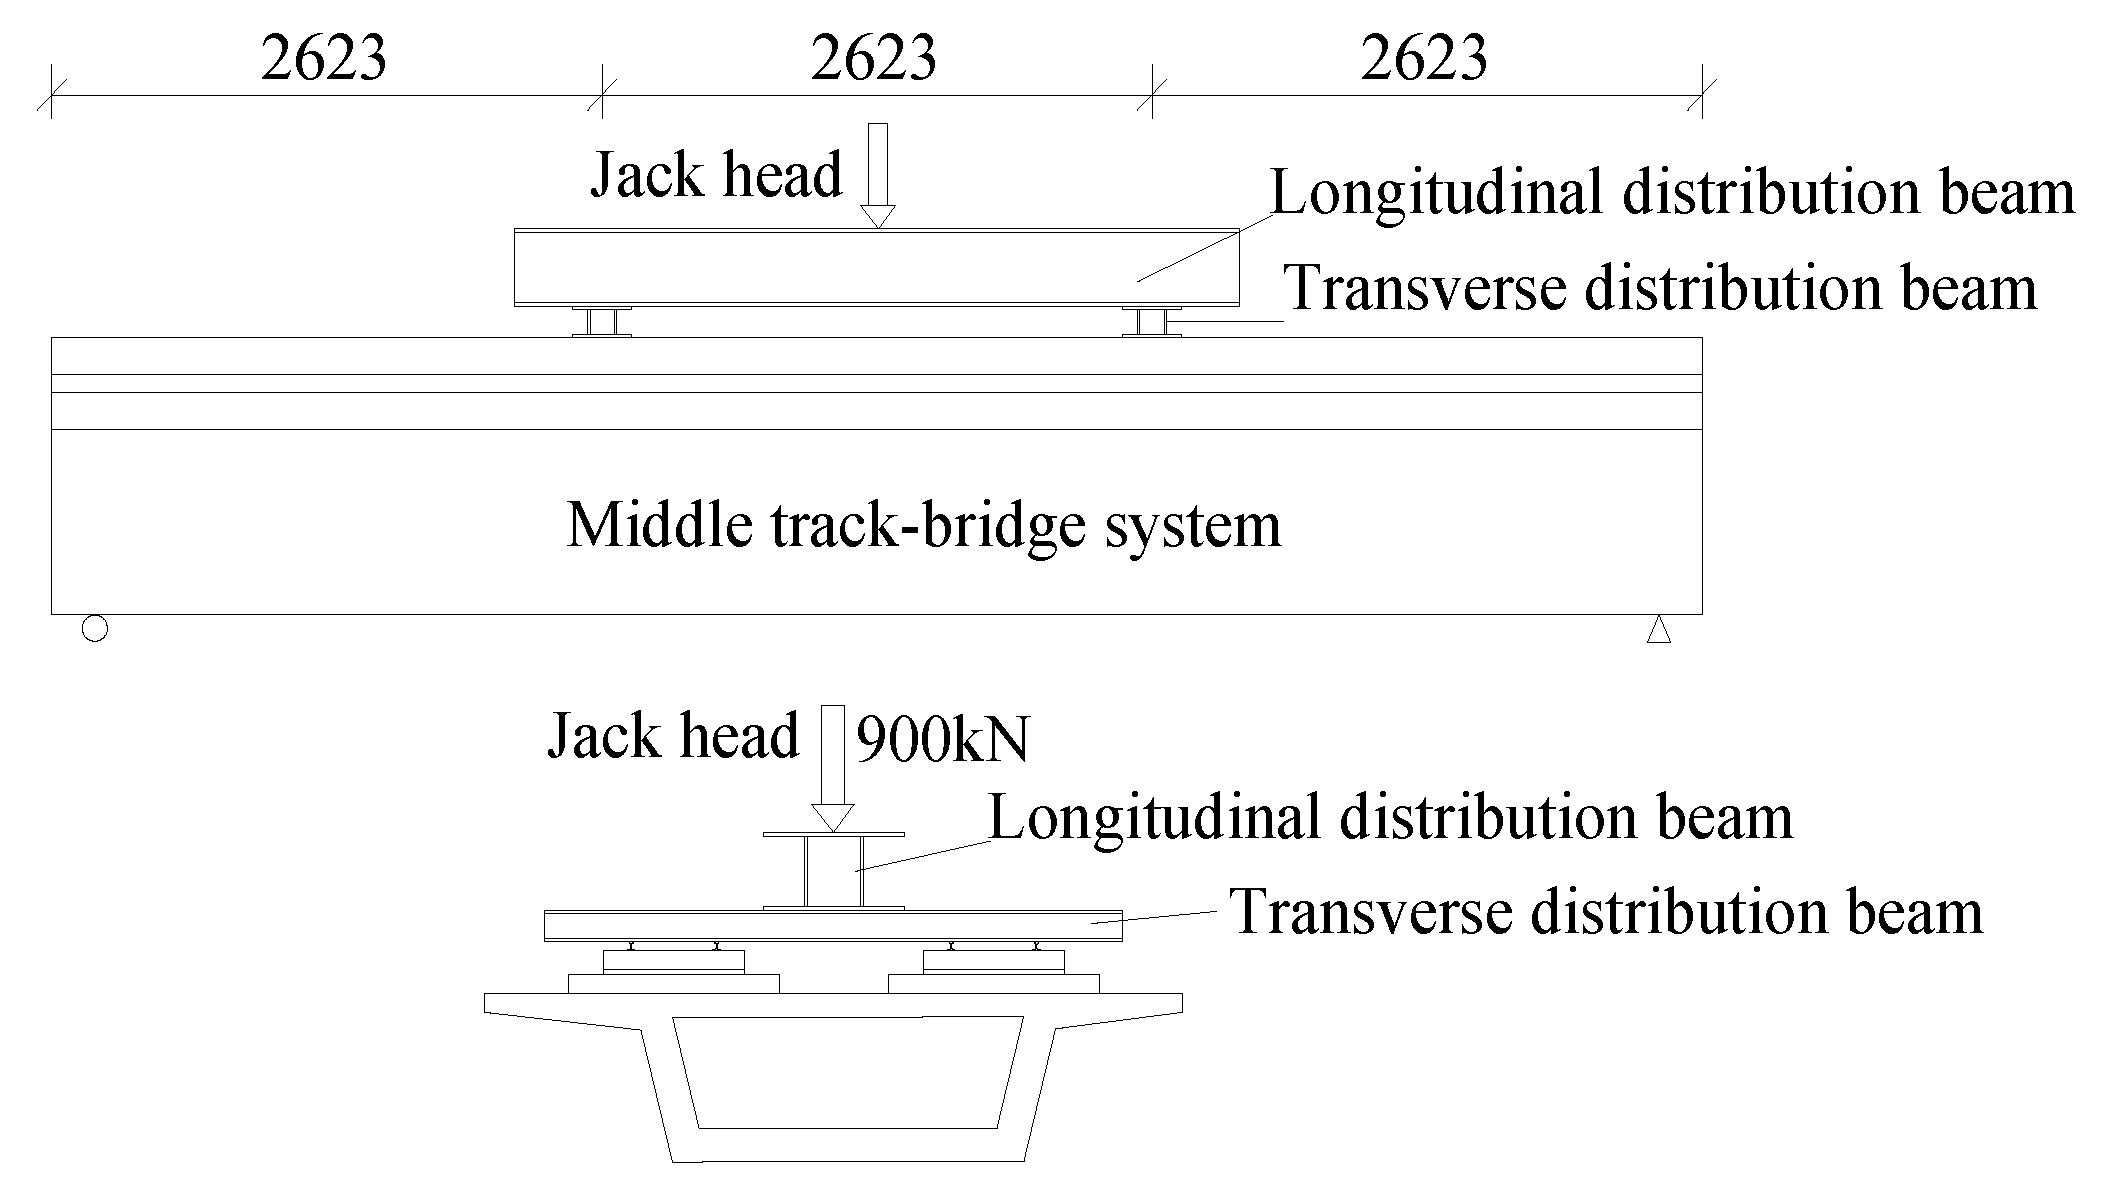
Before and after the repeated thermal test, a three-point static load test was carried out on the structure to obtain the stress, displacement and stiffness of the structure in the initial state and after the gap is generated. After 18 cycles of thermal loading, the influence of the gap on the stress, displacement and stiffness of the structure was studied by a comparative analysis. A load magnitude of 900 kN was selected to simulate the double-track train load subjected to the ballastless track-bridge structural system. The calculation basis is the stress equivalent principle adopted by the similarity design of the specimen such that the stress in the mid-span upper and lower concrete edges of the specimen subject to a static load is equal to the stress at the mid-span edges of the prototype structure under the load of the train. The three-point static test was performed by using a loading head in the mid-span, which is an equally divided load into two three-point cross sections through a distribution beam, as shown in
Figure 7.
3. Experimental Results
3.1. Measured Thermal Load of the Track Structure
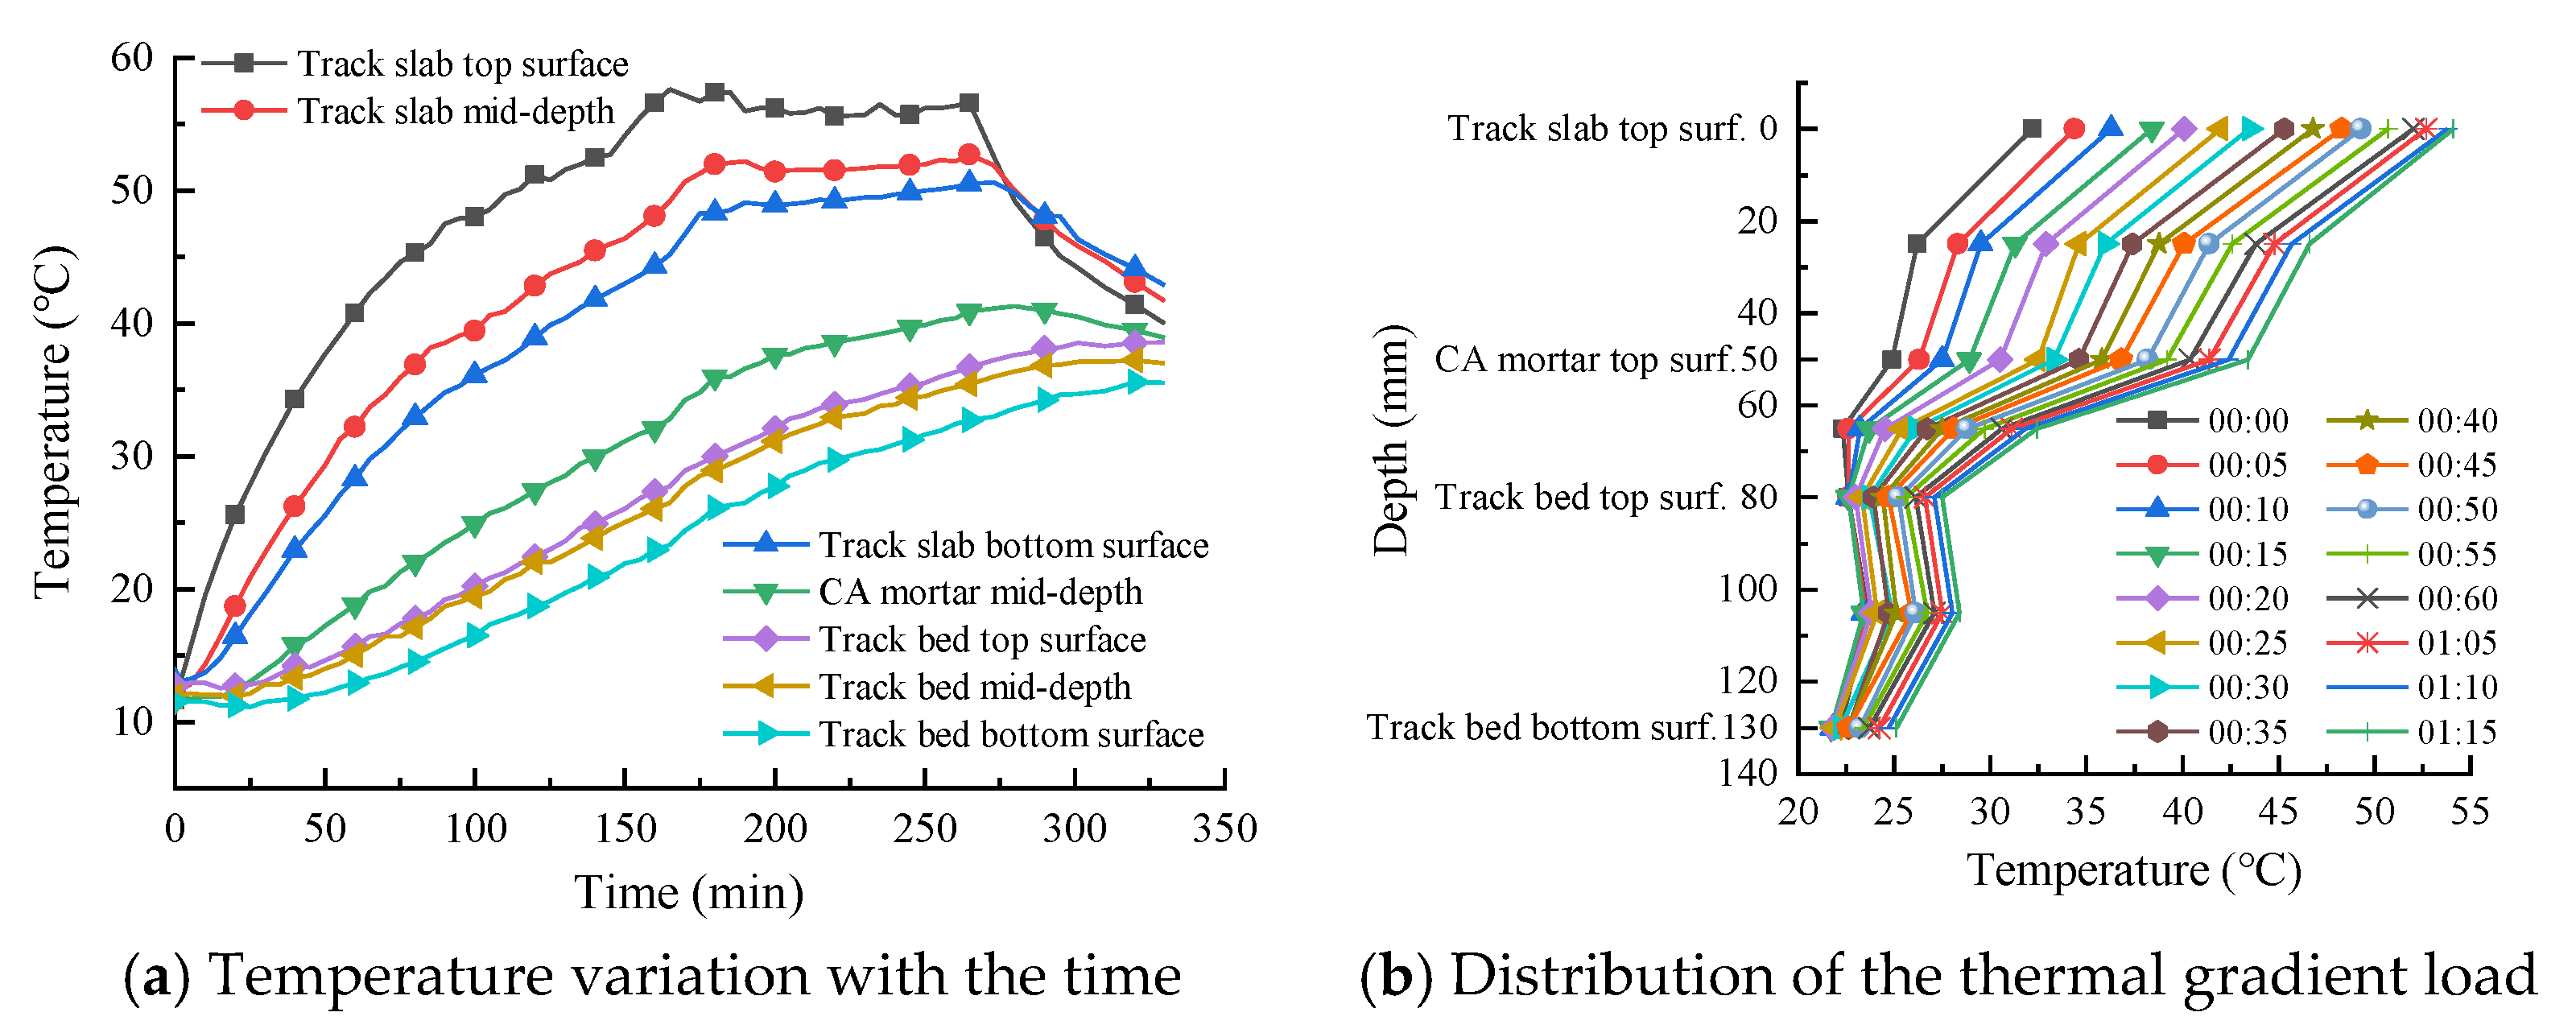
Figure 8a shows the vertical distribution of the variation of the track structure layers’ measured temperature according to the loading time. During the thermal loading process, the internal temperature of the track slab fluctuates greatly, while the fluctuation of that of the CA mortar and the track bed is relatively insignificant. There is a large temperature change lag within the CA mortar and the concrete bed compared to the track slab. This is due to the large difference between the thermal behavior of the CA mortar and that of the concrete material. The thermal conductivity of the CA mortar is 0.261 w/m·°C, which is far lower than the 2.2 w/m·°C of the concrete [
32]. The CA mortar plays a role in heat preservation and insulation when the ambient temperature changes around the track structure. When the track slab top surface temperature is approximately 60 °C, the temperature difference between the upper and lower surfaces of the CA mortar layer is nearly 16.9 °C due to the poor thermal conductivity of the CA mortar material.
The thermal gradient distribution in the track structure during the heating period is shown in
Figure 8b, which that during the temperature rising period, the track slab is subjected to a large thermal gradient load. The thermal gradient within the track slab is nonlinearly distributed and gradually decreases with the increase of the distance to the track slab top surface. The temperature difference between the upper and lower surfaces of the track bed is not significant, indicating that the thermal gradient load within the track bed is insignificant.
3.2. Initiation and Expansion Law of the Interlayer Gap
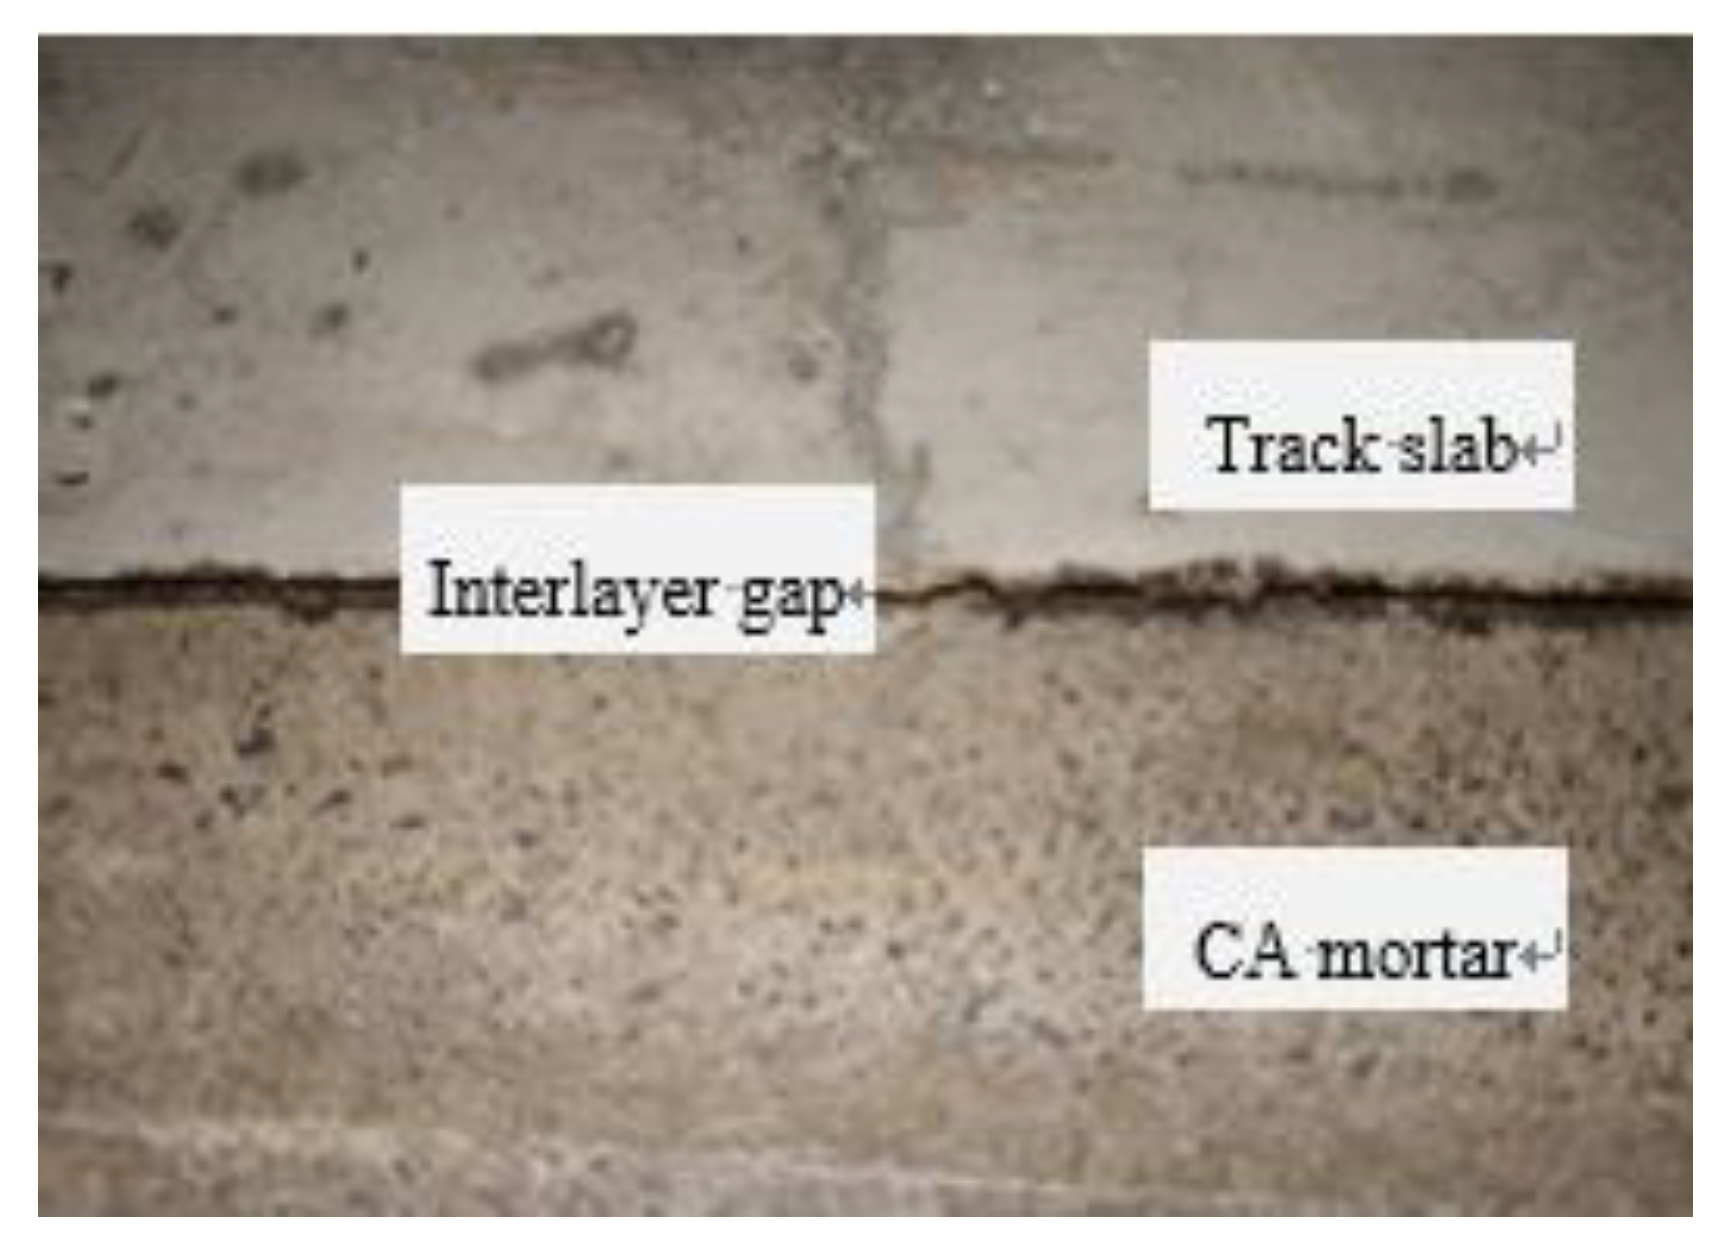
During the repeated thermal loading, an interlayer gap is generated and expanded with a maximum width of approximately 0.5 mm between the track slab and the CA mortar near the fixed end section with the shear slots, as shown in
Figure 9.
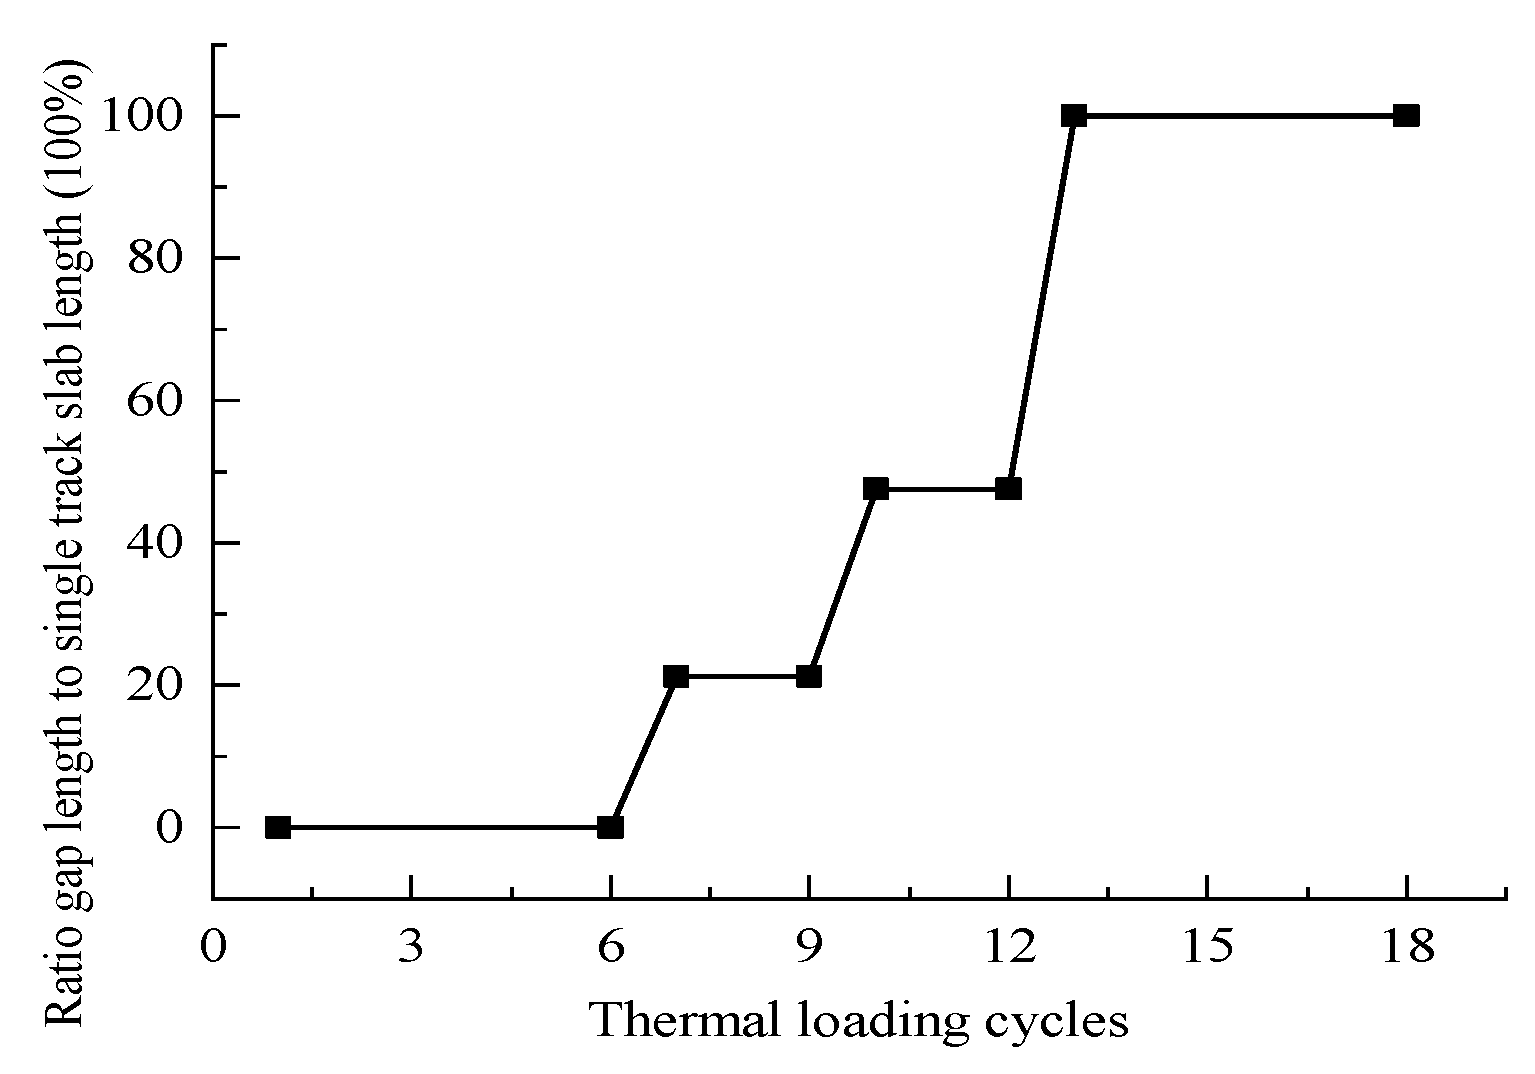
The length of the interlayer gap extends in a “stepped” manner with the increase of the number of thermal cycles, as shown in
Figure 10. The development process of the gap can be divided into three stages—initiation, expansion and stabilization—according to the expansion law of the gap length. The initiation stage of the gap occupies the first six thermal loading cycles. When the sixth thermal loading is completed, the interlayer gap is observed for the first time between the track slab and the CA mortar near the fixed end of the shear slot with a length of 340 mm, accounting for 21.3% of a single-track slab length. Starting from the 7th to the 12th thermal loading cycle, the interlayer gap gradually extended toward the mid-span. When the 12th thermal loading cycle was completed, the entire track slab near the fixed end of the beam was completely separated from the CA mortar. The gap length was equal to the length of the single-track slab (1600 mm). From the 13th to the 18th thermal loading cycle, no more expansion of the generated gap was observed, and no new gaps were generated. Therefore, the period spanning from the 7th to the 12th thermal loading cycle is regarded as the expansion stage of the gap, and that spanning from the 13th to 18th thermal loading cycle is regarded as the stabilization stage of the gap.
During the 18th thermal loading cycle, the gap only appears in the track slab near the fixed end with the shear slot along the longitudinal direction of the bridge. There is no gap at the sliding end of the beam far away from the shear slots. This shows that the restraint of the shear slots on the free deformation of the track structure is one of the important causes of the interlayer gap initiation under the action of thermal loading. Due to the influence of construction technology, the bond strength of the interlayer interface between the CA mortar and the track bed is far greater than that of the interlayer interface between the CA mortar and the track slab. Therefore, the interface gap mainly occurs between the CA mortar and the track slab. The interface between the CA mortar and the track bed remains intact, and no gap was observed.
3.3. Strain Results under Thermal Load
3.3.1. Track Slab Strain
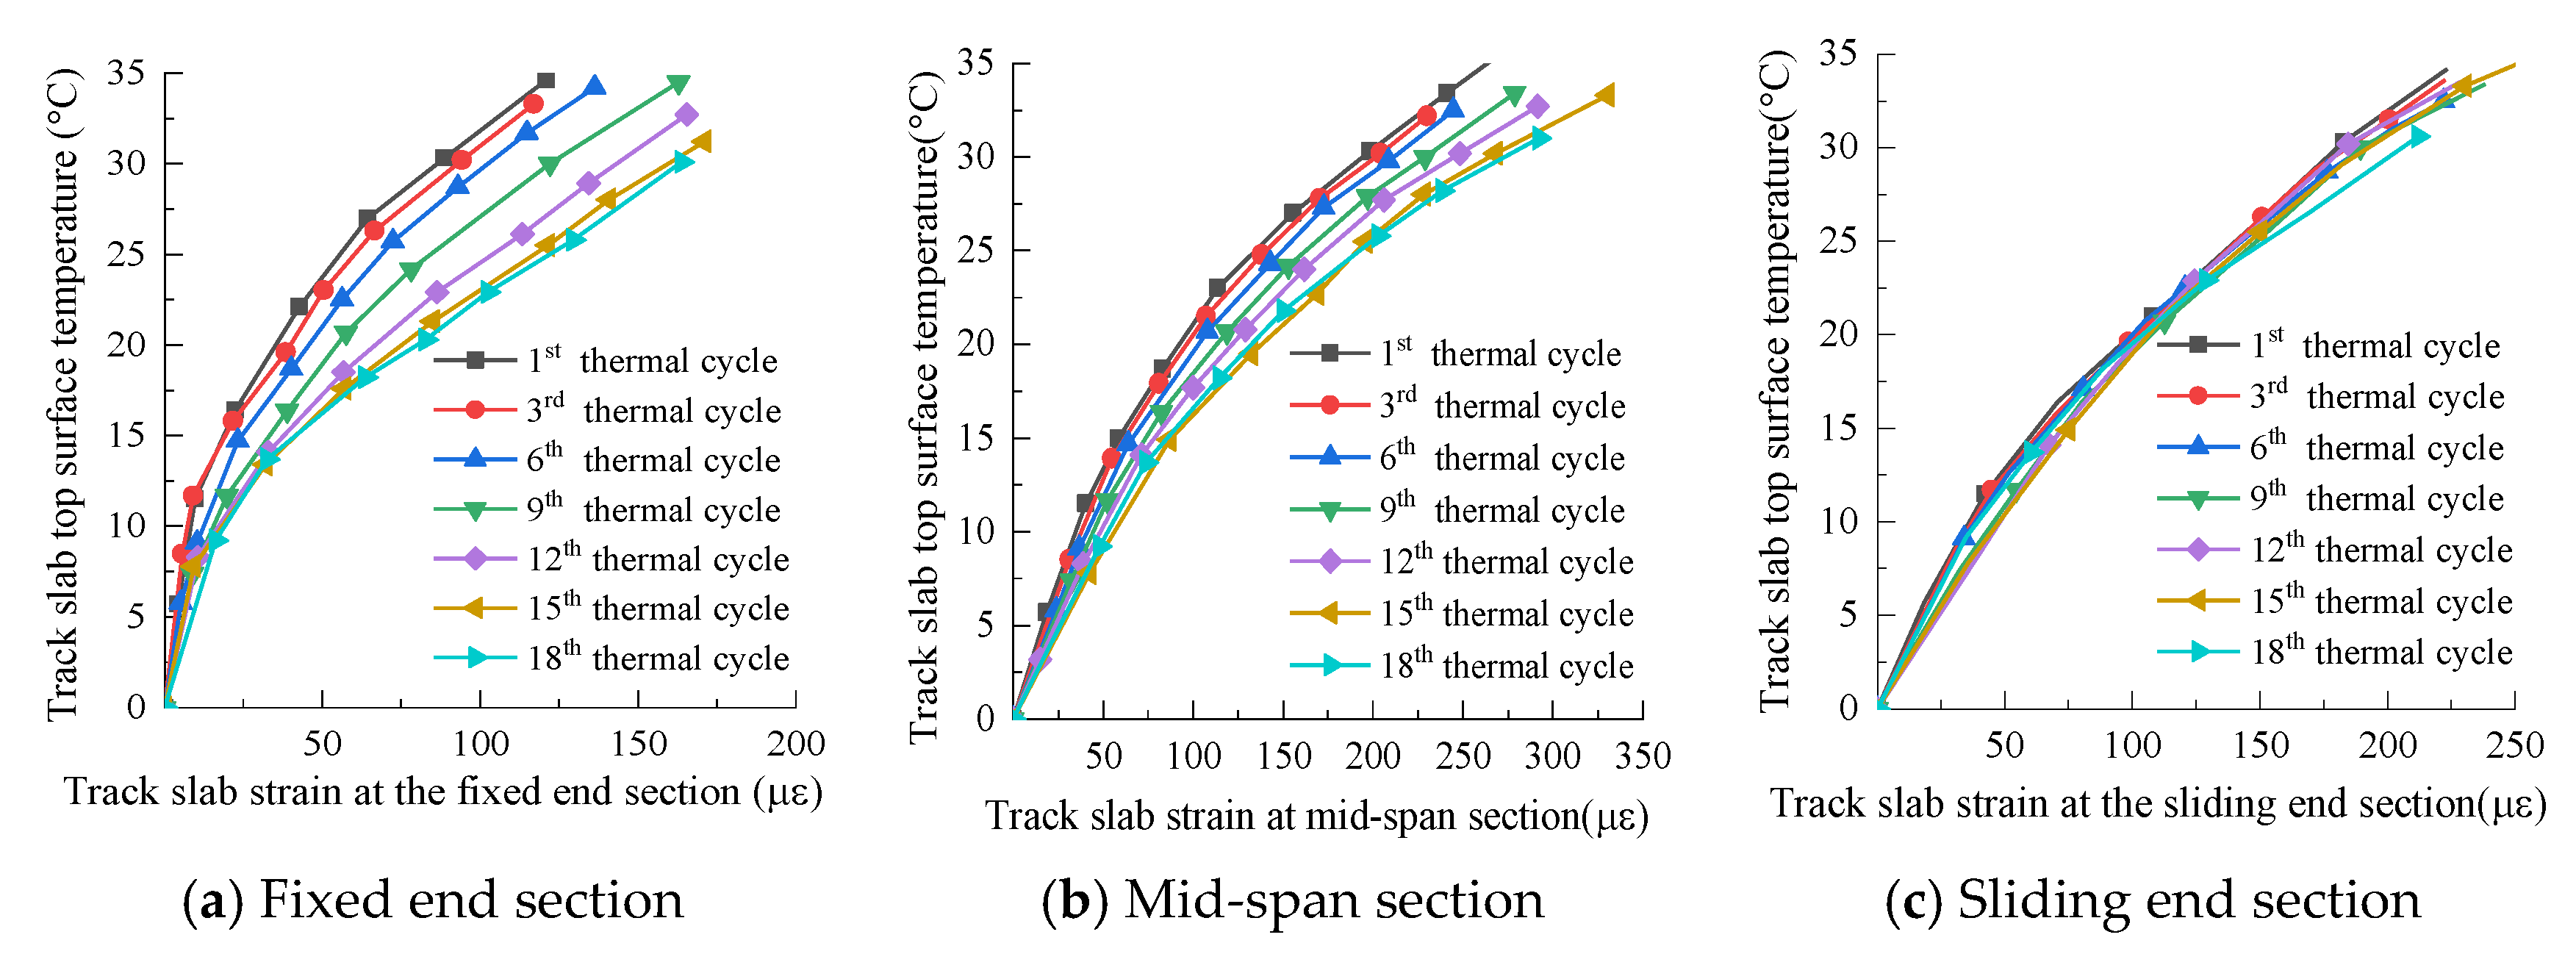
From the processing of the data collected by the fiber grating strain gauges, the variation law of the track slab temperature–strain curve with the number of thermal loading cycle was obtained, as shown in
Figure 11. It can be seen from
Figure 11a,b that at the fixed end section (with shear slots) and at the mid-span section, the temperature–strain plot of the track slab follows the increase of the thermal loading cycle and gradually shifts toward the strain increase direction. The distribution of the temperature–strain plots is relatively dense in the initiation and stabilization stages of the interlayer gap. In the expansion stage, the distribution of the temperature–strain plot is relatively sparse. From
Figure 11c, it can be seen that at the sliding end section (without shear slots), the increase of the thermal loading cycles has no effect on the temperature–strain plot of the track slab; the curves substantially coincide.
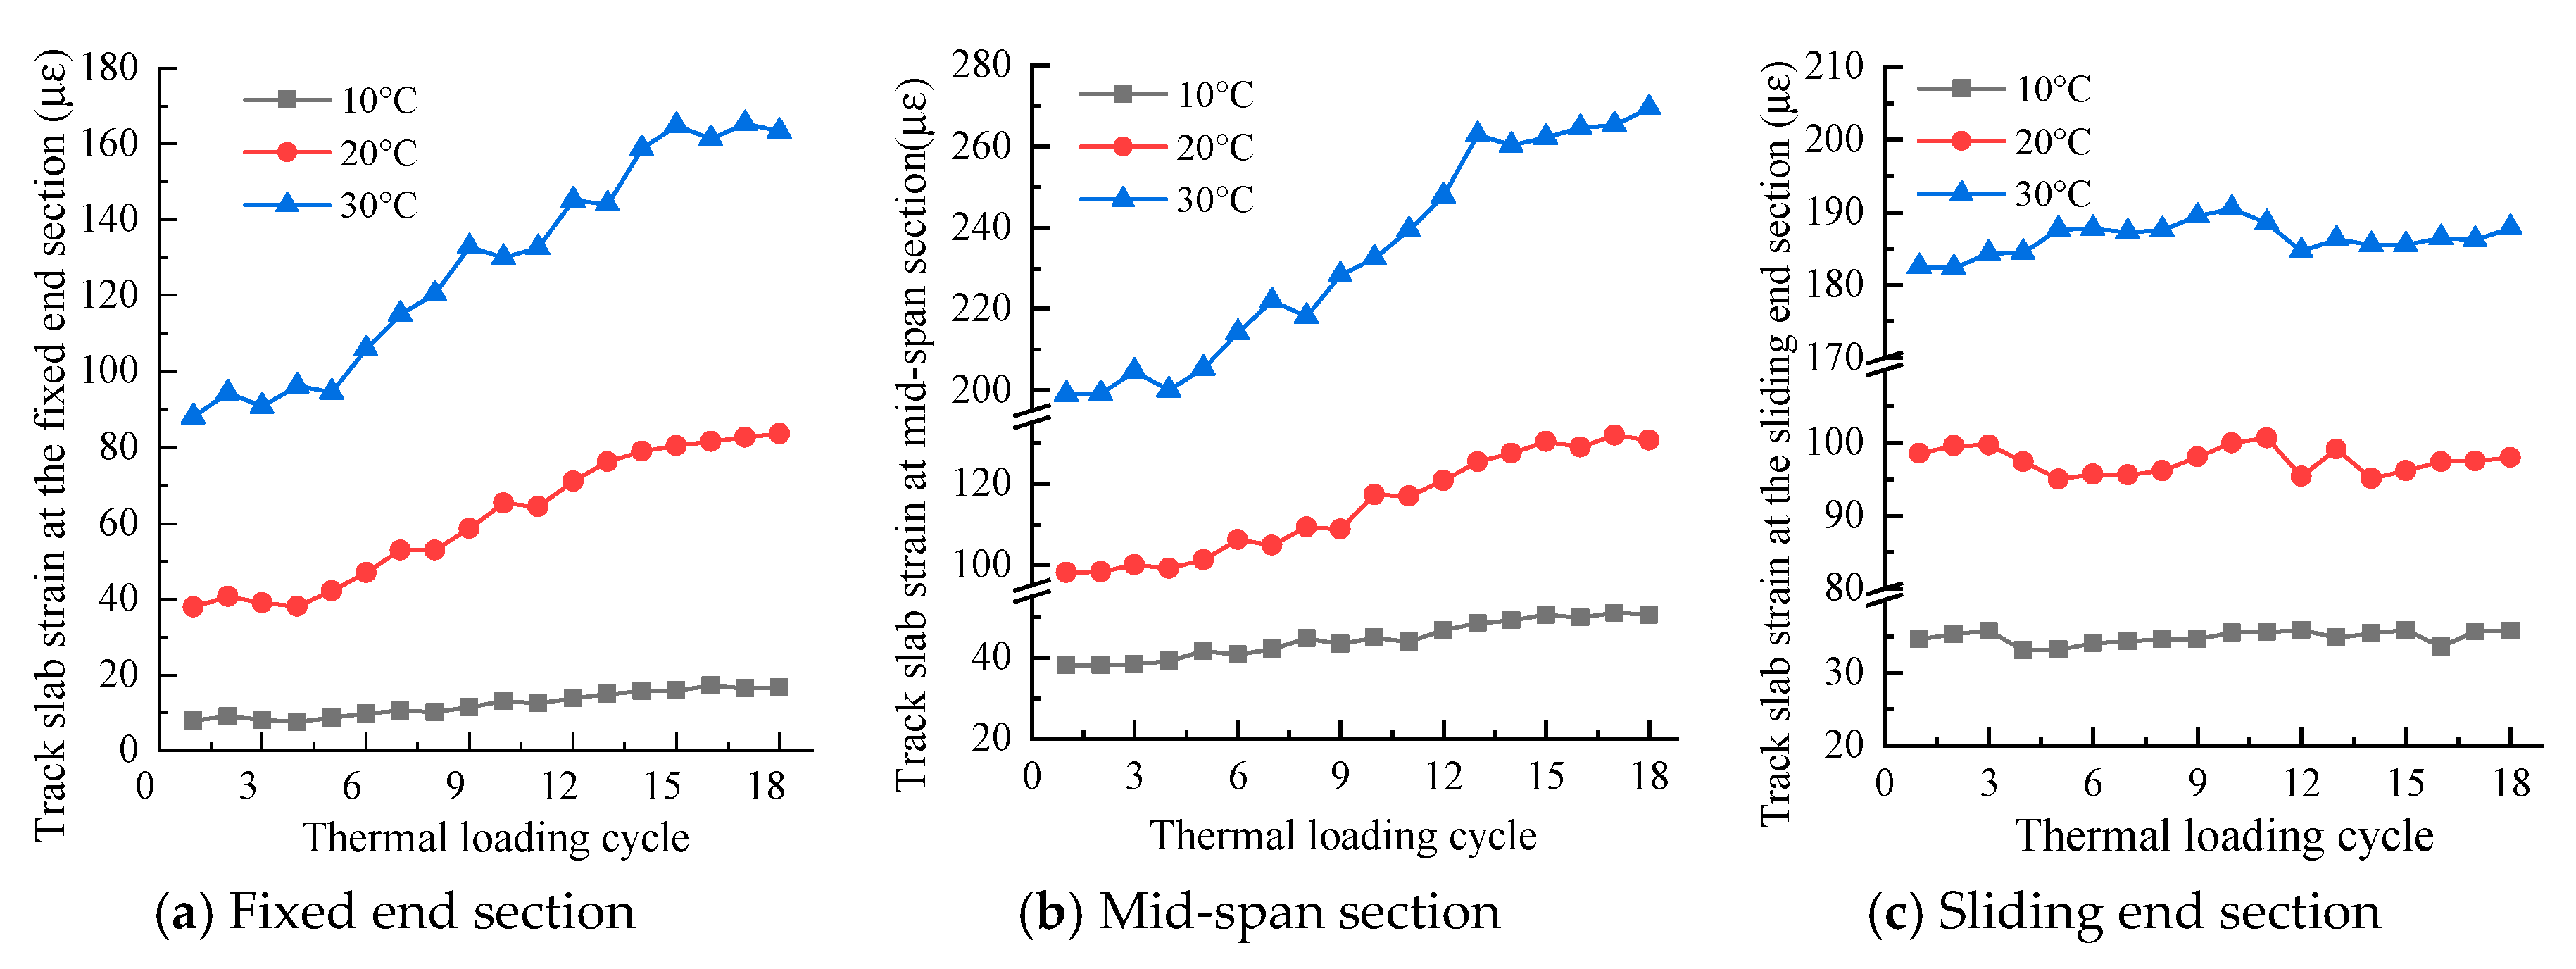
According to
Figure 11, the variation of the track slab strain with the thermal loading cycles can be drawn under the three temperature rising conditions of 10 °C, 20 °C and 30 °C, as shown in
Figure 12. Under the same temperature load, the track slab strain increases gradually with the increase of the thermal loading cycles. Over the three stages of initiation, expansion and stabilization, the strain increase rate of the track slab exhibits a “slow-fast-slow” change law. From the comparison analysis of
Figure 12a–c, it can be seen that at the end of the 18th thermal loading cycle, the increase amplitude of the track slab strain at the fixed end section is relatively large (approximately 100%), followed by that at mid-span (approximately 35%), while the strain increase amplitude at the sliding end section is relatively small (within 5%).
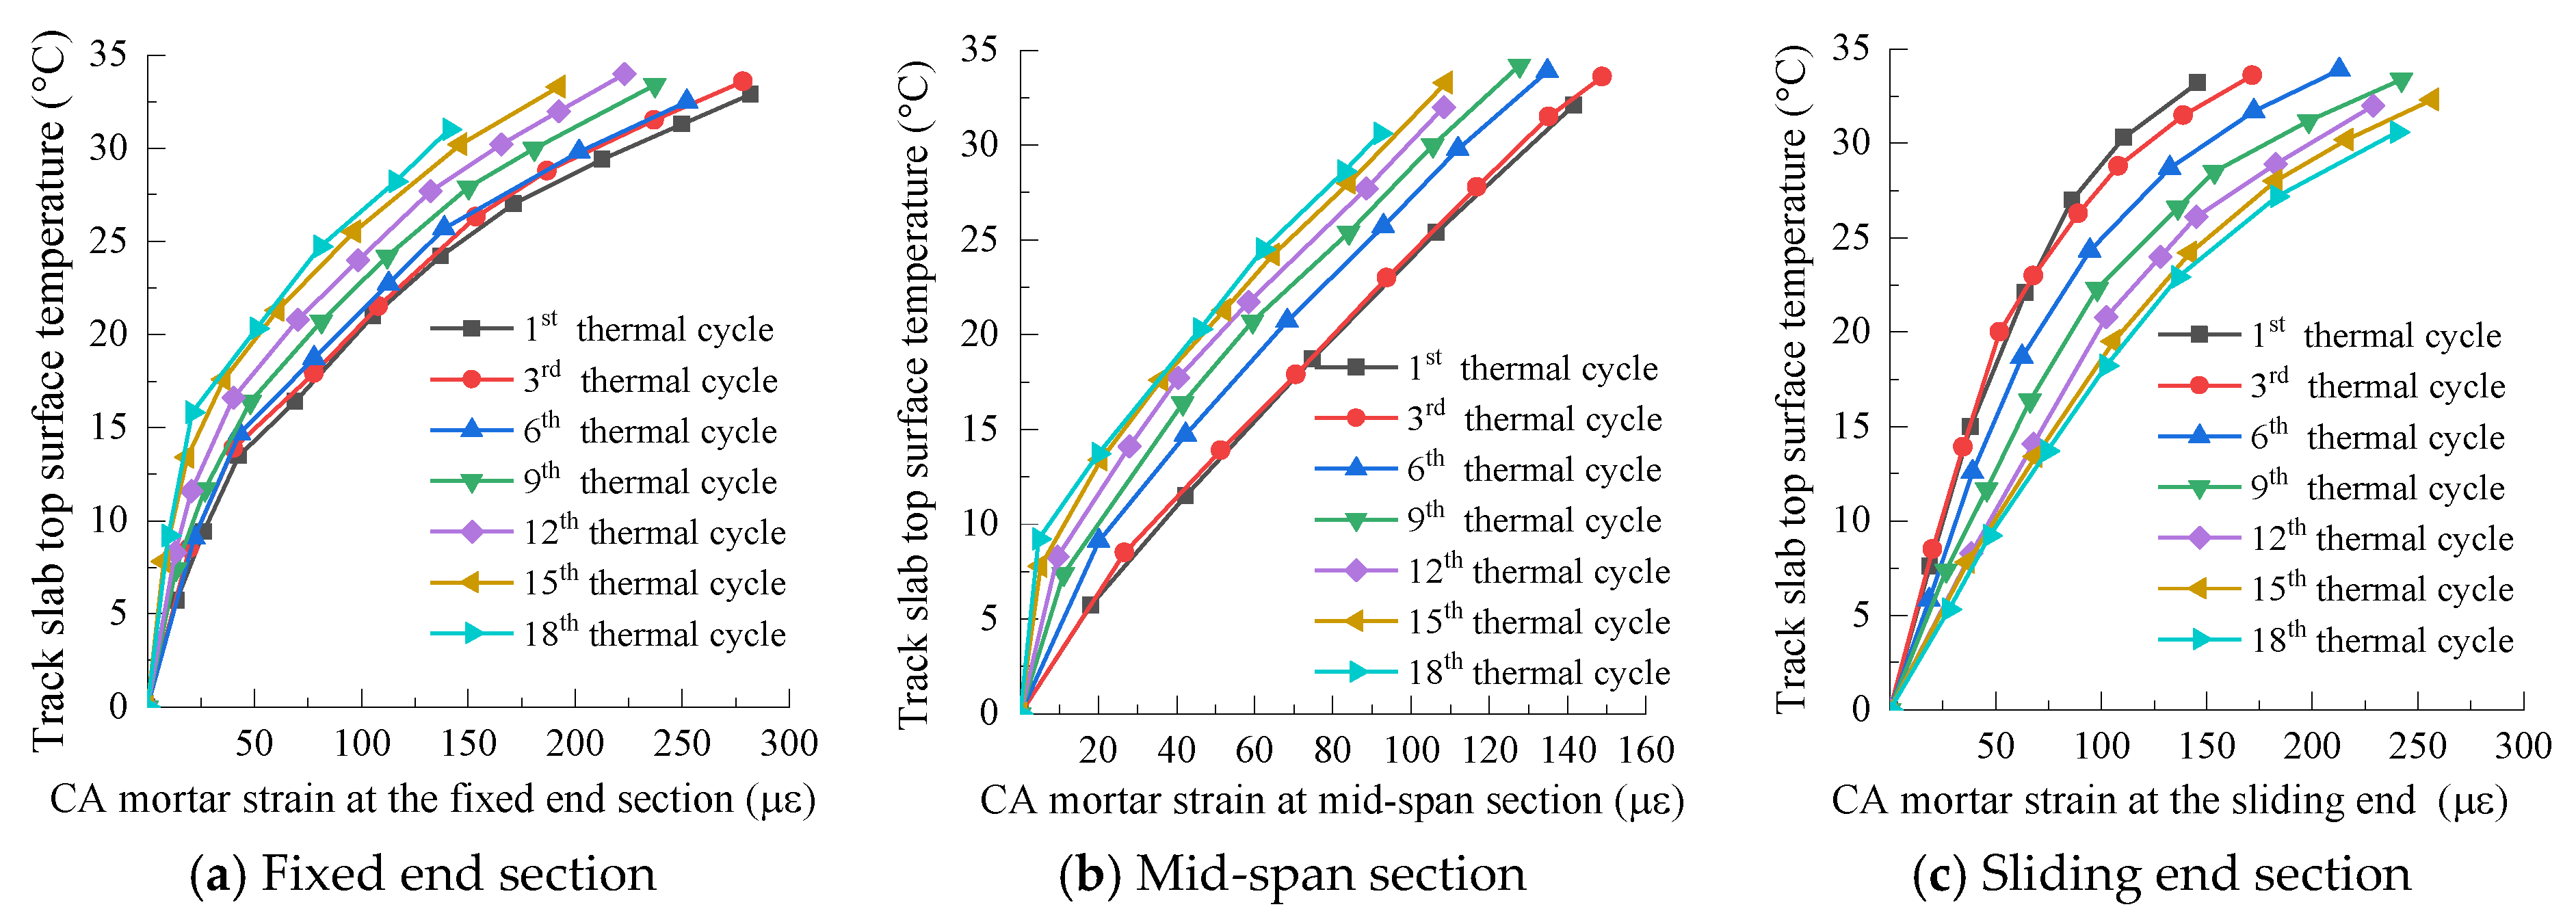
3.3.2. CA Mortar Strain
Figure 13 shows the variation of the temperature–strain plot of the CA mortar with the number of thermal loading cycles. It can be seen from
Figure 13a,b that, with the increase of thermal loading cycles, the temperature–strain plot of the CA mortar at the fixed end section and that at the mid-span section gradually shift toward the strain reduction direction. In the three stages of initiation, expansion and stabilization of the interlayer gap, the plots exhibit a dense-sparse-dense distribution. The CA mortar temperature–strain plot at the sliding end section is opposite to the strain increase direction. However, a dense-sparse-density distribution is also observed at the sliding end section, as shown in
Figure 13c.
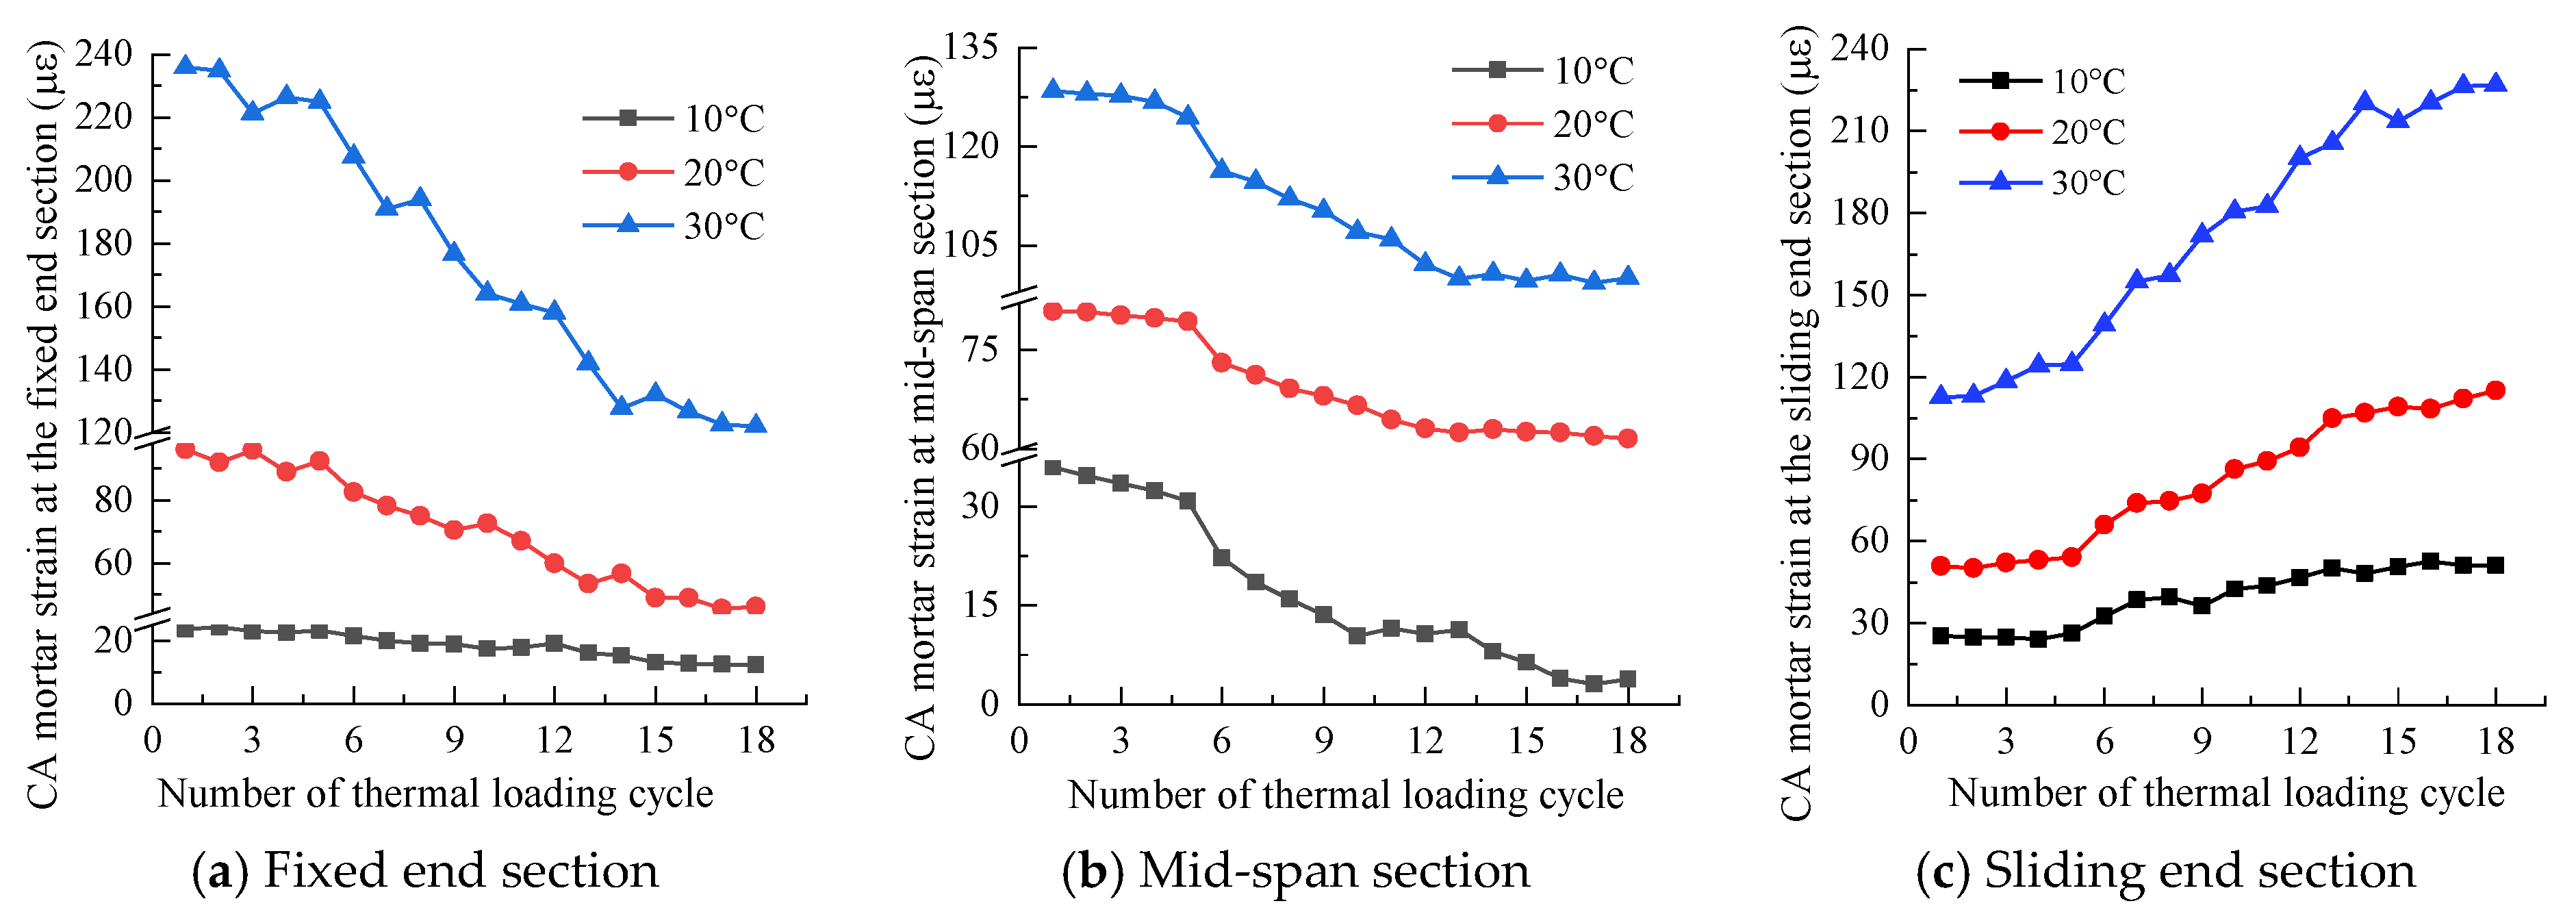
The variation of the CA mortar strain with the thermal loading cycles under the three temperature rising conditions of 10 °C, 20 °C and 30 °C is shown in
Figure 14, which shows that under the same temperature load condition, the CA mortar strains at the fixed end section and the mid-span section decrease gradually, while that at the sliding end section increases gradually with the increase of the number of thermal loading cycles. The CA mortar strain range is substantially consistent with the expansion rate of the gap length during the three stages of interlayer gap development. It can be seen from
Figure 14b that the CA mortar strain in the mid-span section abruptly changes between the 5th and 6th thermal loading cycle, which coincides with the time of occurrence of the interlayer gap.
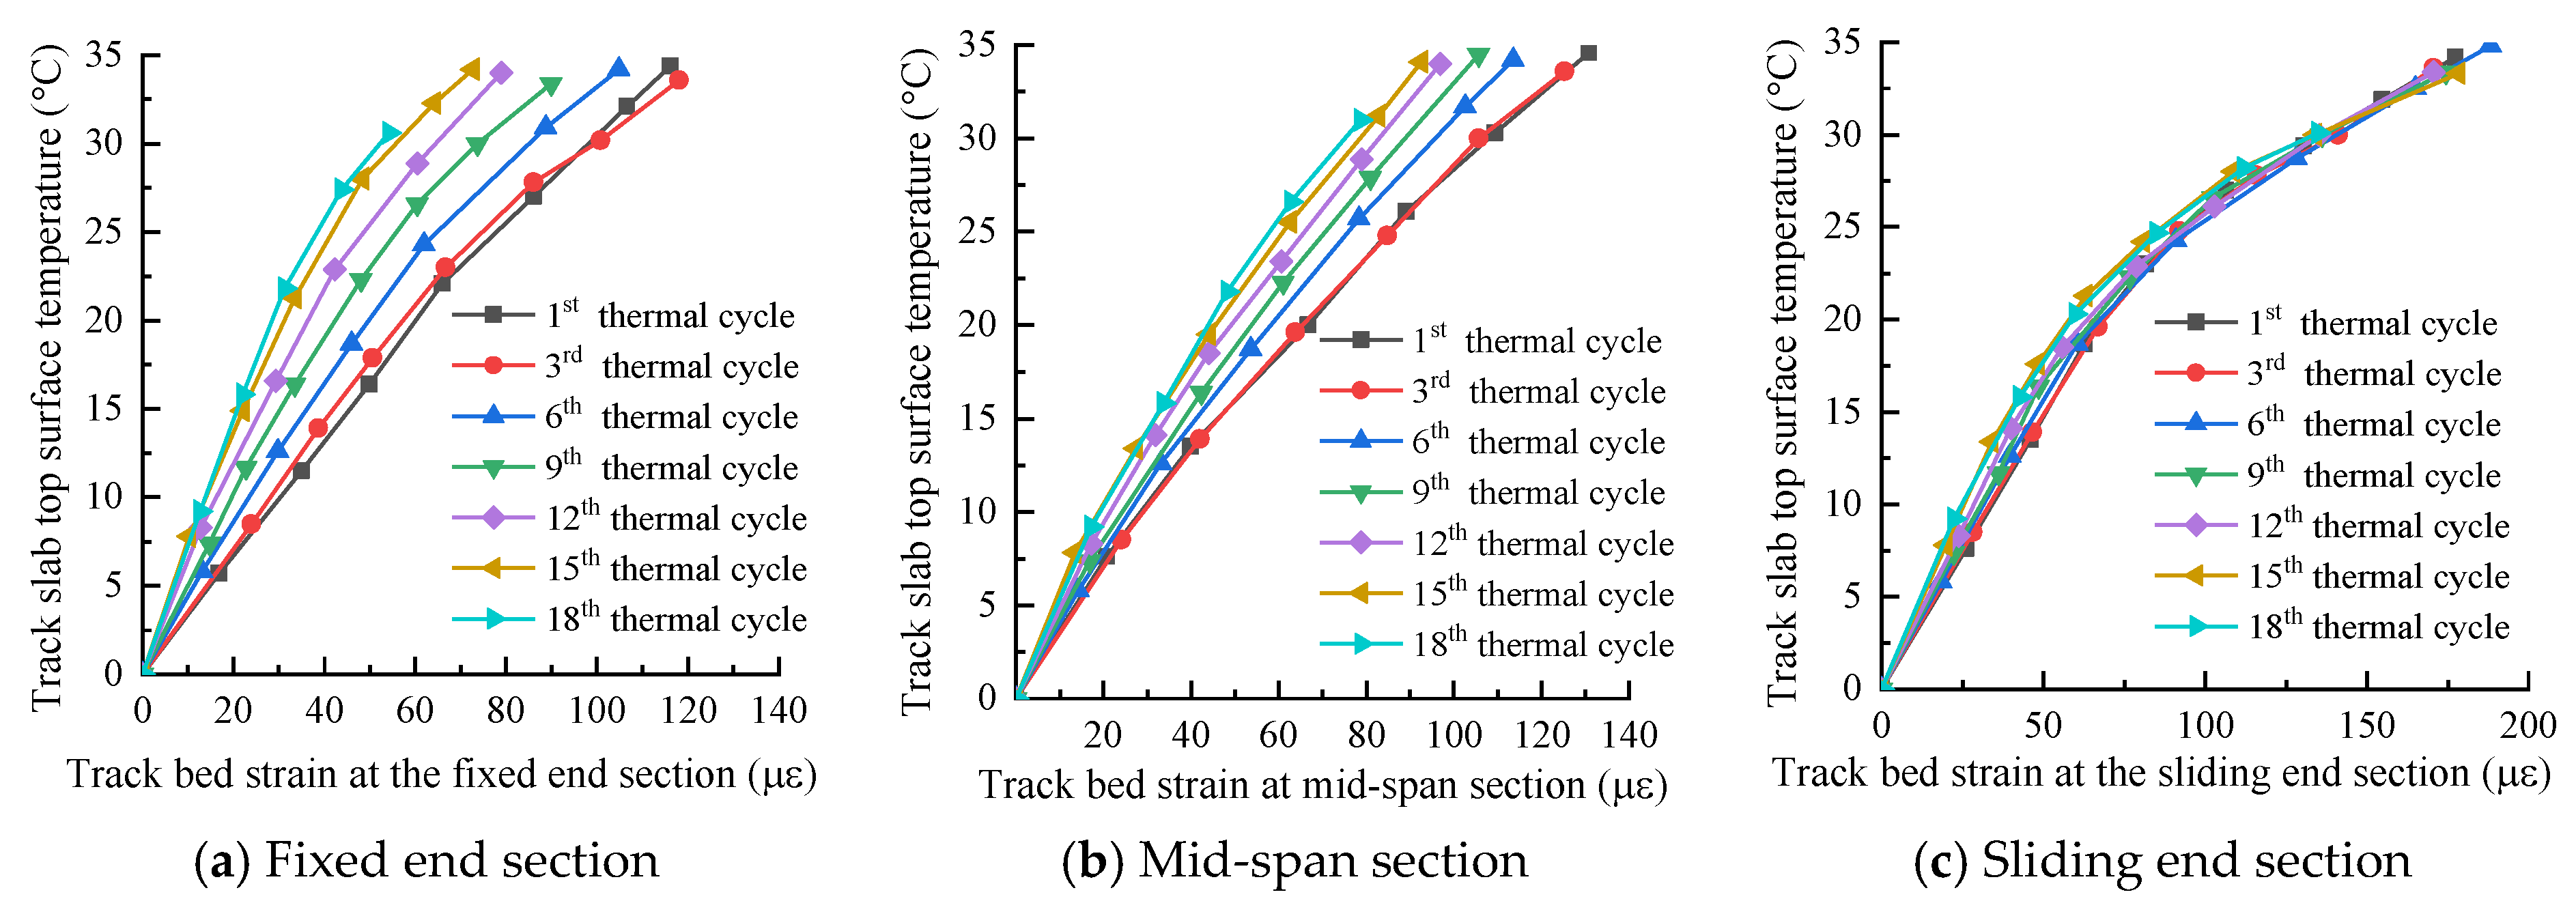
3.3.3. Track Bed Strain
Figure 15 shows the variation of the track bed temperature–strain plot according to the number of thermal loading cycles. It can be seen that with the increase of the number of thermal loading cycles, the temperature–strain plot of the track bed gradually shifts toward the strain reduction direction. In the initiation and stabilization stages of the interlayer gap, the plot distribution is dense and the strain changes at a slow rate, while in the expansion stage of the interlayer gap, the distribution of the plot is sparse and the strain changes rapidly. From comparison analysis of
Figure 15a–c, it can be seen that from the fixed end section to the sliding end section, the interval between the plots of the track bed gradually closes, indicating a gradual decrease in the track bed strain.
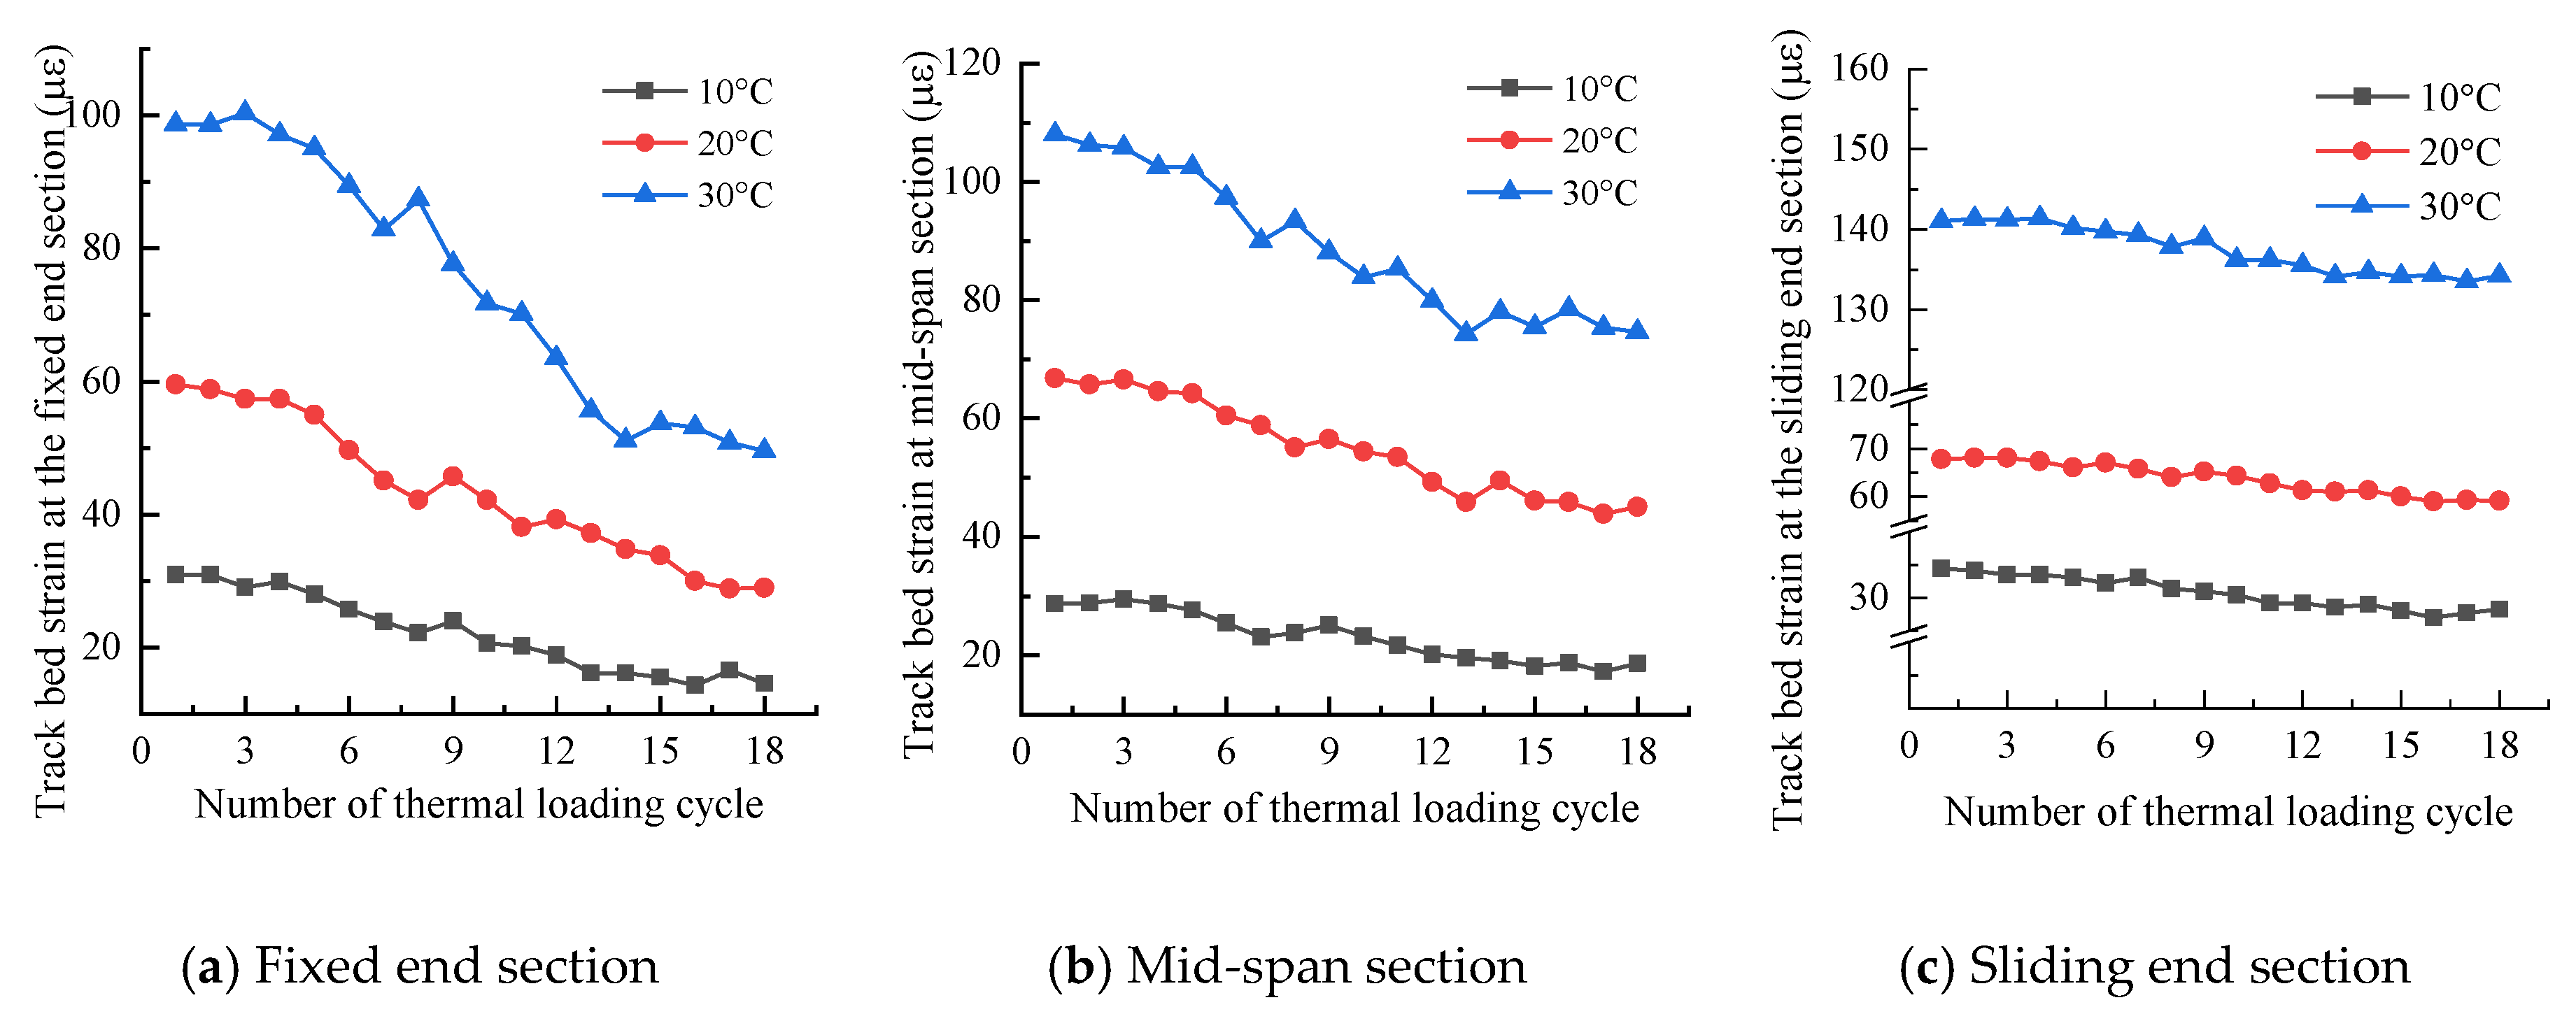
Figure 16 shows the variation of the track bed strain with the thermal loading cycles under the three temperature rising conditions of 10 °C, 20 °C and 30 °C. It can be seen from the figure that under the same temperature load, the track bed strain decreases gradually with the increase of the number of thermal loading cycles; additionally, in the three stages (initiation, expansion, stabilization) of the gap development, the strain reduction rate conforms to the slow-fast-slow variation law. Compared with the first thermal loading cycle, at the end of the 18th thermal loading cycle, a strain reduction of approximately 50%, 30% and 10% is observed at the fixed end section, the mid-span section and at the sliding end section, respectively.
Under the same temperature load, as the number of thermal loading cycles increases, the strain of the structural layer of the track system gradually increases or decreases. After the 18 thermal loading cycles, the strain variations in the different sections of each structural layer with respect to that of the initial condition (before thermal loading) are summarized in
Table 2.
Table 2 shows that under the same temperature load and at the end of the 18th thermal loading cycle, the track slab strain has increased by approximately 100%, 35% and 3% at the fixed end section, the mid-span section and at the sliding end section, respectively. The strain of the CA mortar at the fixed end section and the mid-span section decreased by approximately 50% and 20%, respectively, while that at the sliding end section increased by approximately 100%. The strain of the track bed at the fixed end section, mid-span section and sliding end section decreased by 50%, 30% and 10%, respectively.
3.4. Displacement Results under Thermal Load
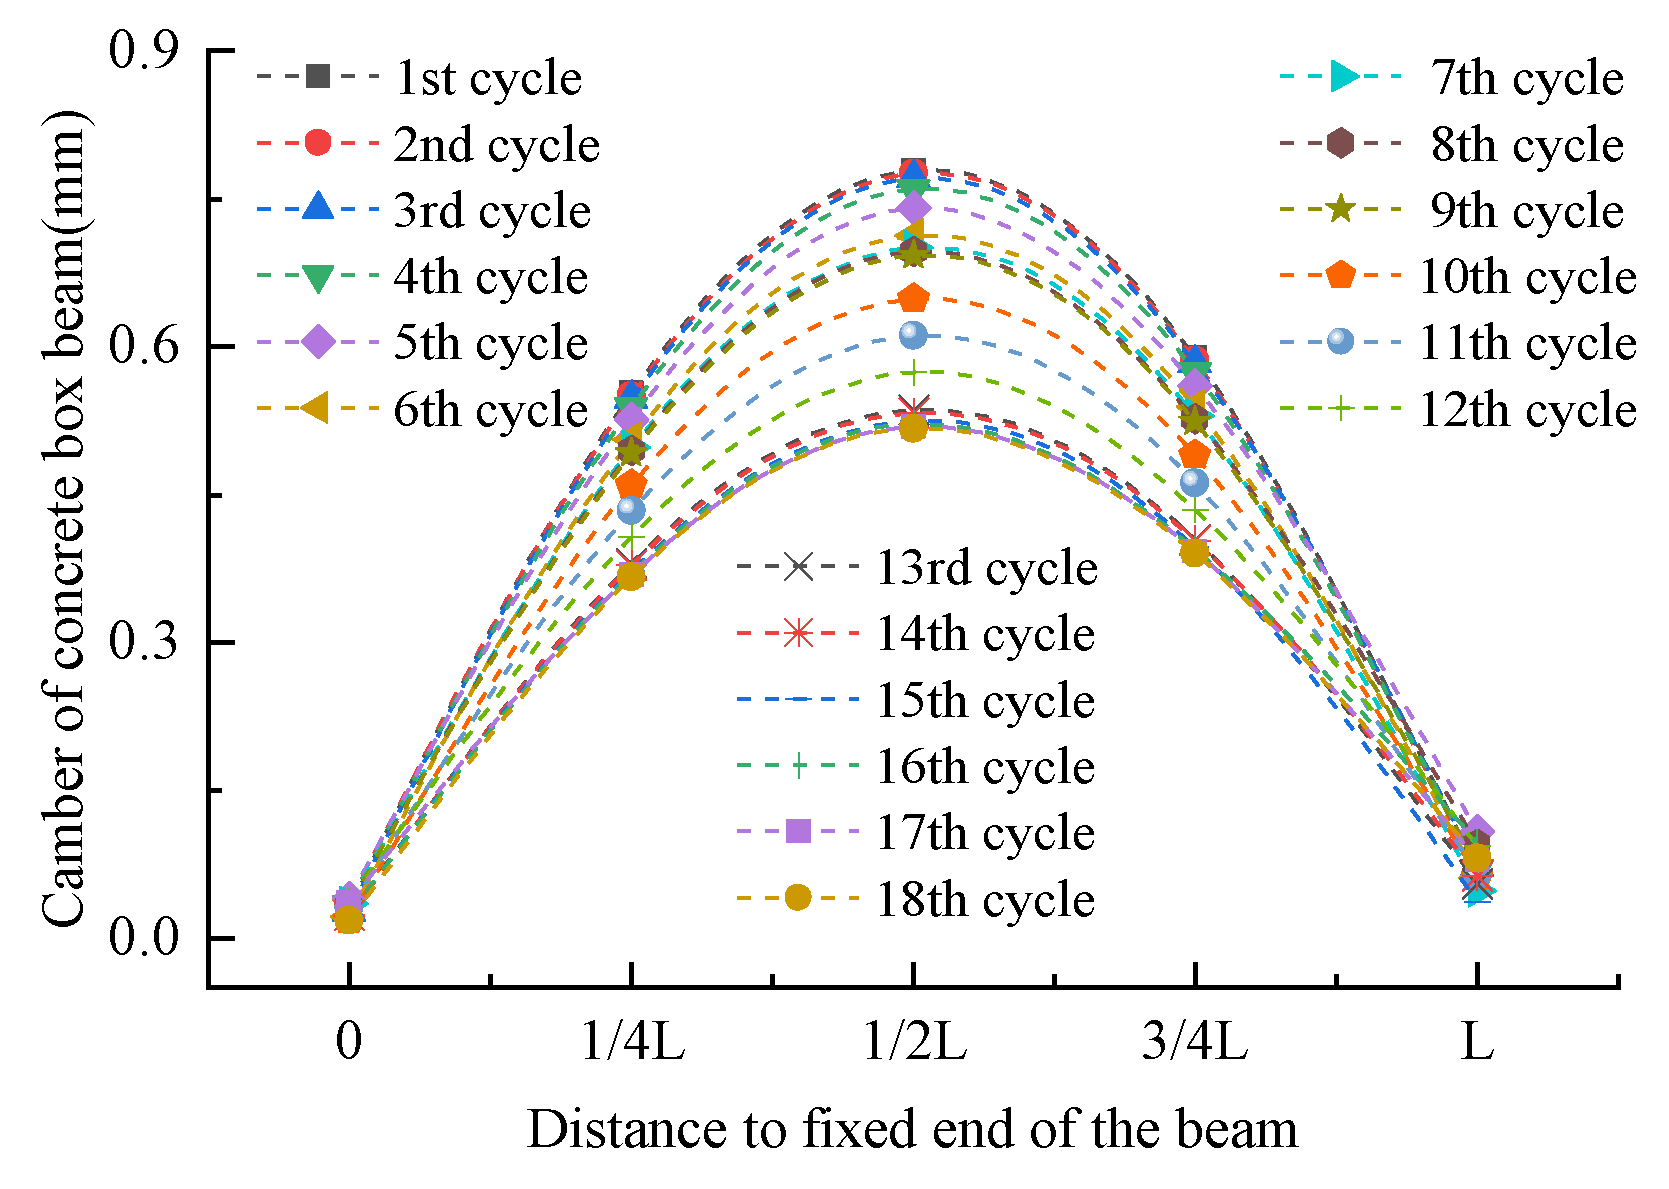
3.4.1. Camber of the Track-Bridge Structural System
Figure 17 shows the upper arch displacement of the beam along the longitudinal direction when the track slab top surface is heated up to 20 °C. It can be seen that the camber of the beam is symmetrical about the mid-span section of the beam (a half sine wave shape) under the temperature rising condition. With the increase of the thermal loading cycles, the displacement plot of the beam gradually shifts downward.
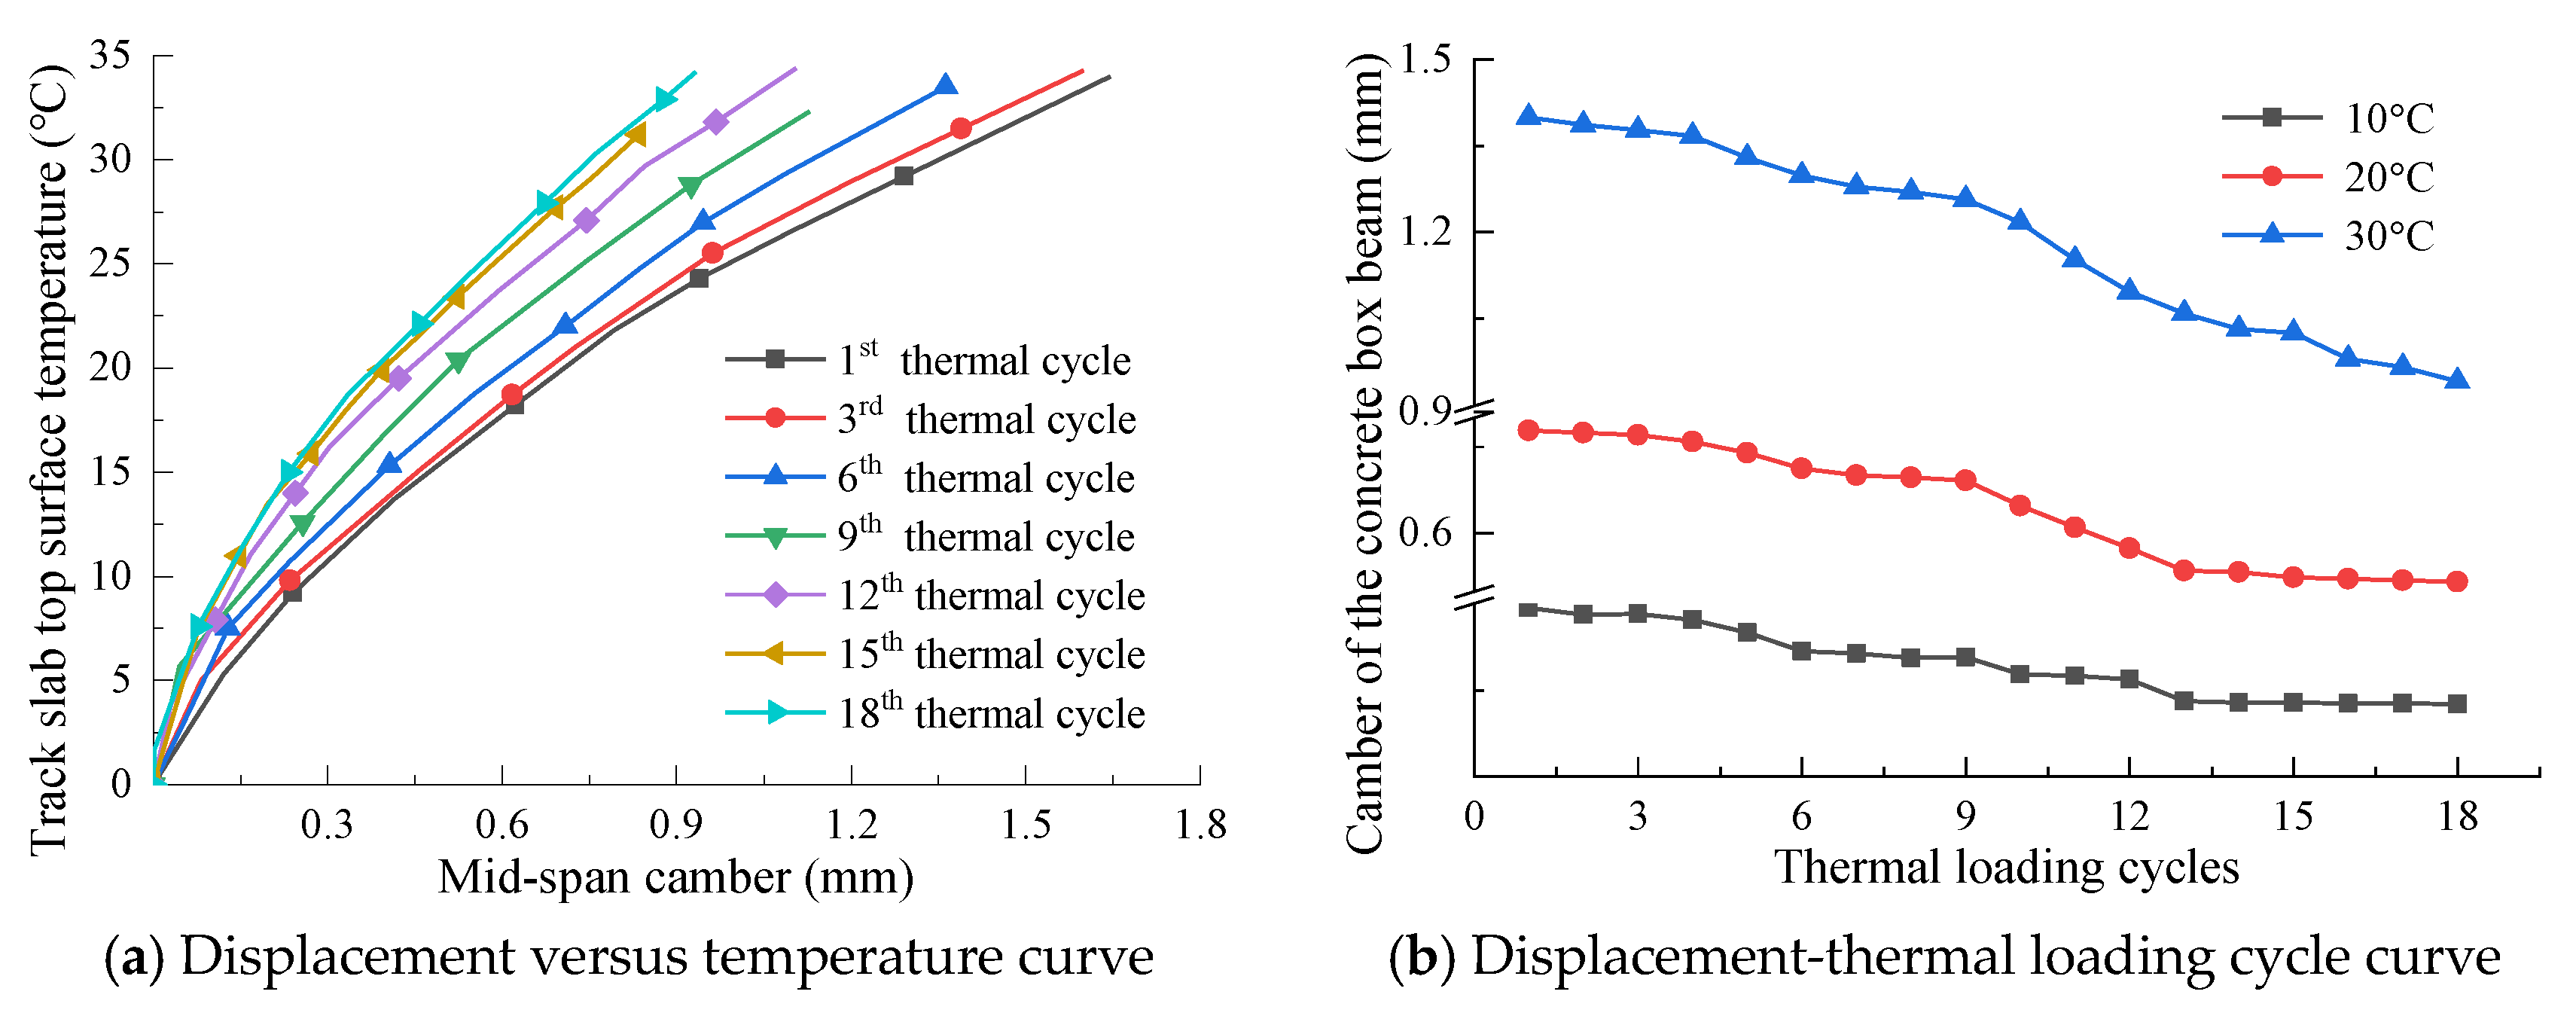
Figure 18a shows the influence of the thermal loading cycle on the variation of the track slab top surface temperature with the concrete box beam mid-span camber. Under the repeated action of the thermal loading, the temperature-induced camber of the concrete box beam gradually decreases. In the initiation stage (1st–6th cycle) and the stabilization stage (13th–18th cycle), the plots are densely distributed, while in the expansion stage (7th–12th cycle), a sparse distribution of the plots is observed.
Figure 18b shows the variation of the concrete box beam mid-span camber according to the thermal loading cycles. Under the same thermal load, the concrete box beam mid-span camber gradually decreases with the increase of the number of thermal cycles. In the initiation and stabilization stages of the gap, the displacement decreases at a slow rate.
Because the track slab is the closest layer to the heat source, during the application of the thermal load to the track structure, the internal thermal load within the track slab is the largest. Before the occurrence of the gap between the layers, the thermal load effect is transferred downward layer by layer through the interlayer bond to achieve harmonized deformation of the track system structural layers. The bond strength between the track slab and the CA mortar interface gradually decreases or even disappears due to the initiation of the gap between the layers. Therefore, the load effect transferred to the lower layer decreases gradually, and the temperature induced camber decreases accordingly. The reduction rate of the displacement is substantially consistent with the expansion rate of the gap length.
3.4.2. Relative Displacement between the Track System and the Concrete Box Bridge
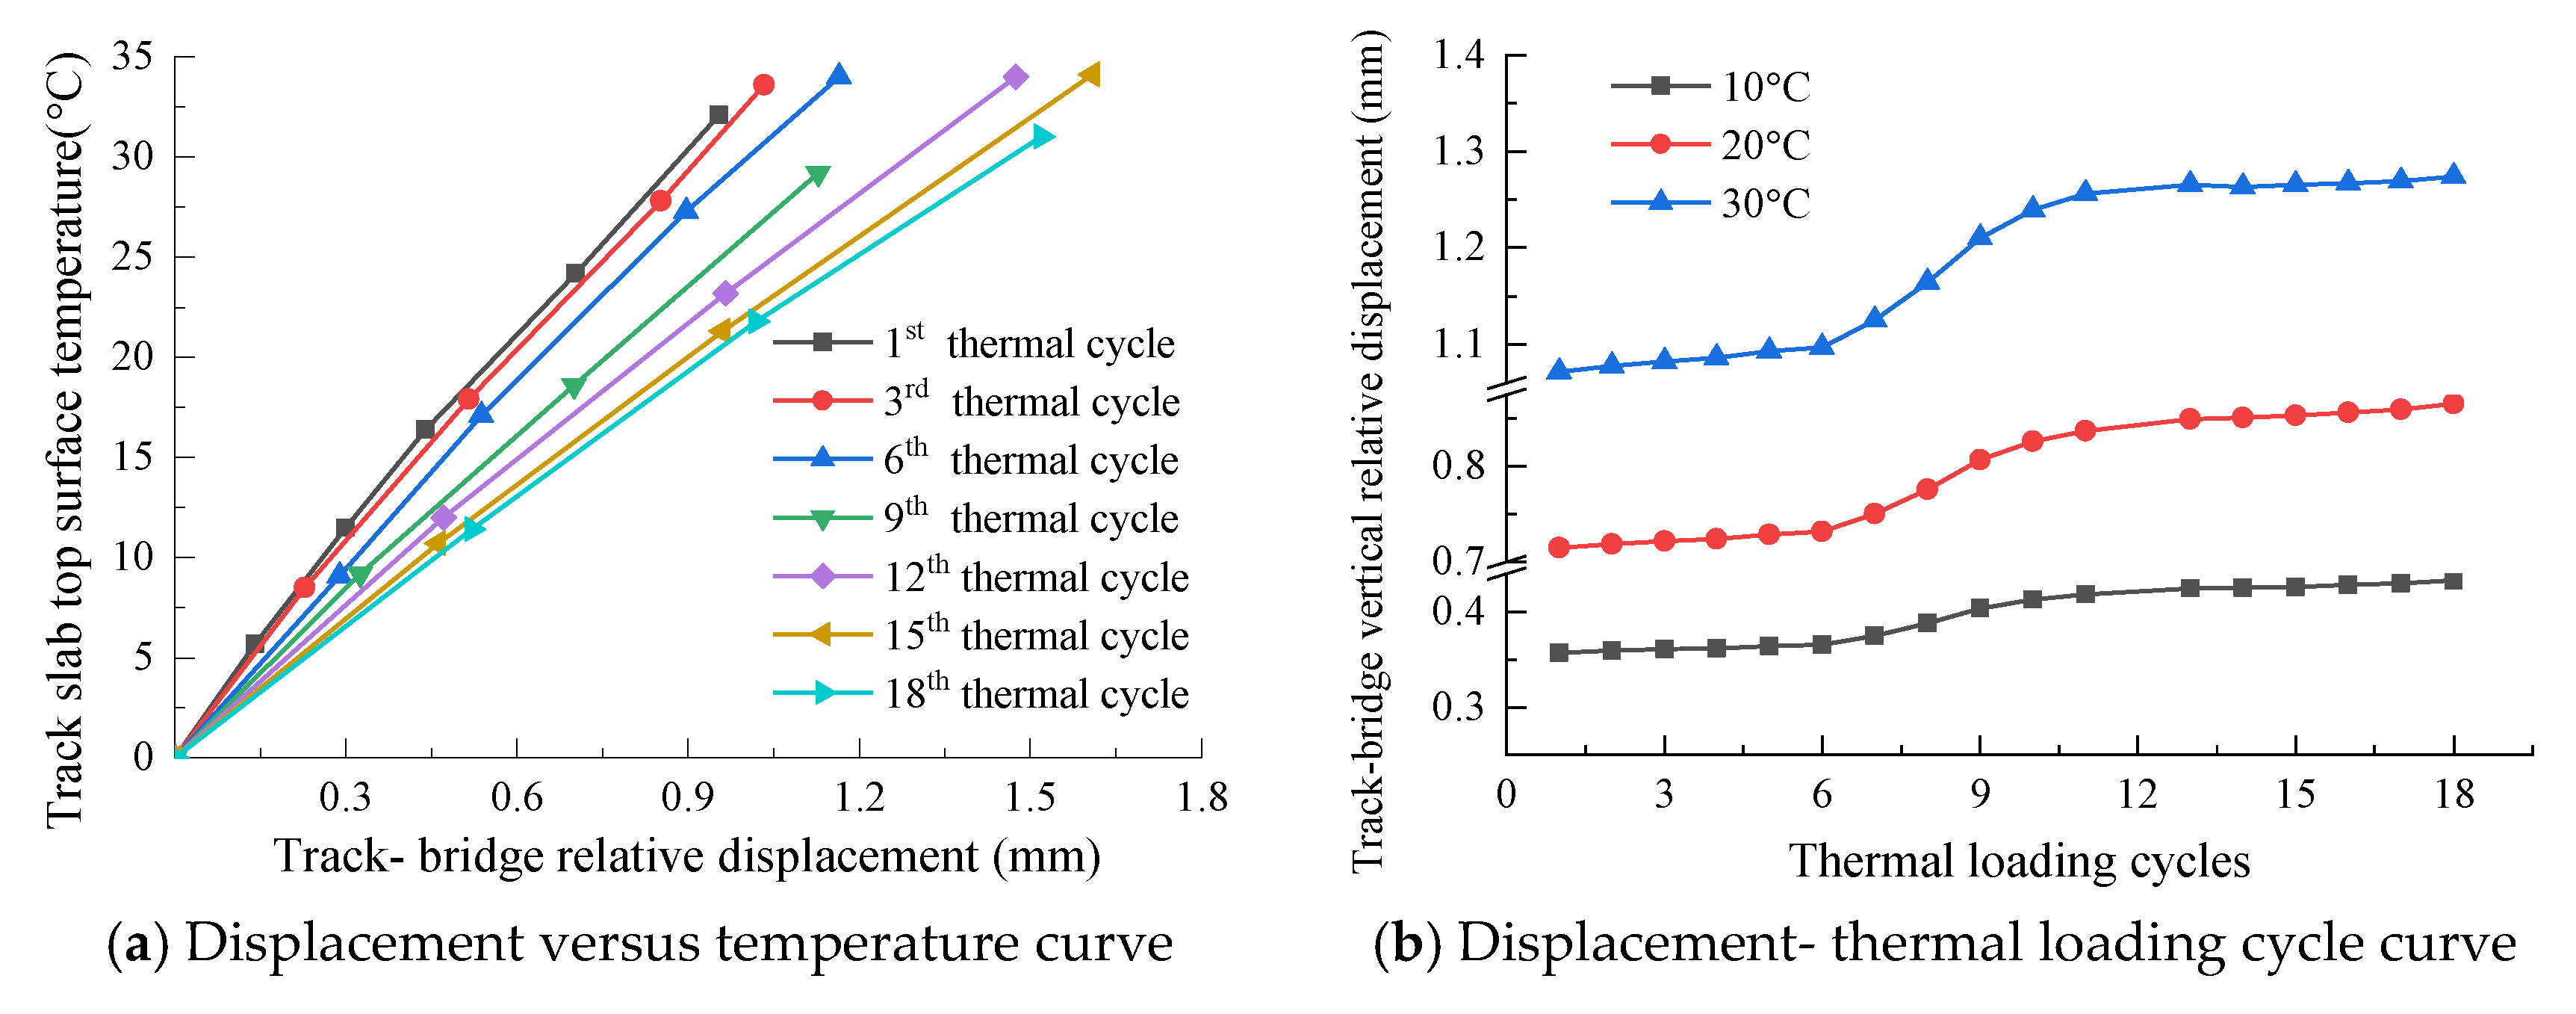
Figure 19 shows the mid-span vertical relative displacement of the ballastless track-bridge.
Figure 19a shows the influence of the thermal loading cycle on the variation of the track slab top surface temperature with the concrete box beam mid-span vertical relative displacement. Under the action of the thermal loading, the displacement of the track structure has a linear relationship with the track slab top surface temperature. As the number of thermal loading cycles increases, the temperature-relative displacement plot gradually shifts toward the direction of the displacement increases, and the slope of the plot gradually decreases. In the initiation stage and stabilization stage of the interlayer gap, the spacing between adjacent plots is not significant, while in the expansion stage of the gap, the distance between adjacent plots is larger.
Figure 19b shows the variation of the track-bridge vertical relative displacement according to the thermal loading cycles. The relative displacement induced by the same temperature load follows the increase of the number of thermal loading cycles and gradually increases. During the three stages of development of the gap, the displacement increase rate shows a slow-fast-slow change. When the track slab top surface temperature is increased to 30 °C, the relative displacement of the track structure after the first thermal loading cycle is 1.08 mm, while that at the end of the 18th thermal loading cycle is 1.27 mm, showing an increase of 17.59%.
3.5. Static Test Results
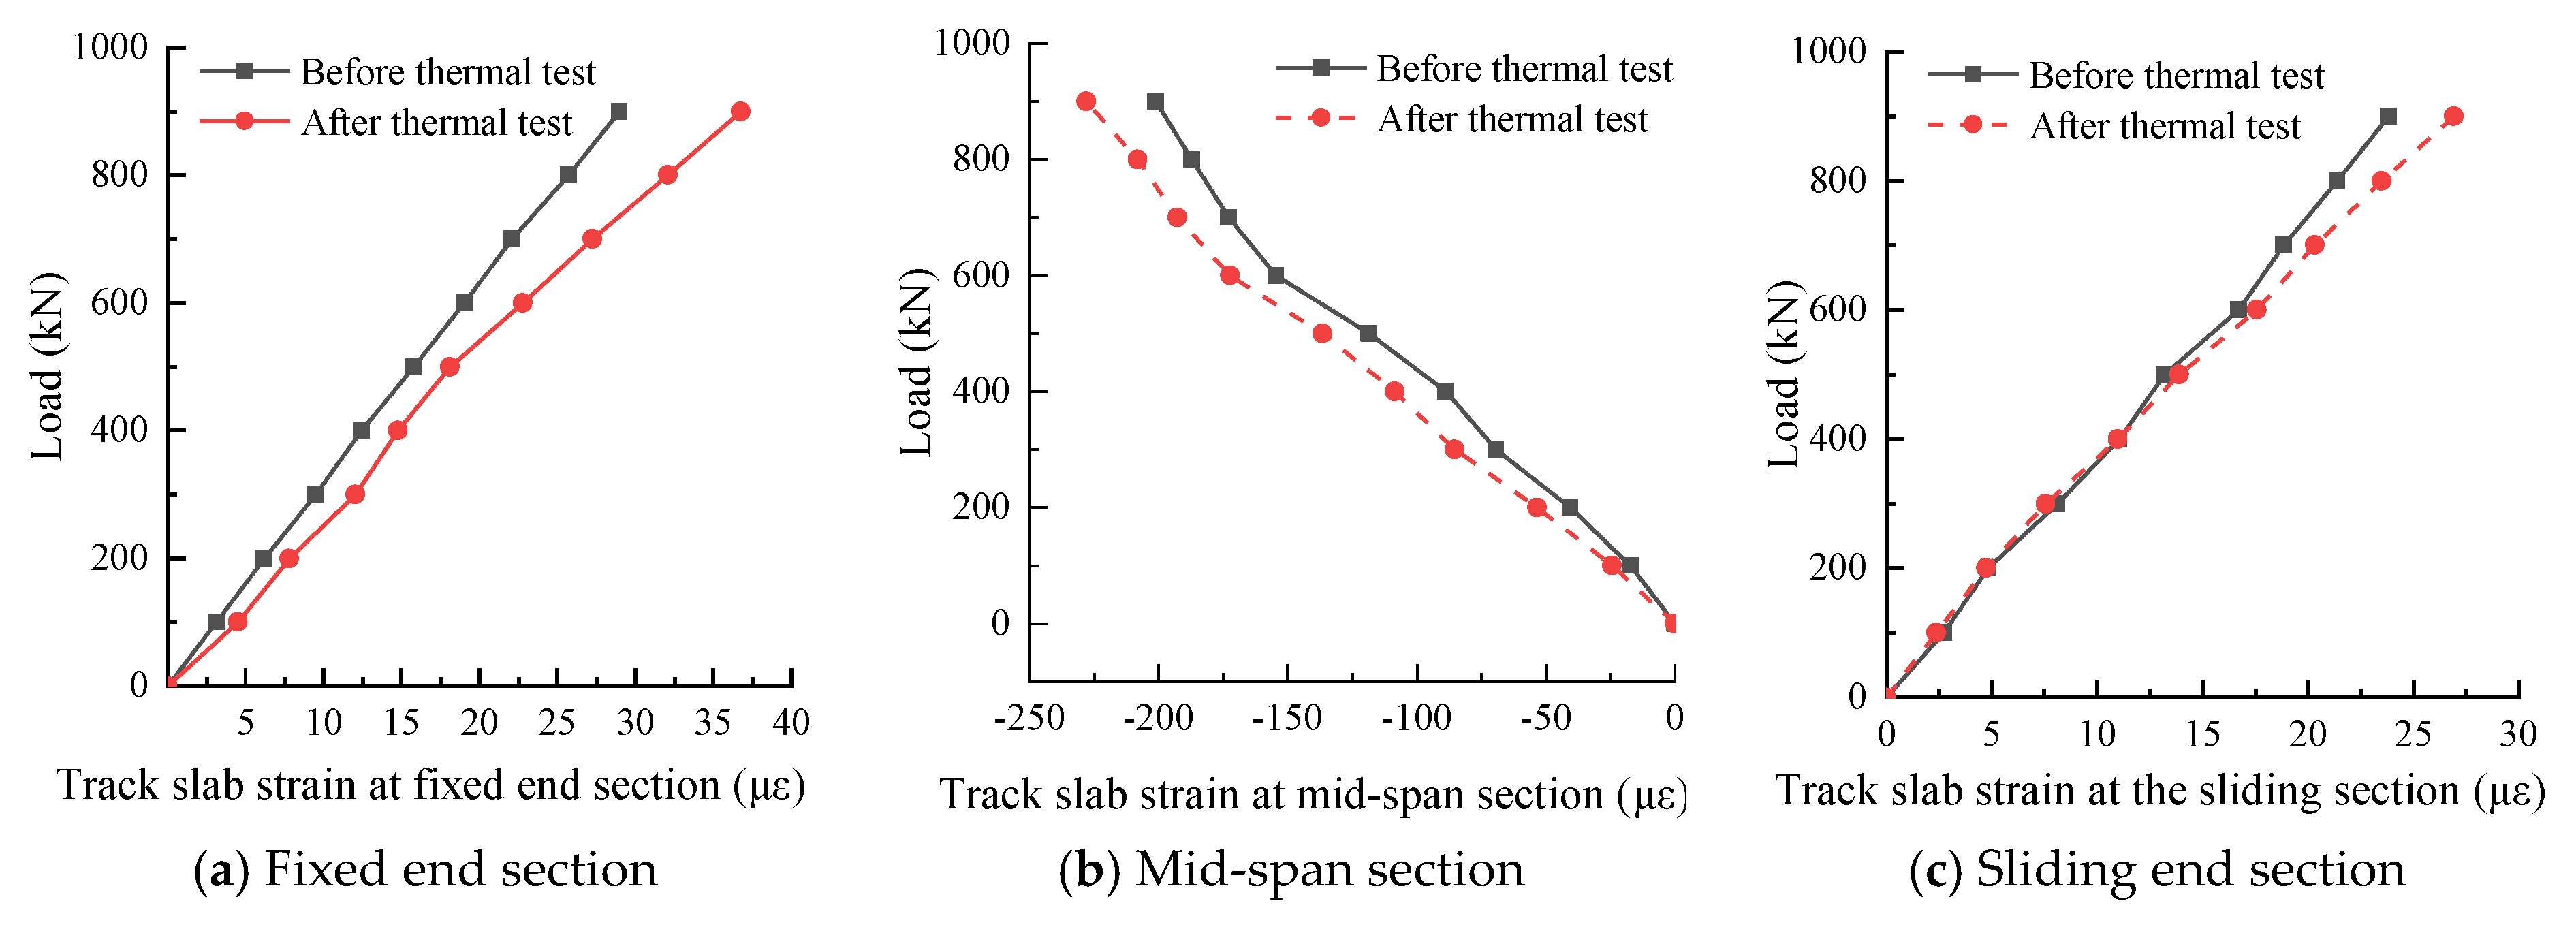
3.5.1. Strain Results under Static Load
Figure 20 shows the load-strain plot of the track slab under static loads both before and after the repeated thermal loading. It can be seen from
Figure 19 that under the action of the three-point static load, the track slab is under tension at the beam ends and under compression at the mid-span. After the repeated thermal loading, under the action of the same static load magnitude, the strain at the fixed end section and the mid-span section increased significantly, while the strain change at the sliding end section was relatively insignificant.
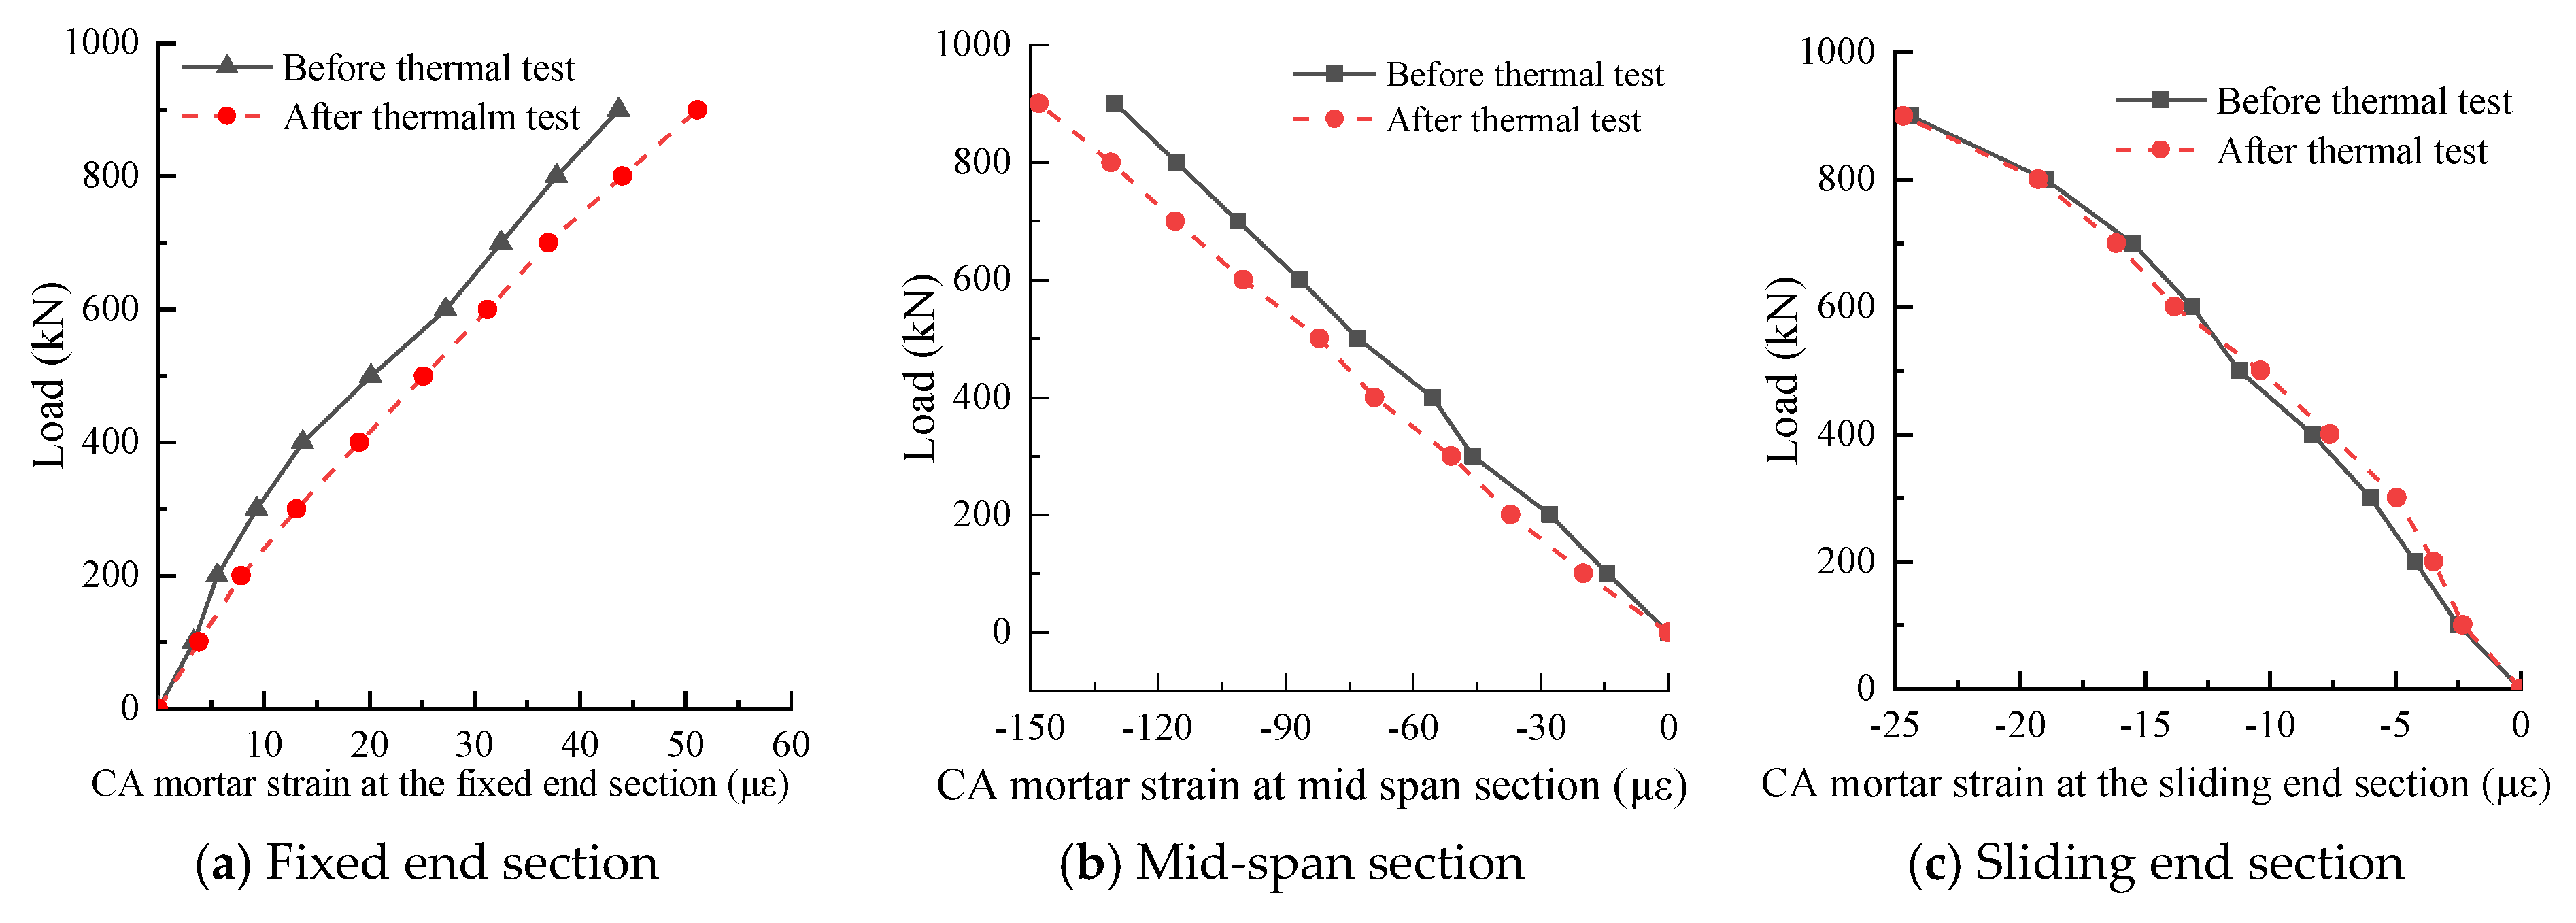
Figure 21 shows the load-strain plot of the CA mortar under static loads in both states of before and after the repeated thermal loading. It can be seen from
Figure 21 that under the action of the three-point static load, the CA mortar is under tension at the fixed end section and under compression at the mid-span section and the sliding end section. With respect to the initial state (before the repeated thermal loading), under the same static load magnitude, the strain of the CA mortar at each measuring point increased to different degrees, and the closer to the position of the gap, the greater the increase range.
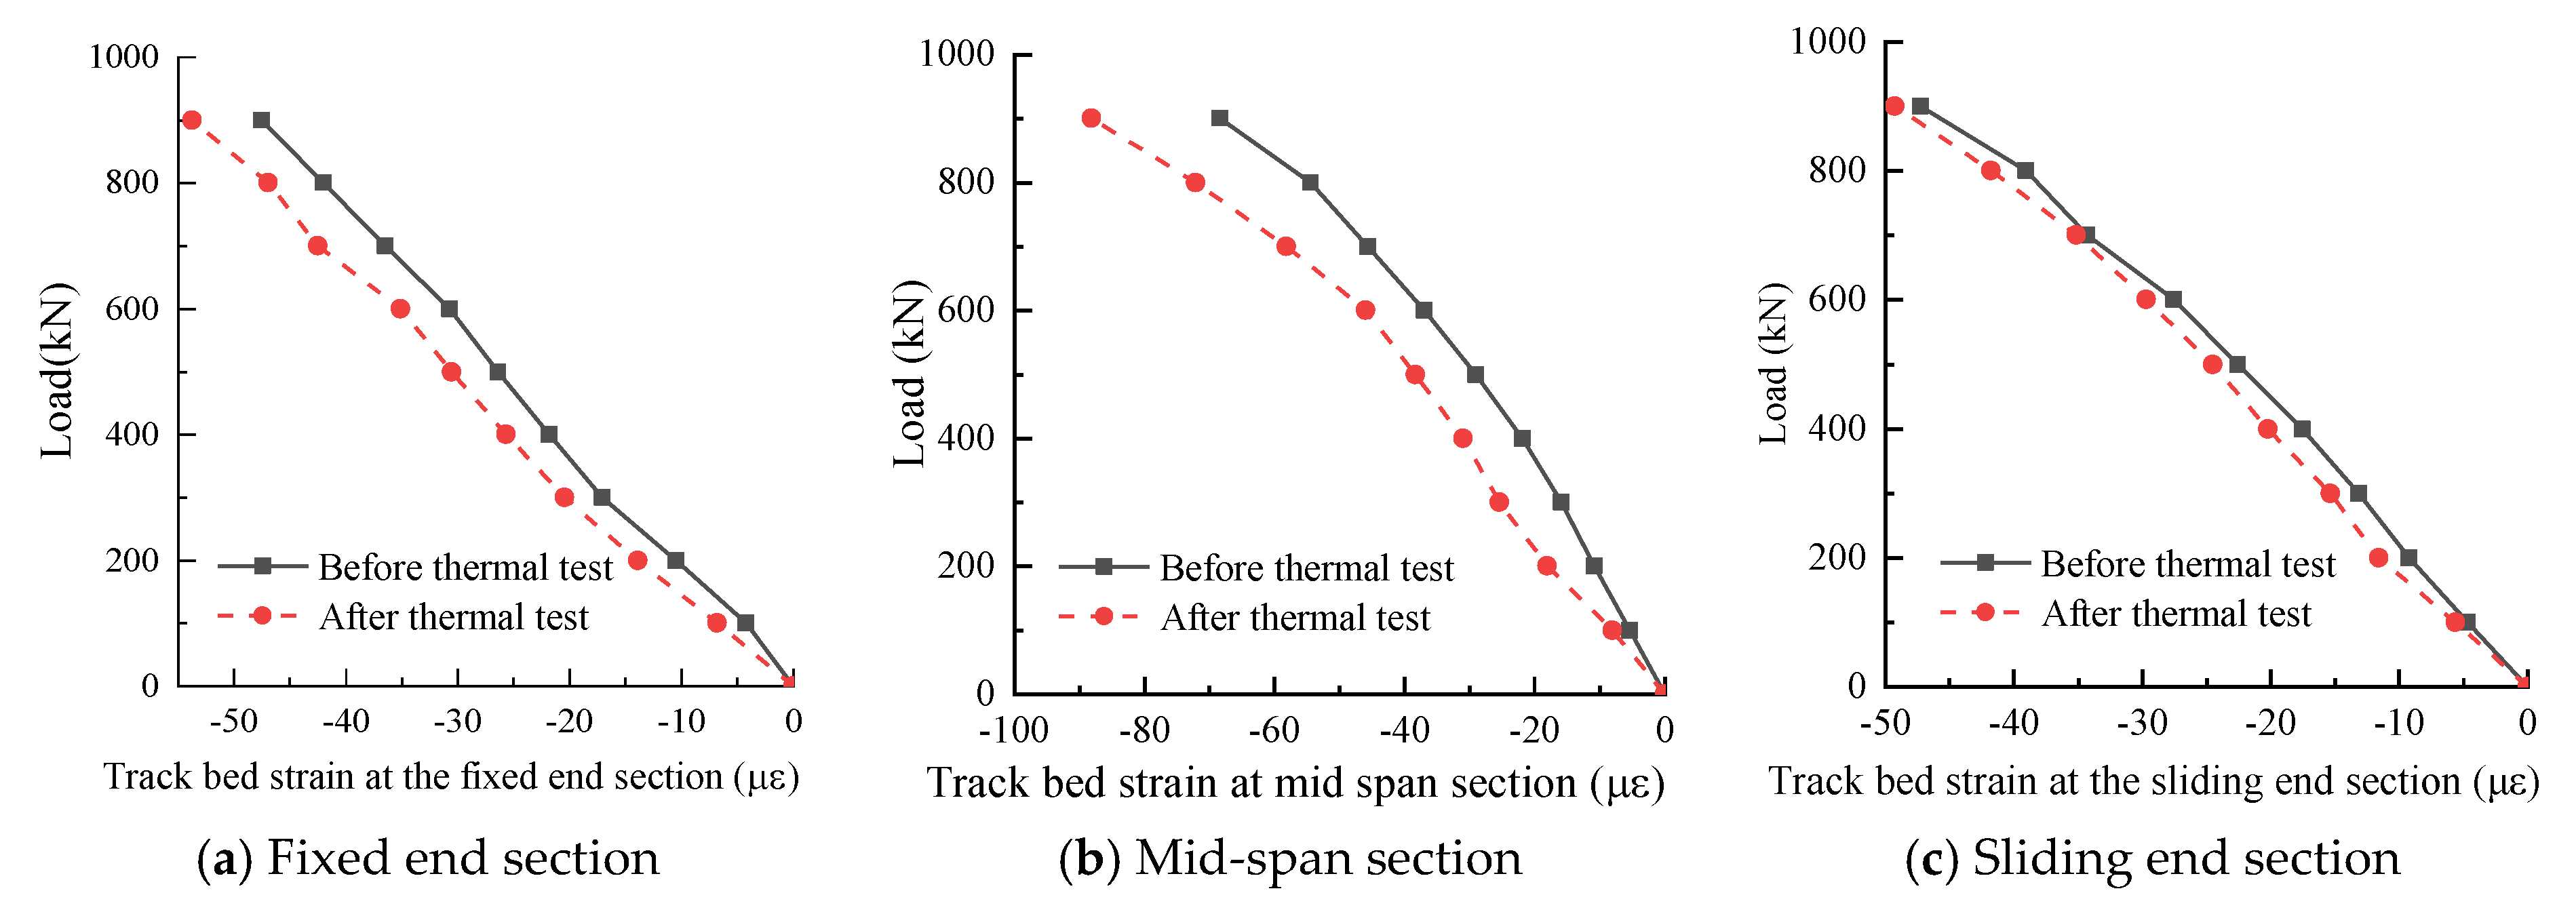
The load–strain plot of the track bed under static loads both before and after the repeated thermal loading states is shown in
Figure 22, which shows that under the action of the three-point static load, the track bed is under compression at the beam ends and at mid-span. Under the same static load level, after the repeated thermal loading, the strain at the fixed end section and the mid-span section near the position of the gap increases significantly while that at the sliding end section far away from the position of the gap, it is basically unaffected.
After the repeated thermal loading, under the action of the same static load, the strain of the track structure layers increases to varying degrees. As described above, the track slab strain increase law and the reduction law of the CA mortar strain and the track bed strain are different. According to the analysis, after the initiation of the track slab-CA mortar interlayer gap, the interfacial bond fails, so it cannot withstand tensile force while the compression force can still be withstood. When subjected to the action of the vertical static load, the load effect is transferred to the lower layer through the interlayer extrusion, achieving the harmonized deformation of the track structure. Therefore, under the action of the vertical static load, before and after the repeated thermal loading, the track structure layer strain change trend is consistent, showing an increase.
The linear regression method was used to fit the measured load–strain curve in this experiment, and the linear correlation coefficients were greater than 0.95. Therefore, it can be considered that the load and strain as a whole conform to a linear relationship, and the existing nonlinear trend is ignored. The slope of the load–strain plot is the load required to produce unit strains, which indirectly characterizes the stiffness of the structure. The measured load–strain plot of the track structure layers is linearly fitted to obtain the change in the slope before and after the repeated thermal loading, as shown in
Table 3 from which it can be seen that the overall stiffness of the track structure degrades after the repeated thermal loading. This degradation is more significant at the fixed end section and the mid-span section than at the sliding end section of the beam.
3.5.2. Load–Deflection Curve under Static Load
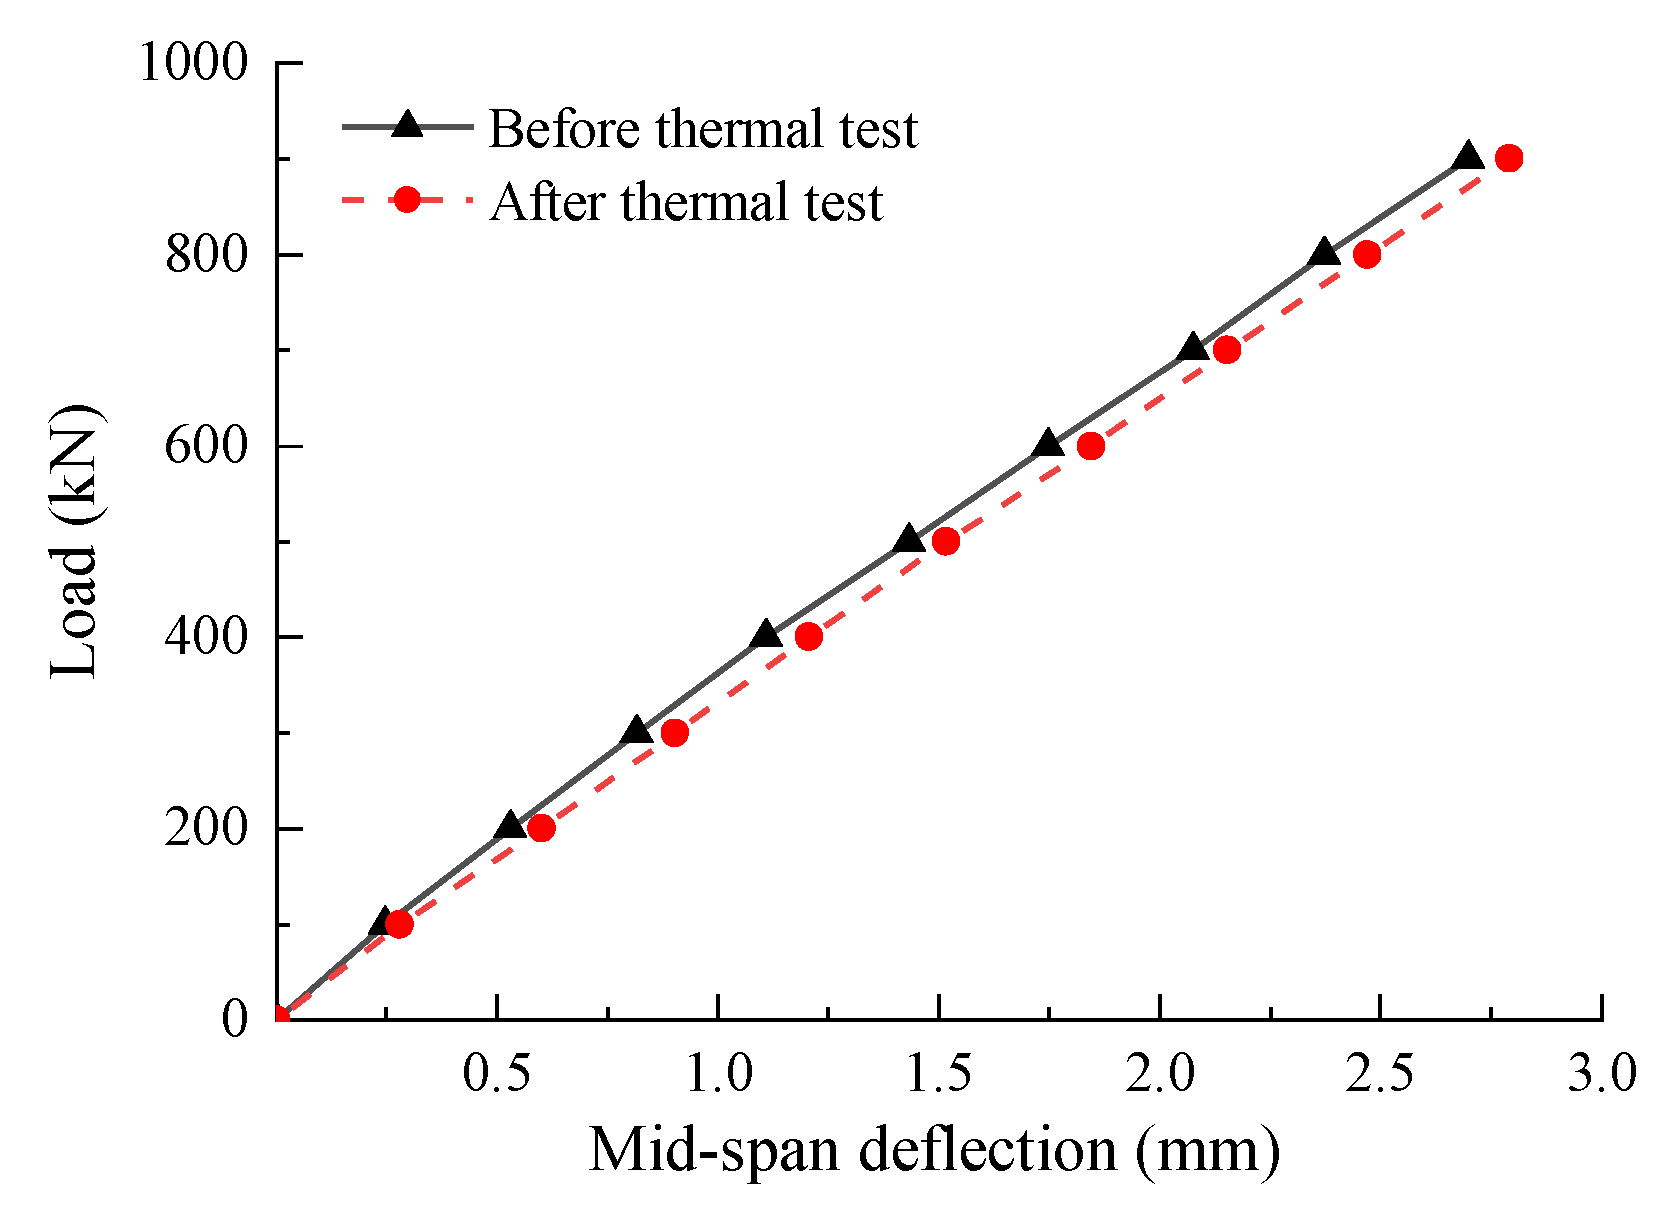
During the static loading process, the specimen structure remains in the elastic phase. The deflection changes linearly with respect to the thermal load variation. The slope of the load-deflection plot can be used to characterize the structural stiffness, as shown in
Figure 23, from which it can be seen that, under the same static load, the deflection of the beam after the repeated thermal loading is slightly larger than that before the repeated thermal loading. This indicates that the stiffness of the structural system degrades after the repeated thermal loading, with a relatively small degradation range.
4. Discussion
The measured temperature gradient load mode of this experiment is consistent with reference [
18], when the thermal load is applied to the track structure, the load is gradually reduced from the top to the bottom of the track system with the highest value within the track slab. The load response is transferred layer by layer through the interlayer bond to achieve the harmonized deformation of the track structure. The interlayer gap between the track slab and the CA mortar weakens the bond between the layers, and the thermal load transferred from the track slab to the lower structure decreases accordingly, subjecting the track slab to a larger thermal load magnitude. Therefore, under the same temperature load, with the increase of the number of thermal loading cycles, the gap initiates and gradually expands, resulting in the increase of the camber on the track structure, the decrease of the camber of the concrete box beam, the increase of the track slab strain, and the decrease of the CA mortar and the track bed strain. As the distance to the gap increases, the influence of the gap on the track structure strain is gradually weakened.
Under the same thermal loading action, the displacement of the track structure is inversely proportional to its stiffness. The displacement gradually increases with the repeated action of the thermal loading, indicating that the stiffness of the track structure degrades gradually. The above analysis shows that during the test, the stiffness of the track structure is gradually degraded in the three stages of initiation-expansion-stabilization, and the rate of stiffness degradation can be calculated as follows:
where, K
1 and K
2 are the structural stiffness values before and after the thermal loading test; P is the vertical static load; δ
1 and δ
2 are the structural displacements corresponding to the first and the 18th thermal loading cycle, respectively; and ΔK is the stiffness degradation rate. When the track slab top surface temperature is increased to 30 °C, it can be seen from the above formula that after the 18th thermal loading cycle, the stiffness of the track structure decreases by 14.96%.
The stiffness of the track system is characterized by the slope of the relative displacement plot between the track system and the concrete box beam. The stiffness of the track-bridge structural system is characterized by the slope of the load-deflection plot of the track-bridge structure system, as shown in
Table 4. After 18 cycles of temperature loading, the stiffness of the track structure was reduced by 14.96%, while the overall stiffness of the ballastless track-bridge structure system was reduced by 2.52%.
5. Conclusions
In this paper, based on a three-span simply supported high-speed railway bridge with a CRTS II ballastless slab track structural system prototype, a 1/4-scale specimen was created, and repeated thermal loading tests were carried out. The development law of the track structure interlayer gap under repeated thermal loading and the study influence of the interlayer gap on the structural strain, displacement and stiffness have led to the following conclusions:
(1) Under the thermal load action, the constraint of shear slot at the fixed end causes a large temperature stress inside the track structure, so the gap between the track slab and the CA mortar layer begins from the shear slots and gradually extends to the mid-span. The gap expansion experiences three stages (initiation, expansion and stabilization), and its length increases with the number of thermal loading cycles in a “stepped” manner. Therefore, at the design stage, it can be considered to strengthen the adhesion between the track slab and the CA mortar layer near the shear slot;
(2) When the thermal load is applied to the track structure, the temperature inside the track slab is the largest. With the increase of the repeated thermal loading cycles, the interlayer gap between the track slab and the CA mortar appears and gradually extends. The interface bond effect of the track structure gradually decreases, and the thermal load transferred from the track slab to the lower structure through the interface bonding decreases. Finally, under the action of the same thermal load, the camber of the track structure increases gradually, and that of the concrete box beam decreases gradually;
(3) With the increase of the number of thermal loading cycles and under the same temperature load, the track slab strain gradually increases, while that of the CA mortar and the track bed gradually decreases, with a change rate that is substantially consistent with the expansion rate of the gap. Near the fixed end section where the gap is initiated, the influence of the interlayer gap on the track structure strain is the largest. As the distance to the interlayer gap increases, the influence of the interlayer gap gradually decreases. At the sliding end section away from of the interlayer gap position, the strain change amplitude is insignificant;
(4) At the end of the repeated thermal loading, under the same vertical static load, an increase is observed in the deflection of the concrete box beam and the strain of the track structure layers, and thus, the stiffness of the structure is degraded. The stiffness degradation of the ballastless track structure is relatively significant (14.96%); the overall stiffness reduction of the ballastless track-bridge structural system is relatively small (2.52%);
(5) For the ballastless track-bridge structural system, the stiffness of the track system is much smaller than the stiffness of the bridge, so the contribution of track structure to the overall structural system is relatively small.
Based on the above conclusion, the cohesive force model could be used to simulate the complex interface bond failure relationship. With the help of finite element method and theoretical method, further research could be carried out on the mechanism, the gap expansion law and effects of the interface bond failure of ballastless track under repeated temperature load.
Author Contributions
Conceptualization, L.Z. (Lingyu Zhou), T.W., G.Z., M.A.D.G., Y.Z., L.Z. (Lei Zhao) and W.G.; Data curation, G.Z. and M.A.D.G.; Formal analysis, L.Z. (Lingyu Zhou), T.W., G.Z., Y.Z. and W.G.; Funding acquisition, L.Z. (Lingyu Zhou), T.W., Y.Z., L.Z. (Lei Zhao) and W.G.; Investigation, L.Z. (Lingyu Zhou), T.W., G.Z., Y.Z., L.Z. (Lei Zhao) and W.G.; Methodology, L.Z. (Lingyu Zhou), T.W., G.Z., M.A.D.G., Y.Z., L.Z. (Lei Zhao) and W.G.; Project administration, L.Z. (Lingyu Zhou) and Y.Z.; Resources, M.A.D.G. and L.Z. (Lei Zhao); Software, L.Z. (Lingyu Zhou) and M.A.D.G.; Supervision, T.W., M.A.D.G. and L.Z. (Lei Zhao); Validation, G.Z., Y.Z. and L.Z. (Lei Zhao); Visualization, L.Z. (Lingyu Zhou), G.Z., M.A.D.G., L.Z. (Lei Zhao) and W.G.; Writing—original draft, T.W., G.Z. and M.A.D.G.; Writing—review & editing, T.W., G.Z. and W.G. All authors have read and agreed to the published version of the manuscript.
Funding
This research was funded by the National Natural Science Foundation of China, grant number 51578546, 51878674; and the National Science Joint High-Speed Railway Foundation of China, grant number U1434204.
Acknowledgments
Special thanks are extended to the reviewers for their valuable suggestions. The authors would like to thank the National Engineering Laboratory of High-Speed Railway Construction Technology of China, the staff of the laboratory for their help in the smooth development of the experiment, and reviewers for their hard work.
Conflicts of Interest
The authors declare no conflicts of interest.
References
- Ramos, Ó.R.; Schanack, F.; Carreras, G.O.; de Vena Retuerto, J. Bridge length limits due to track-structure interaction in continuous girder prestressed concrete bridges. Eng. Struct. 2019, 196, 109310. [Google Scholar] [CrossRef]
- Liu, X.Y.; Zhao, P.R.; Yang, R.S.; Wang, P. Theory and Method on Design of Passenger Dedicated Ballastless Track Line of High-Speed Railway; Southwest Jiaotong University Publishing house: Chengdu, China, 2010; pp. 106–115. (In Chinese) [Google Scholar]
- Gautier, P.E. Slab track: Review of existing systems and optimization potentials including very high speed. Construction. Build. Mater. 2015, 9, 15–29. [Google Scholar] [CrossRef]
- Shan, Y.C.; Zheng, S.G.; Zhang, X.F.; Luo, W.; Mao, J.D.; Kong, D.Y. Fatigue performance of the CA mortar used in CRTS I ballastless slab track under simulated servicing condition. Materials 2018, 11, 2259. [Google Scholar] [CrossRef] [PubMed]
- Li, P.G. Analysis of the Interface Damage of CRST II Slab Track and Its Influences. Master’s Thesis, Southwest Jiaotong University, Chengdu, China, 2015. (In Chinese). [Google Scholar]
- Ren, J.J.; Li, X.; Yang, R.S.; Wang, P.; Xie, P. Criteria for repairing damages of CA mortar for prefabricated framework-type slab track. Constr. Build. Mater. 2016, 110, 300–311. [Google Scholar] [CrossRef]
- Rutherford, T.; Wang, Z.; Shu, X.; Huang, B.; Clarke, D. Laboratory investigation into mechanical properties of cement emulsified asphalt mortar, Construction. Build. Mater. 2014, 65, 76–83. [Google Scholar] [CrossRef]
- Liu, Y.; Zhao, G.T. Analysis of early gap between layers of CRTS slab ballastless track structure. China Railw. Sci. 2013, 34, 1–7. (In Chinese) [Google Scholar]
- Liu, X.Y.; Zhao, P.R.; Dai, F. Advances in design theories of high-speed railway ballastless tracks. J. Mod. Transp. 2011, 19, 154–162. [Google Scholar] [CrossRef]
- Yang, Y.; Wu, G.; Wu, Z.S.; Zhang, T.; Yang, Q.D. An experimental study of the insulation performance of ballastless track slabs reinforced by new fiber composite bars. Constr. Build. Mater. 2015, 83, 7–18. [Google Scholar] [CrossRef]
- Kang, C.; Bode, M.; Wenner, M.; Marx, S. Experimental and numerical investigations of rail behaviour under compressive force on ballastless track systems. Eng. Struct. 2019, 197, 109413. [Google Scholar] [CrossRef]
- Sheng, X.W.; Zheng, W.Q.; Zhu, Z.H. Mechanical Behaviors and Fatigue Performances of Ballastless Tracks Laid on Long-Span Cable-Stayed Bridges with Different Arrangements. Sensors 2019, 19, 4195. [Google Scholar] [CrossRef]
- Zhou, L.Y.; Yang, L.Q.; Shan, Z.; Peng, X.S.; Akim, D.M. Investigation of the fatigue behaviour of a ballastless slab track-bridge structure system under train load. Appl. Sci. 2019, 9, 3625. [Google Scholar] [CrossRef]
- Ou, Z.; Li, F. Analysis and Prediction of the Temperature Field Based on In-situ Measured Temperature for CRTS-II Ballastless Track. Energy Procedia 2014, 61, 1290–1293. [Google Scholar]
- Xia, Y.; Xu, Y.L.; Wei, Z.L.; Zhu, H.P.; Zhou, X.Q. Variation of structural vibration characteristics versus non-uniform temperature distribution. Eng. Struct. 2011, 33, 146–153. [Google Scholar] [CrossRef]
- Zhao, L.; Sun, L.; Fan, T.J. Temperature field analysis of CRTS-II ballastless track slab structure on soil subgrade. Appl. Mech. Mater. 2014, 587, 1255–1261. [Google Scholar] [CrossRef]
- Ma, T.; Xu, L. Storey-based stability of unbraced steel frames under piece-linear temperature distributions. Eng. Struct. 2019, 194, 147–160. [Google Scholar] [CrossRef]
- Dai, G.L.; Su, H.T.; Liu, W.S.; Yan, B. Temperature distribution of longitudinally connected ballastless track on bridge in summer. J. Cent. South Univ. 2017, 48, 1073–1080. (In Chinese) [Google Scholar]
- Tian, D.M.; Deng, D.H.; Peng, J.W.; Wang, S.X.; Ai, Y.Q. Influence of temperature on interfacial bonding between cement emulsified asphalt mortar layer and concrete Layer. J. China Railw. Soc. 2013, 35, 78–85. (In Chinese) [Google Scholar]
- Zhu, S.Y.; Cai, C.B. Interface Damage and its effect on vibrations of slab track under temperature and vehicle dynamic loads. Int. J. Non-Linear Mech. 2014, 58, 222–232. [Google Scholar]
- Zhu, S.; Wang, M.; Zhai, W.; Cai, C.; Zhao, C.; Zeng, D.; Zhang, J. Mechanical property and damage evolution of concrete interface of ballastless track in high-speed railway: Experiment and simulation. Constr. Build. Mater. 2018, 187, 460–473. [Google Scholar] [CrossRef]
- Zhang, Y.; Cai, X.; Gao, L.; Wu, K. Improvement on the mechanical properties of CA mortar and concrete composite specimens in high-speed railway by modification of interlayer bonding. Constr. Build. Mater. 2019, 228, 116758. [Google Scholar] [CrossRef]
- He, C. Study on Influence of Interface Connections Damage and Maintenance Index of the CRTS II Slab Track. Master’s Thesis, Southwest Jiao tong University, Chengdu, China, 2013. (In Chinese). [Google Scholar]
- Li, P.G.; Liu, X.Y.; Li, G.Q. Influence of CA mortar void on dynamic characteristics of unit slab track on bridge. China Railw. Sci. 2014, 35, 20–27. (In Chinese) [Google Scholar]
- Wang, T.; Jia, H.; Liu, Z.; Wei, Z.; Xie, X.; Wu, S.; Li, H. Experimental study of the gap between track slab and cement asphalt mortar layer in CRTS I slab track. J. Mod. Transp. 2018, 26, 173–178. [Google Scholar] [CrossRef]
- Robertson, I.; Masson, C.; Sedran, T.; Barresi, F.; Caillau, J.; Keseljevic, C.; Vanzenberg, J.M. Advantages of a new ballastless trackform. Constr. Build. Mater. 2015, 92, 16–22. [Google Scholar] [CrossRef]
- Wang, F.; Liu, Z.; Wang, T.; Hu, S. A novel method to evaluate the setting process of cement and asphalt emulsion in CA mortar. Mater. Struct. 2008, 41, 643–647. [Google Scholar] [CrossRef]
- Wang, D.; Roesler, J.R.; Guo, D.Z. Analytical approach to predicting temperature fields in multilayered pavement systems. J. Eng. Mech. 2009, 135, 334–344. [Google Scholar] [CrossRef]
- Sun, Z.J.; Wang, Z.P.; Wang, J.; Kang, W.X.; Liu, X.Y. Temperature analysis of CRST Ⅱ Slab ballastless track in extremely hot weather. Railw. Stand. Des. 2018, 62, 64–68. (In Chinese) [Google Scholar]
- Mirambell, E.; Aguado, A. Temperature and stress distributions in concrete box girder bridges. J. Struct. Eng. 1990, 116, 2388–2409. [Google Scholar] [CrossRef]
- Cardona, M.; Kremer, R.K. Temperature dependence of the electronic gaps of semiconductors. Thin Solid Films 2014, 571, 680–683. [Google Scholar]
- Liu, Z. Effect of Temperature Load on CA Mortar Filling Layer of CRTS I Slab Track. Ph.D. Thesis, Southwest Jiaotong University, Chengdu, China, 2016. (In Chinese). [Google Scholar]
Figure 1.
Specimen structure.
Figure 1.
Specimen structure.
Figure 2.
Elevation view of specimen structure (mm).
Figure 2.
Elevation view of specimen structure (mm).
Figure 3.
Design temperature loading system.
Figure 3.
Design temperature loading system.
Figure 4.
Thermal loading system.
Figure 4.
Thermal loading system.
Figure 5.
Schematic diagram of measurement point (mm).
Figure 5.
Schematic diagram of measurement point (mm).
Figure 6.
Interlayer relative displacement gauges installation diagram.
Figure 6.
Interlayer relative displacement gauges installation diagram.
Figure 7.
Static loading diagram (mm).
Figure 7.
Static loading diagram (mm).
Figure 8.
Thermal load of the track structure.
Figure 8.
Thermal load of the track structure.
Figure 9.
Track slab-CA mortar interlayer gap.
Figure 9.
Track slab-CA mortar interlayer gap.
Figure 10.
Curve of the gap length varying with the cycles of temperature loading action.
Figure 10.
Curve of the gap length varying with the cycles of temperature loading action.
Figure 11.
Track slab strain variation with the thermal load.
Figure 11.
Track slab strain variation with the thermal load.
Figure 12.
Variation of the track slab strain with the thermal loading cycle.
Figure 12.
Variation of the track slab strain with the thermal loading cycle.
Figure 13.
CA mortar strain variation with the thermal load.
Figure 13.
CA mortar strain variation with the thermal load.
Figure 14.
Variation of the CA mortar strain with the thermal loading cycles.
Figure 14.
Variation of the CA mortar strain with the thermal loading cycles.
Figure 15.
Track bed strain variation with the thermal load.
Figure 15.
Track bed strain variation with the thermal load.
Figure 16.
Variation of the track bed strain with the thermal loading cycles.
Figure 16.
Variation of the track bed strain with the thermal loading cycles.
Figure 17.
Camber of the beam along the longitudinal direction.
Figure 17.
Camber of the beam along the longitudinal direction.
Figure 18.
Mid-span displacement of the concrete box beam.
Figure 18.
Mid-span displacement of the concrete box beam.
Figure 19.
Track- bridge mid-span relative displacement.
Figure 19.
Track- bridge mid-span relative displacement.
Figure 20.
Load–strain curve of the track slab under static load.
Figure 20.
Load–strain curve of the track slab under static load.
Figure 21.
Load–strain curve of the CA mortar under static load.
Figure 21.
Load–strain curve of the CA mortar under static load.
Figure 22.
Load–strain curve of the track bed under static load.
Figure 22.
Load–strain curve of the track bed under static load.
Figure 23.
Load–deflection curve of the concrete box beam.
Figure 23.
Load–deflection curve of the concrete box beam.
Table 1.
Similarity ratio of specimen.
Table 1.
Similarity ratio of specimen.
| Physical Quantity | Similarity Ratio |
|---|
| size | 1/4 |
| Elastic modulus | 1 |
| Coefficient of linear expansion | 1 |
| Force | 1/16 |
| Mid-span bending Moment | 1/64 |
| stress | 1 |
Table 2.
Strain variation of the track structure between the states before and after repeated thermal test.
Table 2.
Strain variation of the track structure between the states before and after repeated thermal test.
| Thermal Load | Structural Parts | Fixed End | Mid-Span | Sliding End |
|---|
| 10 °C | Track slab | 109% | 32.4% | 3.2% |
| CA mortar | −48.3% | −89.5% | 102.8% |
| Track bed | −52.9% | −35.1% | −18.1% |
| 20 °C | Track slab | 120% | 33.3% | −0.6% |
| CA mortar | −52.0% | −23.9% | 125.7% |
| Track bed | −51.3% | 32.5% | −12.7% |
| 30 °C | Track slab | 86% | 35.5% | 2.9% |
| CA mortar | −48.3% | −22.1% | 101.4% |
| Track bed | −49.8% | −30.9% | −4.8% |
Table 3.
Overall stiffness degradation of the track structure after thermal loading.
Table 3.
Overall stiffness degradation of the track structure after thermal loading.
| Structural | Section | Before Test | After Test | Change Rate |
|---|
| Track slab | Fixed end | 31.11 | 27.01 | −13.18% |
| Mid-span | 23.81 | 18.45 | −22.52% |
| Sliding end | 37.17 | 32.83 | −13.21% |
| CA mortar | Fixed end | 19.55 | 17.29 | −11.58% |
| Mid-span | 35.91 | 33.11 | −7.78% |
| Sliding end | 38.81 | 37.03 | −4.57% |
| Track bed | Fixed end | 10.15 | 8.73 | −14.02% |
| Mid-span | 13.40 | 11.53 | −14.00% |
| Sliding end | 12.30 | 12.53 | 1.89% |
Table 4.
Stiffness degradation after thermal test.
Table 4.
Stiffness degradation after thermal test.
| Structural Parts | Before Thermal Test | Before Thermal Test | Stiffness Degradation Rate |
|---|
| Track structure | 33.82 | 29.71 | 14.96% |
| Track-bridge system | 329.61 | 321.29 | 2.52% |
© 2020 by the authors. Licensee MDPI, Basel, Switzerland. This article is an open access article distributed under the terms and conditions of the Creative Commons Attribution (CC BY) license (http://creativecommons.org/licenses/by/4.0/).

 and
and 


