Article

The Effect of Shape on Chloride Penetration of Circular Reinforcement Concrete Columns and Its Durability Design

College of Civil Engineering, Fuzhou University, Fuzhou 350108, China
*
Author to whom correspondence should be addressed.
Appl. Sci. 2020, 10(2), 459; https://doi.org/10.3390/app10020459
Submission received: 28 November 2019 / Revised: 22 December 2019 / Accepted: 26 December 2019 / Published: 8 January 2020
(This article belongs to the Special Issue Assessing and Extending the Service Life of Bridges)

Abstract

:
The reinforced concrete (RC) circular element is usually simplified as slab one on the issue of chloride diffusion simulation, without considering the effect of the geometrical shape. In the paper, a modified slab diffusion model is proposed for circular section. A formulation for estimating the error caused by neglecting the effect of shape on chloride diffusion is derived. The formulation demonstrates that radius significantly affect the error. When shape is neglected, the effects of model parameters, including the diffusion coefficient, radius, cover concrete thickness and age factor, on the corrosion initiation time are investigated. The result shows the radius has a slight effect on calculating the corrosion initiation time compared with other model parameters. Furthermore, the influence of shape on estimating on reliability index for different service time is also discussed. A guideline is proposed for properly using the modified slab diffusion model instead of the original one to predict service life. Finally, the impact of the shape of the RC circular column on the durability design against chloride corrosion is studied. The design result when the column is simplified as a slab element indicates a lower required minimum concrete cover thickness. The minimum thickness should be improved by 5 mm as a conservative choice based on the result of the slab element.

1. Introduction

Reinforced concrete circular columns are widely used for infrastructure construction. The columns exposed to the marine environment without added protection are continuously affected by chloride corrosion [1]. Corrosion activates the degradation of materials, causing loss of the bearing capacity of the column. The existing literature reported that a large cost of repair and replacement of US bridges every year are due to corrosion [2]. For the purpose of reducing the economic loss and insuring service security, predicting the chloride concentration on the surface of rebar during long-term servicing accurately using a reliable diffusion model is crucial.
Collepardi et al. [3] first used the one-dimensional (1D) Fick’s second law to obtain a chloride diffusion solution considering a constant diffusion coefficient. Mangat and Molloy [4] found a power law relationship between the diffusion coefficient and concrete age. They considered the diffusion coefficient as variable with time, updating and improving the 1D diffusion mathematic model. On the basis of this new diffusion model, several modified diffusion models are currently applied for the estimation of chloride penetration. For example, in the Duracrete report, a simplified 1D diffusion mathematical model considering the environment, test, and execution factors into diffusion coefficients was adopted as the basic model in durability design [5]. This diffusion model in the Duracrete report is also widely used to predict the time to corrosion initiation of RC structure subject to chloride corrosion [6,7]. Costa and Appleton [8] modified the model considering the surface chloride concentration as time-dependent parameter. Andrade et al. [9] also developed the model considering the effect of concrete skin on diffusion mechanism.
Obviously, numerous slab diffusion models based on 1D coordinates are available. However, in recent years, researchers are continuously clarifying the impact of the surface geometry element on chloride diffusion. Val and Trapper [10] employed finite difference (Crank–Nicolson) based on the two-dimensional (2D) Fick’s second law to calculate the probability of corrosion initiation in each bar inside a rectangular cross-section. The developed computer program replaces the difficult metathetic solution method with finite element analysis (FEA), which is effective in simulating chloride diffusion in an irregular section. Muthulingam et al. [11] adopted the FEA to describe chloride diffusion in a rectangular cross-section, obtaining the non-uniform corrosion state of rebar encased in concrete. Shafei et al. [12] estimated the corrosion initiation time of rebar in an RC circular column with three-dimensional (3D) coordinates using the same analysis method. Hu et al. [13] used the FEA to calculate the chloride concentration distribution of prestressed T-beam. For an RC structure, the achieved construction quality usually involves high scatter and variability. Meanwhile, the surrounding environment affects chloride penetration through concrete steadily. A probability-based estimation of the chloride diffusion process is necessary. Compared with FEA, a concise mathematical diffusion model is more convenient in achieving this. For a circular section, Morga and Marano [14] proposed a circular diffusion formulation dependent on Fick’s second law with polar coordinates, assuming a constant diffusion coefficient. The results showed that for a circular RC section, the chloride concentration estimated by the circular diffusion model is higher than that estimated by the slab model for the same position. Nevertheless, the earlier experimental study has revealed that the diffusion coefficient was a time-dependent variable [15]. Nilsson et al. [16] gave a detailed explanation about the character of the diffusion coefficient in term of long-term transport processes. Song et al. [17] pointed out that the diffusion coefficient decreases with time because of further hydration of the cement. On the basis of field investigations of six coastal concrete bridges of different ages built using ordinary Portland cement, Pack et al. [18] used regression analysis to prove that the diffusion coefficient strongly depends on time and decreases with age. Wu et al. [19] found that the diffusion model considering the diffusion coefficient as a function of time fits data measured in a filled well. As for the slab diffusion model, the circular diffusion model proposed by Morga and Morano [14] still requires improvement.
The durability design issue of an RC structure near a marine environment remains a growing concern. Significant research has been conducted for more rational chloride diffusion simulation. At the preliminary stage, the durability design, usually dependent on a prescriptive (deemed-to-satisfy) approach, is used in most design codes (ACI 2005; CNS 2008; CEN 2002) [20,21,22]. The improvement of the research on topic of chloride corrosion promotes the use of a probability-based approach. A chloride diffusion model as a basic design model in this approach significantly influences the durability design result. However, the slab diffusion model is commonly applied for RC elements on the durability design. The effect of the shape of the RC circular column on the design result requires further investigation. In this paper, considering time-dependence and shape effect, a basic diffusion model of chloride penetration in an RC circular column is deduced. The proposed diffusion model for a circular section is compared with the slab diffusion model neglecting the shape effect. The durability design difference between the two models is discussed for an RC circular column.

2. Circular Diffusion Model for a Cross-Section of an RC Circular Column

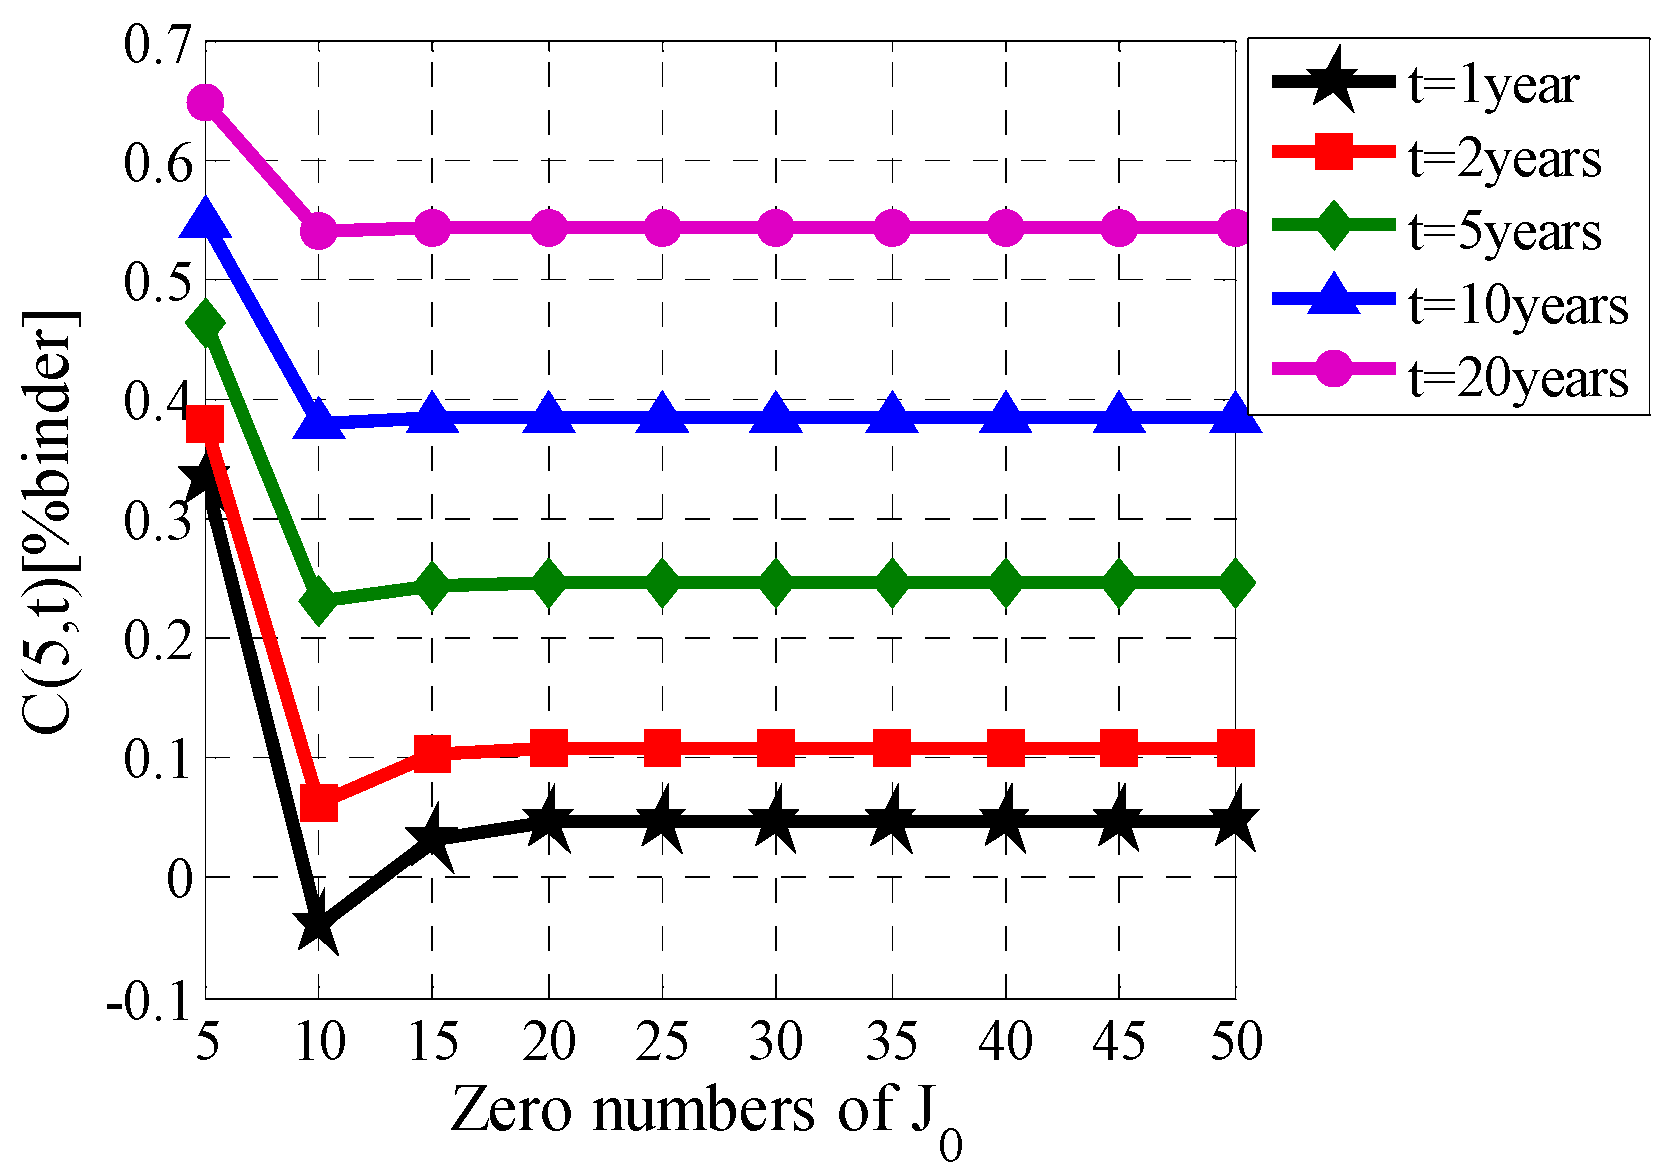
2.1. Theoretical Derivation

The transport mechanisms for chloride penetration into concrete are rather complicated. In general, diffusion, viewed as the primary avenue, is considered. Chloride diffusion through a circular concrete cross-section is described by Fick’s second law in polar coordinates as:
C ( ρ , t ) t = D ( 1 ρ C ( ρ , t ) ρ + 2 C ( ρ , t ) ρ 2 )
where D is the diffusion coefficient and C (ρ, t) represents the chloride concentration at a distance ρ from the center of the circular section at an instant t.
The initial boundary conditions before chloride diffusion are the following: (a) the chloride concentration is assumed as constant on the external surface of the column C ( R , t ) = C 0 t [ 0 , + ] , and (b) the initial chloride concentration inside the concrete at time zero is assumed at zero C ( ρ , 0 ) = 0   t [ 0 , R ] .
As the concrete servicing age increases for the situation neglecting the effect of the surrounding, D is expressed as follows [23]:
D ( t ) = D ref ( t ref t ) m = D i t m
where Dref is the diffusion coefficient at the referenced time tref and m represents the exponent coefficient.
According to the adaptation of variable separation methodology ( C ( ρ , t ) = F ( ρ ) T ( t ) ) and replacing D with D(t) according to Equation (2), Equation (1) is updated as:
( F ( ρ ) T ( t ) ) t = D i t m ( 1 ρ ( F ( ρ ) T ( t ) ) ρ + 2 ( F ( ρ ) T ( t ) ) ρ 2 )
Equation (3) is transformed as:
T ( t ) t m D i T ( t ) = 1 F ( ρ ) ( 1 ρ F ( ρ ) + F ( ρ ) )
The left side of Equation (4) contains a function of t only, and the right side of Equation (4) involves a function of ρ only, with constant λ making Equation (4) true. Therefore, Equation (4) is transformed into a mutually independent unary differential equation expressed as:
T ( t ) t m D i T ( t ) = λ
1 F ( ρ ) ( 1 ρ F ( ρ ) + F ( ρ ) ) = λ
The solution of Equation (5) is obtained as:
T ( t ) = A exp ( 1 1 m t 1 m λ D i )
Equation (6) is viewed as a Bessel differential equation, and thus, its solution is expressed as:
F ( ρ ) = B J 0 ( λ ρ ) + C Y 0 ( λ ρ )
where J0 represents the Bessel’s first function with order zero and Y0 denotes the Bessel’s second function with order zero. The parameters A, B, and C are undetermined coefficients, and on the basis of Equations (7) and (8), the specific formulation of C ( ρ , t ) = F ( ρ ) T ( t ) is:
C ( ρ , t ) = A exp ( 1 1 m t 1 m λ D i ) ( B J 0 ( λ ρ ) + C Y 0 ( λ ρ ) )
Furthermore, boundary conditions (a) and (b) are utilized, and the circular diffusion model is expressed as follows:
C cir ( x , t ) = C 0 { 1 2 R n = 1 1 α n J 0 ( ( R x ) α n ) J 1 ( R α n ) e ( 1 1 m α n 2 D i t 1 m ) }
where C(x,t) represents the chloride concentration at distance x from the external surface at time t, R denotes the radius of the RC circular column, J1 is Bessel’s first function with order one, and α m depends on the solution of J 0 ( R α m ) = 0 .
Assuming that the circular section is oversimplified as a slab element directly, the corresponding slab diffusion model is given as [23]:
C slab ( x , t ) = C 0 [ 1 e r f { x / ( 2 1 1 m D i t 1 m ) } ]

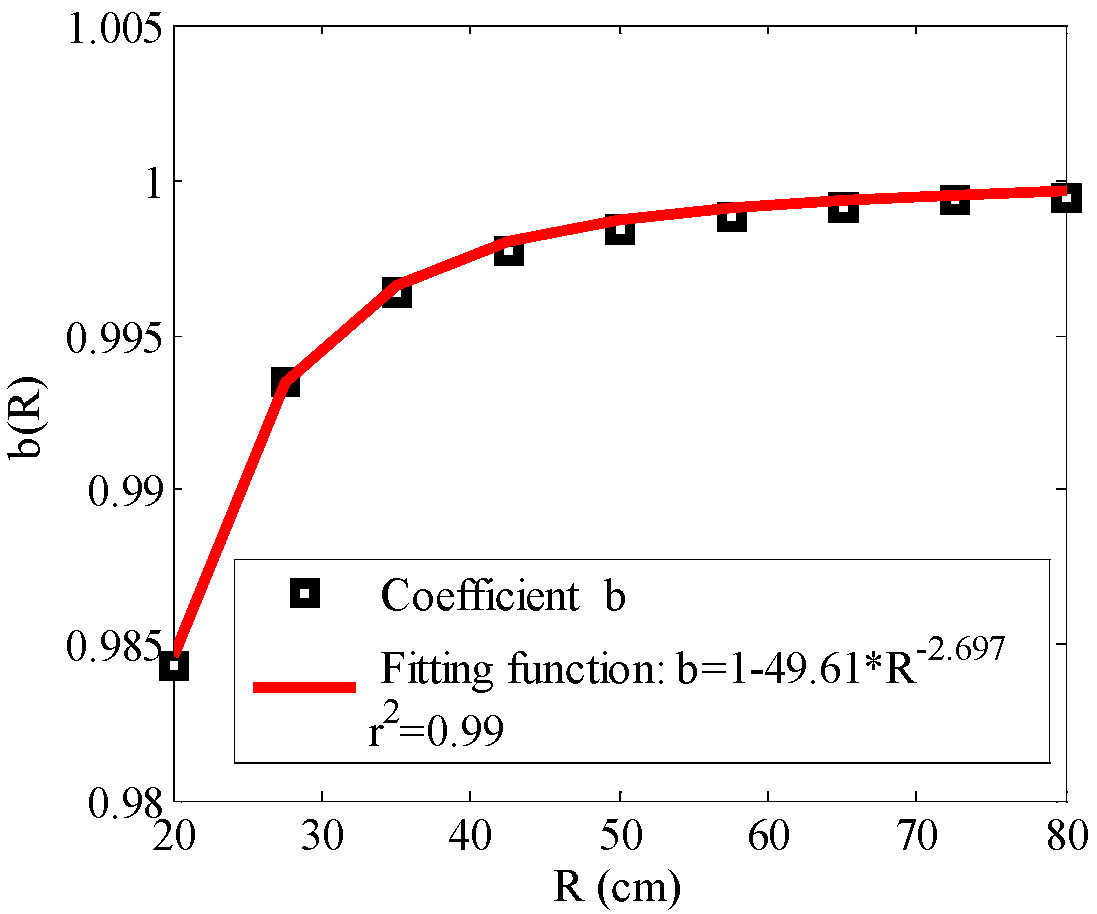
2.2. Statistical Properties of Model Parameters

The statistical properties of the model parameters involved are closely connected with the environment around the concrete structure, thereby performing greater randomness [24]. In general, the exposure classes of the coastal column are the following: the submerged, splashing and tidal, and atmospheric zones. In the durability design work of the Hong Kong–Zhuhai–Macau (HZM) project against the chloride attack, Li et al. [25] summarized the probability distribution of the surface chloride concentration C0 and age factor m as presented in Table 1.
Because of the means of both diffusion coefficient and concrete cover thickness as a design control object, Li et al. [25] modeled the diffusion coefficient with lognormal distribution with a coefficient of variation of 0.2 and concrete cover thickness with normal distribution with a standard deviation of 5.3 mm. To facilitate subsequent analysis, for Portland cement concrete, the mean predicted 28-day diffusion coefficient of concrete is calculated as follows [26]:
D 28 = 10 12.06 + 2.4 ( w / c )
where D28 represents the diffusion coefficient for 28 days of tref and w/c is the water-to-cement ratio.

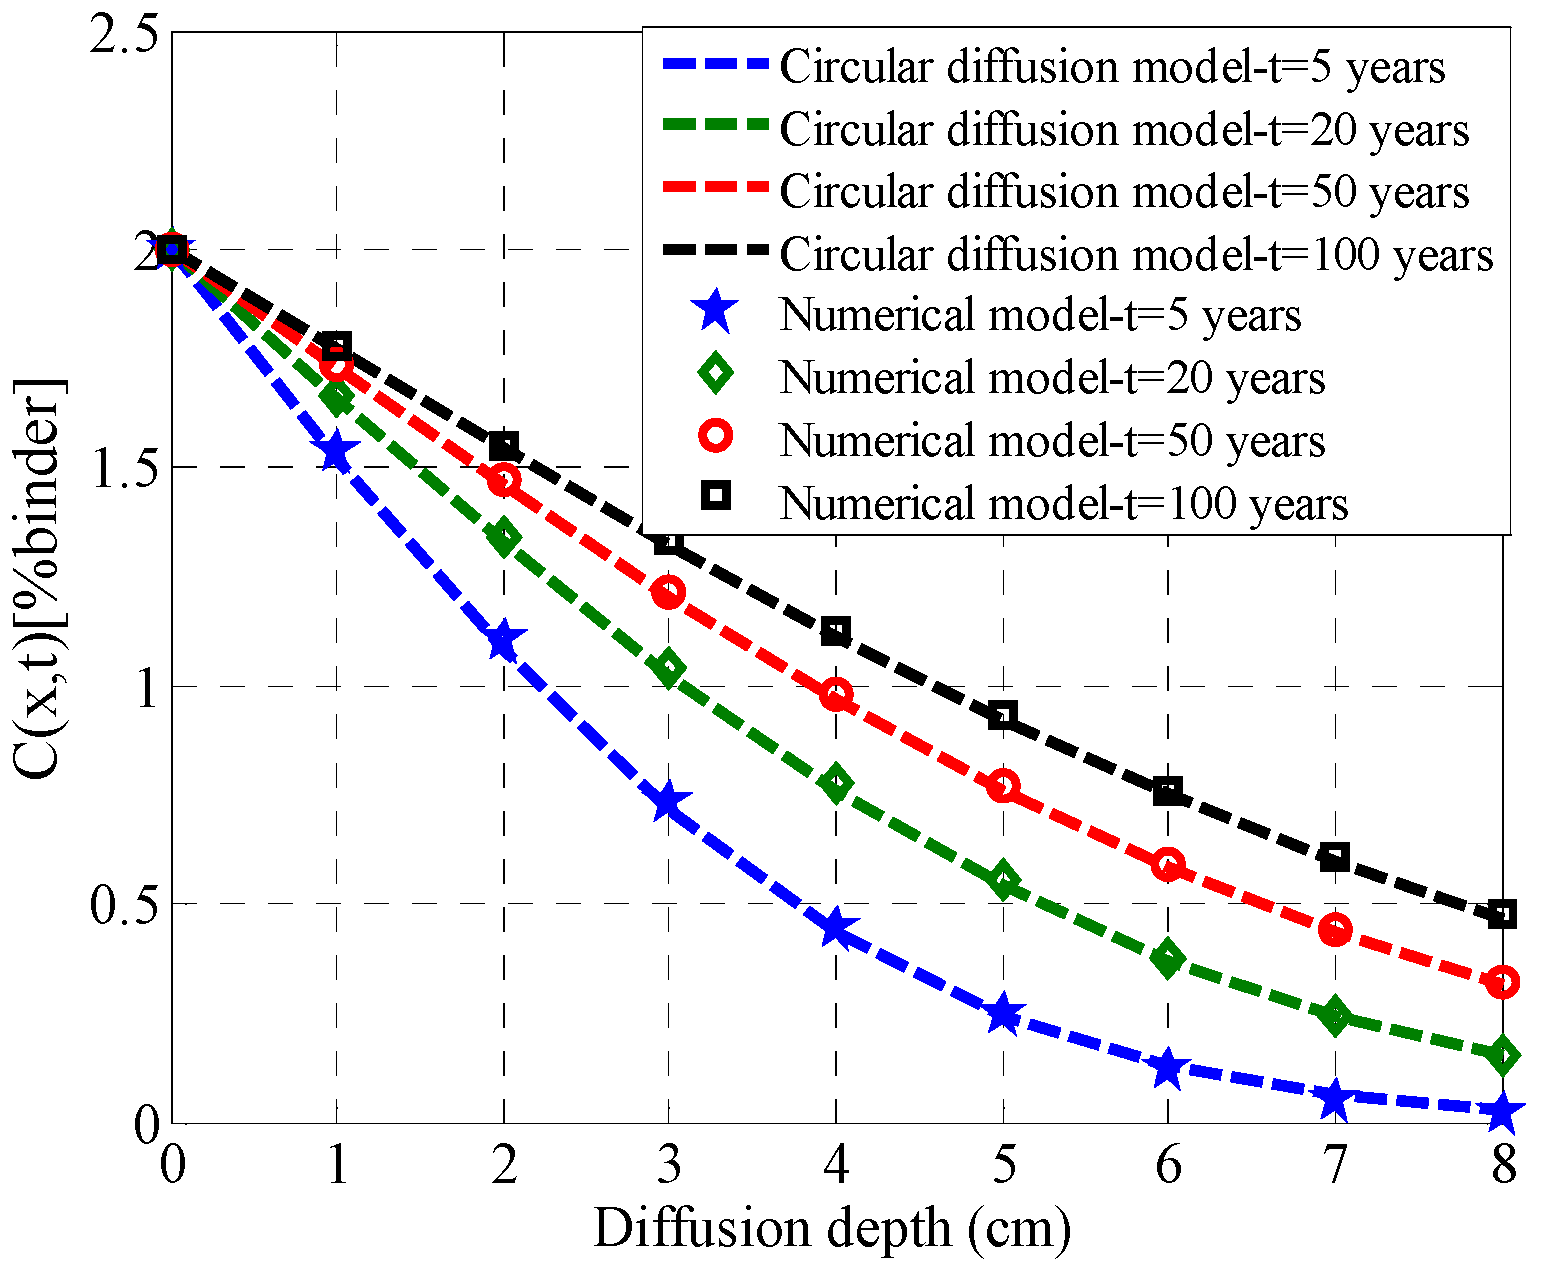
2.3. Validation Using a Numerical Model

Effects of zero numbers of zero-order Bessel functions on the accuracy of the circular diffusion model are firstly discussed. The RC circular column with a radius of 50 cm in atmospheric zone is taken as an example, and the w/c for Portland cement type of that is 0.5. According to Equation (12), the mean value of D28 is 4.35 cm2/a. The mean values of C0 and m selected from Table 1 are 2% of the weight of the binder and 0.53, respectively. The diffusion depth is set at 5 cm. The final analysis result is presented in Figure 1. Figure 1 clearly indicates that the estimation results of the circular diffusion model keep stable when zero numbers exceed 20.
Transient analysis of the thin material transfer module in the COMSOL Multiphysics software undertakes the simulation of chloride diffusion. Considering concrete material in a section as homogeneous, the comparison between the distribution of chloride concentration at whole section estimated by the numerical model and that estimated by the circular diffusion model is displayed in Figure 2. The result verifies the accuracy and applicability of the circular diffusion model obtained by variable separation methodology.

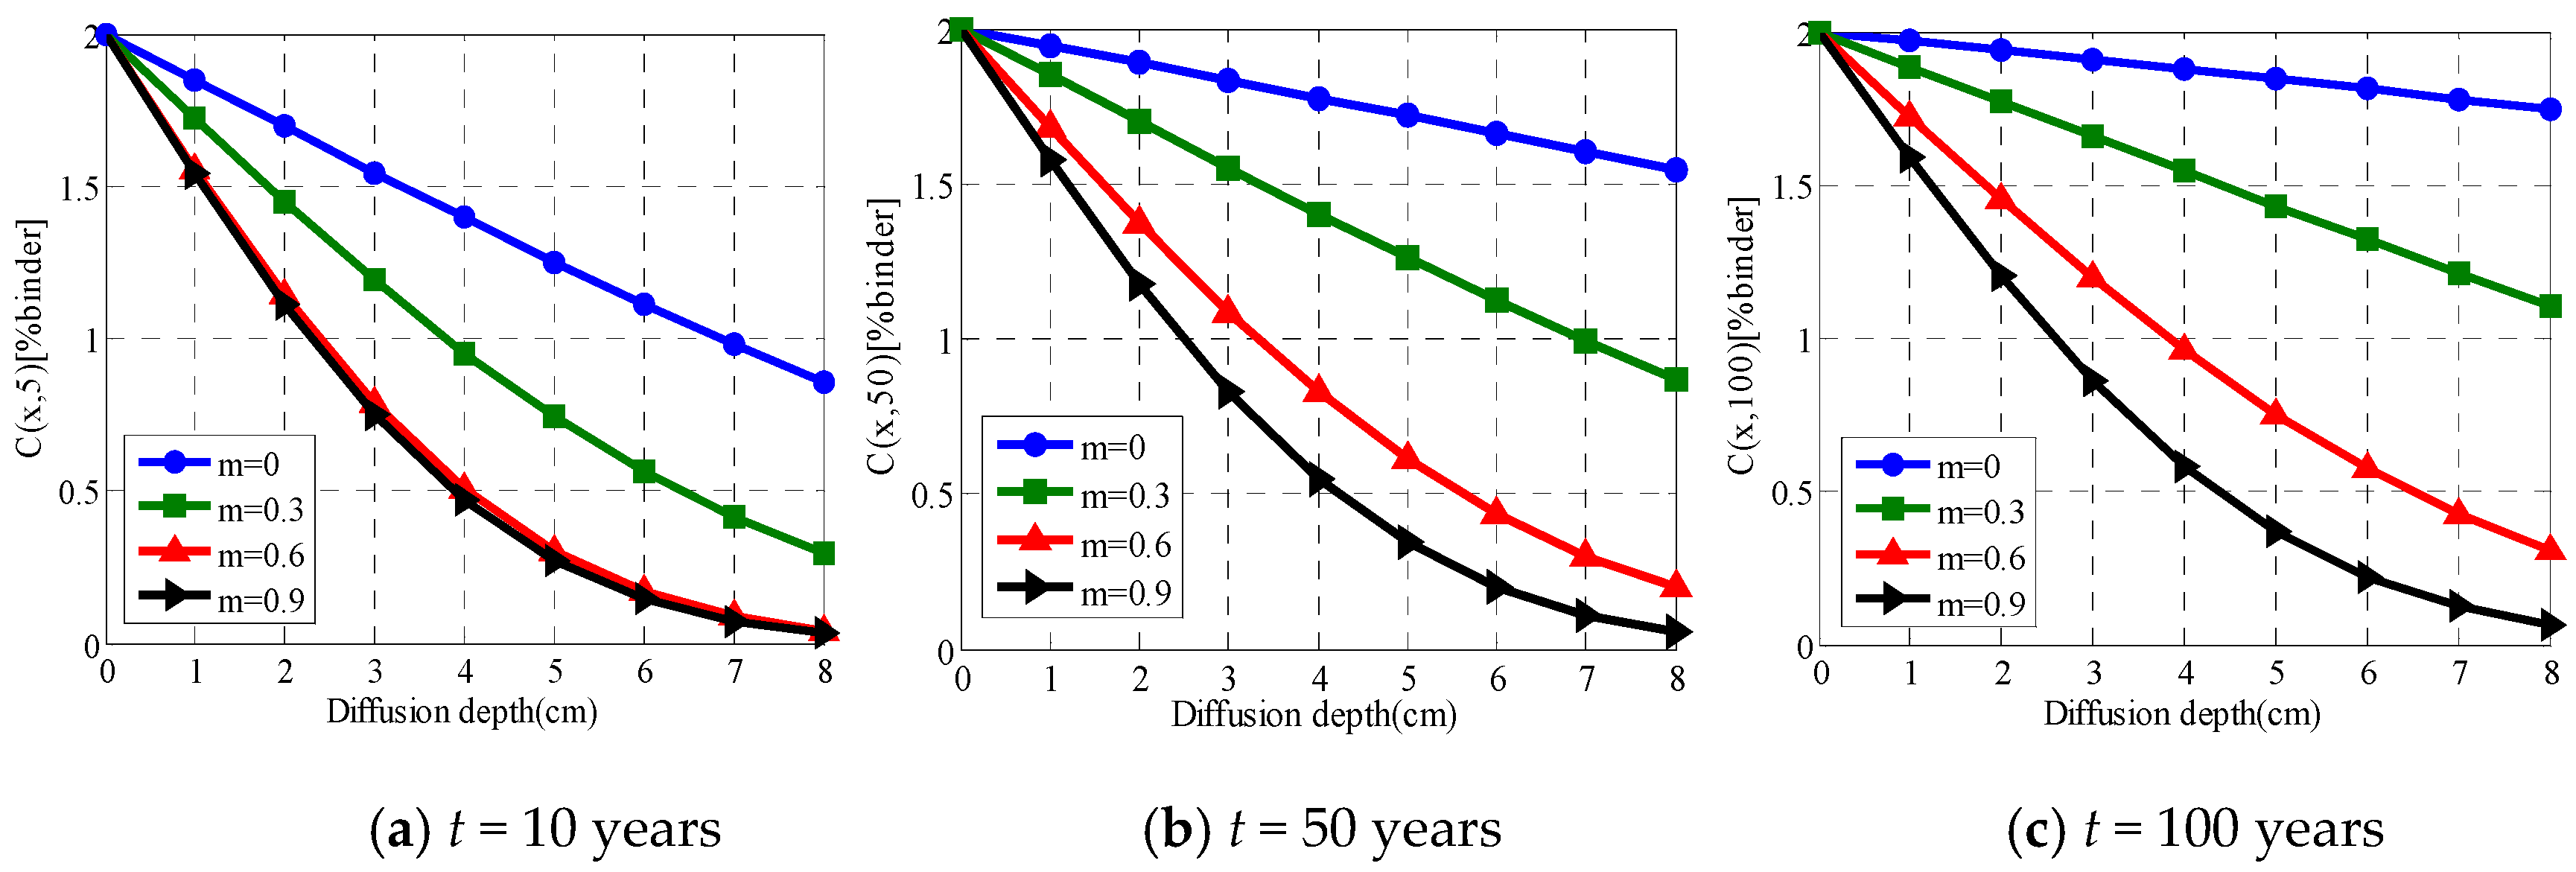
2.4. The Effect of a Time-Variant Diffusion Coefficient on Chloride Diffusion

The model parameters, including D28 and C0, stay the same as in Section 2.3 with a series of assumed m of 0, 0.3, 0.6, and 0.9. For a given diffusion time, the chloride distribution and the diffusion depth under different m values are exhibited in Figure 3. In particular, the diffusion coefficient attains a constant value over time for m = 0. Clearly, in Figure 3 the distribution of chloride concentration is significantly overestimated at m of 0. The larger diffusion time and smaller age factor the more evident that is. Consequently, it will lead to an underestimation of the service life of the RC column. The higher the m, the faster the diffusion coefficient degrades simultaneously. This explains the lower concentrations at the same diffusion depth for higher m.

3. Comparison between Circular and Slab Diffusion Models

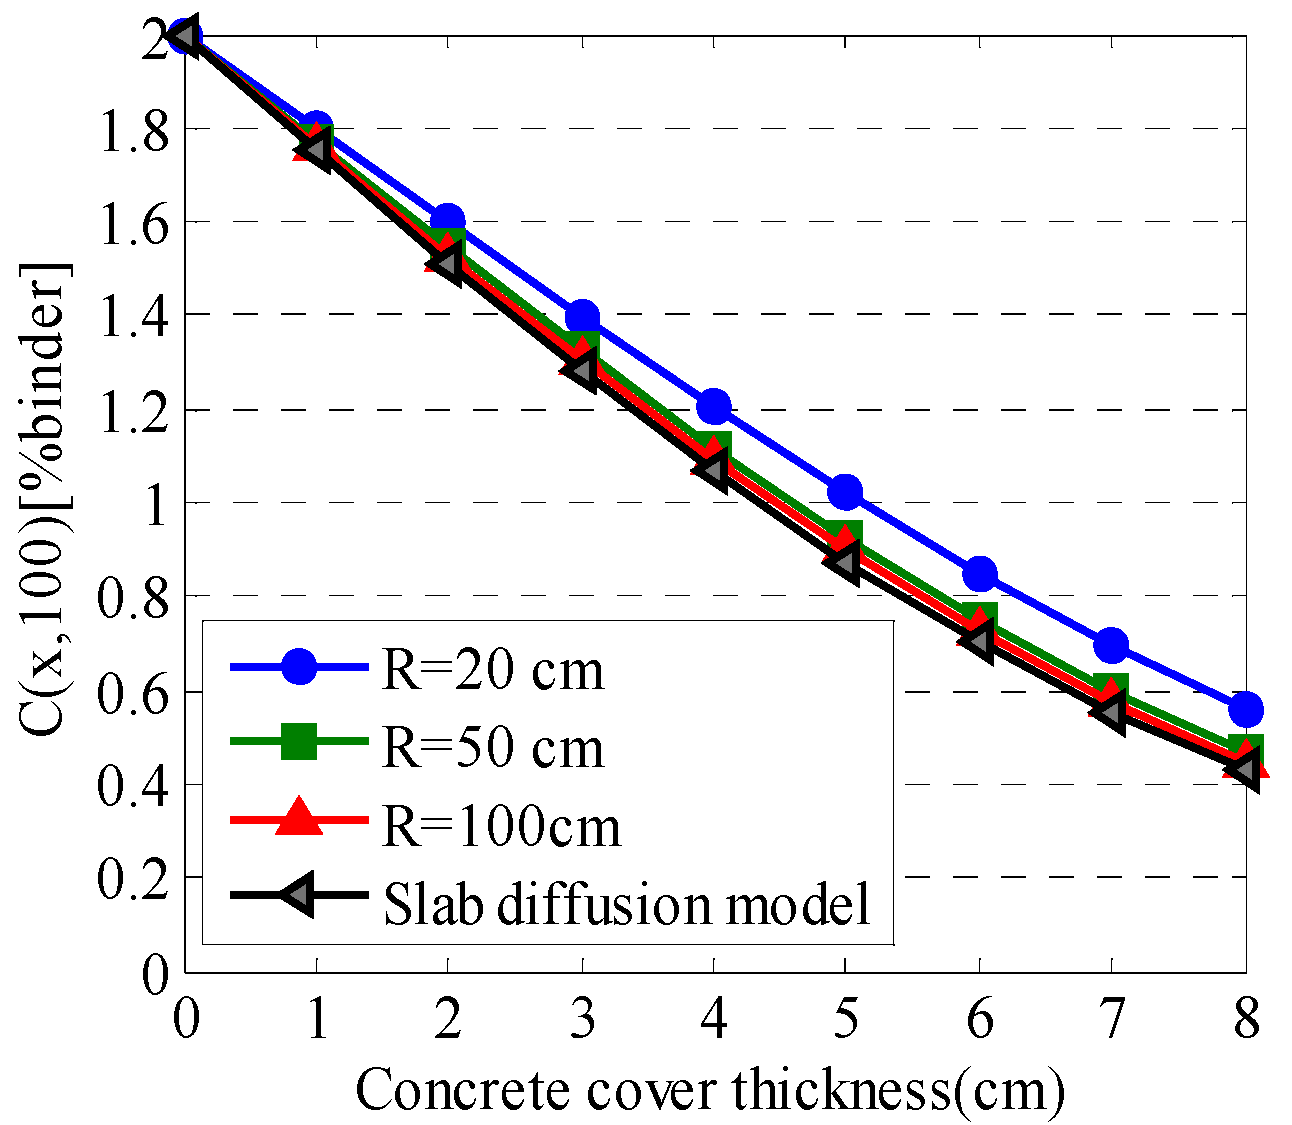
3.1. Chloride Concentration Estimation

The sound and reliable estimation of chloride ion concentration on the surface of steel bars is significant. Here, this concentration, labeled C, is compared for estimates from the slab diffusion and the circular diffusion model. The 28-day diffusion coefficient D28 is set at 4.35 cm2/a, with an age factor m of 0.53, and the surface chloride concentration C0 is assumed at 2% of the binder weight. The effect of the shape on the chloride concentration on the surface of rebar during diffusion process is analyzed, as shown in Figure 4 and Figure 5. Figure 4 and Figure 5 highlight that for an RC circular section, the slab diffusion model underestimates the chloride concentration. As the radius increasing, the difference between the circular diffusion and slab diffusion models deceases gradually, implying that the effect of the circular cross-section diminishes slowly.
For an RC circuar column, Ccir/Cslab is introduced to measure the error on the work of using the slab diffusion model. The impact of the model parameters on Ccir/Cslab is disscused according to the sensitivity analysis methodology. Diffusion time, radius of the RC circualr column, and concrete cover thickness are labeled as t, R, and x, respectively. Obvioulsy, according to Equations (11) and (12), it can be found that Ccir/Cslab has no relation with C0. The change interval of other model parameters are listed in Table 2. During this analysis, one model parameter varies, with the others kept fixed. The final result is presented in Figure 6. It can be seen in Figure 6 that both higher x and smaller R will lead to the increase in Ccir/Cslab. Nevertheless, m, D28, and t have a very slight influence on this value. Distinctly, both R and x are more sensitivitive to Ccir/Cslab than the other model parameters.
On the basis of the observation from the sensitivity analysis, Ccir/Cslab is rewritten as a function using the radius of column and the concrete cover thickness. Assuming that D28, m, t, and R are fixed at the mean value, the Ccir/Cslab variation against x is plotted in Figure 7. The regression fitting result indicates that Ccir/Cslab can also be modeled using a linear function. Hence, Ccir/Cslab is expressed as follows:
C cir C slab ( R , x ) = k ( R ) × x + b ( R )
where the coefficents k and b are functions with R only.
Considering a series of R, the values of k and b corresponding to each R are obtained by adopting the same regression fitting analysis with Figure 7. The final results are presented in Figure 8 and Figure 9. In Figure 8 and Figure 9, the specific forms of k(R) and b(R) are expressed after the regression fitting analysis again. Figure 8 shows that the coefficent b varies slightly with R and is simplified as a constant value of 1. Thus, the final form of Equation (13) for calculating Ccir/Cslab is expressed as follows:
C cir C slab ( R , x ) = 1.8 R 1.3 x + 1
According to Equation (14), the new diffusion model for circular section based on modifying slab diffusion model is expressed as:
C cir ( x , t ) = K s C 0 [ 1 e r f { x / ( 2 1 1 m D i t 1 m ) } ]
where Ks represents the shape influence coefficient of circular section, Ks = 1.8 R−1.3 x + 1.
The error η for using the slab diffusion model in estimating C for the RC circular column is expressed as:
η C = 1 C cir C slab ( R , x ) = 1.8 R 1.3 x
ηc corresponding to the concrete cover thickness of 4, 5, and 6 cm estimated by using Equation (16), is displayed in Figure 10. Figure 10 shows that the maximum error is over 20%. And for errors within 5%, the modified slab diffusion model (Equation (15)) is preferable for a circular column radius below 60 cm.

3.2. The Pre-Corrosion Initiation Time for the RC Circular Column

The chloride threshold concentration Ccr is closely related to the time required for corrosion initiation of a concrete structure. The JSCE (Japan Society of Civil Engineering) proposed a value of 1.2 kg/m3 for the Ccr [27], but Stewart et al. [24] emphasized that, according to numerous studies, the value ranges from 0.6 to 1.2 kg/m3. Since this value depends on the steel material, concrete material composition, and external environment, the statistical variation in the property is unsurprising, but highlights the need for further research on the Ccr. The Ccr applied in the durability design of the HZM project adopted here is summarized in Table 3.
During the pre-corrosion initiation period, the chloride concentration at the rebar depth is equal to the Ccr. The time to corrosion initiation of RC circular column is calculated by modified slab diffusion model (Equation (15)), which, calculated by original slab diffusion model (Equation (11)), are expressed as:
T i-cir = { x 2 4 [ e r f 1 ( 1 C c r ( 1.8 R 1.3 x + 1 ) C s ) ] 2 1 m D i } 1 1 m
T i-slab = { x 2 4 [ e r f 1 ( 1 C c r C s ) ] 2 1 m D i } 1 1 m
ΔTi represents the difference value between Ti-cir and Ti-slab. A sensitivity analysis of model parameters for ΔTi is also performed. The ranges of the intervals for C0 and Ccr are presented in Table 4, and the ranges of the interval of the other parameters in Table 2 are employed. In Table 4, the mean values of the model parameters are selected from the atmospheric zone, kept the same background with Table 2. The final analysis result is presented in Figure 11. Figure 11 reveals that higher Ccr, c, x, and m increase ΔTi, whereas higher C0, D28, and R decrease ΔTi. Compared with other parameters, R and D28 only mildly affect ΔTi.

3.3. Durability Design of the RC Circular Column against Chloride Degradation

3.3.1. Basic Model

For a concrete structure against chloride corrosion, the durability limit states (DLS) is defined as the corrosion initiation state of the rebar. The full probability method is applied on this design. On the basis of Equations (15) and (11), the two different basic design models for an RC circular section under the target life td are rewritten as follows:
G = C cr ( 1.8 R 1.3 x + 1 ) C 0 [ 1 e r f ( x / ( 2 1 1 m D i t SL 1 m ) ) ]
G = C cr C 0 [ 1 e r f ( x / ( 2 1 1 m D i t SL 1 m ) ) ]
The Life-365 program suggested that for durability design, the decrease law of the diffusion coefficient is truncated once t exceeds 30 years as shown below [26]:
D ( t ) | t > t D = D ( t D ) t D = 30 years
The reliability index β as an important reference value of assessing the durability performance is calculated as follows:
β = Φ 1 ( 1 p f )
where Φ represents a normal distribution and pf is the failure probability corresponding to the DLS.
Monte Carlo simulation is adopted to calculate the failure probability. In this method, the sampling is constructed based on the statistical distribution assigned for each random variable. Then, the states of safety and failure are evaluated using Equation (19) or Equation (20) above. Indeed, pf is calculated using the following expression:
p f = 1 N i = 1 N I ( x i )
where N represents the number of samples and the function I(xi) is:
I ( x i ) = { 1 G 0 0 G > 0

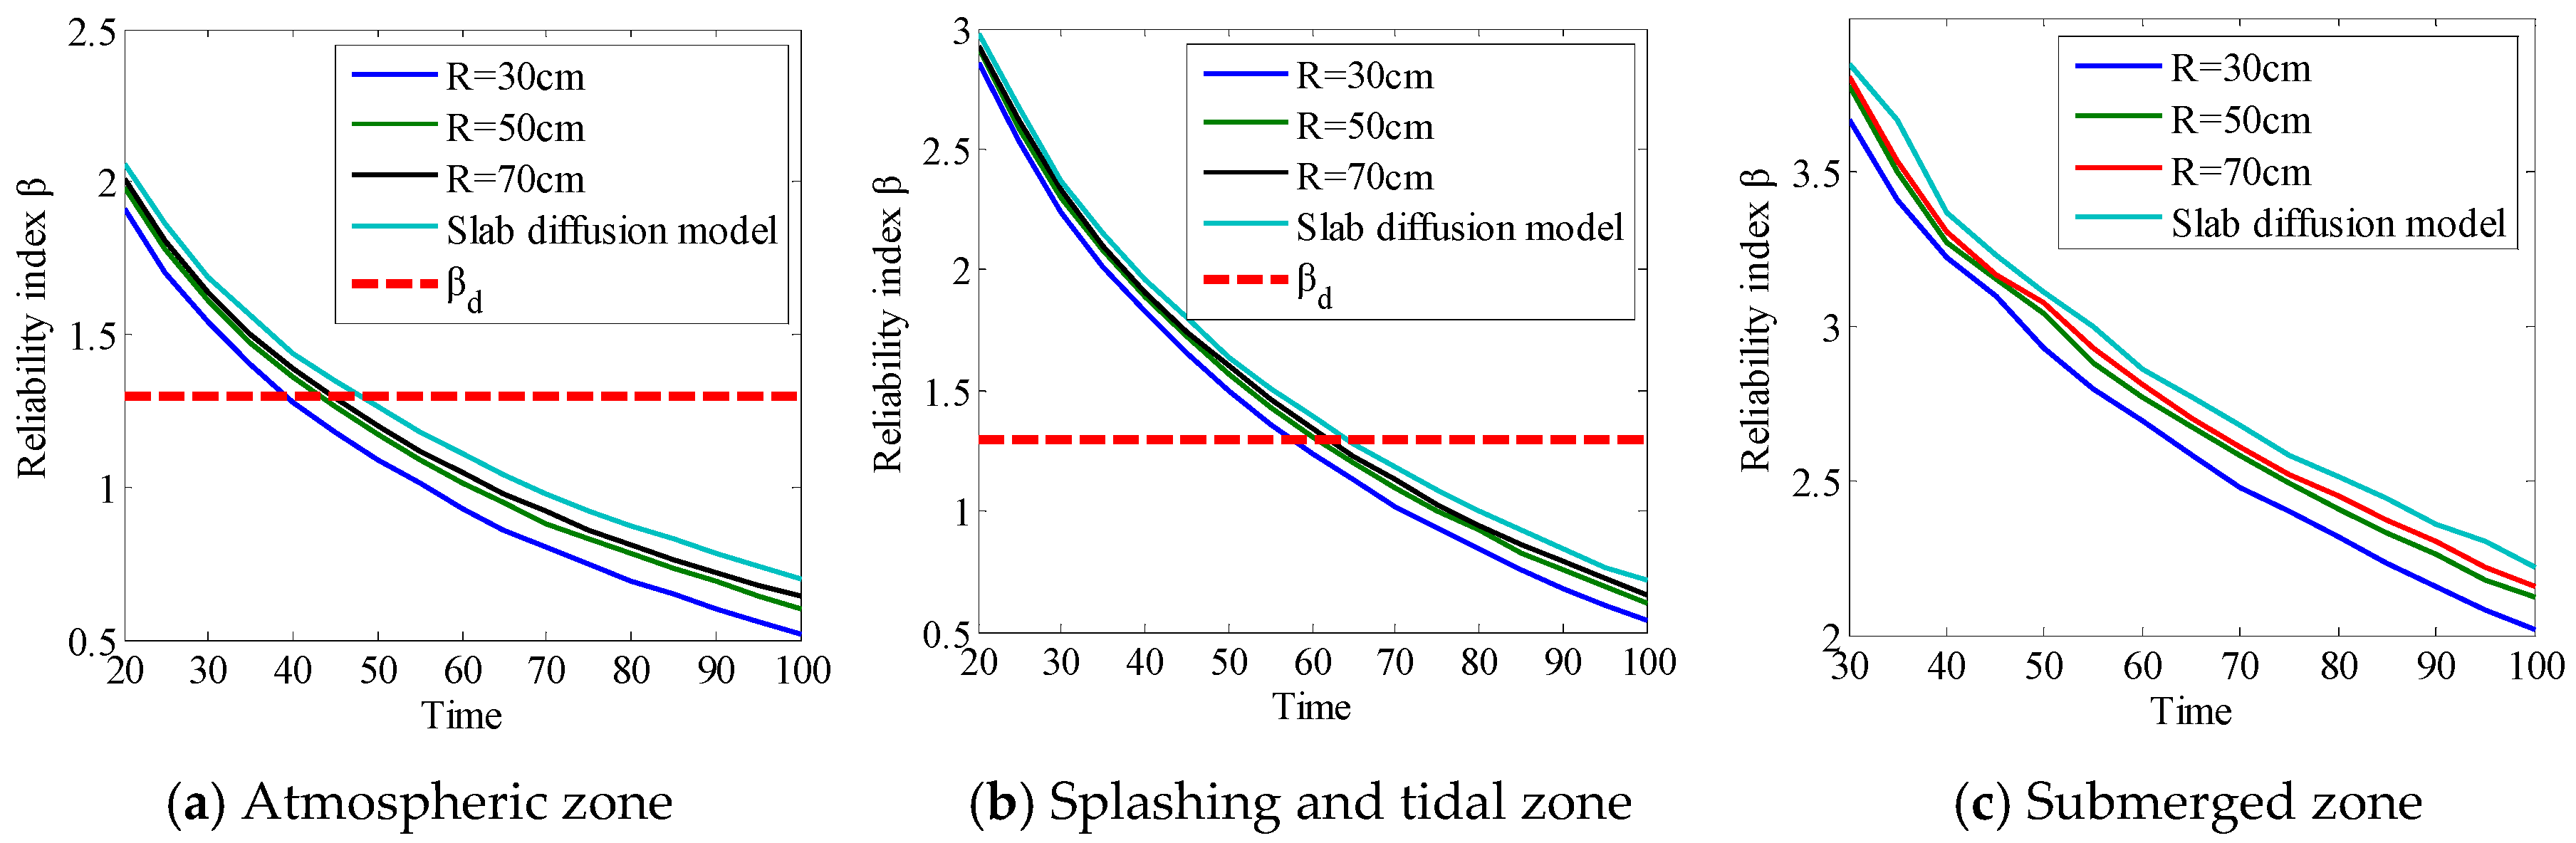
3.3.2. The Effect of RC Circular Section Shape on the Estimation of Reliability Index

Taking reference on the field research results of Li et al. [28], for splashing, tidal and submerged zones the mean chloride diffusion coefficients of concrete was 2.32 × 10⁻¹² m2/s and the mean concrete cover thickness was 36 mm whereas the mean chloride diffusion coefficients and concrete cover thickness were 4.38 × 10⁻¹² m2/s and 52 mm for atmospheric zone. And water/cement ratio used in marine environment is 0.33. The statistical properties of model parameters in Table 2 and Table 4 used in the HZM project are suitable for structural concrete having w/c = 0.35. Thus, these model parameters are available for service life prediction of RC circular column. The design reliability index βd of the RC facilities in the HZM Project was set to 1.3 [29]. The same target reliability index is adopted in this paper. Sampling numbers of 100,000 is generated for Monte Carlo simulation. Under a series of radius of circular section, the reliability index for different service time is calculated, as shown in Figure 12. It can be seen from Figure 12 that the reliability index is overestimated when circular column is regarded as slab element. The data collected in Table 5 indicates that the service life of circular column is also overestimated by slab diffusion model. For the radius of column less 50 cm, the effect of RC circular column shape should be considered.

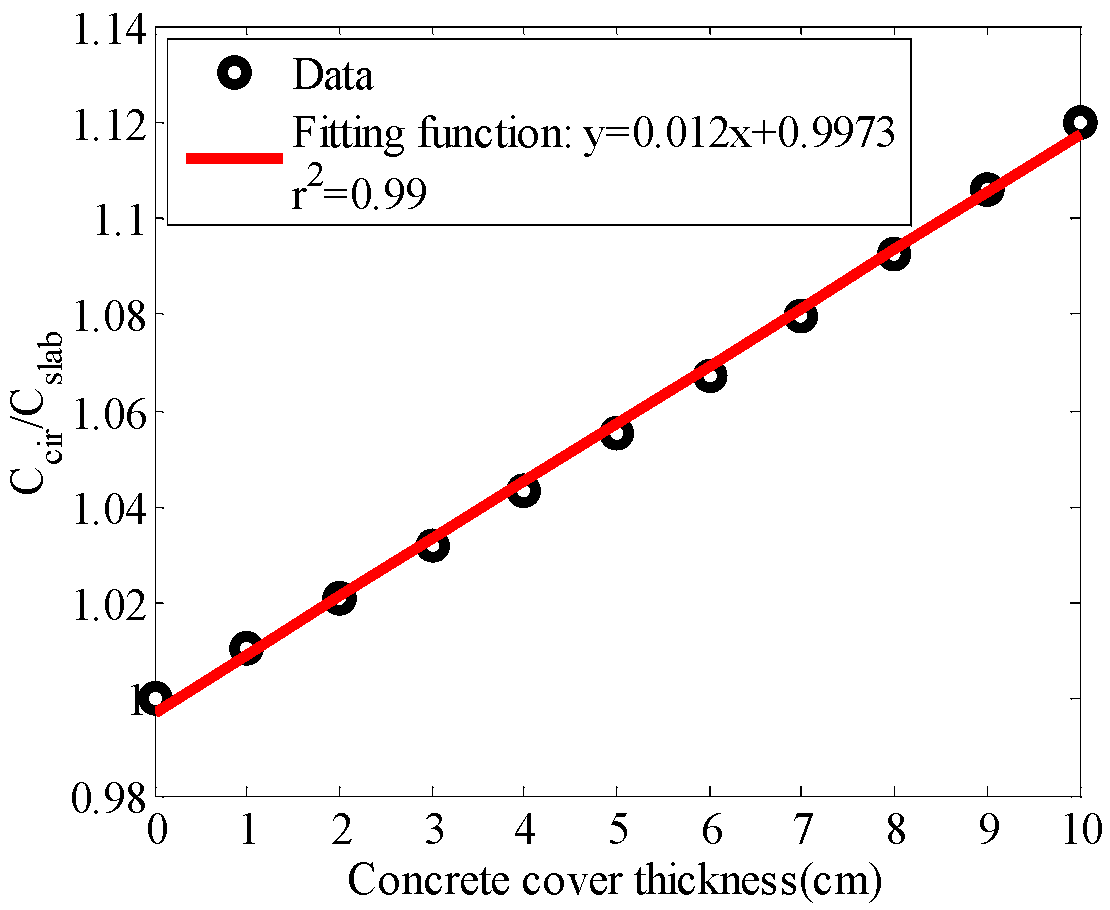
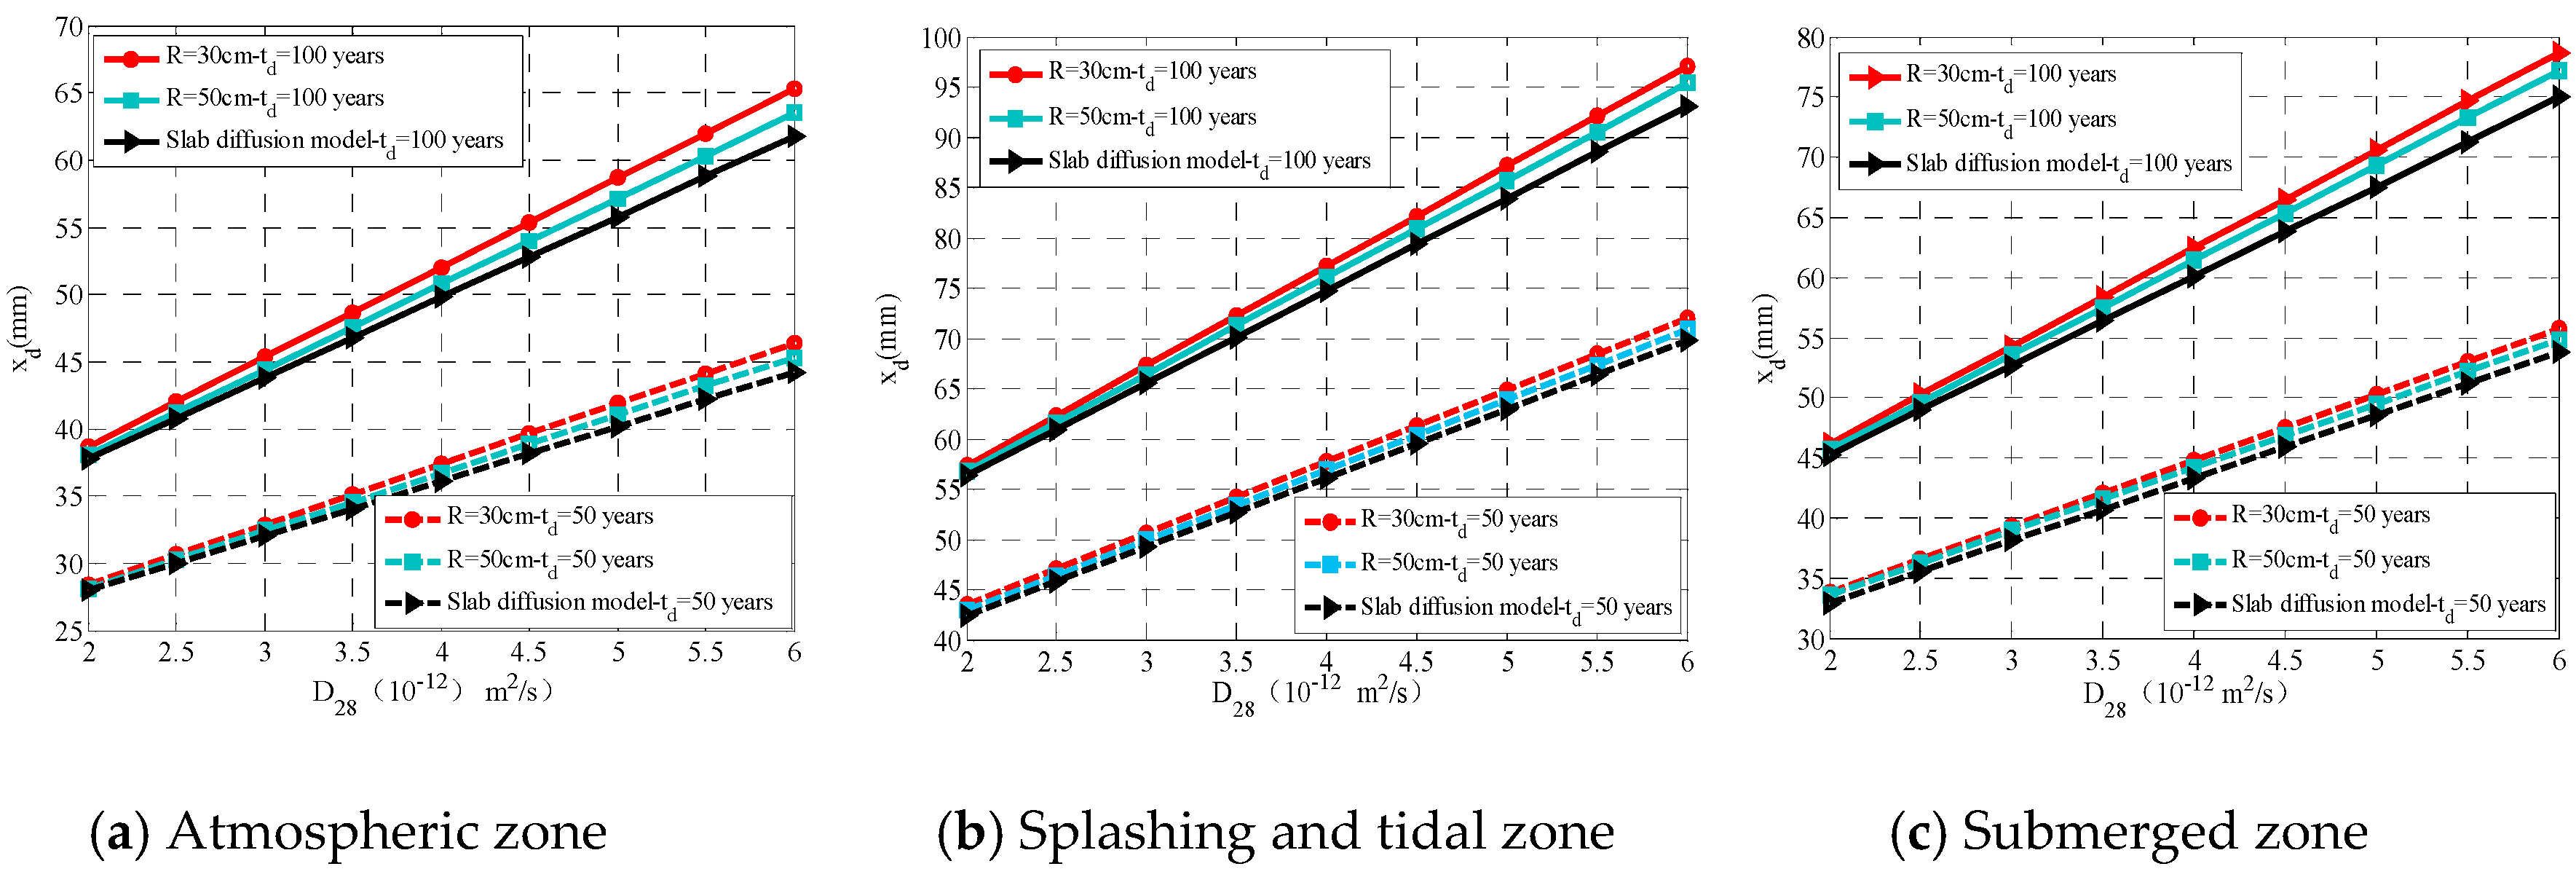
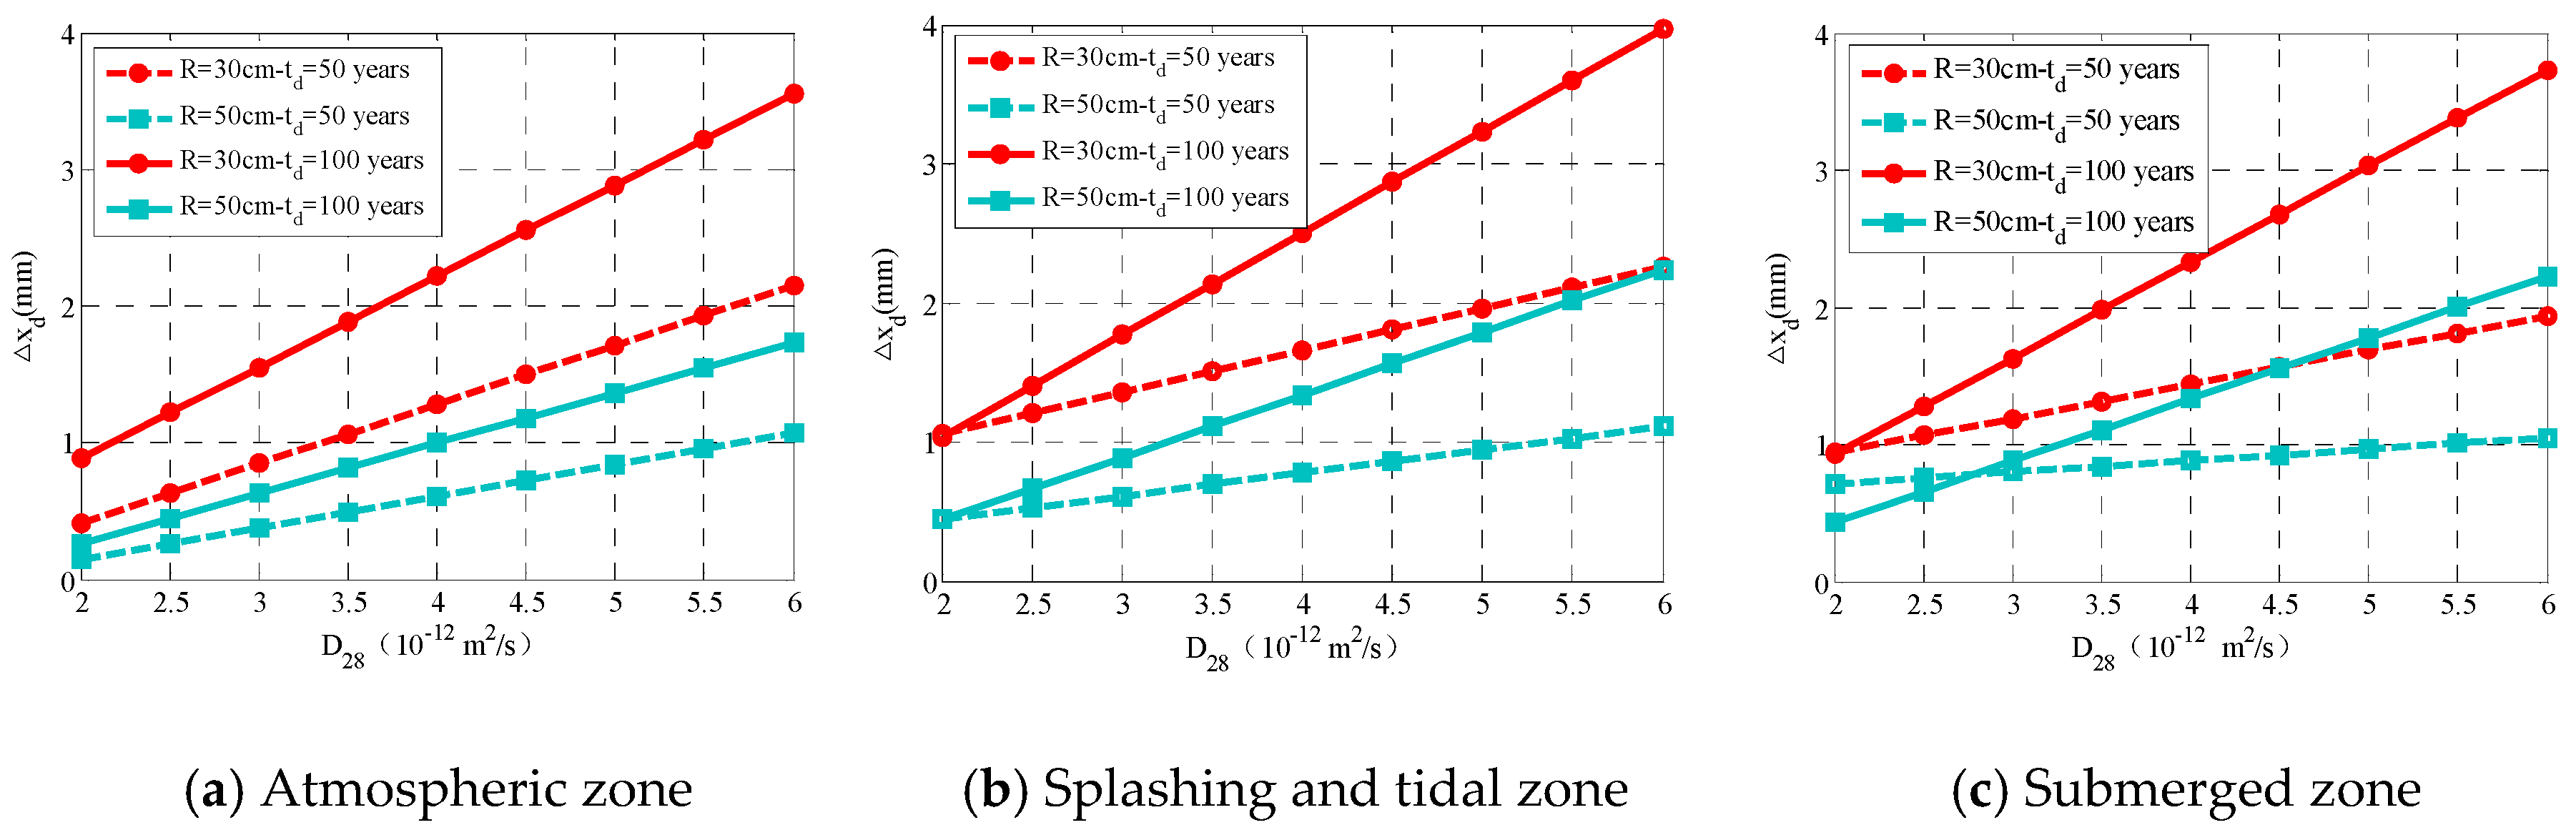
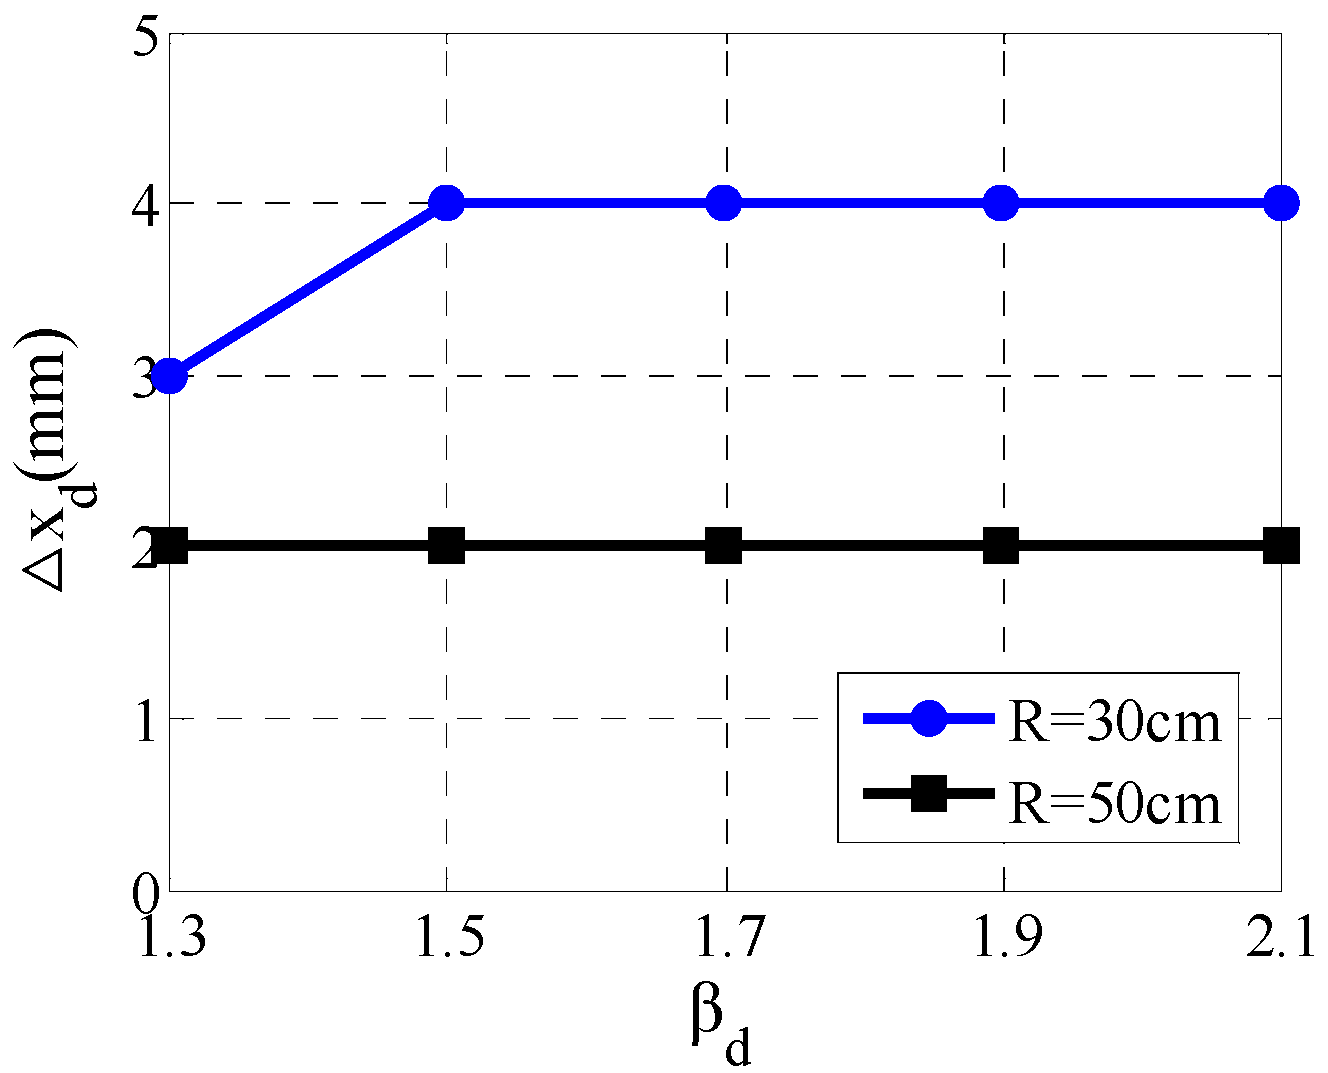
3.3.3. Chloride Diffusion Coefficient D28 and Concrete Cover Thickness xd

Given the design value of the chloride diffusion coefficient D28, the βd is satisfied by adjusting the minimum concrete cover thickness xd. The preliminary durability design result of xd corresponding to a series of D28 is shown in Figure 13. Clearly, for the RC circular column, the value of the minimum cover thickness designed by the original slab diffusion model is lower than that designed by the modified slab one. The Δxd is labeled as the difference between the design values of the minimum cover concrete thickness. Based on Figure 13, the Δxd as a function of D28 is displayed in Figure 14, with an evident linear relationship. Meanwhile, the reduction of the radius also increases the Δxd. For an expected lifetime of 50 years, the maximum value of Δxd is 2 mm when the radius is 30 cm. This value increases to 4 mm when the lifetime is 100 years. These data illustrate that the RC circular column shape minimally affects the design results. As a conservative choice, the minimum concrete cover thickness increases by 5 mm based on the design result of the original slab diffusion model.
The circular RC column for the atmospheric zone assumes a td of 100 years, with a fixed 28-day diffusion coefficient of 6 × 10⁻¹² m2/a, and the relationship between Δxd and βd is shown in Figure 15. Obviously, the effect of βd on Δxd can be overlooked.

4. Conclusions

In this study, a circular diffusion model is first deduced by considering the diffusion coefficient as a time-dependent variable. The comparison between the circular diffusion and slab diffusion models in term of chloride diffusion, estimating the pre-corrosion initiation time and durability design are analyzed. Replacing the complicated form of circular diffusion model, a modified slab one for circular section is proposed. The ensuing conclusions are as follows:
(a)
The use of a constant diffusion coefficient causes the overestimation of the chloride concentration distribution, shortening the service life of the structure.
(b)
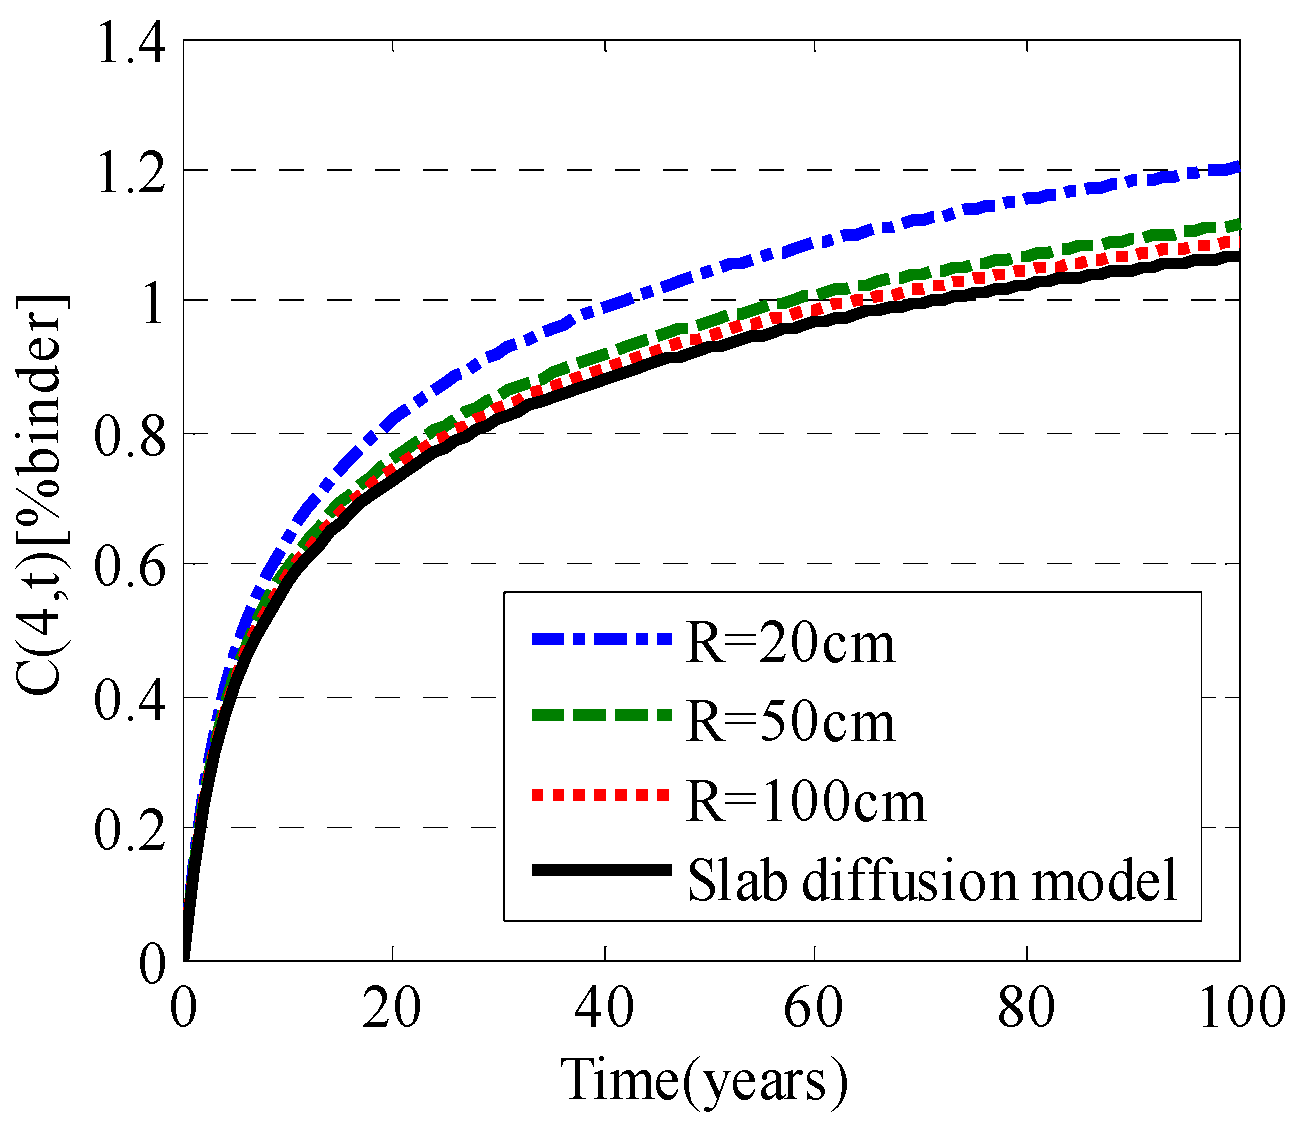
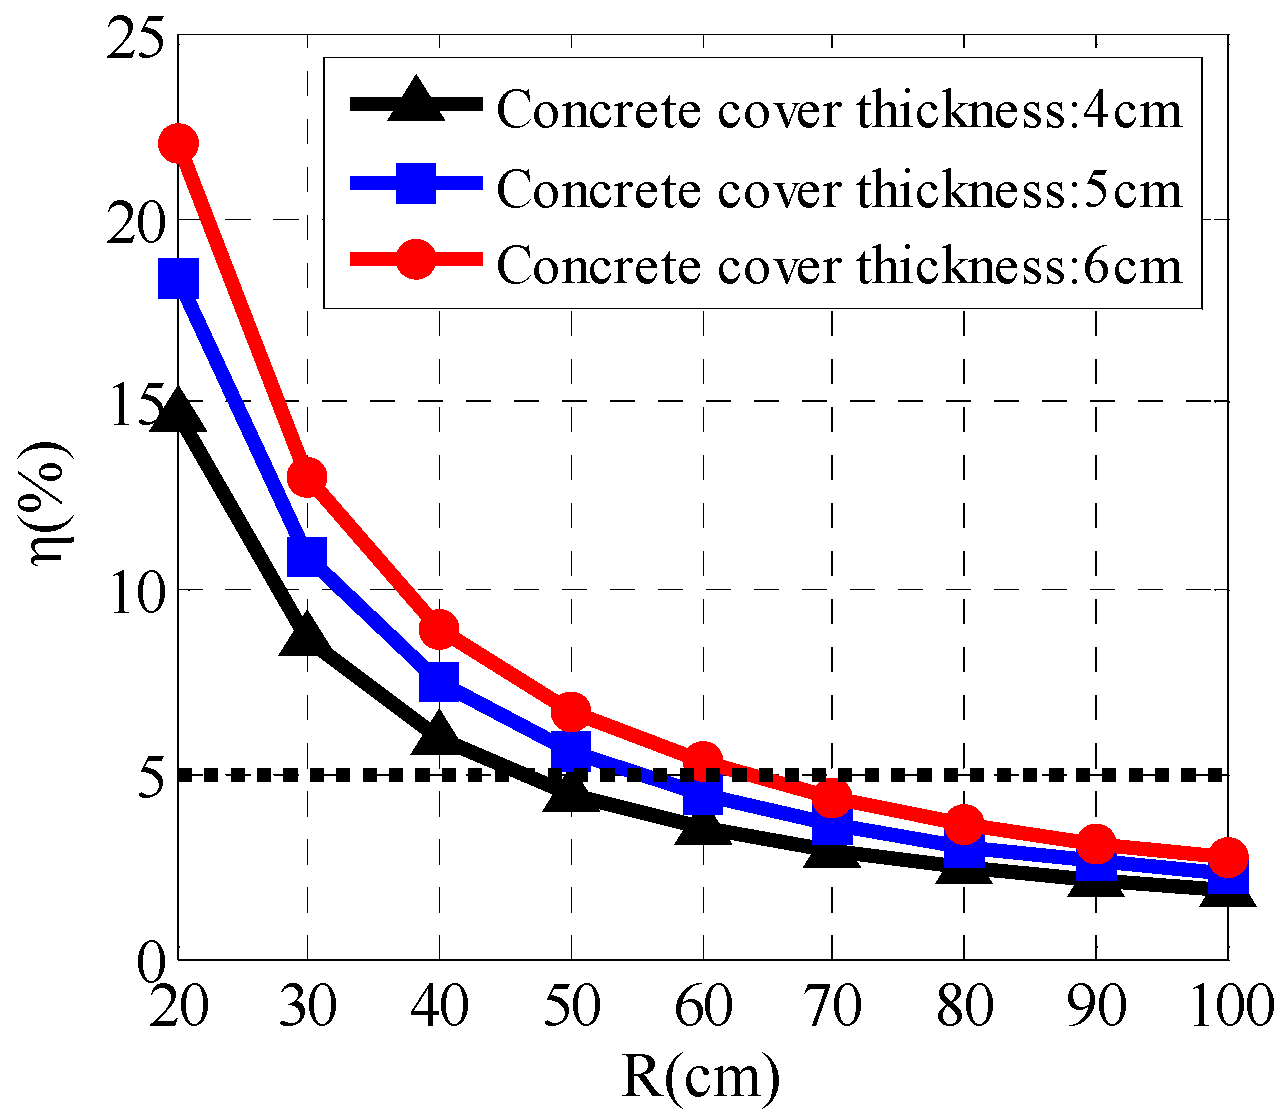
The shape of the circular section element accelerates chloride diffusion compared with the slab element. The error caused by adopting the slab diffusion model shows close relationships with the radius and the diffusion depth. The decrease of the radius of column and the increase of the diffusion depth enlarge this error. In general, the modified slab diffusion model is preferable for a radius below 60 cm.
(c)
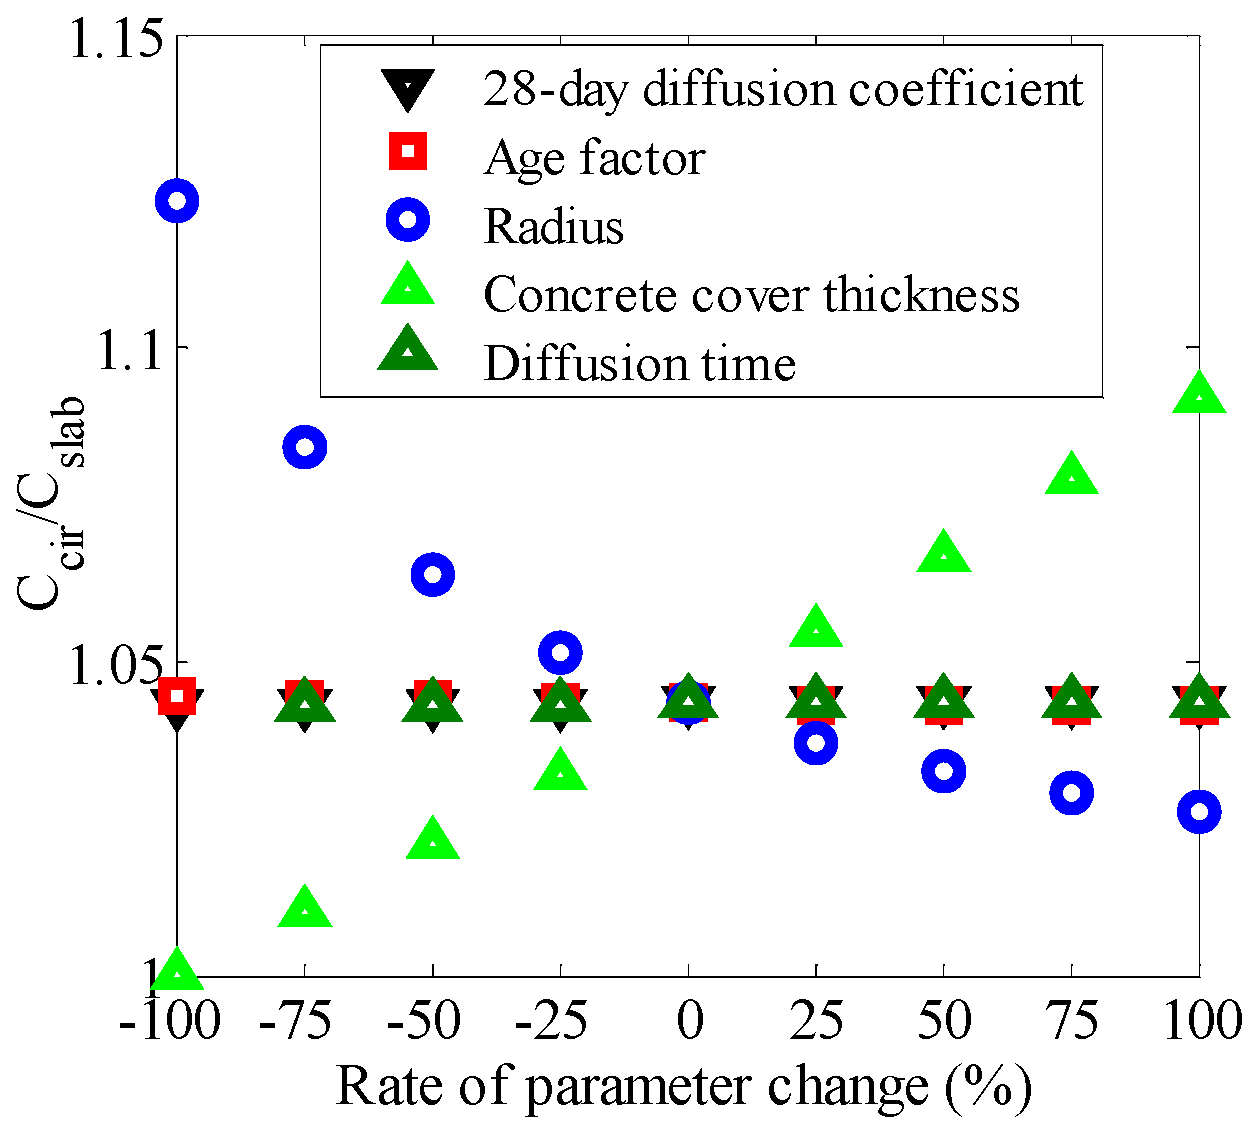
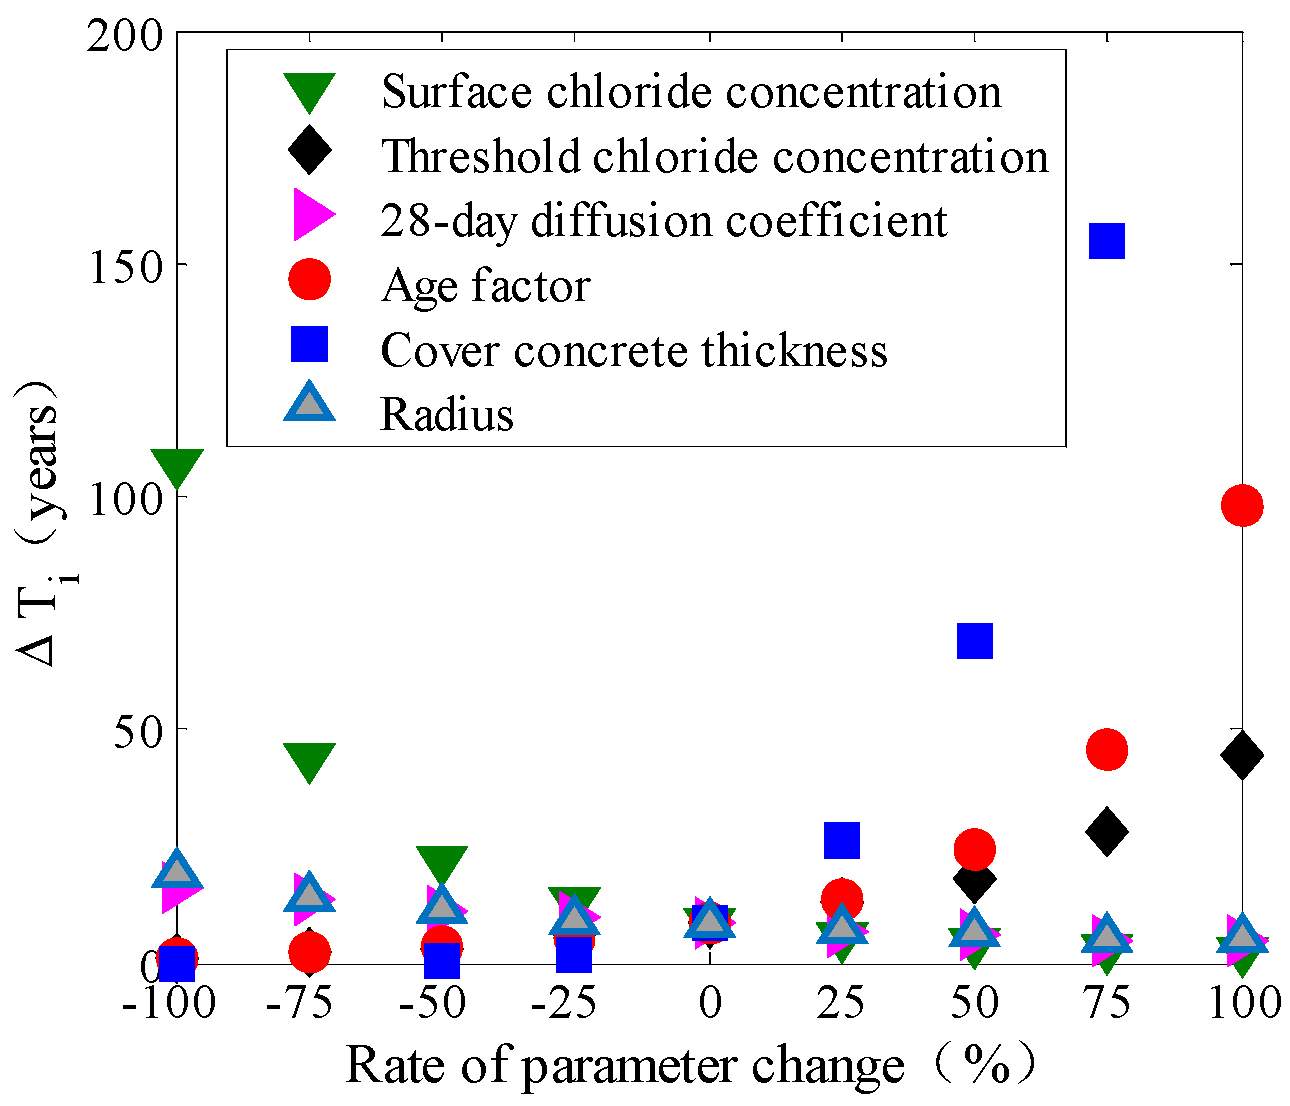
The pre-corrosion initiation time of the RC circular column is underestimated with the slab diffusion model. Each model parameter shows sensitivity for the difference value between the time estimated with slab diffusion model and that estimated for the modified slab one. The shape of the circular section affects minimally the estimation of the time to corrosion initiation compared with other model parameters.
(d)
The service life of RC circular column is overestimated when the circular section is viewed as a slab element. The modified slab diffusion model should be used when the radius of the column below 50 cm.
(e)
The RC circular section simplified as a slab element slightly affects the durability design against chloride corrosion. The minimum concrete cover thickness increases by 5 mm for the RC circular column based on the design result of the slab element.

Author Contributions

Conceptualization, G.Y.; methodology, L.P.; software, L.P.; validation, G.Y. and L.P.; formal analysis, L.P.; curation, G.Y.; writing and revising, L.P. All authors have read and agreed to the published version of the manuscript.

Funding

This research was funded by the National Natural Science Foundation of China, grant number 51578157.

Conflicts of Interest

The authors declared no potential conflicts of interest concerning the research, authorship, and the publication of this article.

References

  1. Tuutti, K. Corrosion of Steel in Concrete; No. CBI Research FO 4:82; Swedish Cement and Concrete Research Institute: Stockholm, Sweden, 1982. [Google Scholar]
  2. Transportation Research Board. National Cooperative Highway Research Program, and Strategic Highway Research Program. Strategic Highway Research Program: Research Plans; Federal Highway Administration: Washington, DC, USA, 1986.
  3. Collepardi, C.M.; Marcialis, A.; Turriziani, R. Penetration of chloride ions into cement pastes and concrete. J. Am. Ceram. Soc. 1972, 55, 534–535. [Google Scholar] [CrossRef]
  4. Mangat, P.S.; Molloy, B.T. Prediction of long-term chloride concentration in concrete. Mater. Struct. 1994, 27, 338–346. [Google Scholar] [CrossRef]
  5. Engelund, S.; Edvardsen, C.; Mohr, L. General Guidelines for Durability Design and Redesign; DuraCrete Project Document BE95-1347/R17; CUR: Lyngby, Denmark, 2000. [Google Scholar]
  6. Cui, F.; Zhang, H.; Ghosn, M.; Xu, Y. Seismic fragility analysis of deteriorating RC bridge substructures subject to marine chloride-induced corrosion. Eng. Struct. 2018, 155, 61–72. [Google Scholar] [CrossRef]
  7. Shivang, S.; Jayadipta GJamie, E.P. Seismic life-cycle cost analysis of ageing highway bridges under chloride exposure conditions: Modelling and recommendations. Struct. Infrastruct. Eng. 2018, 14, 941–966. [Google Scholar]
  8. Costa, A.; Appleton, J. Chloride penetration into concrete in marine environment—Part I: Main parameters affecting chloride penetration. Mater. Struct. 1999, 32, 354–359. [Google Scholar] [CrossRef]
  9. Andrade, C.; Diez, L.M.; Alonso, C. Mathematical modeling of a concrete surface “skin effect” on diffusion in chloride contaminated media. Adv. Cem. Based Mater. 1997, 6, 39–44. [Google Scholar] [CrossRef]
  10. Val, D.V.; Trapper, P.A. Probabilistic evaluation of initiation time of chloride-induced corrosion. Reliab. Eng. Syst. Saf. 2008, 93, 364–372. [Google Scholar] [CrossRef]
  11. Muthulingam, S.; Rao, B.N. Non-uniform corrosion states of rebar in concrete under chloride environment. Corros. Sci. 2015, 93, 267–282. [Google Scholar] [CrossRef]
  12. Shafei, B.; Alipour, A. Estimation of corrosion initiation time in reinforced concrete bridge columns: How to incorporate spatial and temporal uncertainties. J. Eng. Mech. 2015, 141, 04015037. [Google Scholar] [CrossRef]
  13. Hu, S.; Peng, J.; Zhang, J. Numerical simulation method of the chloride ion diffusion in concrete and its application in bridge. China J. Railw. Sci. Eng. 2017, 14, 2570–2578. [Google Scholar]
  14. Morga, M.; Marano, G.C. Chloride penetration in circular concrete columns. Int. J. Concr. Struct. Mater. 2015, 9, 173–183. [Google Scholar] [CrossRef] [Green Version]
  15. Luping, T.; Nilsson, L.O. Chloride diffusivity in high strength concrete at different ages. Nord. Concr. Res. 1992, 1, 162–171. [Google Scholar]
  16. Nilsson, L.O.; Poulsen, E.; Sandberg, P.; Sørensen, H.E.; Klinghoffer, O. Chloride Penetration into Concrete, State-of-the-Art. Transport Processes, Corrosion Initiation, Test Methods and Prediction Models; Danish Road Directorate: Copenhagen, Denmark, 1996. [Google Scholar]
  17. Song, H.W.; Lee, C.H.; Ann, K.Y. Factors influencing chloride transport in concrete structures exposed to marine environments. Cem. Concr. Compos. 2008, 30, 113–121. [Google Scholar] [CrossRef]
  18. Pack, S.M.; Jung, M.S.; Song, H.W.; Kim, S.H. Prediction of time dependent chloride transport in concrete structures exposed to a marine environment. Cem. Concr. Res. 2012, 40, 302–312. [Google Scholar] [CrossRef]
  19. Wu, L.J.; Li, W.; Yu, X.N. Time-dependent chloride penetration in concrete in marine environments. Constr. Build. Mater. 2017, 152, 406–413. [Google Scholar] [CrossRef]
  20. ACI318-05; ACI318R-05. Building Code Requirements for Structural Concrete and Commentary; American Concrete Institute: Farmington Hills, MI, USA, 2005. [Google Scholar]
  21. CCES01-2004. Guide for Durability Design and Construction of Concrete Structures, 2nd ed.; China Building Industry Press: Beijing, China, 2005. (In Chinese) [Google Scholar]
  22. CEN. Design of Concrete Structures (pr EN 1992-1-1); Eurocode 2; CEN: Brussels, Belgium, 2002. [Google Scholar]
  23. Marano, G.C.; Greco, R. Axial-bending interaction diagrams of reinforced concrete columns exposed to chloride attack. Appl. Mech. Mater. 2016, 847, 415–422. [Google Scholar] [CrossRef]
  24. Stewart, M.G.; Rosowsky, D.V. Structural safety and service ability of concrete bridges subject to corrosion. J. Infrastruct. Syst. 1998, 4, 146–155. [Google Scholar] [CrossRef]
  25. Li, Q.W.; Li, K.F.; Zhou, X.G. Model-based durability design of concrete structures in Hong Kong–Zhuhai–Macau sea link project. Struct. Saf. 2015, 53, 1–12. [Google Scholar] [CrossRef]
  26. Bentz, E.C.; Thomas, M.D.A. Life-365 Service Life Prediction Model and Computer Program for Predicting the Service Life and Life-Cycle Costs of Reinforced Concrete Exposed to Chlorides. User Manual, Version 2.0; Life-365 Consortium II, USA. 2008. Available online: https://www.nrmca.org/research/Life365v2UsersManual.pdf (accessed on 31 December 2019).
  27. JSCE. Standard Specifications for Concrete Structures; Japan Society of Civil Engineering: Tokyo, Japan, 2007. [Google Scholar]
  28. Li, Z.; Jin, Z.; Zhao, T. Service life prediction of reinforced concrete in a sea-crossing railway bridge in Jiaozhou Bay: A case study. Appl. Sci. 2019, 9, 3570. [Google Scholar] [CrossRef] [Green Version]
  29. Li, K.F.; Li, Q.W.; Zhou, X.G. Durability design of the Hong Kong–Zhuhai–Macau sea-link project: Principle and Procedure. J. Bridge Eng. 2015, 20, 04015001. [Google Scholar] [CrossRef]
Figure 1. Effects of zero numbers of zero-order Bessel functions J0 on the accuracy of circular diffusion model.
Applsci 10 00459 g001
Figure 2. A comparison between the circular diffusion and numerical models.
Applsci 10 00459 g002
Figure 3. The influence of time-variant diffusion coefficients on chloride concentration distribution.
Applsci 10 00459 g003
Figure 4. The chloride concentration versus concrete cover thickness at a diffusion time of 100 years.
Applsci 10 00459 g004
Figure 5. The chloride concentration versus diffusion time at a concrete cover thickness of 5 cm.
Applsci 10 00459 g005
Figure 6. Sensitivity analysis of Ccir/Cslab with respect to the model parameters.
Applsci 10 00459 g006
Figure 7. Plot of Ccir/Cslab versus cover thickness.
Applsci 10 00459 g007
Figure 8. Variation of the coefficient k as a function of radius.
Applsci 10 00459 g008
Figure 9. Plot of the concrete b versus radius.
Applsci 10 00459 g009
Figure 10. The effect of radius on ηc for different concrete cover thicknesses.
Applsci 10 00459 g010
Figure 11. The sensitivity analysis of model parameters for this difference ΔTi.
Applsci 10 00459 g011
Figure 12. The effect of the shape of circular section on the service life prediction.
Applsci 10 00459 g012
Figure 13. Minimum concrete cover thickness as a function of the 28-day chloride diffusion coefficient in different exposure zones.
Applsci 10 00459 g013
Figure 14. The difference between the minimum concrete cover thickness designed by the modified slab diffusion model and the original slab one.
Applsci 10 00459 g014
Figure 15. The effect of design reliability index (βd) on Δxd.
Applsci 10 00459 g015
Table 1. The statistical distribution of surface chloride concentration and age factor.
ParametersExposure ConditionDistribution TypeMean ValueStandard Deviation
C0 (%binder)Atmospheric zoneLognormal distribution20.31
Splashing and tidal zone5.40.82
Submerged zone4.50.68
mAtmospheric zoneNormal distribution0.530.08
Splashing and tidal zone0.470.028
Submerged zone0.440.028
Table 2. Parameter value range of sensitivity analysis.
ParametersMean ValueLower LimitationUpper Limitation
D283.435 cm2/a2.51 cm2/a4.36 cm2/a
m0.530.370.69
R50 cm20 cm80 cm
x4 cm0 cm8 cm
t50a0a100a
Table 3. The probability distribution of chloride threshold concentration Ccr.
Exposure ClassDistribution TypeMean Value (%Binder)STANDARD Deviation (%Binder)
Atmospheric zoneLognormal distribution0.850.13
Splashing and tidal zoneBeta distribution (L = 0.45%, U = 1.25%)0.750.23
Submerged zoneBeta distribution (L = 1%, U = 3.5%)20.72
Note: L represents lower limitation and U represents upper limitation.
Table 4. The ranges of parameter values for surface chloride and threshold chloride concentrations.
ParametersMean ValueLower LimitationUpper Limitation
C0 (%binder)21.382.62
Ccr (%binder)0.850.591.11
Table 5. Service life for different radius of circular section.
Time (Years)R = 30 cmR = 50 cmR = 70 cmSlab Diffusion Model
Atmospheric zone39424546
Splashing and tidal zone57606164

