Article

Using Long-Range Wireless Sensor Network to Track the Illegal Cutting Log

by
Giva Andriana Mutiara
1,2,*,
Nanna Suryana Herman
2 and
Othman Mohd
2
1
Applied Science School, Telkom University, Bandung 40257, Indonesia
2
Department of FTMK, Universiti Teknikal Malaysia Melaka, Melaka 76100, Malaysia
*
Author to whom correspondence should be addressed.
Appl. Sci. 2020, 10(19), 6992; https://doi.org/10.3390/app10196992
Submission received: 30 August 2020 / Revised: 22 September 2020 / Accepted: 4 October 2020 / Published: 7 October 2020
(This article belongs to the Section Electrical, Electronics and Communications Engineering)

Abstract

:
Nowadays, the need for wireless sensing applications is increasing. Along with the increased illegal cutting of logs in the forest, however, it requires the integration application to tackle the illegal logging and forest preservation. The wireless sensor network is a suitable network architecture for remotely monitoring or tracking applications in the environment. This paper proposed an integrated system that can identify and track the position of a moving cutting log. An Arduino Uno, Raspberry Pi 3 B+, sound sensor, accelerometer sensor, LoRa GPS HAT Shield, and Outdoor LoRa Gateway OLG01 performed the hardware monitoring and tracking of the proposed system. The network of STAR topology configuration between master and slaves is represented by the LoRa Network embedded with the sensors, as an architecture of the wireless sensor network. The system was examined the performance of the network and the tracking process. The result determined that the LoRa can detect and identify the occurrence of the illegal cutting of logs in real-time. Meanwhile, in terms of the tracking performance, a duration of 5–46 s was required to track the new position of the moving cutting log.

1. Introduction

The large-scale forest degradation affects the forest ecosystem and human life. There are several causes of forest degradation in Southeast Asia; these are legal and illegal logging, smallholder forest encroachments, overgrazing, natural water regimes changes, fires, shifting cultivation, expansion of farming land, fuelwood collection, and wood extraction for charcoal production [1]. Effects of deforestation are global warming, disruption of the global water cycle, decreased biodiversity, habitat loss and conflict, economic losses, and social consequences [2].
Illegal logging has become the most reported cases of forest crime in Indonesia [3]. There are a lot of technologies that have been used to tackle illegal logging [4]. The most appropriate technology that is used to tackle illegal logging is the Wireless Sensor Network (WSN) [5]. WSNs technology have been mainly used for identification, detection, monitoring and tracking [6]. WSNs are suitable for an outdoor area and can supervise a wide area of more than a thousand square meters. WSNs are one of the technologies that support a wireless-based data transmission system arranged hierarchically between sensor nodes [7]. The WSNs are also an ad-hoc network consisting of a sensor device, processing device, and radiofrequency device with limited energy capacity to sense the environment [8]. WSNs are widely known in a variety of applications in the real world, namely, military applications, environmental control, industrial management, health, and forest disaster management. Besides, WSNs can be used for infrastructure solutions for the Internet of Things (IoT) [9].
Because WSNs consist of sensor node networks, they require a wireless communication system that can send data in wide area coverage with low power consumption [10]. Over the years, WSNs have been predominantly used for wireless communication such as ZigBee, or Bluetooth, or wireless module NRF24L01, which have a configuration using mesh network topology to achieve low-power, short-range, and a multi-hop network [11,12,13]. However, with the development of technology, an alternative solution for wireless communication that has low-power, low-cost, and long-term functionality now exists and is known as the Low-Power Wide-Area Network (LPWAN).
LoRa stands for Long Range and is a physical layer technology patented by Semtech [14]. The LoRa Alliance proposed an open protocol which provides the MAC layer for the network. The Long-Range WAN (LoRaWAN) open standards is a popular LPWAN protocol, be able to send small data sizes of between 10 and 20 bytes at speed rates of 0.3 to 5.5 Kbps with a wide area coverage and low battery consumption that suitable for long-range use [15]. LoRa operates in Industrial, Scientific, and Medical (ISM) radio bands at frequencies 433 MHz, 868 MHz, and 911 MHz. In Indonesia, LoRa is working at a frequency of 923–925 MHz [16]. Mostly, LoRa used STAR of STAR protocol topology architecture [17]. Besides, LoRA is very useful and provides GPS-free geolocation as well as a global system for mobile (GSM) and a global positioning system (GPS) with low power consumption [18]. The illustrations of the distribution of communication range, and data rate about the wireless communication protocols can be seen in Figure 1.
Since 2015, LoRa has been widely used for WSN implementation applications. LoRa has been designed as irrigation supervision and controlling for drip irrigation systems [19]. An automatically controlled watering system (controlled from home by a farmer) in agriculture, was used to measure soil using a moisture sensor that monitors humidity levels and temperature sensors to monitor soil’s temperature [20,21]. Moreover, LoRa is also implemented in the Internet of Things (IoT) applications. One of them is an application-based smart parking system that provides information about empty parking slots to the drivers [22].
Other more comprehensive WSN applications include LoRa’s implementation in the detection of forest fires to raise awareness of the need for forest preservation [23,24]. Geo-location tracking uses LoRa to track moving objects in the observation area [25]. In the health field, LoRa is used as a fall detection method to monitor old or vulnerable citizens who may be at risk of falling accidentally [26]. Besides, LoRa can help the doctor and the patient’s family monitor and track a patient with a mental disorder [27]. Furthermore, LoRa can also be used to monitor blood pressure, glucose, and temperature in rural areas [28]; LoRa is also used as a communication platform in smart city applications [29].
The motivation of this research is to help the forest guard to monitor and supervise the environment of the trees in the forest remotely, so as to reduce the burden on the forest guard in conducting patrols in the forest. The research aimed to design and implement an IoT application based on WSN technology that can detect illegal logging in forests. The system utilized several sensors and LoRa in each sensor node point. The proposed system also defined the network infrastructure that appropriates with LoRa architecture. The main contribution of this research is to tackle and reduce illegal logging in the forest. So, the proposed system can detain the degradation forest and help forest preservation. This proposed system is focused on detecting, tracking and identifying illegal logging.
This paper is presented in several sections. The next sections outline the research methodology and the material, design, and implementation used to compile the research. The third section describes the testing and the discussion of the results testing. At the end of the research, the conclusion is drawn and stated in the last section of this research as the fourth section.

2. Research Methodology and Proposed System

2.1. Research Methodology

The research method used to compile this research was the development studies approach used in information systems. This research uses the systems development research process methodology [30]. The research began from theory building to propose system development based on observation or survey studies from a literature review. Then, the proposed system was designed and built before the developed system was tested using experiments in a lab or under real field conditions. The experiment was applied based on several testing scenarios and the results were discussed and analyzed to draw the conclusion.

2.2. State-of-the-Art Research in Illegal Logging

During this research, forest monitoring from illegal logging was conducted by taking imagery data through a satellite using various algorithms. The image from a bare forest can provide information that trees in the forest have been cut down [31,32]. Unfortunately, this system cannot provide tracking and reporting information on illegal logging in real-time. Besides, this system needs higher and more advanced computation.
Research using WSN has been conducted using integrated RFID, but the implementation of the tracking system is still separated [4]. A guardian forest system to detect the occurrence of illegal logging from the identification of chainsaw sound has been proposed. By utilizing the application program interface (API), the information was delivered through short message services (SMS) and web applications [33].
This system was then replaced by using the ZigBee, that can identify and track illegal logging [34]. A combination of a vibration sensor and sound sensor was proposed by [35]. Those sensors were integrated with Fog-computing and Lightweight Software Devices Networking Controllers (FLCs); the communication data used ZigBee. Detection through chainsaw acoustics has been applied to detect the illegal logging combined with ZigBee communication. The sound was classified into three band frequencies [36]. So, to recognize the occurrence of the illegal logging, most of the proposed systems were utilizing sound and vibration sensors. In this research, the proposed system used a gyro sensor to detect the slope of the tree trunk and sensor sound to detect the chainsaw sound.
However, ZigBee has a weakness in the coverage area communication and the infrastructure for wide area networks. The infrastructure of the network is affected by the network lifetime [17,37]. The comparison of LoRaWAN, Wifi and ZigBee can be seen in Table 1. As stated in Table 1, LoRaWAN has a communication coverage range of kilometers, while ZigBee only has a range of 10-100 m. ZigBee mostly uses short-range radio technologies and is not suitable for the illegal logging scenario that requires a low-power wide area network to fulfil the characteristics of an IoT application. The characteristics that are required from IoT applications are long-range, low data rate, low energy consumption, and cost-effectiveness [38]. Since the illegal logging application is embedded with IoT technology, LoRa is applied in the proposed system.
Based on the required infrastructure of Illegal logging application, the LoRaWAN infrastructure network is supporting the hierarchical multi-hop network protocol. Network topology STAR of STAR on LoRaWAN makes it possible to add a sensor node without changing the topology.

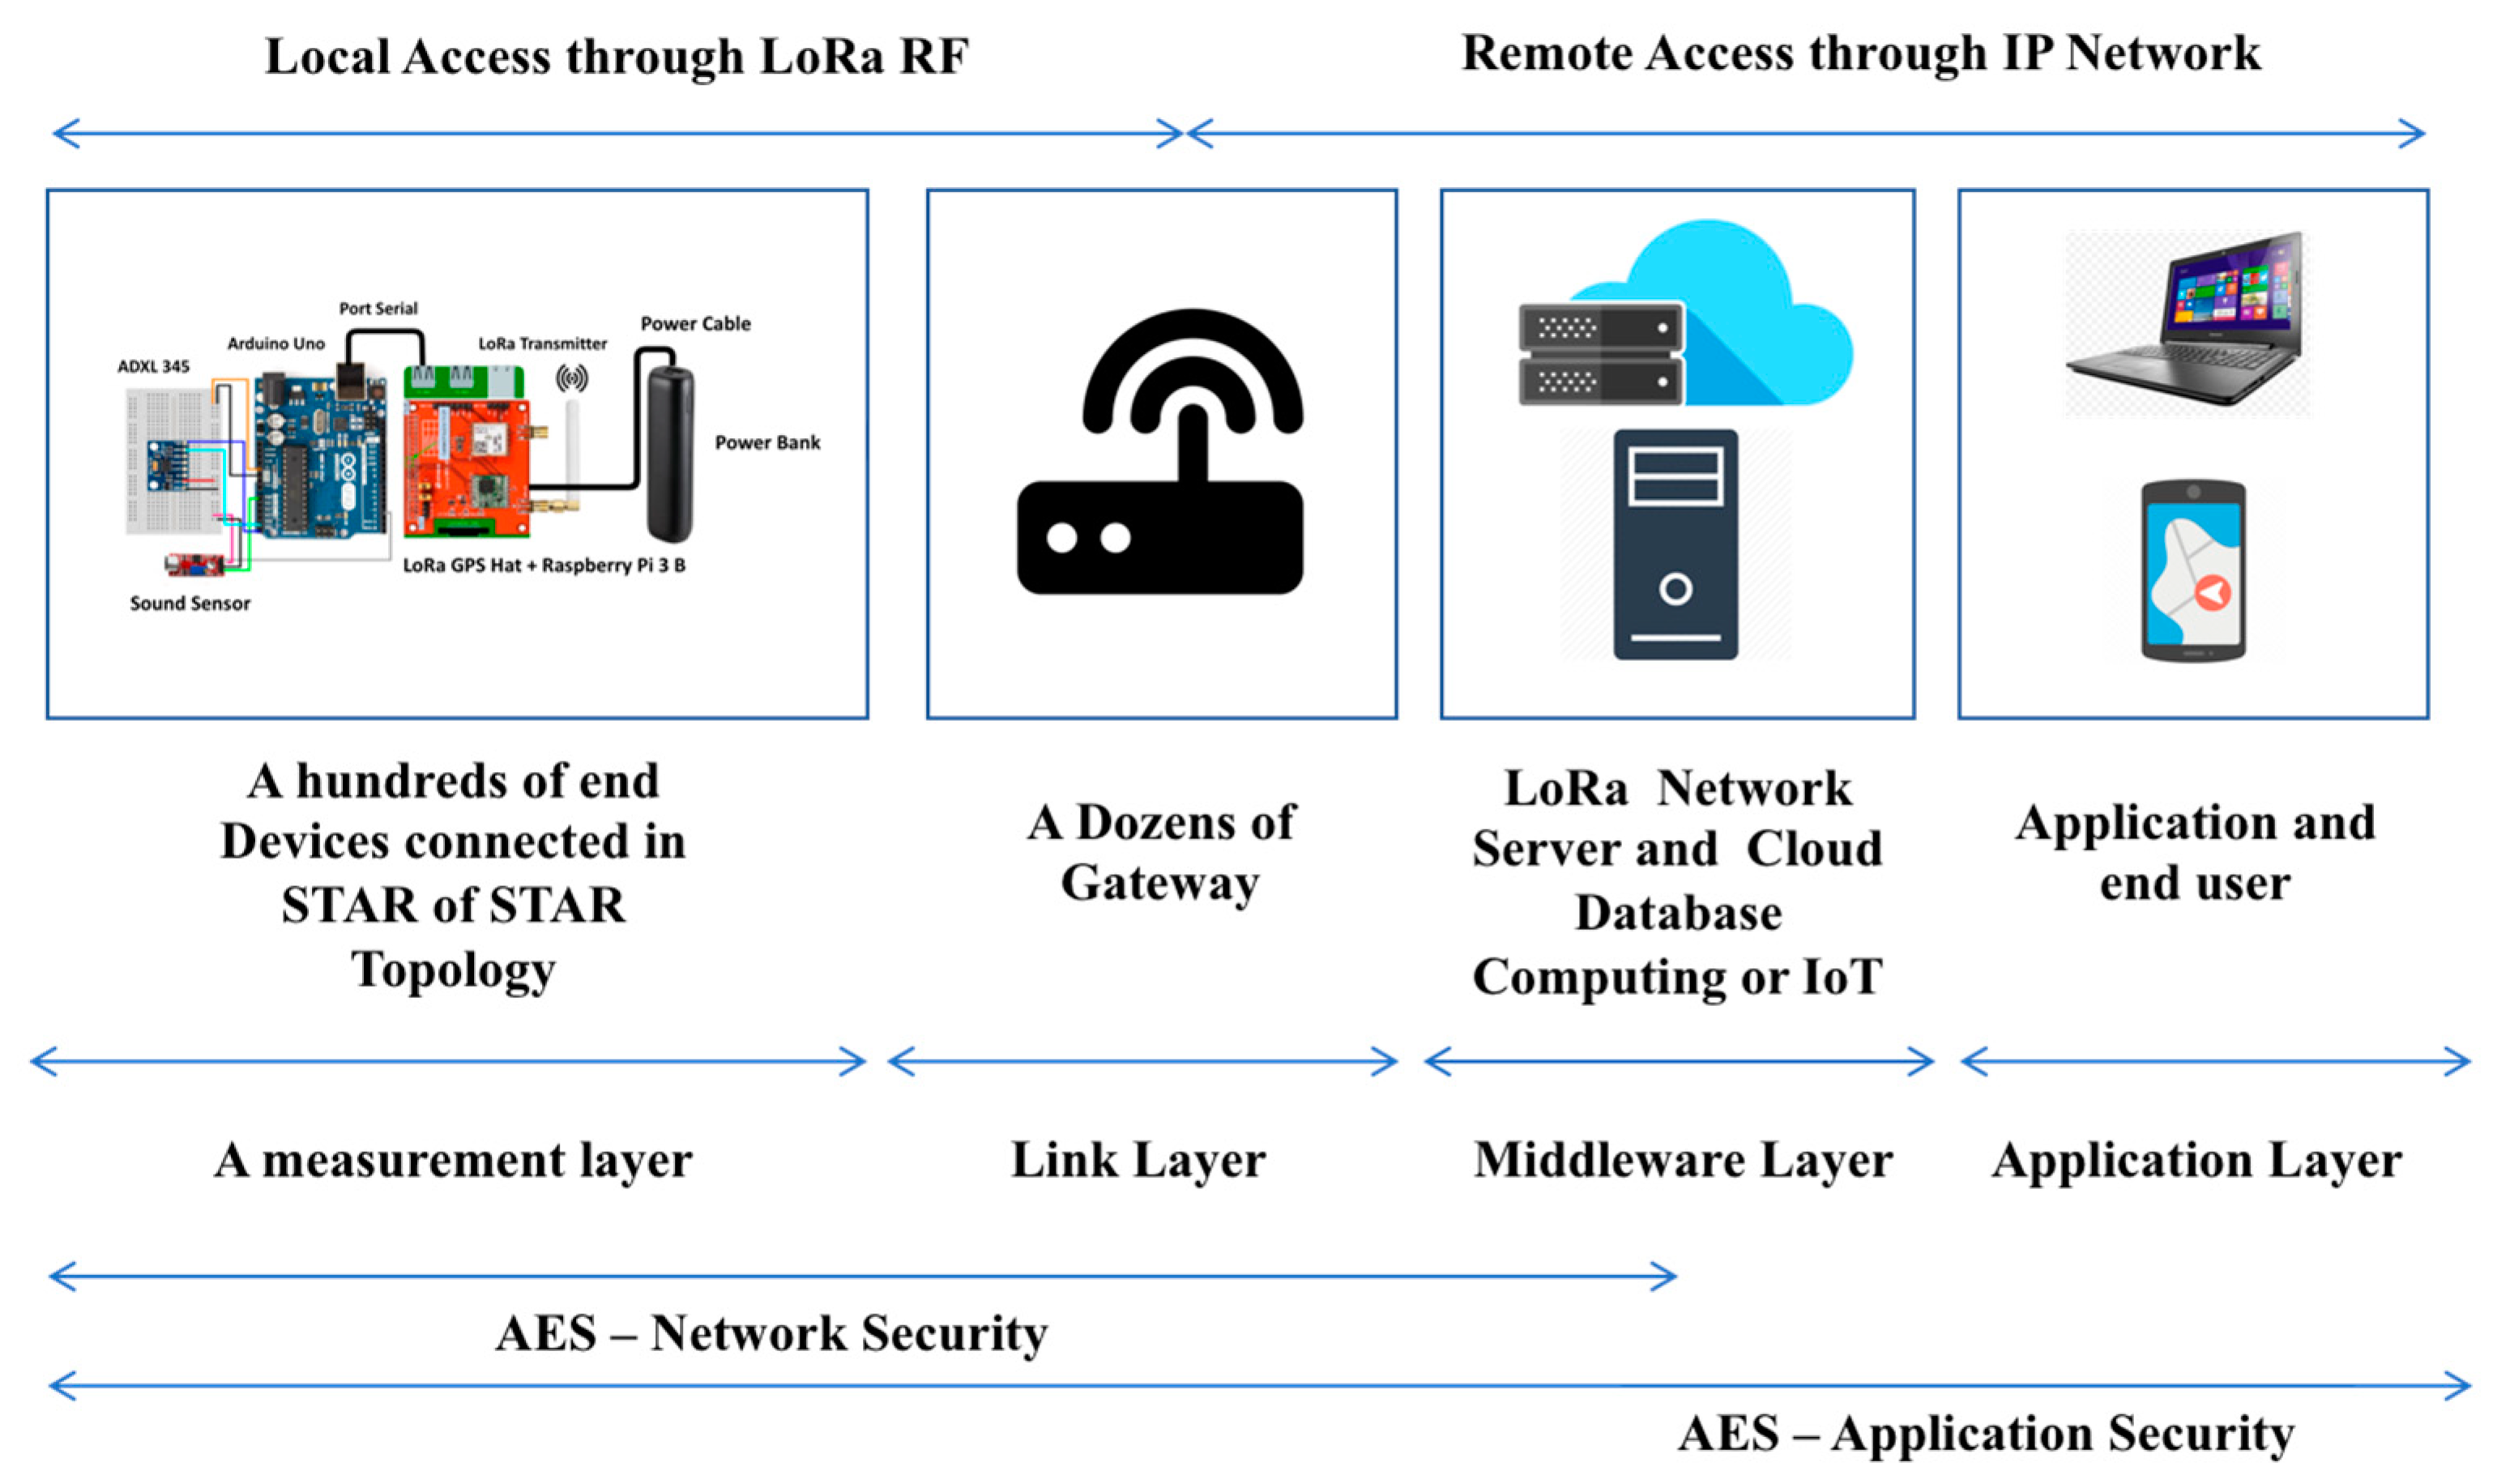
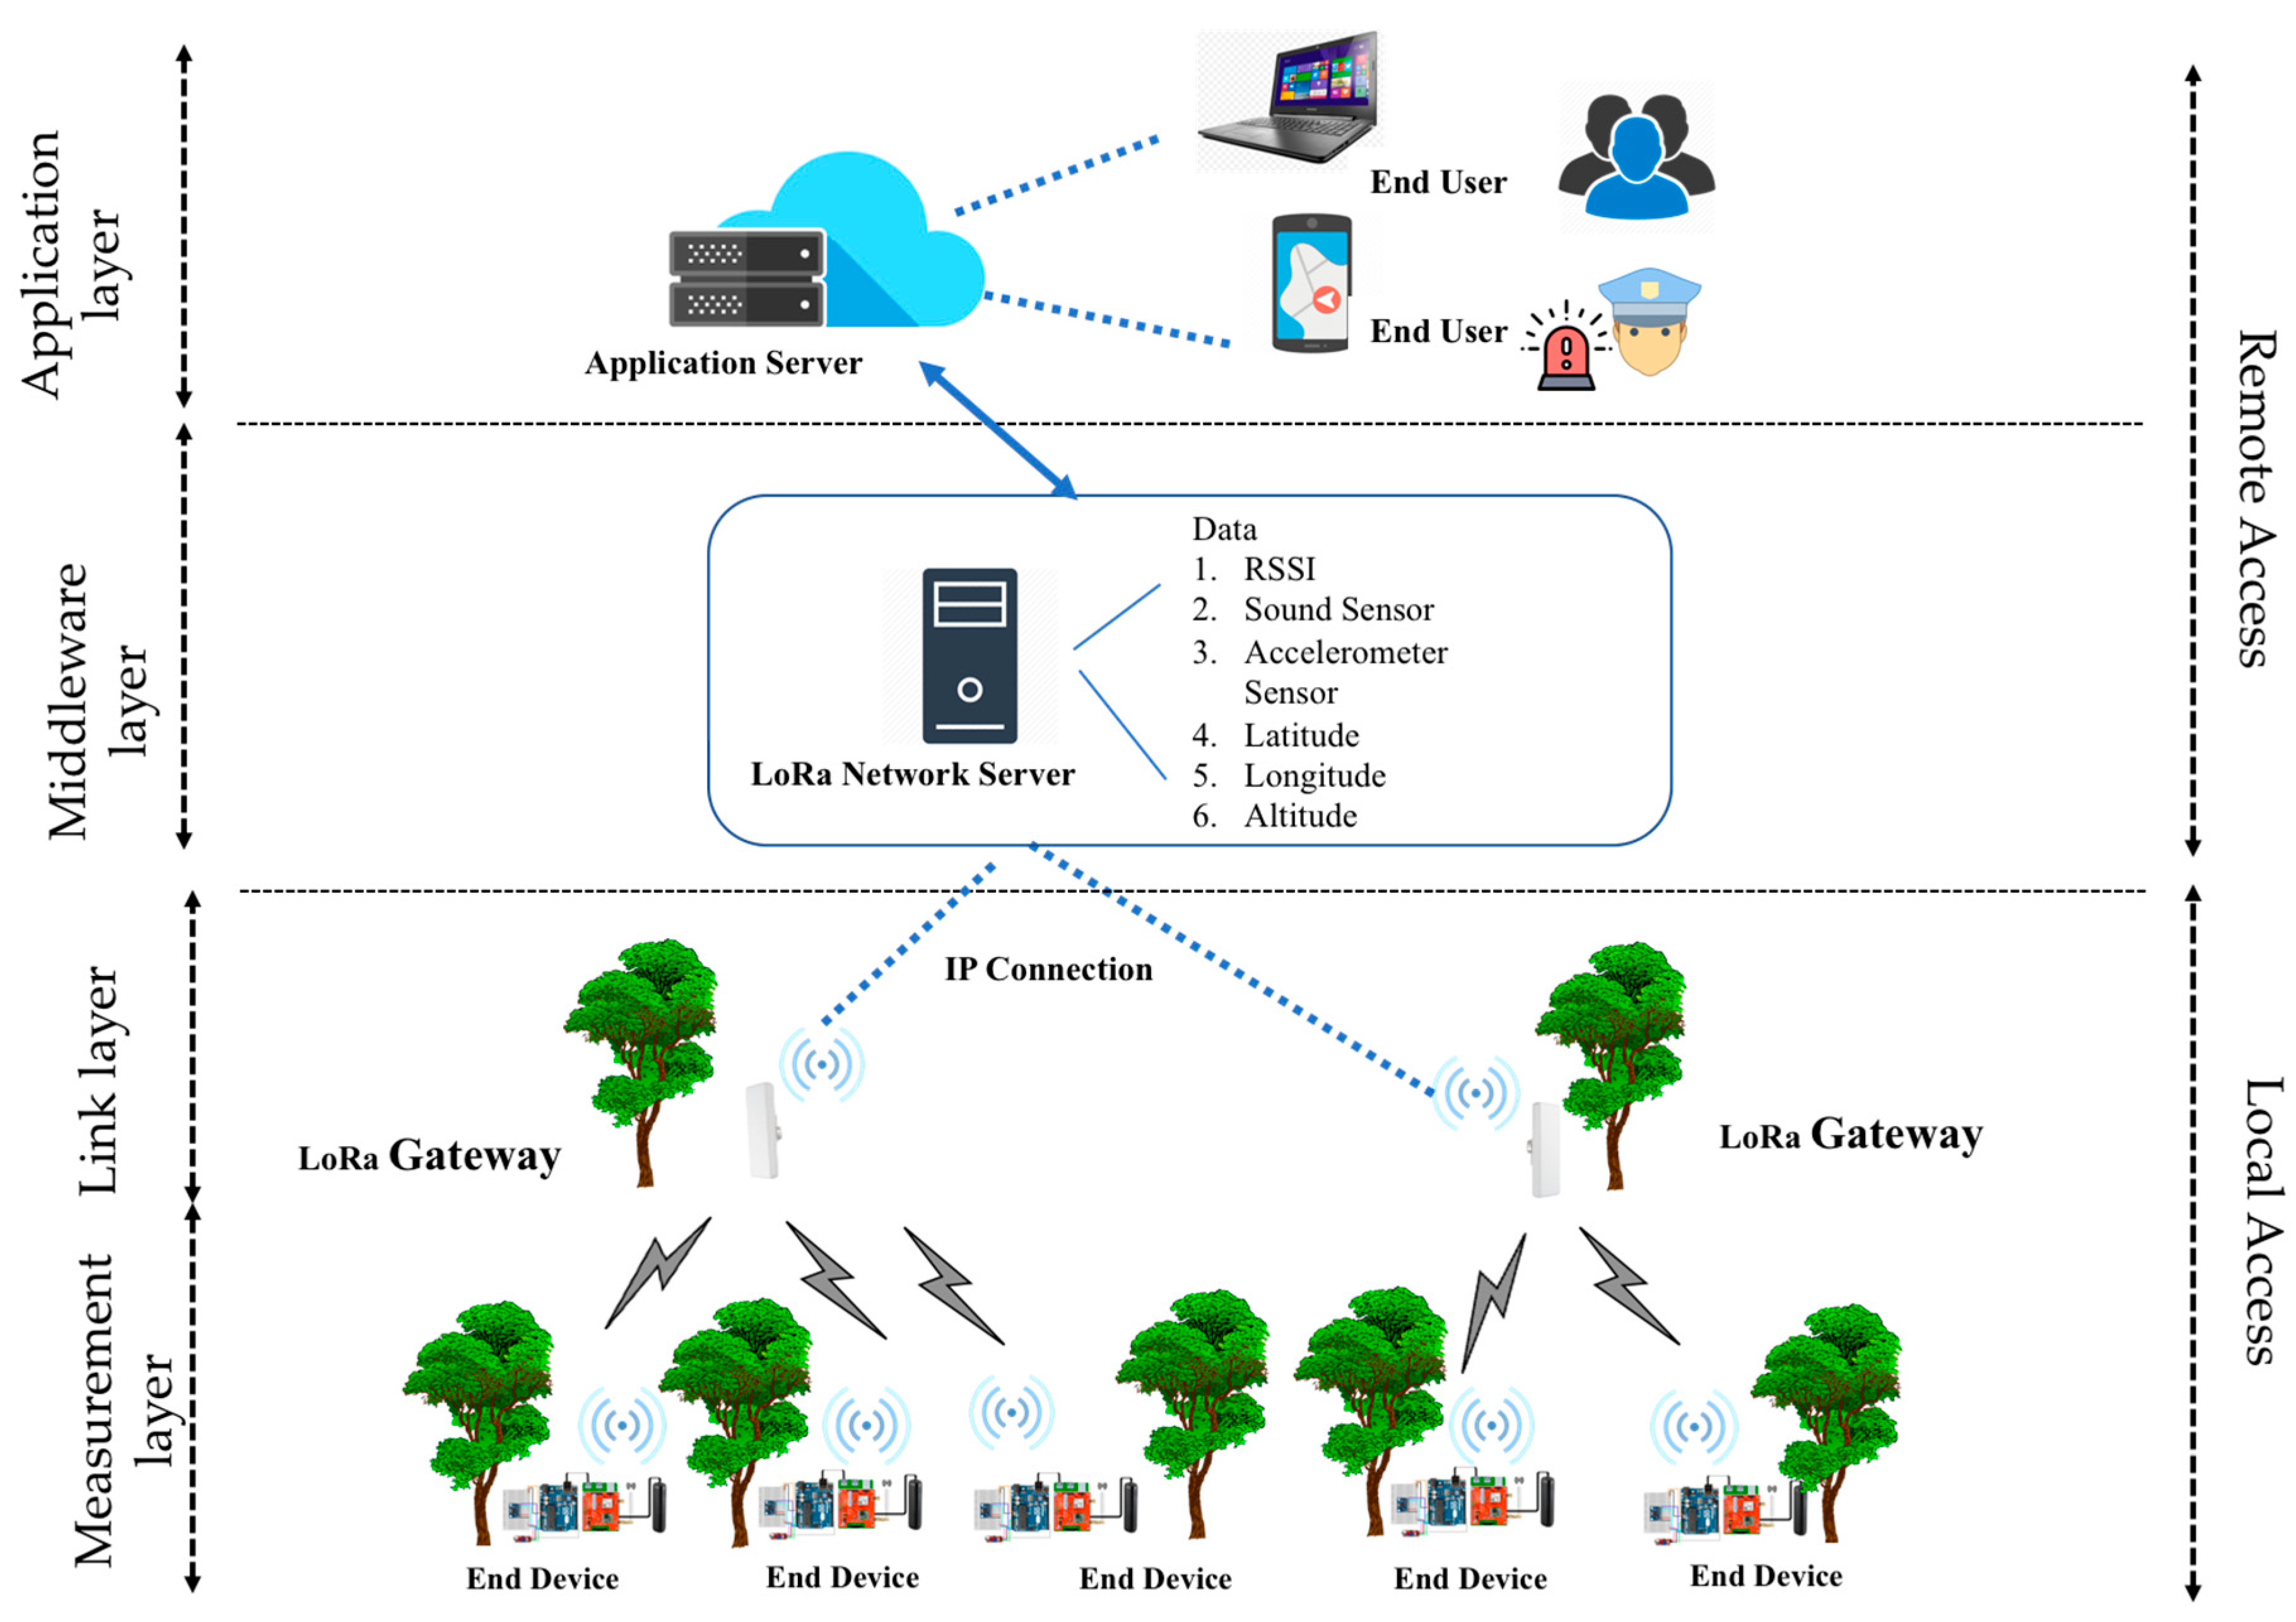
2.3. Proposed System

This paper proposed an integrated system of IoT and WSN for illegal logging detection, monitoring, and event tracking in the forest. The design and architecture of the proposed system follow the open standard of LoRaWAN architecture that consists of a network server, gateways, and sensor nodes as end nodes [14]. The proposed system architecture is shown in Figure 2. The outline of the system is divided into local access network and remote access networks. Local access networks are equal with the connection between the sensor nodes and the gateways in the open standard LoRaWAN architecture. End nodes are defined as a measurement layer to supervise the real environment; the networks can consist of a hundred of end-devices connected in STAR of STAR topology. A dozen gateways are placed in the link-layer. The connections between a measurement layer and link layer are through LoRa Radio Frequency.
The remote access network is the structure of the networks on the middleware layer and application layer as a development of the network server in the open standard architecture of LoRaWAN. A LoRa network server and database cloud computer are placed as a middleware layer consisting of the database information and server to compile the data from end-devices. The application and the end-user are placed in the application layer. The application layer could be in the form of an IoT cloud with the web application or mobile application.

2.3.1. Local Access Network

As mentioned before, this network contained the measurement layer as end-devices and link layer as a gateway. The design of end-devices consists of several sensors that can detect the occurrence of the logging and the movement position of the cutting log. A gyro accelerometer sensor was used to detect the slope of the trunk trees, and a sound sensor was used as the chainsaw sound detector. Raspberry Pi 3 was used because LoRa GPS HAT Shield is compatible with Raspberry Pi 3. Besides, LoRa GPS HAT Shield is customized and can be programmed on-site or remotely. Arduino Uno was used to handling the sensors that were applied in the system. Outdoor LoRa Gateway OLG01 is placed as a LoRa Gateway to interface the local access and remote access.
The hardware requirements for the end-device consist of Arduino Uno, Raspberry Pi 3, LoRa GPS HAT Shield, gyro accelerometer sensor, sound sensor, and Outdoor LoRa Gateway OLG01. Meanwhile, the software specification requirement is an Arduino IDE and Raspbian Jessie Stretch 2019. The design of the sensor nodes can be seen in Figure 3. A power bank of 10,050 mAh was also applied as a battery to supply the energy at the sensor node.
The topology network that connected between sensor nodes and the gateway can be seen in Figure 4. The system is built with more than two similar end-devices connected to the outdoor LoRa Gateway OLG01 using STAR topology network in LoRa configuration. The STAR topology can be developed by adding new sensor nodes or combining another STAR topology network into an existing STAR topology, which becomes a STAR of STAR topology for multi-hop architecture [39].
Sensor nodes supervised and interacted with the real environment and forwarded the data to the network server through the gateways. The distance between sensor nodes and the gateway arranged by the received signal strength indicator (RSSI). LoRa Gateway forwards the uplink radio packets to the LoRa network server, and downlink to perform transmission requests coming from LoRa network server.

2.3.2. Remote Access Network

The remote access network is the network server that developed into a middleware layer and application layer. LoRa Gateway forwarded packets to LoRa network server through an IP network. The network server then processed the packet and forwarded it to the application layer. In the middleware layer, the LoRa network server processed and saved the data about RSSI, sound sensor, accelerometer sensor, latitude, longitude, and altitude into the database. The application layer then took the information from the database of the LoRa network server. Then, web applications in several conditions (such as the occurrence of illegal logging) sent the data, location and environment condition to the telegram channel that utilized application program interfaces (APIs). When the illegal cutting of logs occurred, the system informed the GPS position of the moving log to the forest police through the web application and telegram. The detailed architecture of the LoRa network is described in Figure 5.
The data parameters that determine the networks involve the RSSI value, sound sensor parameter, and accelerometer sensor parameter. The RSSI value is usually used to measure the strength of the radio signal. So, it can be used as a distance threshold value between two LoRas. The sound parameter is used to detect the chainsaw sound, and the threshold is used to classify the chainsaw sound from other sounds. The accelerometer sensor parameter is determined by the log movement value as a classification threshold whether there is any difference in the slope of the trees caused by the chainsaw or not. The latitude and longitude parameter determined as a GPS parameter to indicate the location of the moving sensor nodes. The position of latitude and longitude value then translated into the map position in the google map application.

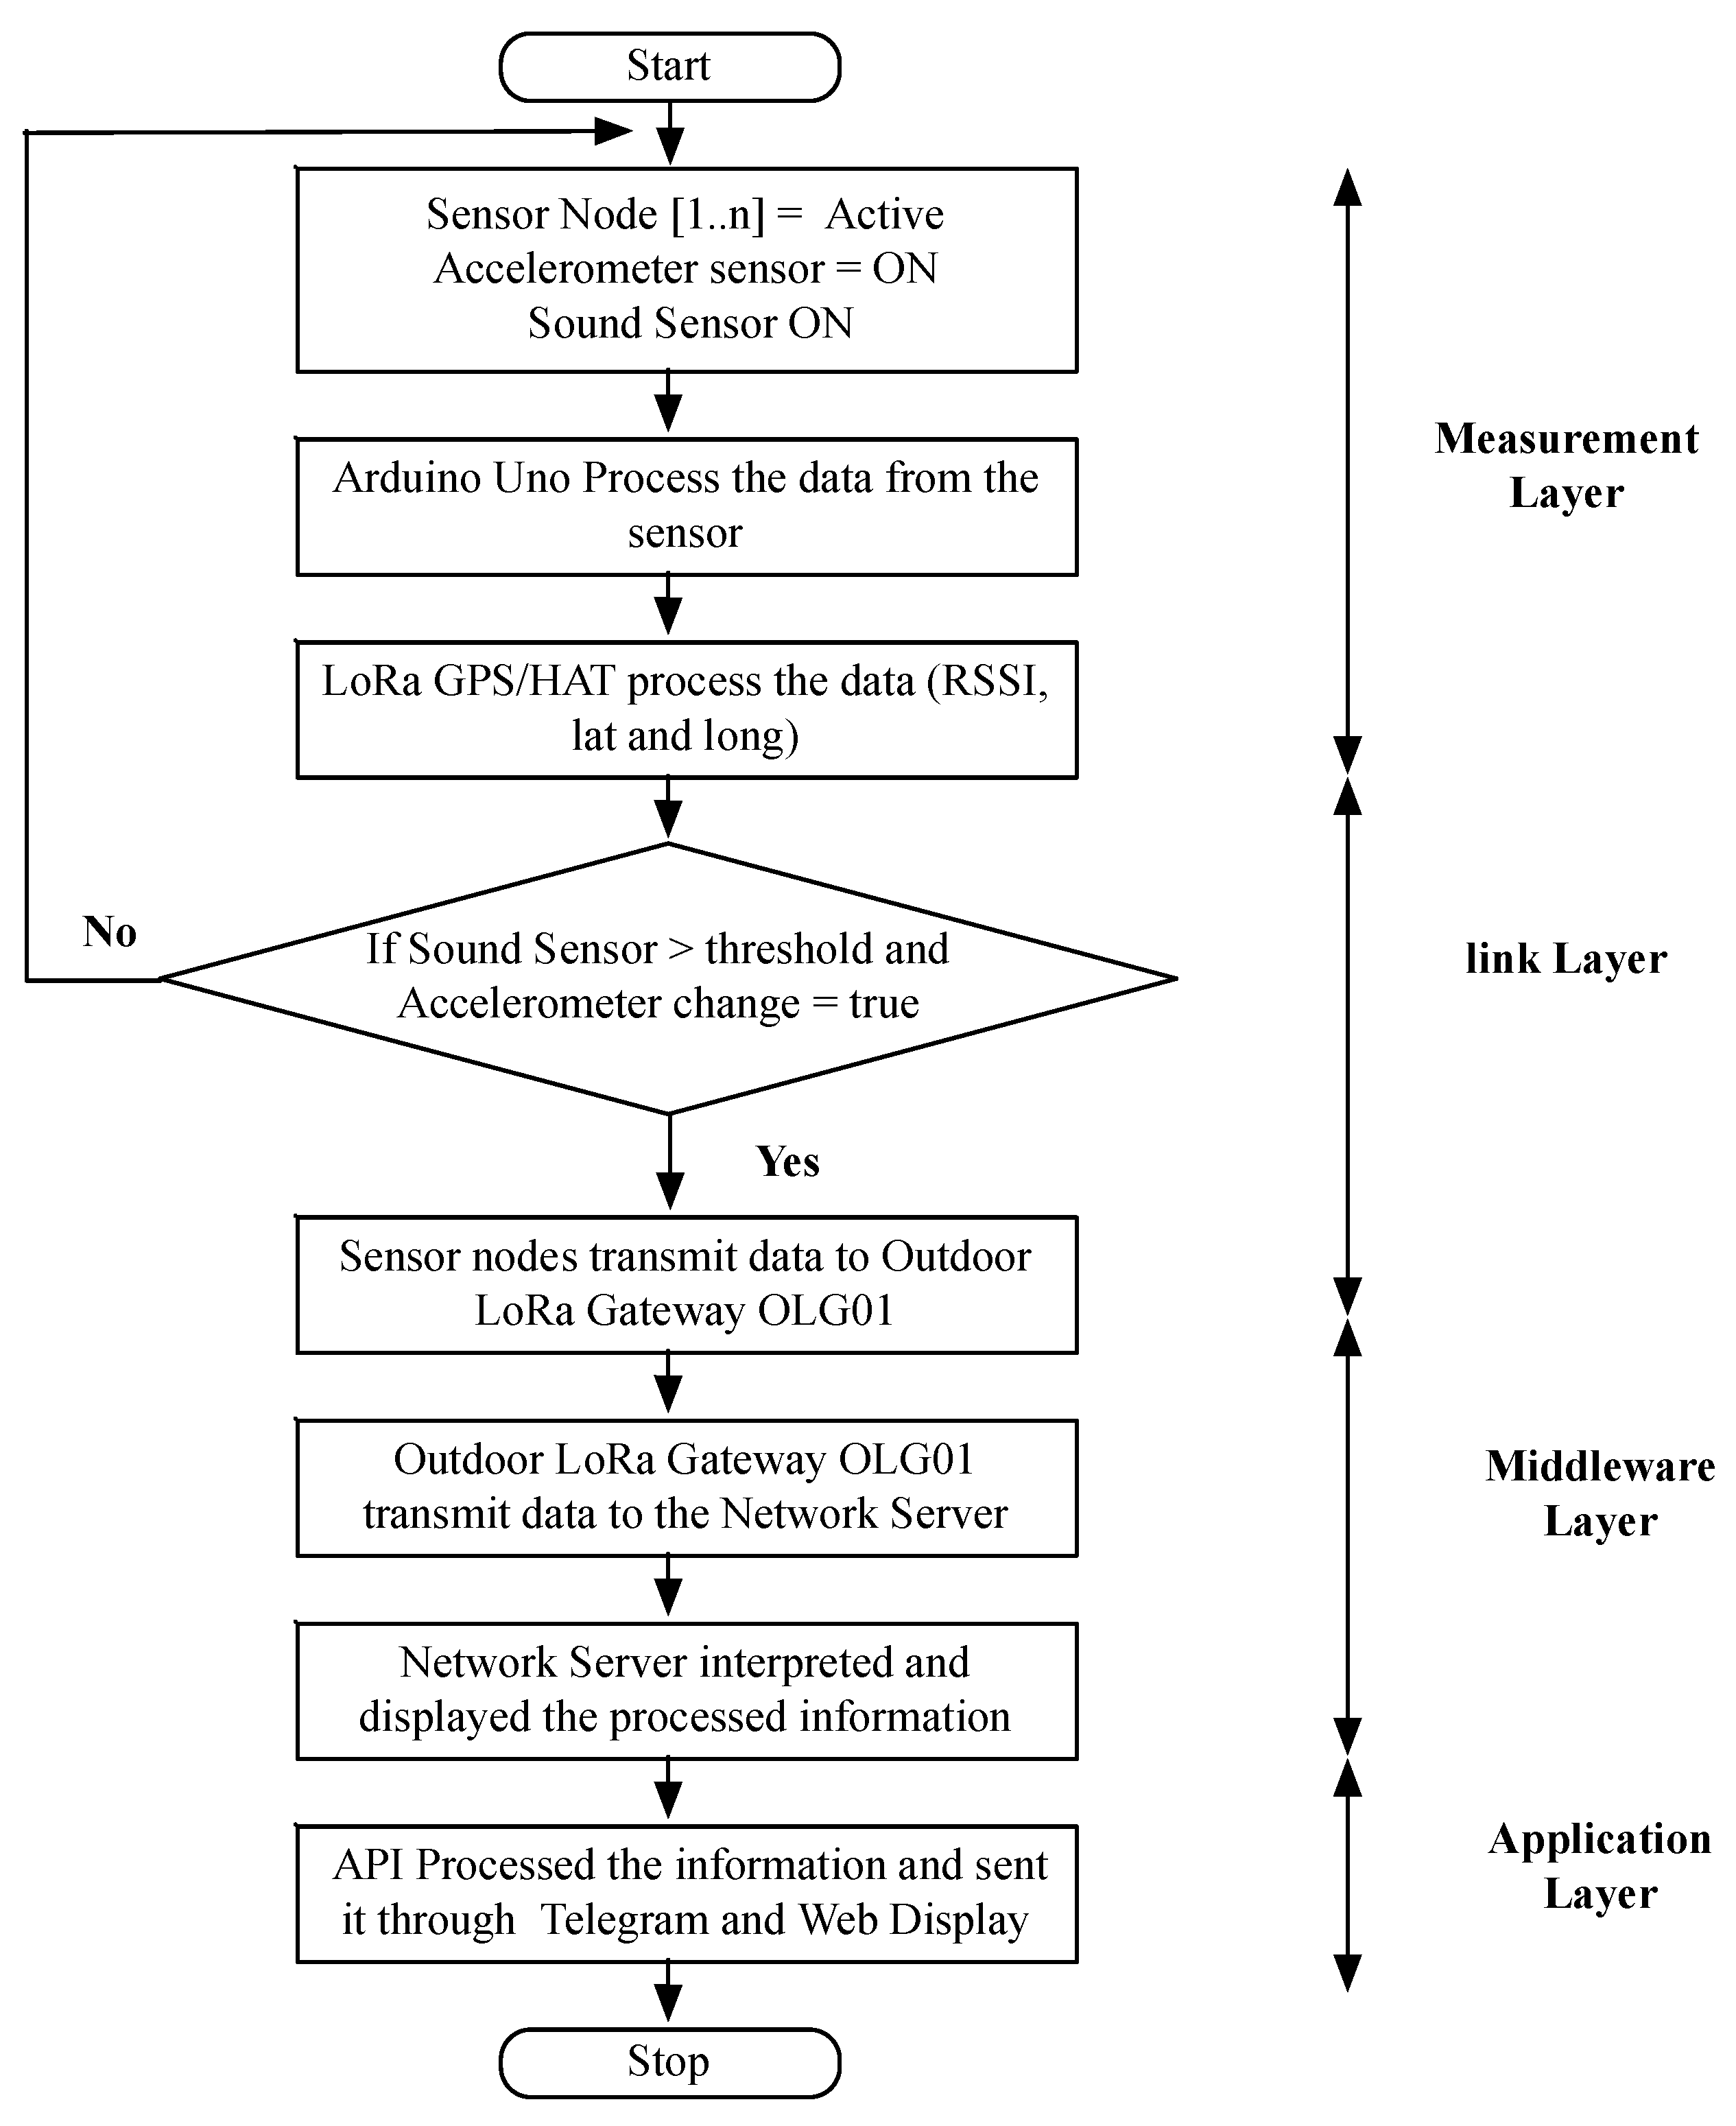
2.4. Flowchart of Proposed System

The occurrence of illegal cutting is detected by a sound sensor and an accelerometer sensor while the sensor nodes are in active. The data that were sensed by those sensors proceeded by the Arduino Uno. The Raspberry Pi and LoRa GPS/HAT proceed with the information of GPS data such as RSSI data, latitude, and longitude. The data that was collected from each sensor node was then sent to the Outdoor LoRa OLG01 Gateway if the illegal cutting has occurred. Illegal logging occurred when the value measured by the sound sensor exceeded a predetermined threshold. In addition, the changes of accelerometer data sensor must be in accordance with the changes in the determined threshold value, which indicates a change of tree position from the previous position. When both sensors are stated in a true logical condition, the illegal logging is indicated as happened.
All the aggregation data at the gateway will be sent to LoRa Network Server through the IP connection. The data were computed in the cloud server and displayed the result on a monitor or mobile device. The aggregation data sent are the data translated by LoRa in the form of RSSI data, sound sensor, vibration sensor, and GPS data like latitude and longitude. All the data recorded in the database will be displayed and informed to the user through telegrams and web applications. The system components can be seen in the flowchart shown in Figure 6.
In the term of the user, the flowchart of the application of illegal logging can be seen in Figure 7. When the telegram message was received by the user (e.g., forest ranger), the user opened the illegal logging application and saw the information about the activity. The tree position can be tracked by clicking on the google map application, and the user can chase the perpetrator of the illegal log theft.

2.5. Long-Range (LoRa) Configuration

LoRa is set at a frequency of 923 MHz, spreading factor (SF) = 12, payload (PL)= 8 bytes, coding rate (CR) = 4/5, and bandwidth (BW) = 125kHz. Header (H) = 0 and data rate optimization is disabled (DE) = 0. Time sequence of the network protocol can be seen in Figure 8. The communication between sensor nodes (Tx1 and Tx2) and the gateway delivered the real data environment. After conducting the data communication, Tx1 and Tx2 will be in the sleep duration until the next cycle. The gateway then aggregates the data from Tx1 and Tx2, and then transfers the data into the network server. The network server transfers data to the application server and forwards it to the user devices.

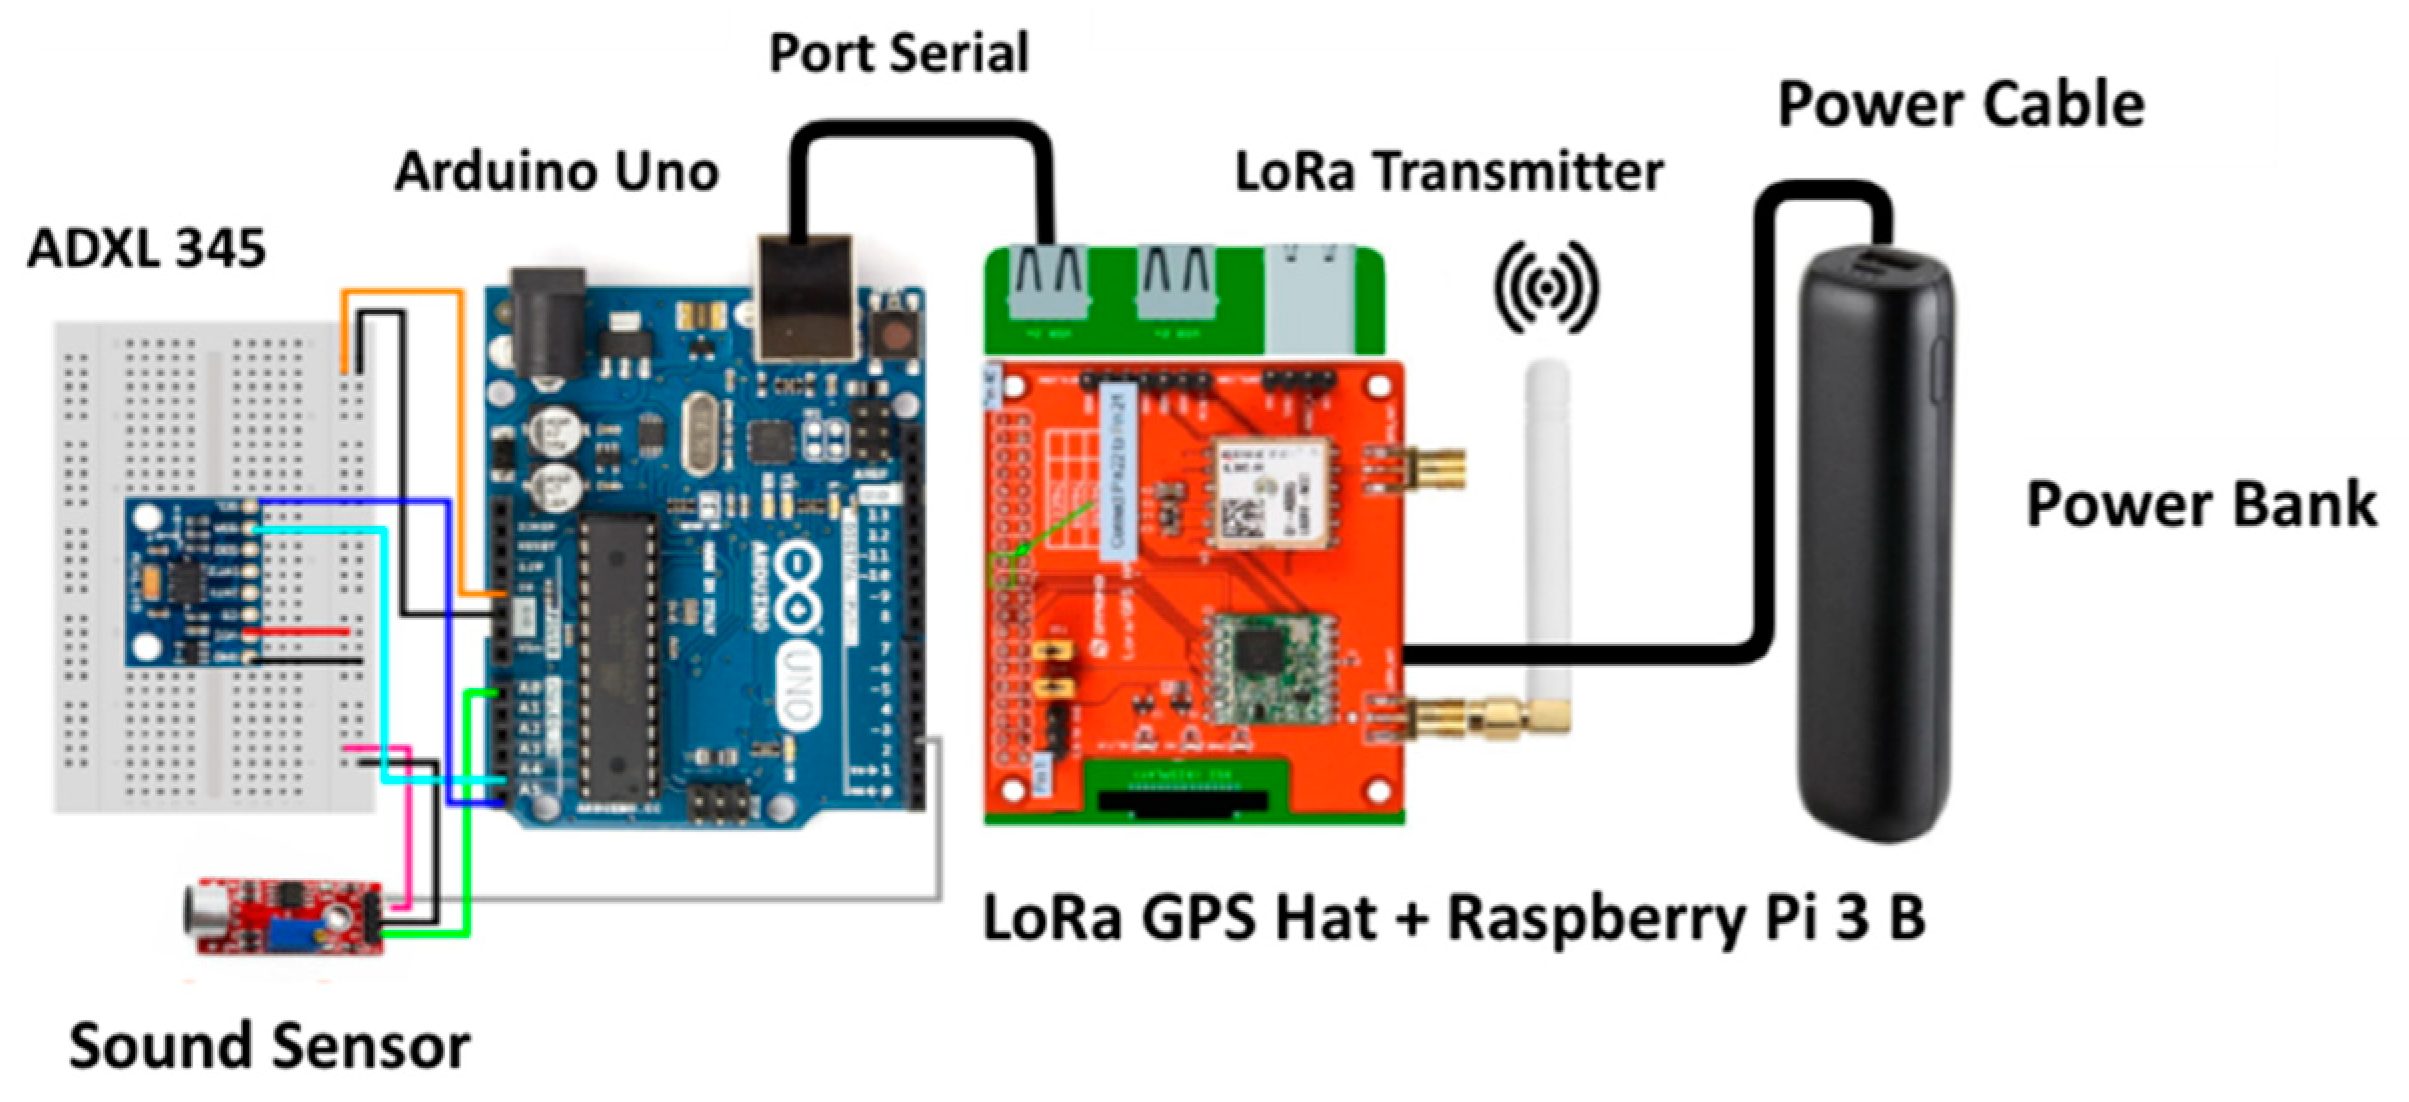
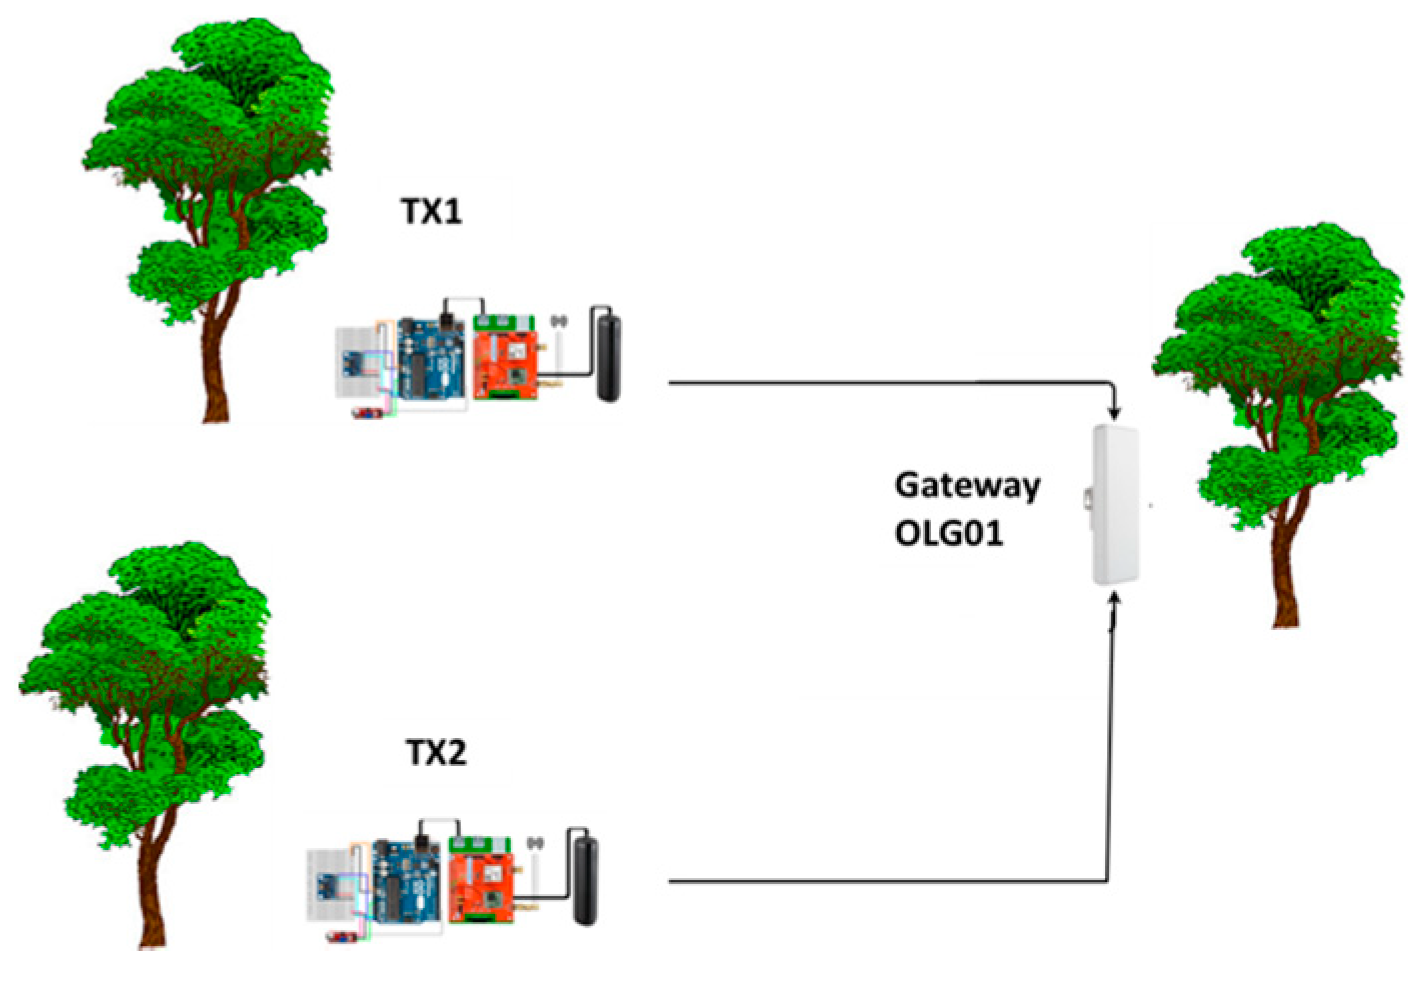
2.6. The Prototype of The Proposed System

The prototype of the proposed system can be seen in Figure 9. It consists of two sensor nodes Tx1 and Tx2 connected wireless with gateway OLG01. The prototype in local access is ready to test by several scenarios.

3. Result and Discussion

Several scenario tests were applied to examine the robustness and reliable data transmission in the proposed system. The scenarios have conducted a test to measure the LoRa performance in RSSI value and the GPS parameter in LoS (line of sight) and N-LoS (non-line of sight). The system also tested the tracking system’s ability based on the moving tree position to indicate that illegal logging has occurred.

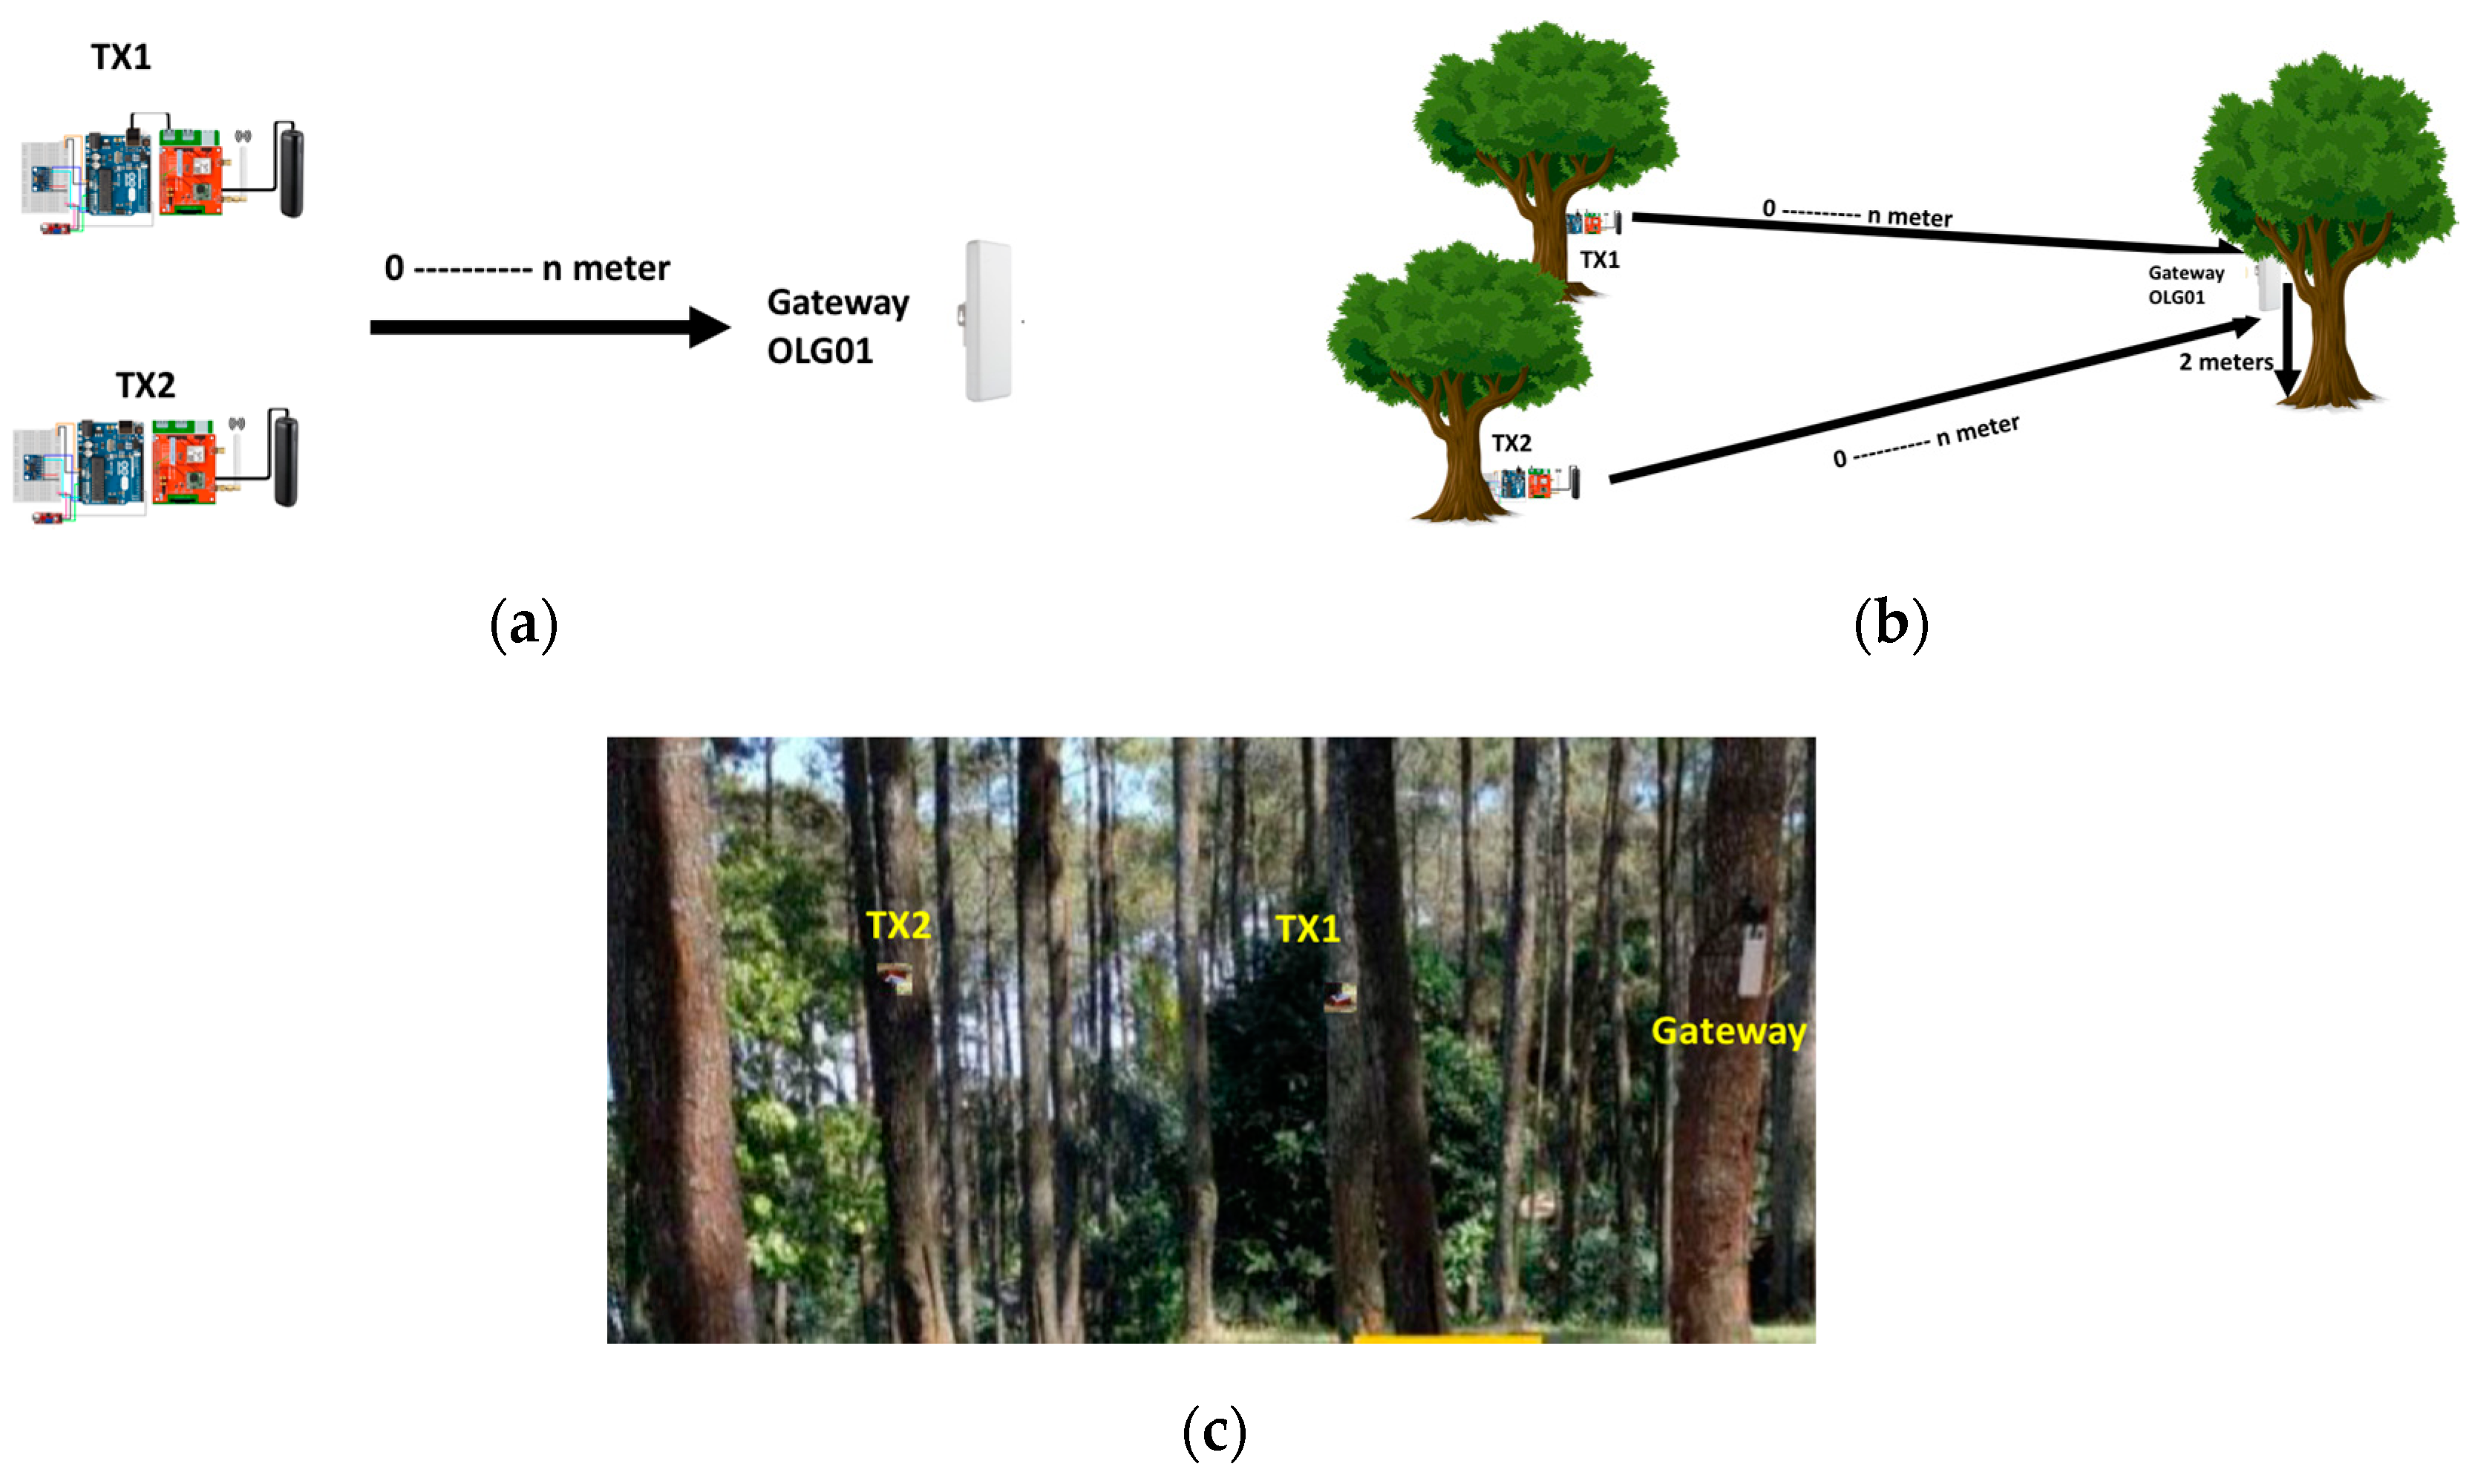
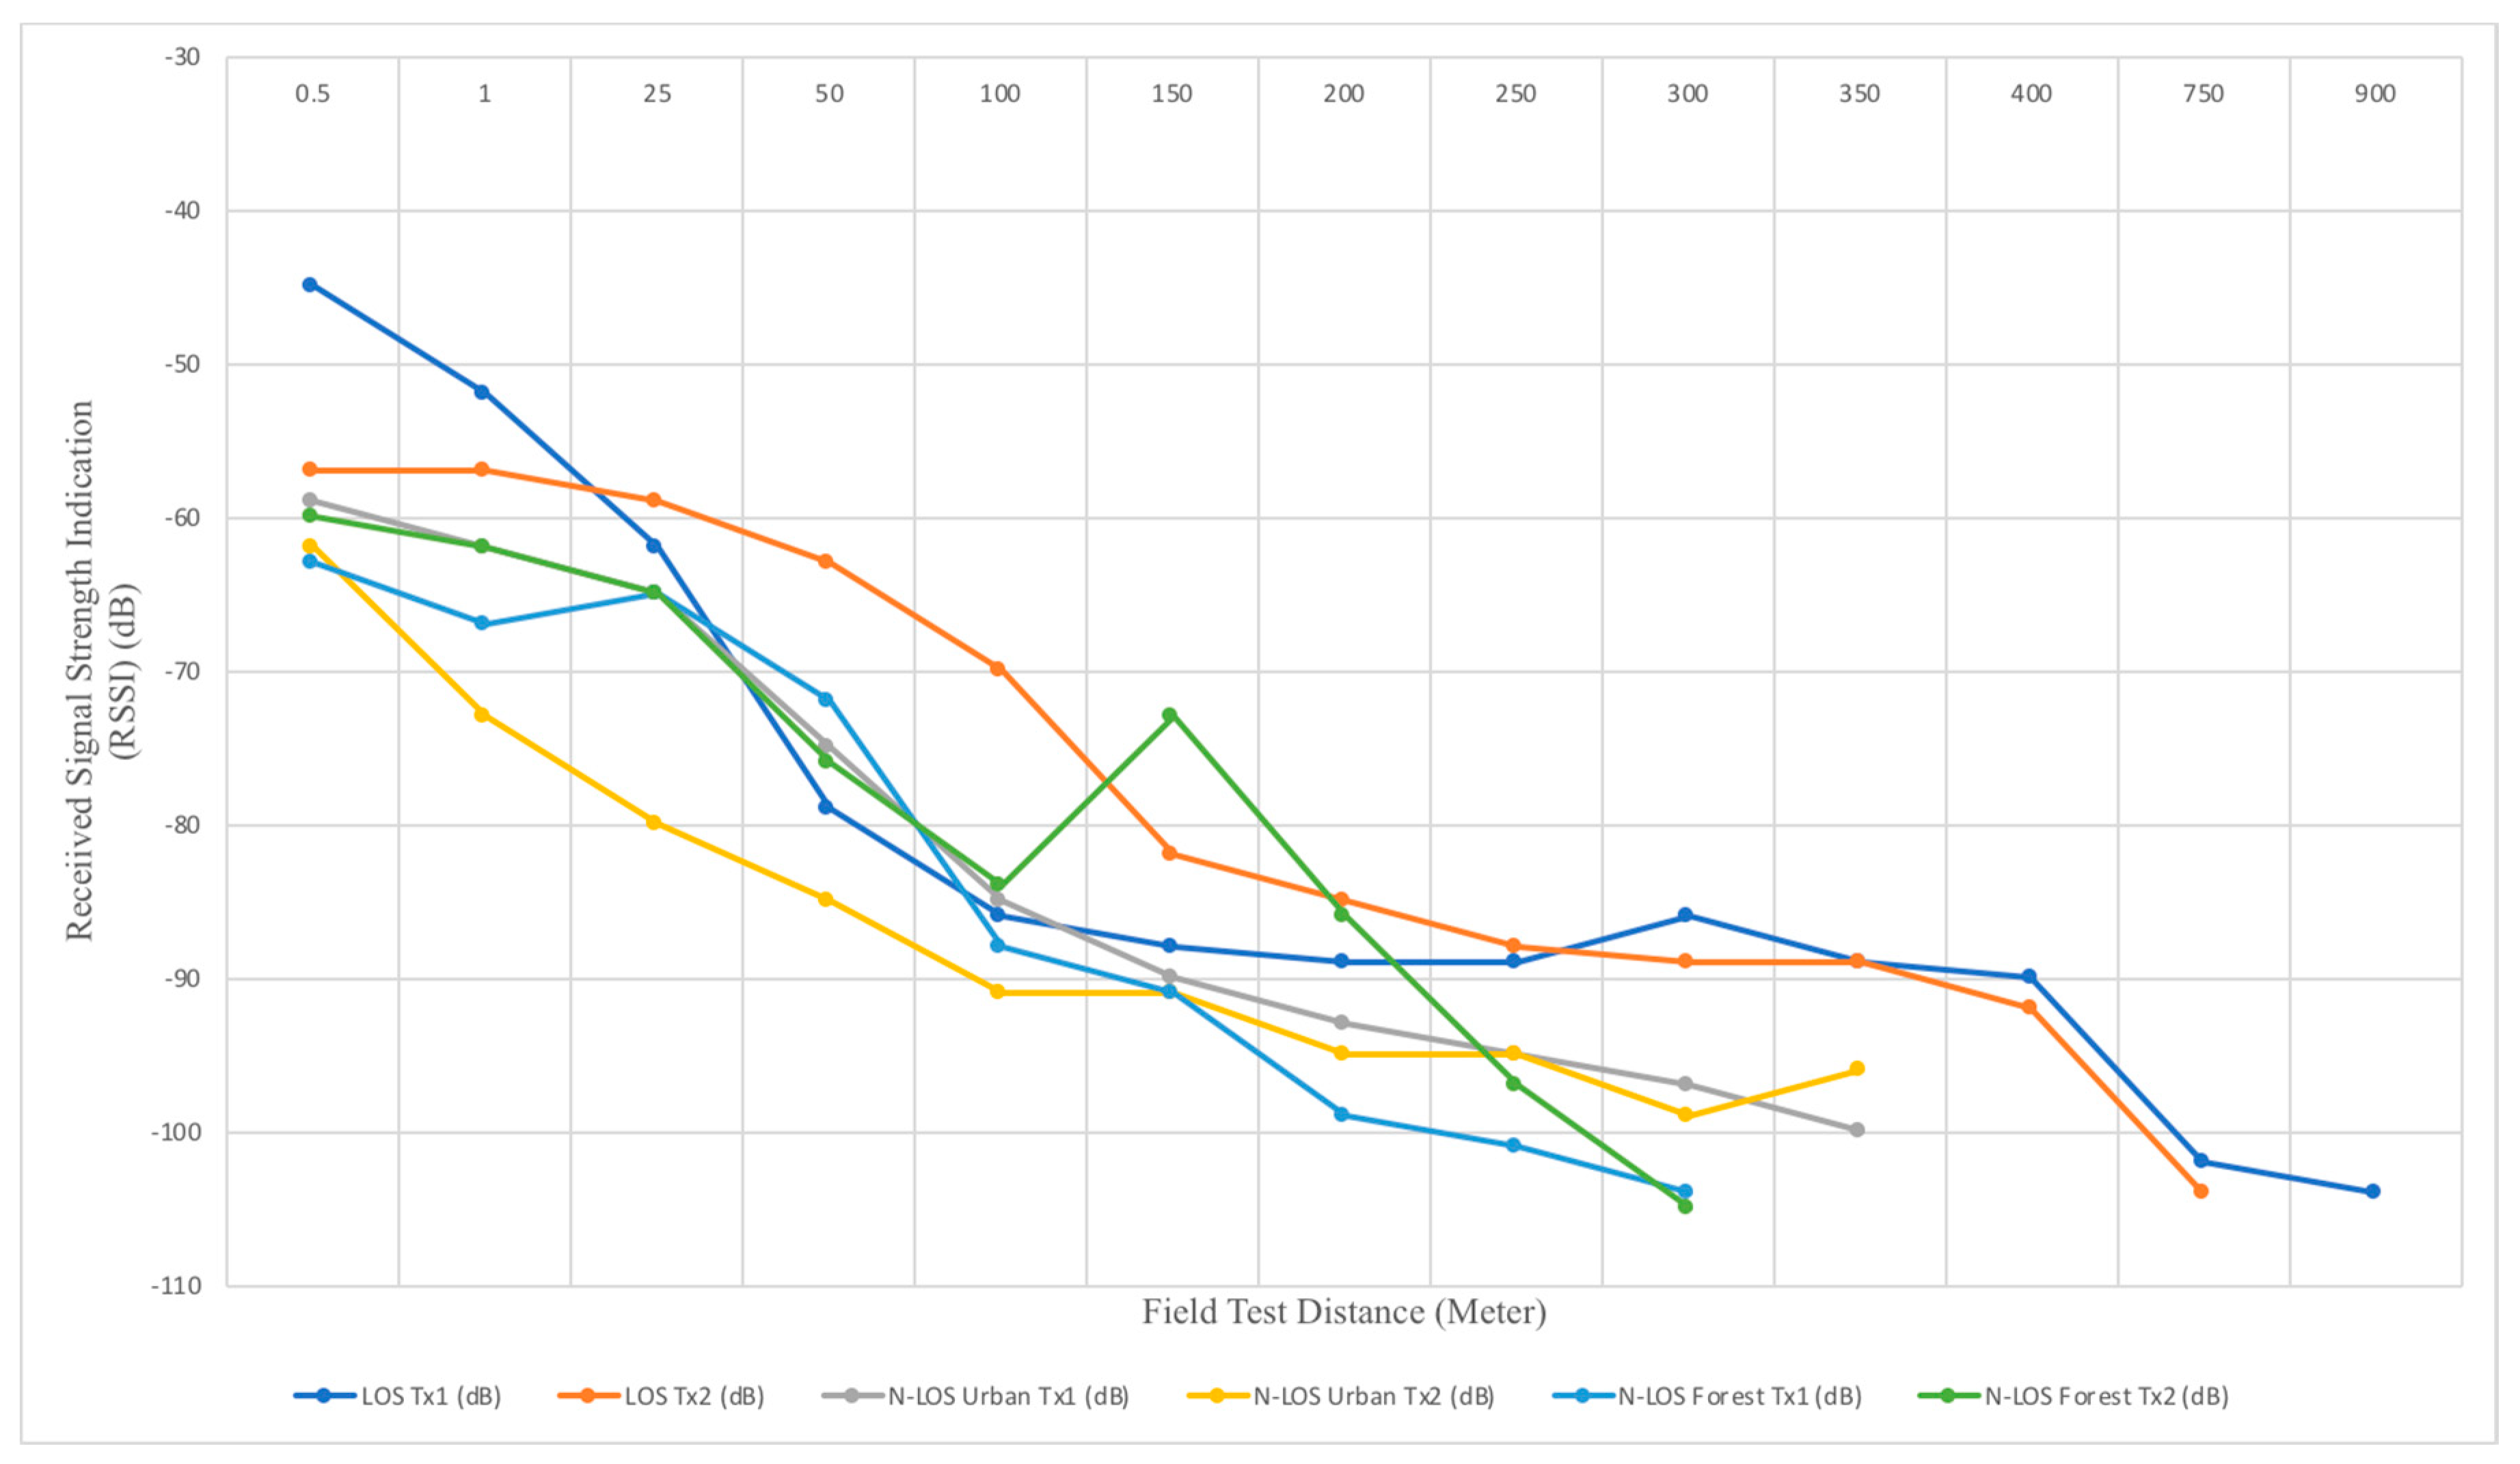
3.1. LoRa Performance based on Range-Distance RSSI

This scenario was examined in the LoS and N-LoS condition. This test aimed to measure the LoRa performance distance based on the strength of the RSSI signal devices between sensor node and gateway that can be detected by the system. As seen in Figure 10a–c, the LoS testing was examined in a large and open area of the soccer field near Telkom University. Meanwhile, the N-LoS testing was examined in a small forest inside the Telkom University area. The testing was also conducted in a forest in a suburb area near Batu Kuda Manglayang. The sensor nodes on the proposed system were moved to a range of 0.5 m from the gateway until the communication between the sensor node and the gateway could not be detected and lost connection. Sensor nodes and the gateway were located two meters from the ground.
The testing results of LoRa RSSI signal performance in the LoS and N-Los area shown in Figure 11. In LoS area at the soccer field, the communication between gateway OLG01 and sensor nodes connected in the range of 0–900 m for Tx1 and 0–750 m for Tx2. In Non-LoS area at Telkom University, the RSSI signal between gateway OLG01 and sensor nodes Tx1 and Tx2 are connected in the range of 0–350 m. The signal cannot be read when the Tx1 or Tx2 are moved more than 350 m. Meanwhile, for the testing result in the suburb forest area Batu Kuda Manglayang, the communication distance between gateway OLG01 and sensor nodes Tx1 and Tx2 can only reach around 300 m. It is the density and thickness of the environment around the sensor nodes which affected the signal strength between the transmitter and receiver.
The testing also conducted a measure of the most appropriate position for placing the gateway and node sensors in the tree; the best position in which to place the sensor nodes and gateway is estimated at 1.8 to 2 m from the ground.

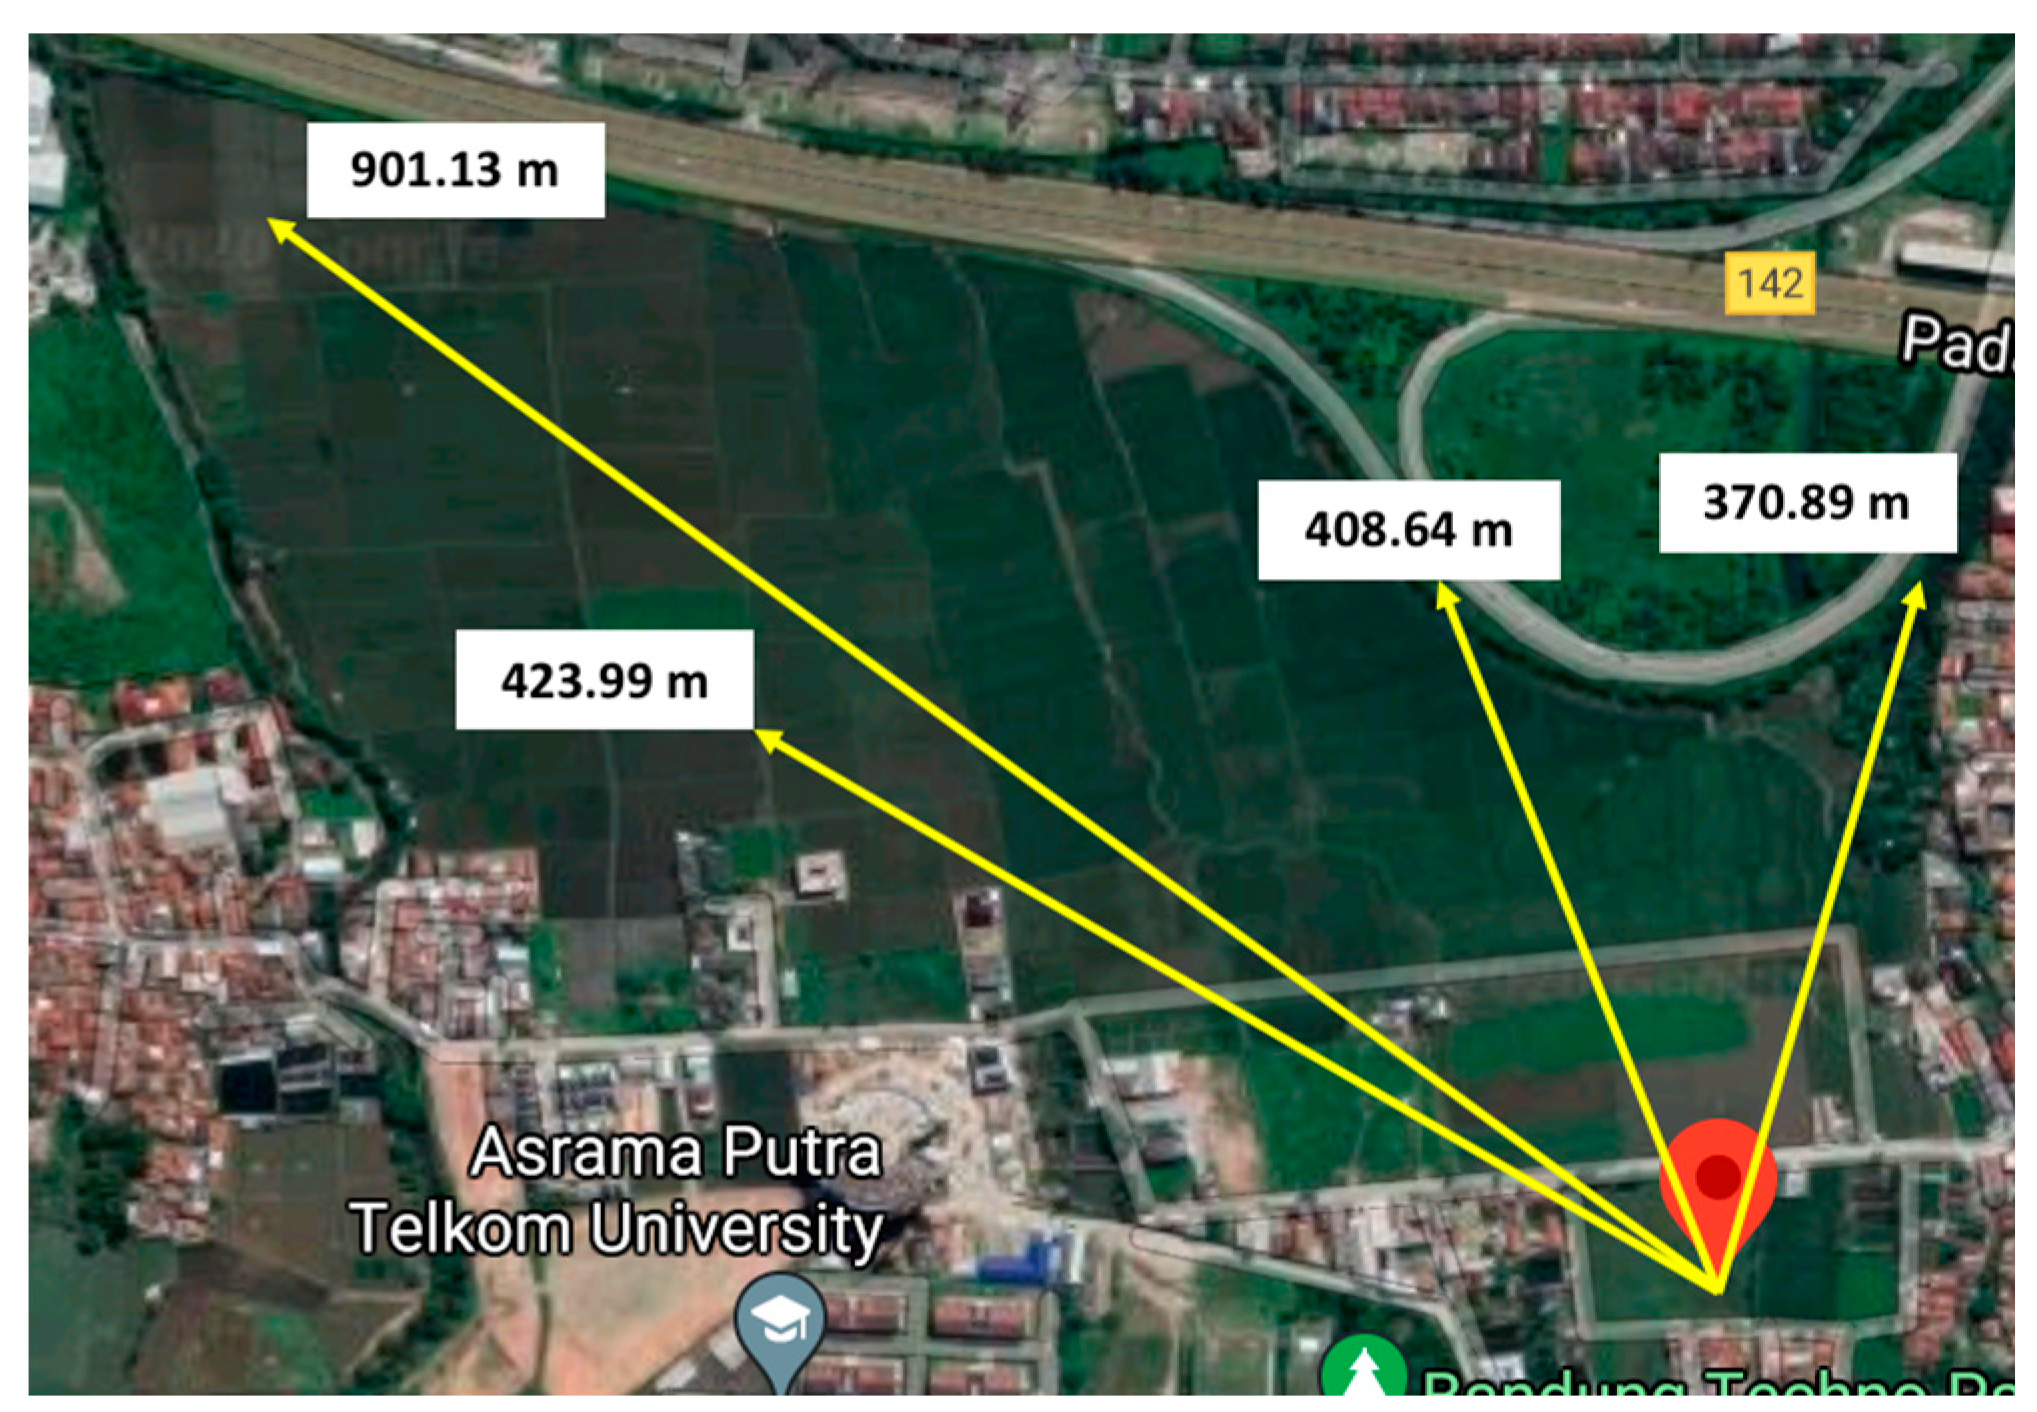
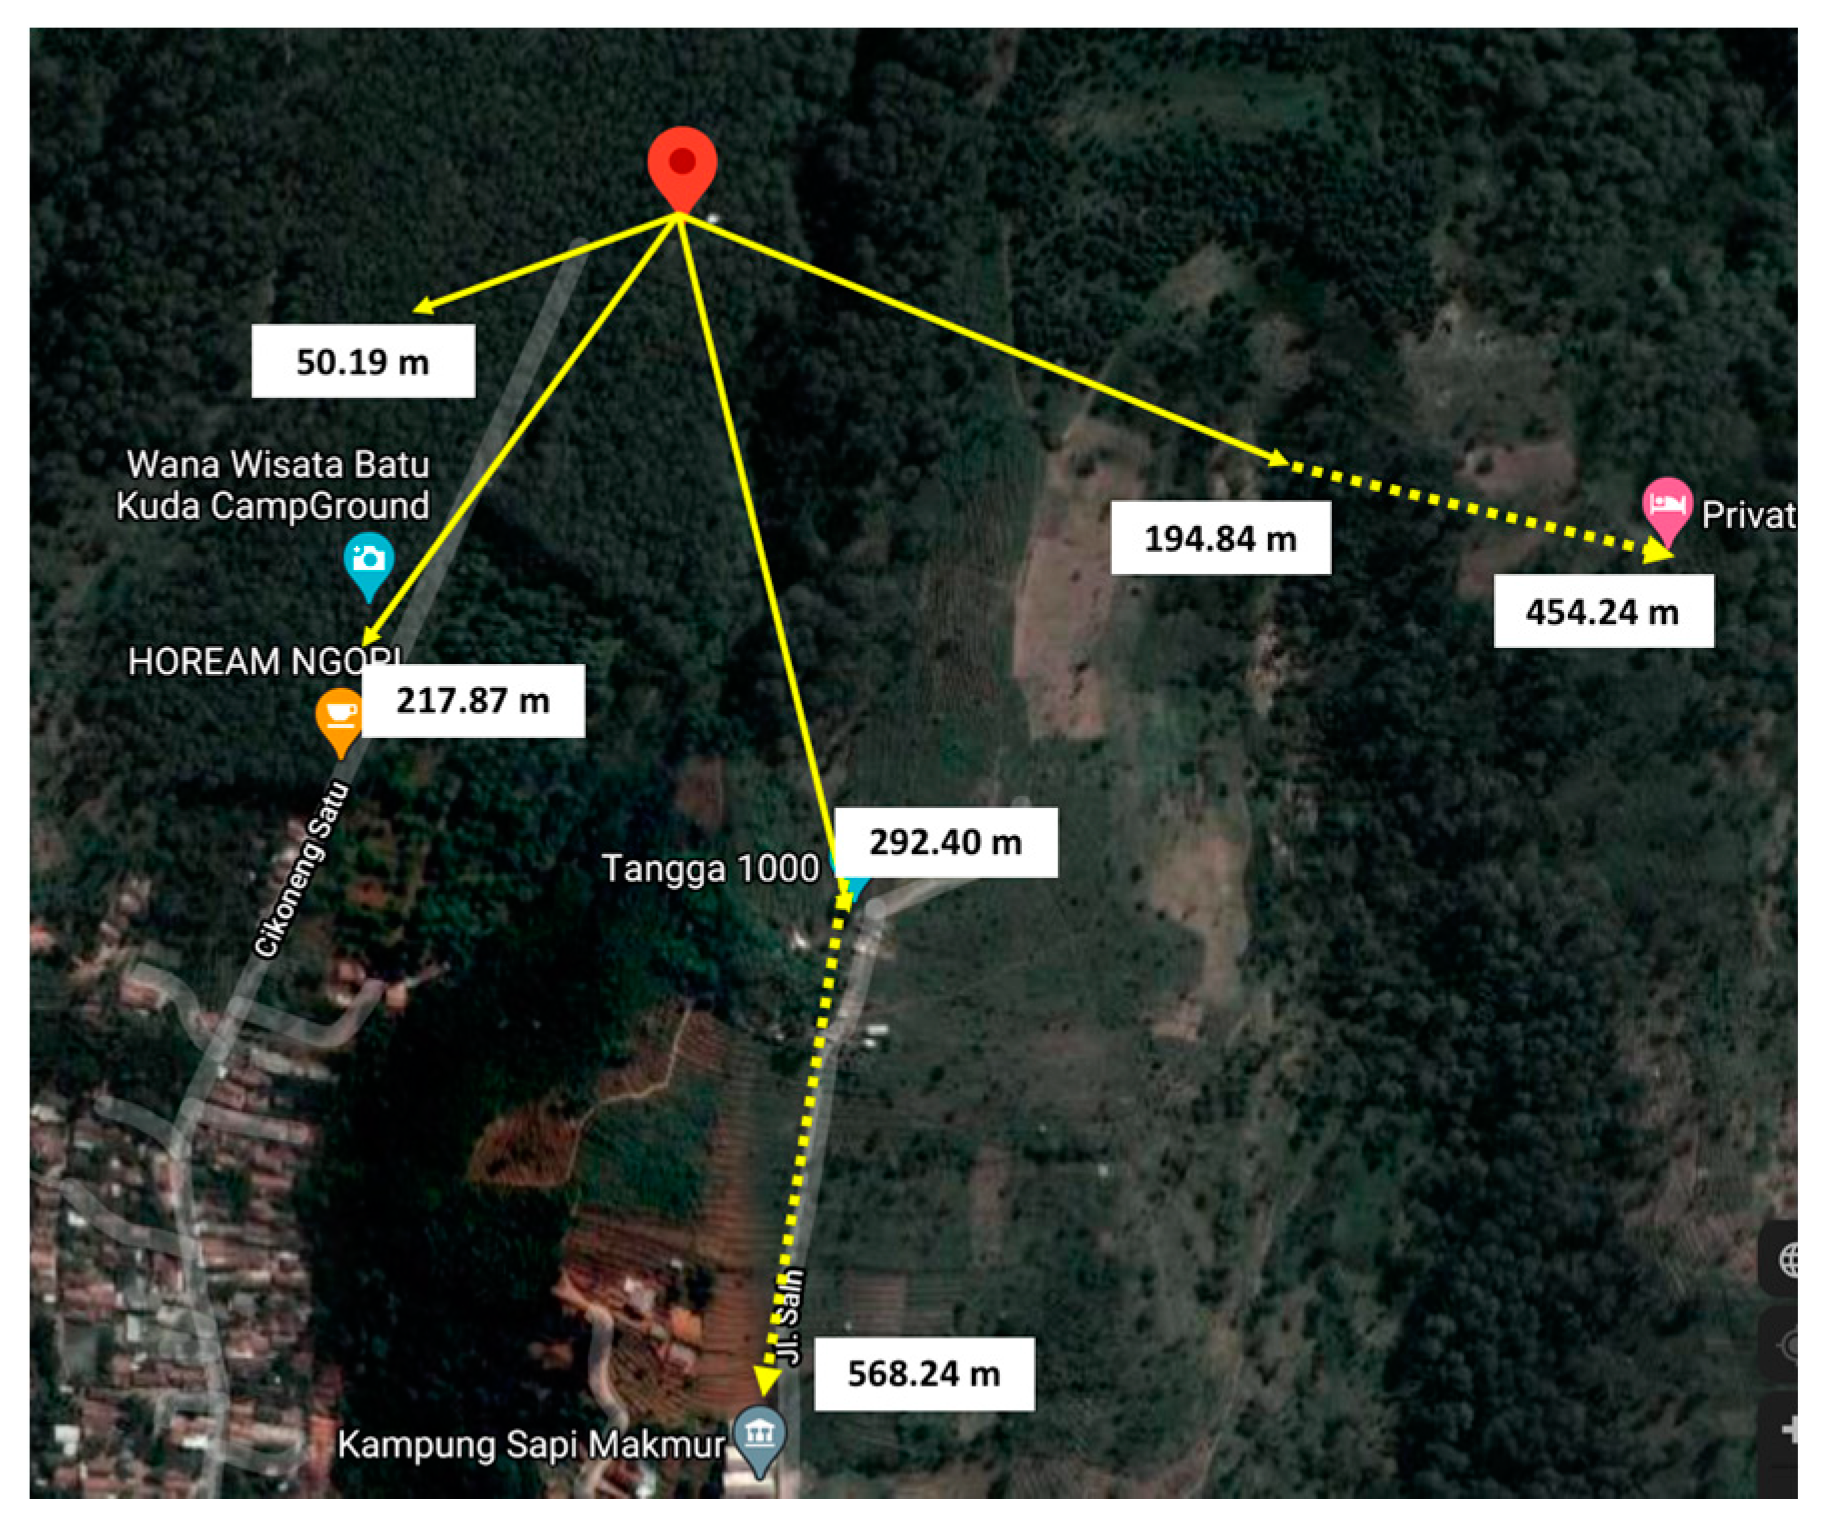
3.2. LoRa Tracking Performance

In the illegal logging application, the scenario that might occur if the thieves have cut down the tree, the location of the logs will be moved. So, in the second scenario, the system was tested to detect the new location of the logs for a tracking direction. This scenario was carried out by moving a sensor node TX1 and sensor node TX2 away from the gateway OLG01 with LoS and Non-LoS area as seen in Figure 10a–c.
The scenario test of LoS location can be seen in Figure 12. Line of sight tracking scenario at the proposed system revealed the movement of sensor node TX1 or TX2 for 135° as far as 901.13 m, 150° as far as 423.99 m, 100° as far as 408.64 m, and 60° as far as 370.89 m, away from the OLG01 gateway. This testing aimed to examine the distance range or how far the system can track the log’s position based on the gateway’s connection.
The moving of the GPS position result can be seen in Table 2. The position of the gateway OLG01 is placed in a location with Latitude −6.96966 and longitude 107.632. The sensor nodes TX1 and TX2 are moved from the gateway position to the predetermined position, as seen in Figure 12. The new GPS value of the moving sensor node can be tracked by analyzing the latitude and longitude value position of the GPS. The result in Table 3 reports the new position of the sensor node that identified the sensor node movement. The system cannot detect the sensor node’s new location when TX2 moved farther than 901.13 m from LoRa Gateway since it is far from the range of LoRa Gateway. Time processing to deliver the information is in real-time with a range of 2–5 s.
Figure 13 shows the tracking scenario of the N-LoS location at a small forest inside the Telkom University area. This scenario is also the same as the LoS scenario carried out by moving sensor node TX1 and sensor node TX2 away from the gateway OLG01 as seen in Figure 10b. The non-line of sight (N-LoS) tracking scenario in the proposed system tracked the moving sensor node TX1 or TX2 for 45° as far as 266.37 m, 90° as far as 330.36 m, 150° as far as 212.5 m continues until 362.28 m, 305° as far as 264.2 m, away from the OLG01 gateway.
The testing results in the N-LoS area can be seen in Table 3. The gateway OLG01 is placed in a location with Latitude −6.974782 and longitude 107.629622. All the moving can be defined except when TX2 moved to the location of 362.28 m from the LoRa Gateway since this is far from the range of LoRa Gateway. In Figure 13, no connection between the gateway node and the moving sensor is represented by a dashed line. The processing time to deliver the information is not in real-time with a range of 20–34 s.
Figure 14 shows the tracking scenario of the N-LoS location at the suburb forest area Batu Kuda Manglayang with different density and altitude of forest characteristics, as seen in Figure 10c. The non-line of sight (N-LoS) tracking scenario at the proposed system monitored the moving sensor node TX1 or TX2 for 225° as far as 50.19 m, 240° as far as 217.87 m, 290° as far as 292.40 m, continuing until 568.24 m; 335° as far as 194.84 m continues until 454.24 m away from the OLG01 gateway.
The resulting testing can be seen in Table 4. The gateway OLG01 is placed in a location with Latitude −6.8921 and longitude 107.746. The sensor nodes TX1 and TX2 are moved from the gateway position to the predetermined position, as seen in Figure 14; all the movement can be tracked. The system cannot detect the new location of the sensor node when Tx1 moved to the location of 568.24 m, and Tx2 moved to 454.24 m away from the LoRa Gateway, since this is far from the range of the LoRa Gateway. In Figure 14, no connection between the gateway node and the moving sensor is represented by a dashed line. The processing time to deliver the information is not in real-time with a range of 5–46 s.

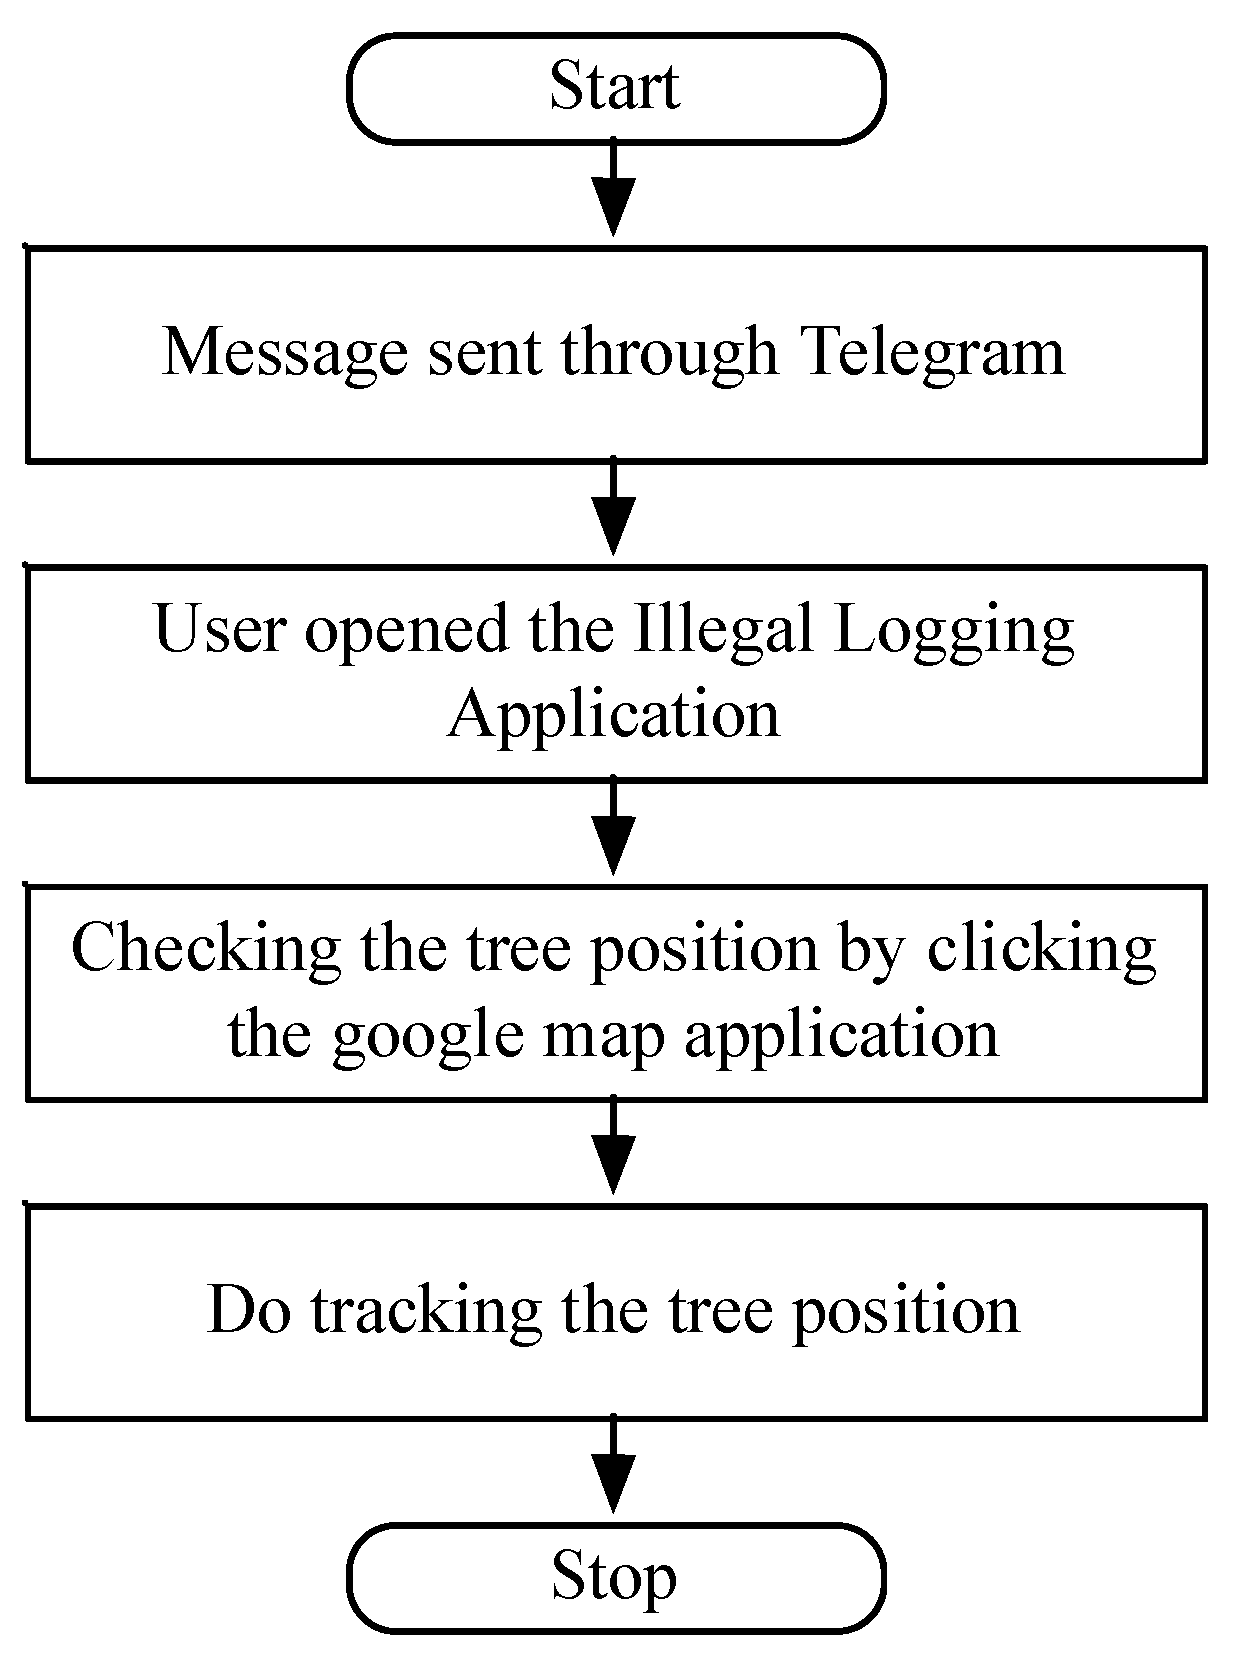
3.3. Illegal Logging Application

After testing the proposed system in the local access layer, the next step was to apply the testing scenario at the remote access layer. As seen in Figure 15, the display of the web application shows that the Tx1 has been moved to location -6.89022 latitude, 107.745549 longitude as far as 202 m from the gateway. This testing is carried out to measure the delivery of tracking information for the user in the form of monitoring devices and telegrams.
On the displayed web, the sensor node’s position is shown as default, but the capture position in the display is the current position when the sensor node is moved away from the gateway. The map location of Illegal Logging Tracking (ILT) will display the new position of the moving log. The monitor display information has also revealed information about the value of sensor sound, sensor gyro, GPS parameter, and the time when the system tracks the new position.
Meanwhile, the display on the telegram and tracking google map application can be seen in Figure 16. The map location of ILT also displayed the new position of the moving log. The telegram was received by the user at about 7 km from the location or after driving for about 51 min to the location. To access the My Tracks, click the new site and the tracking map displayed.

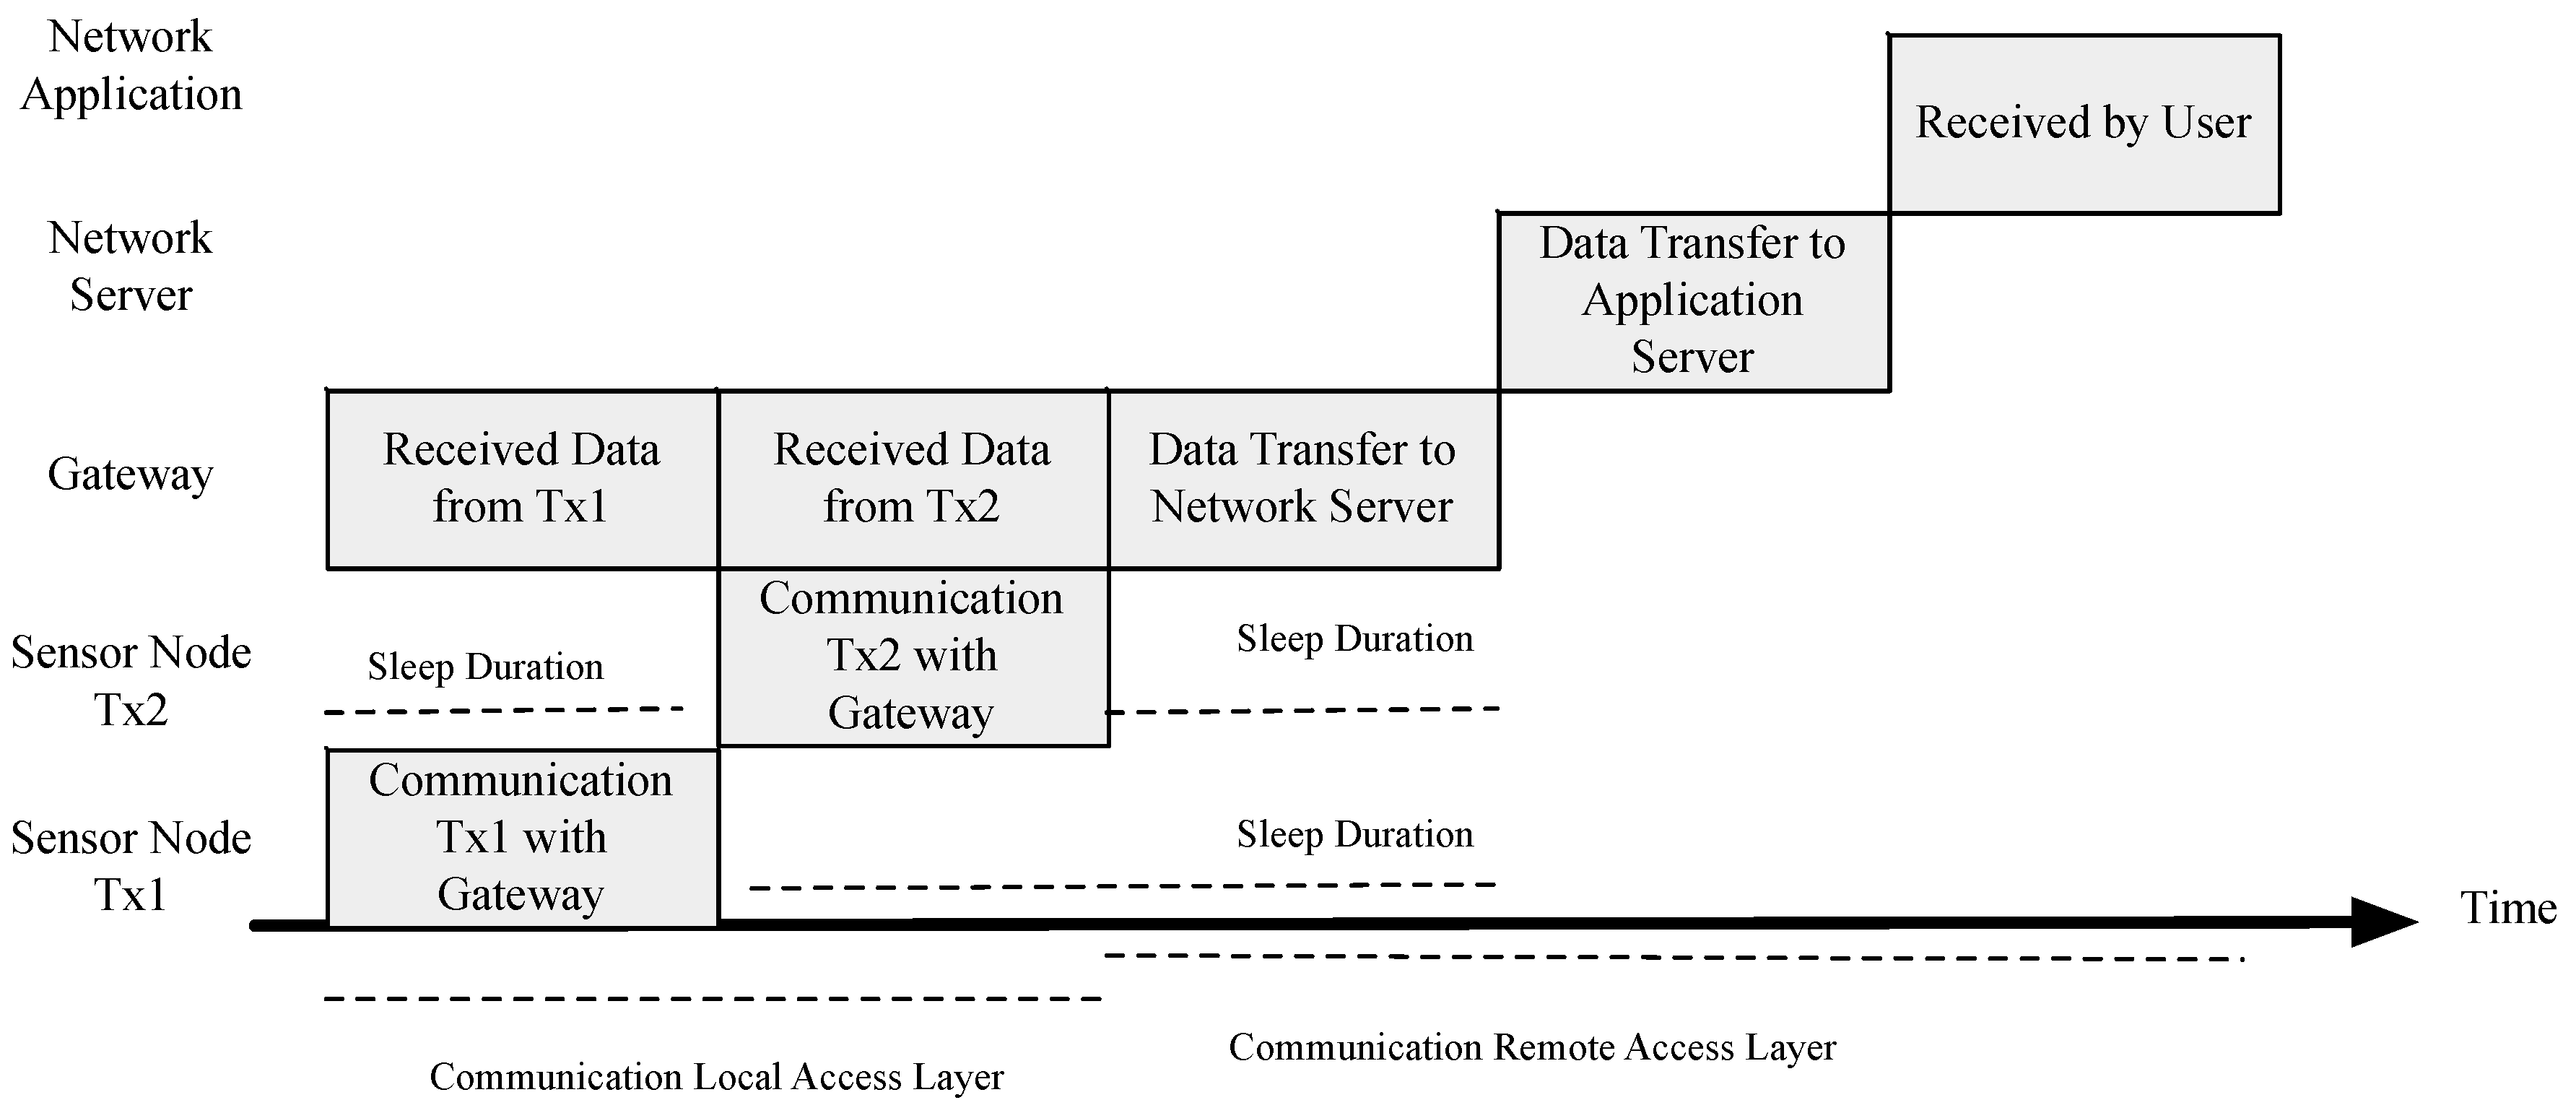
3.4. Energy Consumption

The energy consumption in one node for LoRa in the system, using the battery voltage of 3.3 volts, battery capacity of 10,050 mAh and the duty cycle based on LoRa characteristics (process, receiver, transmit) is 5970 ms with interrogations mode three times per day. The microcontroller consumed 16 mA, and the sensors consumed not more than 0.024 mA. LoRa itself consumed 10.3 mA. It takes 25 mA, −165 dBm if the GPS was working in the tracking process. In sleep mode, GPS consumes about 55 μA. LoRa consumed less than 60 μA, and the sensors less than 1 μA.
The estimation of battery life is solved by a power energy formula for electricity. The estimation of battery life for the LoRa performance without GPS takes 195.9 h. In contrast, the estimation of battery life for the system while using the GPS in the tracking process takes 140.95 h. The energy runs out quickly if the GPS is working in the tracking process.

4. Conclusions

This paper aimed to design a prototype and implementation of an IoT application that can detect the illegal cutting of trees and perform tracking using GPS in LoRA HAT. This proposed system is expected to increase the awareness and help the forest police to identify the occurrence of logging trees in the forest and to track the cutting of logs. Therefore, this system can help to reduce and detain the process of forest degradation.
Based on the testing result, the communication module LoRA was applied in the illegal logging application using the topology STAR of STAR. The LoRA communication performance between the node and the gateway measured the RSSI (dB) value and the distance (m). The resulting testing determined that sensor node TX1 connected with the gateway in the range of 0–900 m while sensor node Tx2 was in the range of 750 m in LoS area. At the small forest in the urban area as N-Los measurement, sensor nodes Tx1 and Tx2 can reach between 0 and 350 m. Meanwhile, in the N-LoS area at the suburb forest, sensor node Tx1 and Tx2 connected with the gateway in the maximum range of 0–300 m. The result of LoRa performance signal testing in N-LoS area is much shorter than LoS area. It is because there are many obstacles, such as the density of trees and high building. The placement of the gateway position must be located between 1.8 and 2.2 m, wherein that position, the signal can transmit further distance. If it is located too high or too low, the signal will meet more obstructions such as a bush, tree trunk, dense trees or the differences in Meters Above Sea Level (MASL).
Meanwhile, for tracking the moving log, the sensor node can be tracked by the system as long as the new location is in the range of gateway OLG01 location by identifying the new location of GPS. The delivery of information regarding the occurrence of illegal logging can be monitored and received by the users at a distance of more than 7 km. The processing time for captured information in LoS area adheres to real-time conditions, meanwhile, in N-LoS area it takes about 10–46 s to process the information. It is because the farther the transmitter and receiver are, the more power the device must consume and the weaker the signal is. The comparison between the previous study [40] stated that LoRa has a more extended range of communication than ZigBee. LoRa also has better energy consumption than ZigBee.
For future work, the system can be built in a larger prototype and embedded into a whole logging process stage. In this research, the energy consumed by LoRa/GPS HAT for Raspberry Pi, is still not optimal. However, LoRa/GPS HAT for Raspberry Pi still consumes less power and is better compared to ZigBee. So, the component can be replaced with other types of LoRa series that are compatible with Arduino. The system can be extended with the extra antenna to have a farther range; however, energy consumption must be considered because the extended antenna will consume extra energy. Besides, The GPS-free geolocation can be enhanced in the system for future work. The implementation of web applications will be advantageous for the user in order to track in an exemplary of Graphical User Interface (GUI). Considering the wide-area network in the illegal cutting region, the study of the efficient energy consumption at each node sensor needs further exploration.

Author Contributions

Conceptualization, G.A.M. and N.S.H.; methodology, G.A.M.; software, G.A.M.; validation, G.A.M., N.S.H. and O.M.; formal analysis, G.A.M.; investigation, G.A.M.; resources, G.A.M.; data curation, G.A.M.; writing—original draft preparation, G.A.M.; writing—review and editing, G.A.M., N.S.H. and O.M.; visualization, G.A.M.; supervision, N.S.H., and O.M.; project administration, G.A.M.; funding acquisition, G.A.M. All authors have read and agreed to the published version of the manuscript.

Funding

This research received publication funding from Telkom University.

Acknowledgments

I would like to express my appreciation to Center for Advanced Computing Technology (C-ACT), Faculty of Information and Communication Technology, Universiti Teknikal Malaysia Melaka (UTeM) and thank you to Embedded and Network System Research Group Laboratory of Telkom University, Bandung, Indonesia for supported this research.

Conflicts of Interest

The authors declare no conflict of interest.

References

  1. Miettinen, J.; Stibig, H.-J.; Achard, F. Remote sensing of forest degradation in Southeast Asia—Aiming for a regional view through 5–30 m satellite data. Glob. Ecol. Conserv. 2014, 2, 24–36. [Google Scholar] [CrossRef]
  2. Okia, C.A. Deforestation: Causes, Effects and Control. Strategies. In Global Perspectives on Sustainable Forest Management; Okia, C.A., Ed.; InTech: Rijeka, Croatia, 2012. [Google Scholar]
  3. Saunders, J. Illegal Logging and Related Trade the Response in Lao PDR. A Chatham House Assessment; Chatham House: London, UK, 2014. [Google Scholar]
  4. Tzoulis, I.K.; Andreopoulou, Z.S.; Voulgaridis, E. Wood Tracking Information Systems to Confront Illegal Logging. J. Agric. Informatics 2014, 5, 9–17. [Google Scholar] [CrossRef]
  5. Mutiara, G.A.; Suryana, N.; Mohd, O.B. Wireless sensor network for illegal logging application: A systematic literature review. J. Theor. Appl. Inf. Technol. 2019, 97, 302–313. [Google Scholar]
  6. Jang, I.; Pyeon, D.; Kim, S.; Yoon, H. A Survey on Communication Protocols for Wireless Sensor Networks. J. Comput. Sci. Eng. 2013, 7, 231–241. [Google Scholar] [CrossRef] [Green Version]
  7. Dargie, W.; Poellabauer, C. Fundamentals of Wireless Sensor Networks: Theory and Practice; John Wiley & Sons Inc.: Hoboken, NJ, USA, 2010; Volume 136. [Google Scholar]
  8. Shaikh, M.R.S. A Review Paper on Electricity Generation from Solar Energy. Int. J. Res. Appl. Sci. Eng. Technol. 2017, V, 1884–1889. [Google Scholar] [CrossRef]
  9. Luvisotto, M.; Tramarin, F.; Vangelista, L.; Vitturi, S. On the Use of LoRaWAN for Indoor Industrial IoT Applications. Wirel. Commun. Mob. Comput. 2018, 2018, 1–11. [Google Scholar] [CrossRef] [Green Version]
  10. Buratti, C.; Conti, A.; Dardari, D.; Verdone, R. An Overview on Wireless Sensor Networks Technology and Evolution. Sensors 2009, 9, 6869–6896. [Google Scholar] [CrossRef] [Green Version]
  11. Mutiara, G.A.; Suryana, N.; Mohd, O. WSN nodes power consumption using multihop routing protocol for illegal cutting forest. TELKOMNIKA (Telecommun. Comput. Electron. Control.) 2020, 18, 1529–1537. [Google Scholar] [CrossRef]
  12. Mutiara, E.A. Smart cane with location detection using RF module. Int. J. Adv. Appl. Sci. 2018, 5, 65–70. [Google Scholar] [CrossRef]
  13. Mutiara, G.A.; Hapsari, G.I.; Pratondo, A. Estimote-Based Location Awareness on Mobile Devices for Visually Impaired. J. Theor. Appl. Inf. Technol. 2019, 96, 215–226. [Google Scholar]
  14. Erturk, M.A.; Aydın, M.A.; Büyükakkaşlar, M.T.; Evirgen, H. A Survey on LoRaWAN Architecture, Protocol and Technologies. Futur. Internet 2019, 11, 216. [Google Scholar] [CrossRef] [Green Version]
  15. Devi, P.; Istianti, D.; Prawiro, S.Y.; Bogi, N.; Karna, A.; Nursafa, I.A. Analisis Performansi Teknologi Akses LPWAN LoRa Antares Untuk Komunikasi Data End Node. In Proceedings of the CITEE 2019, Yogyakarta, Indonesia, 24–25 July 2019; pp. 24–25. [Google Scholar]
  16. Craig Alan Repec. Regulatory Status for Using RFID in the EPC Gen2 (860 to 960 MHz) Band of the UHF Spectrum; GS1: Brussel, Belgium, 2019. [Google Scholar]
  17. Raza, U.; Kulkarni, P.; Sooriyabandara, M. Low Power Wide Area Networks: An Overview. IEEE Commun. Surv. Tutor. 2017, 19, 855–873. [Google Scholar] [CrossRef] [Green Version]
  18. Fargas, B.C.; Petersen, M.N. GPS-Free Geolocation Using LoRa in Low-Power WANs; Global Internet of Things Summit, Proceedings; Institute of Electrical and Electronics Engineers (IEEE): Geneva, Switzerland, 2017; pp. 1–6. [Google Scholar]
  19. Usmonov, M.; Gregoretti, F. Design and implementation of a LoRa based wireless control for drip irrigation systems. In Proceedings of the 2017 2nd International Conference on Robotics and Automation Engineering, ICRAE 2017, Shanghai, China, 29–31 December 2017; pp. 248–253. [Google Scholar]
  20. Vu, V.A. Design of automatic irrigation system for greenhouse based on LoRa technology. In Proceedings of the 2018 International Conference on Advanced Technologies for Communications (ATC), Ho Chi Minh City, Vietnam, 18–20 October 2018; pp. 72–77. [Google Scholar]
  21. Nisa, N.A.B.; Priyadharshini, K.; Priyadharshini, K.; Devi, R.N. Agriculture Irrigation Water Demand Forecasting Using LORA Technology. Int. Res. J. Eng. Technol. 2019, 6, 3050–3052. [Google Scholar]
  22. Kodali, R.K.; Borra, K.Y.; Sai, G.N.S.; Domma, H.J. An IoT Based Smart Parking System Using LoRa. In Proceedings of the 2018 International Conference on Cyber-Enabled Distributed Computing and Knowledge Discovery, CyberC, Zhengzhou, China, 18–20 October 2018; pp. 151–154. [Google Scholar]
  23. Alkhatib, A.A.A. Wireless Sensor Network for Forest Fire Detection and Decision Making. Int. J. Adv. Eng. Sci. Technol. 2013, 2, 299–309. [Google Scholar]
  24. Picó, A.M.; Cuesta-Frau, D.; Araujo, A.; Alejandre, J.; Rozas, A. Forest Monitoring and Wildland Early Fire Detection by a Hierarchical Wireless Sensor Network. J. Sens. 2016, 2016, 1–8. [Google Scholar] [CrossRef] [Green Version]
  25. Baharudin, A.M.; Yan, W. Long-range wireless sensor networks for geo-location tracking: Design and evaluation. In Proceedings of the 2016 International Electronics Symposium (IES), Denpasar, Indonesia, 29–30 September 2016; pp. 76–80. [Google Scholar] [CrossRef]
  26. Queralta, J.P.; Gia, T.N.; Tenhunen, H.; Westerlund, T. Edge-AI in LoRa-based Health Monitoring: Fall Detection System with Fog Computing and LSTM Recurrent Neural Networks. In Proceedings of the 2019 42nd International Conference on Telecommunications and Signal Processing (TSP), Budapest, Hungary, 1–3 July 2019; pp. 601–604. [Google Scholar] [CrossRef]
  27. Hayati, N.; Suryanegara, M. The IoT LoRa system design for tracking and monitoring patient with mental disorder. In Proceedings of the 2017 IEEE International Conference on Communication, Networks and Satellite (Comnetsat), Semarang, Indonesia, 5–7 October 2017; pp. 135–139. [Google Scholar] [CrossRef]
  28. Mdhaffar, A.; Chaari, T.; Larbi, K.; Jmaiel, M.; Freisleben, B. IoT-based health monitoring via LoRaWAN. In Proceedings of the IEEE EUROCON 2017-17th International Conference on Smart Technologies, Ohrid, Macedonia, 6–8 July 2017; pp. 519–524. [Google Scholar] [CrossRef]
  29. Barro, P.A.; Zennaro, M.; Degila, J.; Pietrosemoli, E. A Smart Cities LoRaWAN Network Based on Autonomous Base Stations (BS) for Some Countries with Limited Internet Access. Futur. Internet 2019, 11, 93. [Google Scholar] [CrossRef] [Green Version]
  30. Nunamaker, J.F., Jr.; Chen, M.; Purdin, T.D. Systems Development in Information Systems Research. J. Manag. Inf. Syst. 1990, 7, 89–106. [Google Scholar] [CrossRef]
  31. Ghulam, A. Monitoring Tropical Forest Degradation in Betampona Nature Reserve, Madagascar Using Multisource Remote Sensing Data Fusion. IEEE J. Sel. Top. Appl. Earth Obs. Remote. Sens. 2014, 7, 4960–4971. [Google Scholar] [CrossRef]
  32. Grecchi, R.C.; Beuchle, R.; Shimabukuro, Y.E.; Aragão, L.E.; Arai, E.; Simonetti, D.; Achard, F. An integrated remote sensing and GIS approach for monitoring areas affected by selective logging: A case study in northern Mato Grosso, Brazilian Amazon. Int. J. Appl. Earth Obs. Geoinform. ITC J. 2017, 61, 70–80. [Google Scholar] [CrossRef]
  33. Kalhara, P.G.; Jayasinghearachchd, V.D.; Dias, A.H.A.T.; Ratnayake, V.C.; Jayawardena, C.; Kuruwitaarachchi, N. TreeSpirit: Illegal logging detection and alerting system using audio identification over an IoT network. In Proceedings of the 2017 11th International Conference on Software, Knowledge, Information Management and Applications (SKIMA), Malabe, Sri Lanka, 6–8 December 2017; pp. 1–7. [Google Scholar] [CrossRef]
  34. Hema, L.K.; Murugan, D.; Priya, R.M. Wireless sensor network based conservation of illegal logging of forest trees. In Proceedings of the 2014 IEEE National Conference on Emerging Trends In New & Renewable Energy Sources And Energy Management (NCET NRES EM), Malabe, Sri Lanka, 6–8 December 2014; Institute of Electrical and Electronics Engineers (IEEE): Piscataway, NJ, USA, 2014; pp. 130–134. [Google Scholar]
  35. Chen, Y.-Y.; Liaw, J.-J. A novel real-time monitoring system for illegal logging events based on vibration and audio. In Proceedings of the 2017 IEEE 8th International Conference on Awareness Science and Technology (iCAST), Taichung, Taiwan, 8–10 November 2017; pp. 470–474. [Google Scholar] [CrossRef]
  36. Kocharoen, P.; Nuanloy, S.; Nantivatana, P. Designing Wireless Sensor Network for Detecting Chainsaw Noise in a Forested Watershed. In Proceedings of the 30th International Technical Conference on Circuits/Systems, Computers and Communications, Seoul, Korea, 30 June–3 July 2015; pp. 1–4. [Google Scholar]
  37. Jawad, H.M.; Nordin, R.; Gharghan, S.K.; Jawad, A.M.; Ismail, M. Energy-Efficient Wireless Sensor Networks for Precision Agriculture: A Review. Sensors 2017, 17, 1781. [Google Scholar] [CrossRef] [Green Version]
  38. Mekki, K.; Bajic, E.; Chaxel, F.; Meyer, F. A comparative study of LPWAN technologies for large-scale IoT deployment. ICT Express 2019, 5, 1–7. [Google Scholar] [CrossRef]
  39. Augustin, A.; Yi, J.; Clausen, T.; Townsley, W.M. A study of Lora: Long range & low power networks for the internet of things. Sensors 2016, 16, 1–18. [Google Scholar]
  40. Mutiara, G.A.; Suryana, N.; Mohd, O. Multiple sensor on clustering wireless sensor network to tackle illegal cutting. Int. J. Adv. Sci. Eng. Inf. Technol. 2020, 10, 164–170. [Google Scholar] [CrossRef]
Figure 1. The Standard of Wireless Communication Protocol.
Applsci 10 06992 g001
Figure 2. Architecture of the LoRaWAN.
Applsci 10 06992 g002
Figure 3. Sensor Node Architecture.
Applsci 10 06992 g003
Figure 4. The STAR Topology of the Sensor Nodes and Gateway.
Applsci 10 06992 g004
Figure 5. Architecture of LoRa Network in the Proposed System.
Applsci 10 06992 g005
Figure 6. Flowchart of the Proposed System.
Applsci 10 06992 g006
Figure 7. Flowchart of Illegal Logging Application for the User.
Applsci 10 06992 g007
Figure 8. Time Sequences of Network Protocol.
Applsci 10 06992 g008
Figure 9. Prototype of the Proposed System.
Applsci 10 06992 g009
Figure 10. Scenario testing of (a) line of sight (LoS) at soccer field; (b) non-line of sight (N-LoS) at Telkom University area; (c) N-LoS in the forest.
Applsci 10 06992 g010
Figure 11. Comparison Graph of Received Signal Strength Indicator (RSSI) Value of LoS and Non-LoS.
Applsci 10 06992 g011
Figure 12. LoS Tracking Scenario.
Applsci 10 06992 g012
Figure 13. Non-LoS Tracking Scenario at Small Forest inside Telkom University Area.
Applsci 10 06992 g013
Figure 14. Non-LoS Tracking Scenario at Suburb Forest Batu Kuda Manglayang.
Applsci 10 06992 g014
Figure 15. Web Display of Illegal Logging Tracking Application.
Applsci 10 06992 g015
Figure 16. Telegram Display of Illegal Logging Tracking Application.
Applsci 10 06992 g016
Table 1. Comparison of the LoRaWAN and Zigbee.
LoRaWANZigBee
StandardsLoRa AllianceIEEE 802.15.4
ModulationCSSDSSS, QPSK
FrequenciesISM:433 MHz, 868 MHz, 915 MHzISM: 868 MHz, 2.4 GHz
Coverage1–10 Km10–100 m
Bandwidth125 kHz, 250kHz2 MHz
Tx LimitDuty Cycle LimUnlimited
Network Size10,000 per BS65,000 per BS
Max Date Rate50kbps250kbps at 2.4 GHz
Network TopologiesSTAR of STARP2P, Tree, STAR, Mesh
PrivateYesYes
Energy ConsumptionLowLow
SecurityHighHigh
CostLowLow
Table 2. Test Result Tracking of Proposed System at LoS Location.
Gateway PositionSensor NodeGPS New LocationDirection DegreeRange (Meter)Processing Time (s)
Latitude −6.96966 Longitude 107.632TX1Lat −6.964497
Long 107.625225
135°901.135
TX2Lat −6.967792
Long 107.628669
150°423.992
TX1Lat −6.966450 Long 107.63160°370.892
TX2Lat −6.966231 Long 107.630605100°408.642
Table 3. Test Result Tracking of Proposed System at N-LoS Location (Small Forest).
Gateway PositionSensor NodeGPS New LocationDirection DegreeProcessing Time (s)Range (Meter)
Latitude −6.974782 Longitude 107.629622TX1Lat −6.970956
Long 107.630331
90°30330.36
TX2Lat −6.973246
Long 107.631489
45°25266.37
TX1Lat −6.976169 Long 107.631576305°20264.20
TX2Lat −6.972918 Long 107.626974150°34362.28
Table 4. Test Result Tracking of Proposed System at N-LoS Suburb Forest Location.
Gateway PositionSensor NodeGPS New LocationDirection DegreeProcessing Time (s)Range (Meter)
Latitude −6.8921 Longitude 107.746TX1Lat −6.893650
Long 107.744788
240°25217.87
TX2Lat −6.892294
Long 107.745598
225°550.19
TX1Lat −6.897140 Long 107.746361290°46568.24
TX2Lat −6.893373 Long 107.749961335°34454.24

