Article

Change of Direction Performance Is Influenced by Asymmetries in Jumping Ability and Hip and Trunk Strength in Elite Basketball Players

1
Faculty of Kinesiology, University of Zagreb, 10110 Zagreb, Croatia
2
Basketball Club Cedevita Olimpija Ljubljana, 1000 Ljubljana, Slovenia
3
Faculty of Health Sciences, University of Primorska, 6310 Izola, Slovenia
4
S2P, Science to Practice, Ltd., Laboratory for Motor Control and Motor Behavior, 1000 Ljubljana, Slovenia
*
Author to whom correspondence should be addressed.
Appl. Sci. 2020, 10(19), 6984; https://doi.org/10.3390/app10196984
Submission received: 8 September 2020 / Revised: 29 September 2020 / Accepted: 3 October 2020 / Published: 6 October 2020
(This article belongs to the Special Issue Sports Performance and Health)

Abstract

:
Change of direction (COD) ability is essential for sport performance in high level team sports such as basketball, however, the influence of asymmetries on COD ability is relatively unknown. Forty-three junior and senior level elite basketball players performed isometric hip and trunk strength testing, passive hip and trunk range of motion testing, and unilateral horizontal and vertical jumps, as well as the T-test to measure COD performance. Mean asymmetry values ranged from 0.76% for functional leg length up to 40.35% for rate of torque development during hip flexion. A six-variable regression model explained 48% (R2 = 0.48; p < 0.001) of variation in COD performance. The model included left hip internal/external rotation strength ratio, and inter-limb asymmetries in hip abduction rate of torque development, hip flexion range of motion, functional leg length, single leg triple jump distance, and peak torque during trunk lateral flexion. Results suggest that the magnitude of asymmetries is dependent of task and parameter, and using universal asymmetry thresholds, such as <10 %, is not optimal. The regression model showed the relationship between asymmetries and COD performance. None of tests were sufficient to explain a complex variable like COD performance.

1. Introduction

Inter-limb asymmetry has been mostly researched from the aspect of sports injury risk, especially in view of athletes returning to sport after anterior cruciate ligament reconstruction [1,2,3,4]. Only recently, the relationship between inter-limb asymmetry and sports performance has been a popular topic of investigation [5,6]. Inter-limb asymmetry is found to be a normal adaptation in many sports that involve unilateral movements (e.g., cricket) [7], but further research in team sports is needed to elucidate whether asymmetries influence performance or injury risk [5,6]. Lately researchers are trying to elucidate whether asymmetries (and which particular type of asymmetry) influence performance [8]. Inter-limb asymmetry may present at the level of different motor abilities (e.g., strength, power, and range of motion) and can be measured locally (e.g., one joint) and globally (e.g., within a complex movement, such as vertical jump). Therefore, various methods have been used for its quantification [9], however, many studies used local knee isokinetic dynamometry [10,11], isometric mid-thigh pull (IMTP) [12,13] or vertical jump tests [14,15,16,17,18]. Further, Sheppard and Young´s [19] model of change of direction (COD) determinants showed that asymmetries could negatively affect COD performance. However, supporting evidence is inconsistent.
Two studies investigated the relationship between local inter-limb knee strength asymmetry and performance in COD. Lockie et al. [10] showed mostly positive correlation between different parameters and speed of isokinetic strength asymmetries during knee flexion and extension and T-test performance (r = 0.638, 0.669, p < 0.01). Exception was one negative correlation (r = −568, p < 0.01) between peak torque during knee extension (240°/s) and T-test performance. Similarly, Coratella et al. [11] observed that the same local asymmetries negatively impact COD performance (T-test and 180° turn test) (r = 0.397–0.614, p < 0.05). As the mentioned studies measured local strength asymmetries in the knee joint, they demonstrate the need to study proximal body parts like hip and trunk.
When it comes to the relationship between global asymmetries and performance in COD, results are less consistent. Many studies, using different tests for assessing asymmetries and COD performance, did not detect a relationship between global asymmetries and COD performance. Chiang [12] investigated the relationship between peak torque asymmetry during IMTP and COD ability (assessed as 180° turn test) and reported no significant correlation. However, he used bilateral IMTP to quantify asymmetry, which may have influenced methodological validity. While this methodological shortcoming was corrected by Dos Santos et al. [13], who used unilateral IMTP test, they have not found any significant correlation between inter-limb asymmetry in various parameters related to unilateral IMTP and COD performance (r ≤ 0.35, p ≥ 0.380). Hoffman et al. [14] have not found any significant correlation between asymmetry in single-leg countermovement jump (SLCMJ) height and COD ability (three-cone drill). Although reporting high average asymmetry in jump height and length (up to 10.2%), Lockie et al. [15], have not found any significant correlation between these asymmetries and COD (505 and T-test) performance (r = 0.00–0.018, p = 0.31–0.99). Similarly, Dos Santos et al. [16] found no significant correlations between asymmetries in horizontal jumping tasks and performance in two COD tasks (r ≤ 0.35, p > 0.05). Furthermore, Fort-Vanmeerhaeghe et al. [20] have not found a relationship between asymmetry in jump height during SLCMJ and V-cut COD test (r = 0.10, p > 0.05). Finally, Loturco et al. [18], have found no significant correlation between asymmetries in different parameters during single leg vertical jumps and performance in zig-zag test.
By contrast, few studies have found a significant correlation between global asymmetry in jumping tests and COD performance. Studying female soccer players, Bishop et al. [21] found a significant positive correlation between inter-limb asymmetry in single-leg depth jump height and performance in 505 COD test on left (r = 0.66, p < 0.01) and right (r = 0.52, p < 0.05) side. Another study that reported a relationship between asymmetry and performance was of Maloney et al. [22], that explained 63% (p < 0.001) of variance of COD performance with leg stiffness and height asymmetry during vertical depth jump.
The reason for inconsistent findings could lay in discrepancies among populations, methods of asymmetry calculation, and COD tests, as well as in low asymmetry values, that are not large enough to influence performance. Taking that into consideration, Sarabon et al. [23] found that explosive strength parameters like rate of torque development (RTD) are more sensitive to detect inter-limb asymmetries compared to maximal strength outcomes like peak force or peak torque during maximal voluntary contractions (MVC), which were used in previous research. Also, local inter-limb asymmetries were assessed only for the knee joint, while proximal regions of hip and trunk were overlooked. Moreover, asymmetries in range of motion were not previously researched in relation to performance. A substantial portion of asymmetry studies was done on amateur athletes and soccer players, which does not give enough insight into the functioning of elite athletes and other team sports, such as basketball. Basketball is characterized by many high intensity changes of direction (COD) [24], indicating that COD ability plays a critical role in basketball performance.
Therefore, the aim of this study is two-fold: (a) to profile elite basketball players in different local strength and range of motion asymmetries of hip and trunk region, and global power asymmetries in horizontal and vertical jumping and (b) to quantify the relationship of those asymmetries with COD performance. We hypothesized that these asymmetries could predict COD performance.

2. Materials and Methods

2.1. Subjects

Forty-three (17 senior and 26 junior) male elite basketball players (age = 20.54 ± 6 years; height = 194.48 ± 7.19 cm; body mass = 86.77 ± 10.13 kg) from three different professional basketball clubs (Adriatic basketball association league (all three clubs); Liga Nova KBM, Slovenia (one club), and Premier Croatian basketball league (two clubs)) volunteered to participate in the study. A minimum sample size of 18 participants was determined from an a priori power analysis (G*Power 3.1, Heinrich-Heine-Universität, Düsseldorf, Germany) based upon an estimated squared multiple correlation of 0.45 and a power of 0.8 [25]. Subjects were in training program from 18 to 24 h per week, had at least one-year experience in resistance training and reported no previous (within the last 12 months) or present lower-limb injuries. All subjects provided informed consent to participate in the study. For the underage subjects their parents or guardians signed consent prior to their participation. This study was a part of TELASI–PREVENT (Body asymmetries as a risk factor in musculoskeletal injury development: studying etiological mechanisms and designing corrective interventions for primary and tertiary preventive care—L5-1845) project which was approved by Slovenian Medical Ethics committee.

2.2. Procedures

The study was conducted in February of 2019, in the middle of the 2018/2019 basketball season. Testing was performed in each of the clubs playing/training courts. All tests were performed during a single testing session lasting approximately 180 min per participant. Participants attended the sessions in larger groups and rotated between the testing sessions (see below). The subjects were instructed to refrain from any physical activity for at least 24 hours before testing. Testing started with anthropometric measurements, after which the subjects performed a warm-up (5 min of low intensity running, 8 repetitions of dynamic stretching and body weight activation exercises). After the warm-up, subjects were randomized into 4 groups to complete four testing stations in a random order: (i) jumping, (ii) COD, (iii) hip and trunk dynamometry; and (iv) hip and trunk range of motion (ROM). There was a 5-minute rest between the testing stations. Each test began after the subject reported that they felt comfortable with the task (no more than 3 practice trials were taken by a player).

2.2.1. Functional Leg Length

Functional leg length was defined as the distance between anterior-superior iliac spine (ASIS) and the ground, and was measured with laser distance meter (LD 420, Stabila, Hungary). The subjects were instructed to stand with their bare feet on the ground, heels next to the wall, with feet separated hip distance apart. During left leg measurement subjects were instructed to put their left hand on the right shoulder and vice versa. Three measurements on each leg were performed and the mean from these three repetitions was taken for further analysis.

2.2.2. Single-Leg Countermovement Jump

SLCMJ was performed on a force platform (Type 9260AA, Kistler, Winterthur, Switzerland). Subjects were informed to step on the force platform with their testing leg and hands on their hips. The opposite leg was slightly flexed at the knee, but was not touching the shin of the tested leg. Swinging with the opposite leg during jumping was not allowed. The subjects were instructed to jump as high as possible, with the countermovement depth being self-selected, land on two legs and a hold balanced position for 3 s. The jump would be accepted if all of the above-mentioned instructions were met. Three trials on left and right leg were performed with 30 s of rest between each trial. Peak force (N), peak power (W), and highest jump height (m) for each leg was taken for further analysis.

2.2.3. Single-Leg Horizontal Jump

Tape measure was used to measure Single leg horizontal jump (SLHJ), which was performed on the basketball court sufficing the standards of international basketball federation (FIBA). Subjects were informed to put their testing leg with toe at the starting line and hands on the hips. Subjects performed a countermovement to self-selected depth before pushing themselves into the horizontal jump, landing onto both legs and holding a balanced position for 3 s. Three trials on each leg were performed with 30 s of rest between each trial. The distance (m) was measured to the nearest 0.01 m with a tape measure. The longest jump from each leg was taken for further analysis.

2.2.4. Single-Leg Triple Jump

Single leg triple jump (SLTJ) was measured similarly to SLHJ. Subject performed three consecutive horizontal jumps in which they landed onto both legs and held a balanced position for 3 s. The jump would be accepted for if all of the above-mentioned instructions were met. As with the SLHJ, the longest of the three jumps was taken for further analysis for each leg.

2.2.5. Single-Leg Lateral Jump

Tape measure was used to measure Single leg lateral jump (SLLJ). Subjects were informed to put the inner (i.e., medial) edge of their feet at the starting line and hands on their hips. When a subject was ready, he performed a countermovement to self-selected depth before pushing himself into lateral jump landing onto both legs and holding a balanced position for 3 s. Three trials on left and right leg were performed with 30 s of rest between each trial. Distance (m) was measured to the nearest 0.01 m with a tape measure. Longest jump from each leg was taken for further analysis.

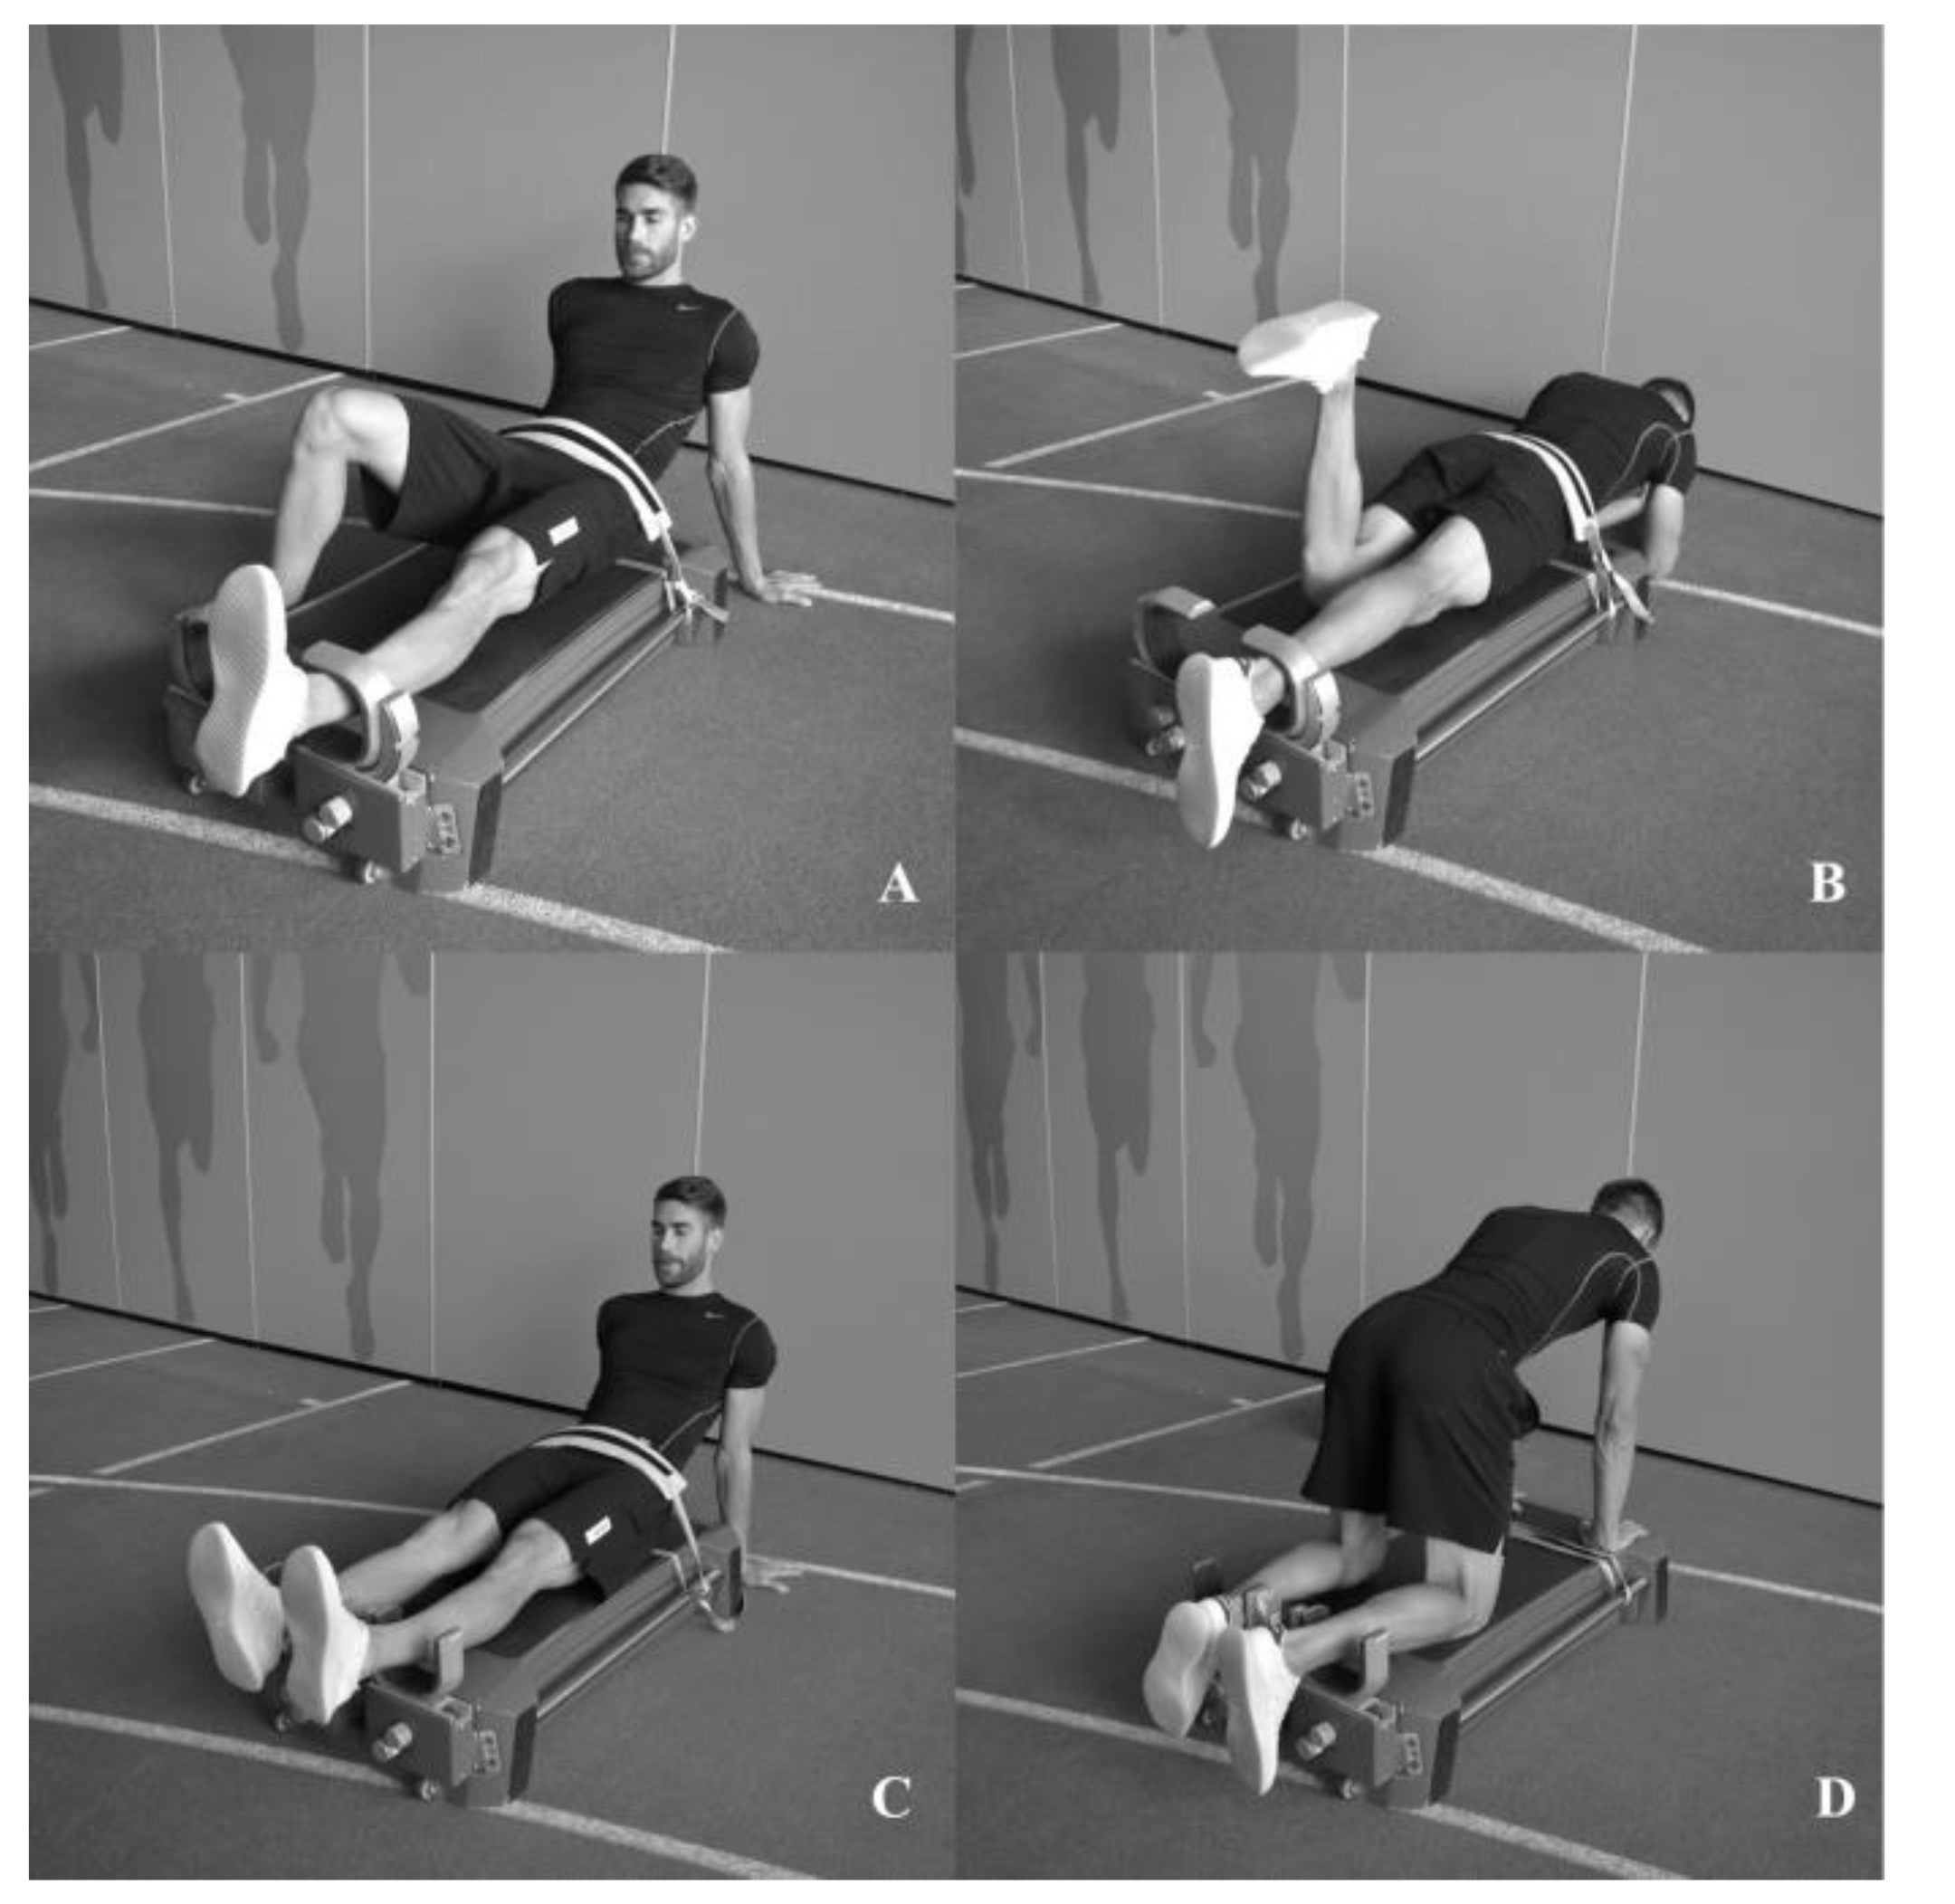
2.2.6. Trunk Strength

Trunk strength assessment was done according to Markovic et al. [26] protocol. A trunk dynamometer (S2P Ltd., Ljubljana, Slovenia) with a bending beam load cell (model 1-Z6FC3/200 kg, HBM, Darmstadt, Germany) was used to measure trunk flexion, extension, and lateral flexion isometric strength. Isometric strength was measured as peak torque (Nm/kg) of the best one second interval during maximal voluntary contraction. All of the output variables were normalized with subject’s body mass. During trunk extension measurement, subjects were standing with back turned towards the dynamometer with sensors on level of scapular spine and hands crossed on their shoulders. During trunk flexion measurement, subjects were standing turned face towards dynamometer with sensors on the same level as during extension and arms floating in the air to prevent their contribution. During trunk lateral flexion, subjects were standing sideways to the dynamometer, positioned so that their spine was in neutral position. The hand closer to the sensor was placed on their opposite shoulder and the other one was placed on opposite hip. During all trunk strength measurements, subjects were in their training shoes, standing with feet hip width distance apart, while a rigid strap was tightly fastened across pelvic girdle to achieve good fixation. During every trial subject was verbally encouraged to reach his best performance and hold it for 3–5 s. Each task was done three times with 60 s of rest in between. The best result for each task was taken for further analysis.

2.2.7. Hip Strength

Hip strength assessment was modeled based on Markovic et al. [27] protocol. A multipurpose dynamometer (Muscleboard, S2P Ltd., Ljubljana, Slovenija) was used to measure hip flexion, extension, abduction, adduction, internal and external rotation strength. Peak force values were multiplied by lever arm (leg length, in meter) to calculate hip torque. Isometric strength was measured as peak torque (PT) (Nm/kg) during one second interval of maximal voluntary contraction and rate of torque development (RTD) (Nm/ms) was measured in 100 ms interval as Δ torque/Δ time value. During all of the measurements, the offset of the sensor was performed with the relaxed leg, but with the subject having minimal contact with sensor (~5% MVC). Then, the subject was instructed to reach MVC as fast as possible. During all measured actions (except hip rotations), the distance between the mid-part of the aluminum brace of sensor and medial malleoli was set to 5 cm and a rigid strap was tightly fastened across pelvic girdle to achieve good fixation. Hip flexion and extension were measured unilaterally while the remaining tasks were performed bilaterally. During hip flexion (Figure 1A) subject was sitting on dynamometer with hands on the ground and the tested leg extended in knee with hip flexion (~30°), while the non-tested leg was on the ground with knee flexion of ~90°. During hip extension (Figure 1B) subject was laying prone on elbows on the ground, with the tested leg extended, non-tested leg was in the 90° knee flexion, resting on dynamometer surface. During abduction and adduction (Figure 1C) subject was sitting with legs hip apart, knees fully extended and hip in ~30° flexion. During hip internal and external (Figure 1D) rotation, the subject was kneeling on all fours with knees and hip in 90° flexion with knees hip apart. The best out of three results from each movement was taken for further analysis.

2.2.8. Range of Motion

Passive hip range of motion (ROM) during flexion, extension and internal/external rotation was measured with a digital inclinometer (Baseline, Fabrication Enterprises Inc., White Plains, NY, USA) and abduction/adduction with a handheld goniometer (Baseline, Fabrication Enterprises Inc., White Plains, NY, USA). All of the measurements were performed by the same measurer to minimize error. For flexion and extension, the inclinometer was aligned between the tested side femur trochanter major and lateral condyle. Hip flexion ROM was measured with the subject in supine position (the non-tested leg was extended in knee and hip fixated) and the knee of the tested leg in extended position. The tested leg was then moved and kept extended during whole movement until first pelvic movement. During hip extension ROM, subject was in prone position, and tested leg was kept in knee flexion (~90°) during whole movement until first pelvic movement. Hip internal/external rotation ROM was measured with the inclinometer located in the center of vertically positioned (with pendulum) tibia with the subject in pronated position and knee in 90° flexion. Internal and external rotation were performed until the first pelvic movement, with hand-stabilization on the pelvis. Hip abduction and adduction ROM were measured with goniometer with stationary arm pointed toward the opposite anterior superior iliac spine and the movable arm pointed toward the patella of the tested leg. During abduction, the subject was laying supine with both legs in neutral position (start) from which the tested leg was moved into abduction until first pelvic movement (finish). During adduction, the subject was supine with non-tested leg laying from table in ~30° abduction and tested leg in neutral position (start) from which leg was moved into adduction until first pelvic movement (finish). Mean result from three attempts on each leg was taken for further analysis with all of the results expressed in degrees (°).
For the trunk lateral flexion ROM, the subject was standing barefoot with feet hip width distance apart with his back and heels touching the wall. Starting position was measured with a tape as distance between the middle finger (hand on the wall) and the floor. Subjects performed lateral flexion, sliding downwards with the hands without breaking contact with the wall and lifting their heels of the ground. At the end of movement, the end position was measured, and the difference between starting and end position was calculated. Mean result from three attempts on each side was taken for further analysis with all of the results expressed in meters (m).

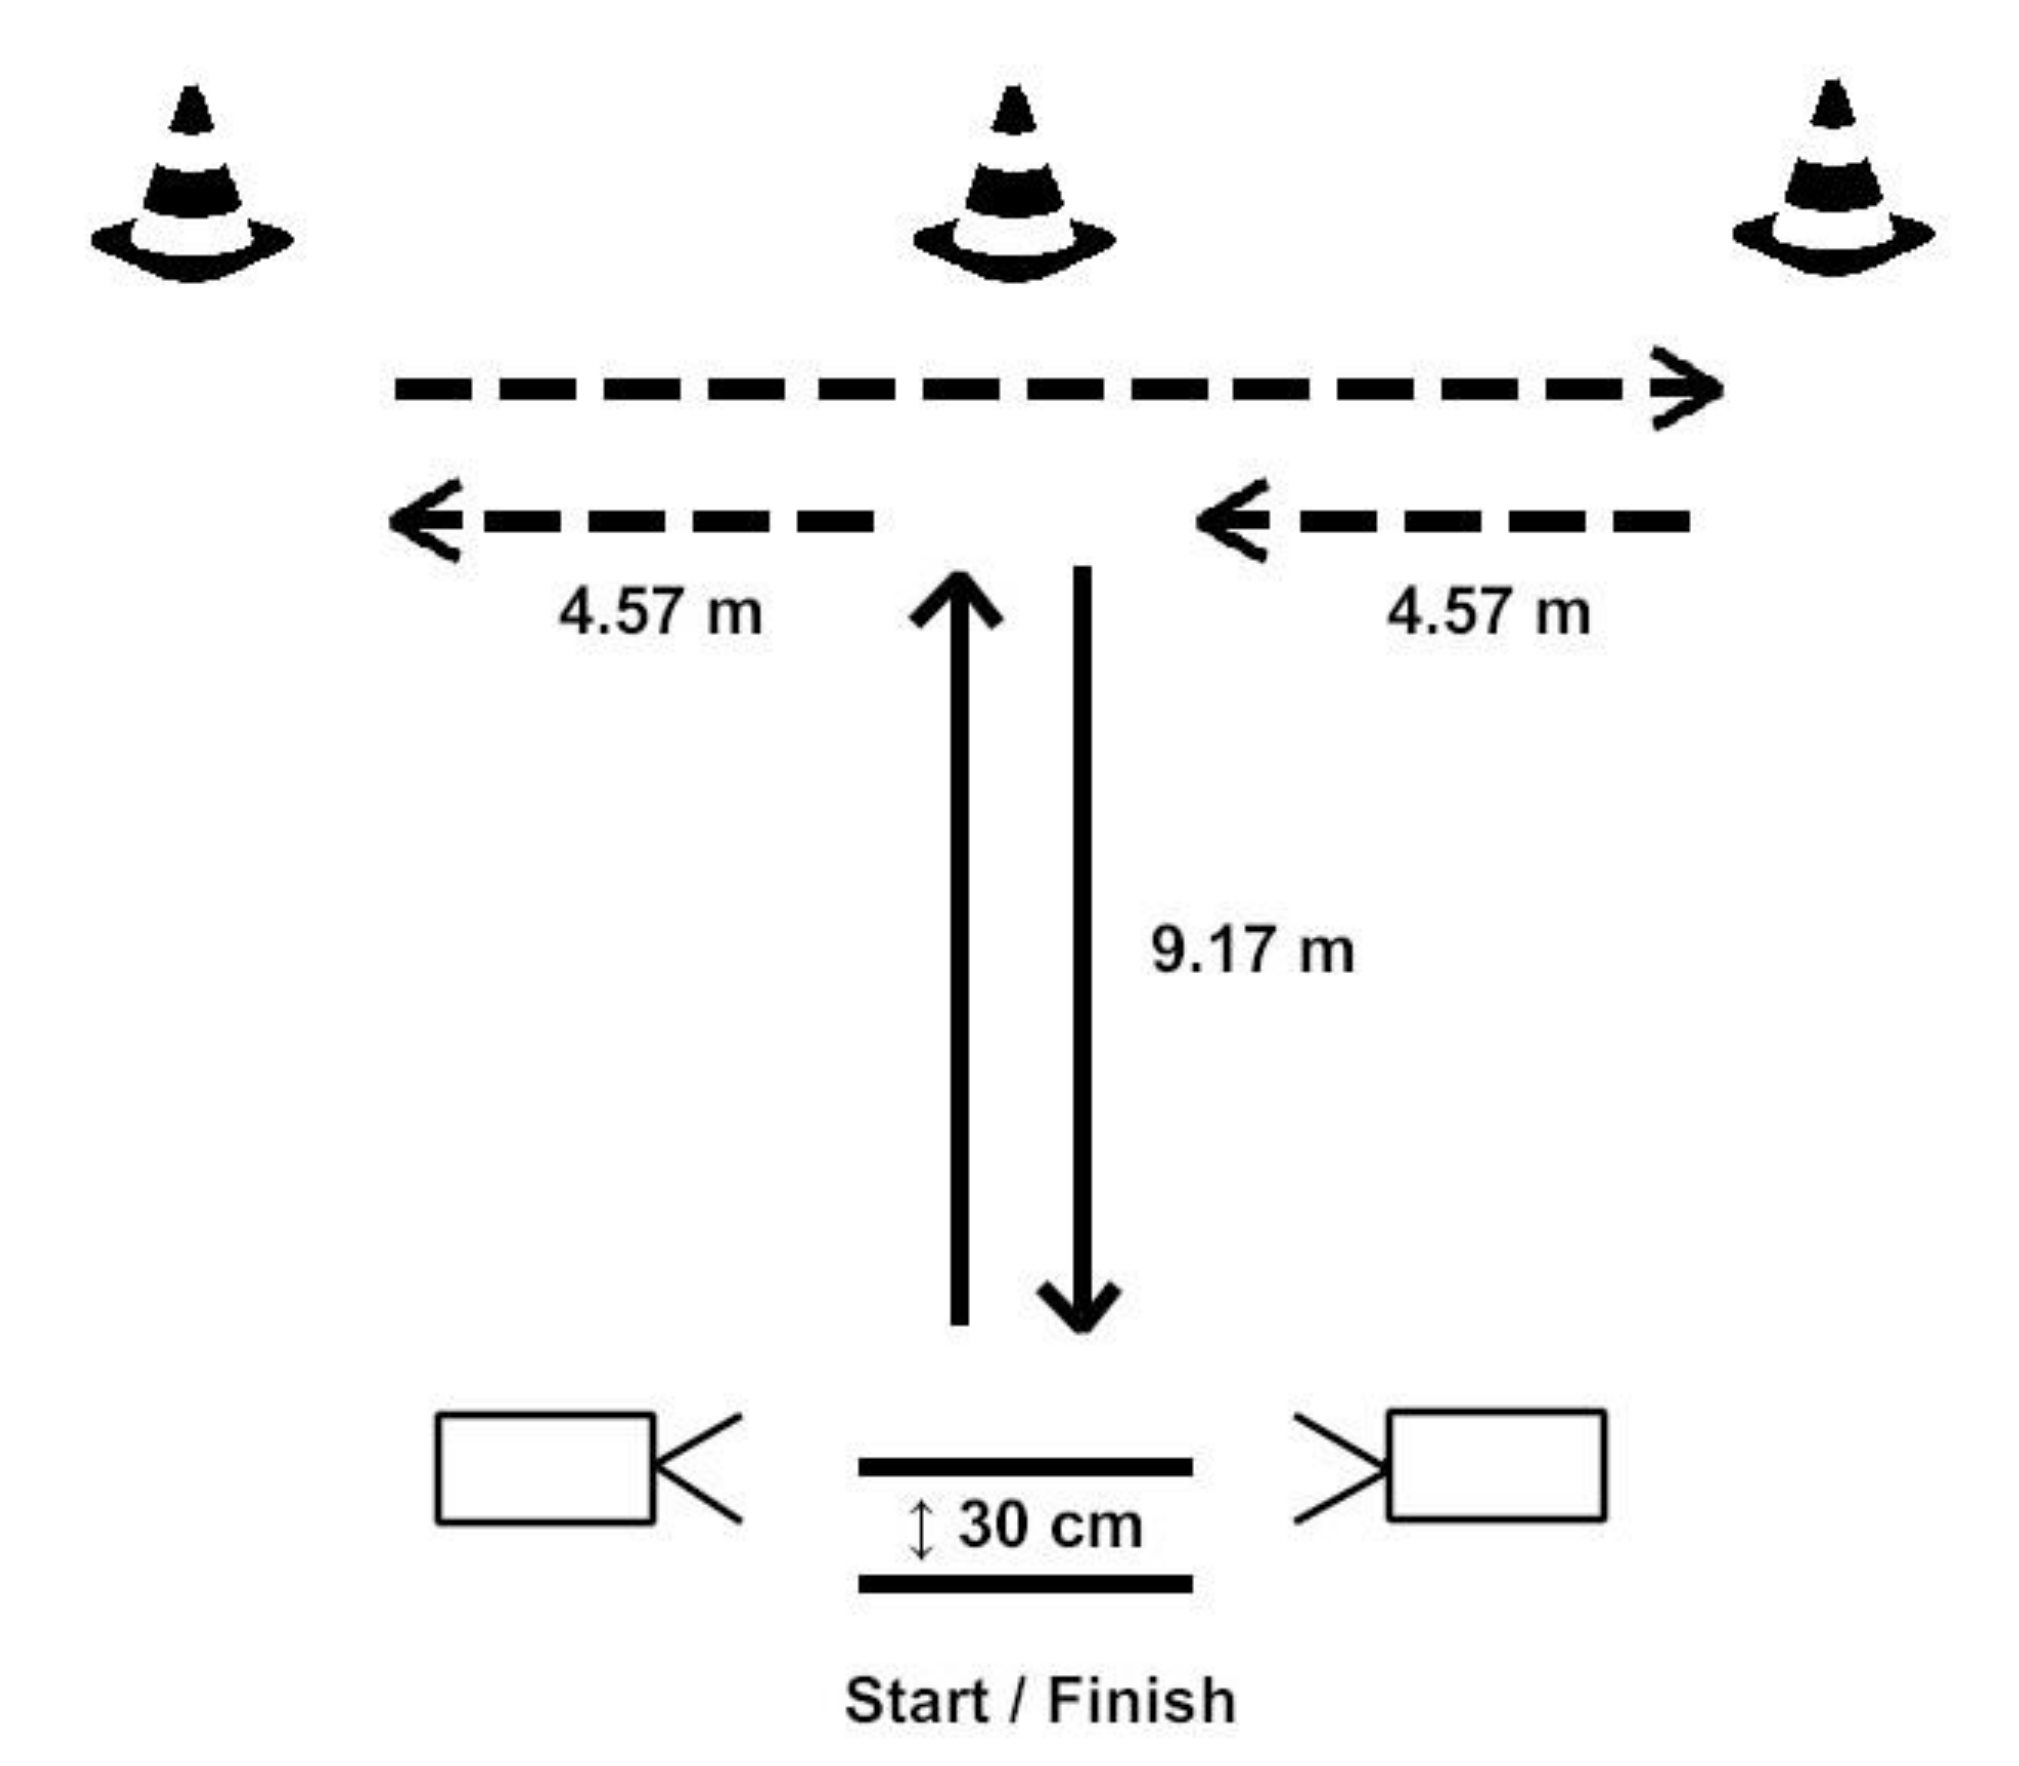
2.2.9. Change of Direction

For COD performance, the T-test (Figure 2) was used, as outlined by Semenik [28]. All of the COD testing was done on the basketball court sufficing the standards of international basketball federation (FIBA) using photocells timing gates (Brower Timing Systems; Draper, Utah). At the beginning of test, the subject was standing 30 cm behind the start/finish line where photocells were placed. Subject was instructed to sprint (filled line up in Figure 2) from the start to the first cone, touch the tip with one hand, shuffle (dashed lines in Figure 2) to the cone opposite of the touching hand and touch the tip of the lateral cone, then shuffle to the third cone and touch it with the first hand, shuffle back to the middle cone touching the tip with the second hand and then pedal back (filled line down in Figure 2) to the finish line. One-minute recovery was given between each trial. The best out of three trials was taken for further analysis.

2.3. Statistical Analyses

Due to the unknown reliability of the strength assessment with a novel MuscleBoard device (S2P Ltd., Ljubljana, Slovenia), particularly in view of RTD, we checked the intra-session reliability of the strength outcome measures that were used as potential predictors for COD performance. We used (a) intra-class coefficient correlation to assess relative reliability, (b) absolute typical error and relative typical error (expressed as coefficient of variation) to assess absolute reliability, and (c) paired-sample two-tailed T-tests to check for systematic bias. We used the data from our larger study involving 115 basketball players, who had completed the exact same protocol for strength assessment, the only difference was the lower number of repetitions (2 compared to 3 in our study) for each task. We used guidelines of Koo and Li [29] for reporting Intraclass Correlation Coefficient (ICC). Based on the 95% confident interval of ICC estimate values < 0.5 = poor, 0.5–0.75 = moderate, 0.75–0.90 = good, and > 0.90 = excellent reliability.
We used multiple regression analysis to model prediction of COD performance (dependent variable) with asymmetries (independent variable). Independent variables were grouped into five categories of asymmetries (anthropometric asymmetries, lateral hip and trunk strength asymmetries, hip and trunk strength ratios, hip and trunk ROM asymmetries and jumping asymmetries)—a total of 33 potential independent variables.
Inter-limb asymmetry was calculated with the following equation [30]:
A s y m m e t r y   % = s t r o n g e r w e a k e r s t r o n g e r × 100
Shapiro–Wilks tests were performed to assess the normality of distribution of independent variables; only 24 % (8/33) were considered to be normally distributed given an alpha level of p > 0.05. Step-wise regression analysis was performed for overall CODS performance using all independent variables. An analysis of standard residuals was carried out, which showed that the data contained no outliers (s standardized residuals minimum: −1.71, standardized residuals maximum: 2.51). A collinearity test indicated that multicollinearity was not a concern (minimum tolerance: 0.75, maximum VIF:1.33). The data met the assumption of independent errors (Durbin–Watson value: 2.26). Also, Breuch–Pagan (10.43, p > 0.05) and Koenker (8.32, p > 0.05) test indicated the homoscedasticity of the model. Statistical significance was set at alpha level of p ≤ 0.05 and all statistical procedures were conducted using the Statistical Package for the Social Sciences for Windows (v.26.0; SPSS Inc., Chicago, IL, USA). Mann–Whitney U test was used to for testing statistical significance in difference between hip PT and RTD, and left and right leg strength ratios.

3. Results

The results regarding reliability analyses are summarized in Table 1. No systematic bias was present for any of the outcome measures. Relative reliability was good to excellent for the peak torque measures (ICC > 0.80) and acceptable for RTD measures (ICC = 0.5–0.8). Typical errors, expressed as coefficient of variation were low for peak torque measurements for adduction, abduction, and internal rotation, but higher (>10%) for external rotation, flexion, and extension, and for all RTD outcomes. This suggests that the predictive strength of the parameters related to hip strength in this study can be used on the level of a sample with high confidence, while the generalizability to an individual must be done with high caution.
Inter-limb asymmetry values ranged from 0.76% for functional leg length up to 40.35% for RTD during hip flexion (Table 2). Inter-limb asymmetries of hip peak torque were lower (except for internal rotation) than the rate of torque development (3.68–11.52% vs. 10.72–40.35%, p < 0.05) (Table 3). Hip extension/flexion (1.32 ± 0.33; 1.30 ± 0.25), abduction/adduction (1.08 ± 0.19; 1.07 ± 0.20) and internal/external rotation (1.13 ± 0.27; 1.18 ± 0.26) ratios were similar (p > 0.05) for the left and right side (Table 4). Mean inter-limb asymmetry in peak torque during trunk lateral flexion exceeded the 10% threshold (12.48 ± 9.61 %). Mean inter-limb asymmetry in hip ROM (5.91–13.54%), was above the 10% threshold for extension and internal/external rotations, while the trunk lateral flexion showed good symmetry (2.01 ± 1.27%). Asymmetries in horizontal jumps showed lower results (3.48–4.60%) than various parameters of SLCMJ (4.77–11.12%).
A six-variable regression model explained 48% (R2 = 0.48; p < 0.01) of the variation in the T-test performance (Table 5). T-test time was predicted by left hip internal/external rotation strength ratio (β = −0.58; p < 0.01) and inter-limb asymmetries in hip abduction RTD (β = −0.38; p = 0.01), hip flexion ROM (β = 0.32; p = 0.03), functional leg length (β = 0.31; p = 0.02), SLTJ distance (β = 0.29; p = 0.04), and peak torque during trunk lateral flexion (β = 0.27; p = 0.05).

4. Discussion

The aims of the present study were twofold: (a) to profile elite basketball players in different local strength and range of motion asymmetries of hip and trunk region, global power asymmetries in horizontal and vertical jumping and (b) to quantify the relationship of these asymmetries with COD performance. Results showed different magnitudes of asymmetries among tests, body regions, and parameters.
Regarding the magnitude of asymmetry scores reported in this study, largest asymmetries were found in hip RTD (10.72–40.35%), which were significantly larger (except internal rotation) than peak force asymmetries of different hip action (3.68–11.52%) (as shown in Table 2). Compared to local peak torque asymmetries, rate of torque development showed to be a more sensitive parameter for assessment of asymmetries. That is in accordance with findings of Sarabon et al. [23], who reported that the RTD showed larger magnitudes of asymmetries than peak torque during unilateral isometric knee flexion and extension.
To our knowledge, only one study profiled hip strength ratios in professional athletes using fixed point dynamometer [31]. Although study was done on Australian football players, it detected similar results in flexion/extension mean ratio (0.8) as our study (1.3). Moreover, their mean internal/external ratio was 1.15 which is in accordance to our values (1.13 and 1.18 for left and right leg).
They observed a hip adductor/abductor ratio of 1.05 which is much different from our abduction/adduction ratios (1.08 and 1.07), such differences can be attributed to sport specificity of ball kicking in Australian football.
Our results are also showing various magnitudes in hip range of motion asymmetries (5.91–13.54%), with largest being found for extension (12.80 ± 10.95%), internal rotation (13.54 ± 10.57%), and external rotation (13.00 ± 14.10%). Although some research indicates that there are significant differences in hip ROM between the dominant and non-dominant leg in football players [32], a direct comparison of results is limited because authors have not reported asymmetry indexes.
Mean asymmetry in functional leg length was 0.76 ± 0.62%. To our knowledge, studies that assessed asymmetries in anthropometry had not used the functional leg length to investigate the relationship with performance instead, they had utilized other anthropometric measurements, such as knee and ankle joint width [33] or lean mass asymmetry [34]. Although, there is no past research to compare our results with, a review of Knutson et al. [35] set a threshold of normal functional leg length discrepancy at 2 cm. The mean absolute asymmetry in our study was 0.9 cm, which is thus considered as normal leg length variation.
Inter-limb asymmetries in vertical jumping parameters (4.77–11.12%) showed larger values compared to horizontal jumps (3.48–4.60%), which is in accordance with research conducted by Lockie et al. [15], who reported SLCMJ mean inter-limb asymmetries at 10.4 % and only 5.4% and 3.3% for horizontal jumps (SLHJ and SLLJ). Similar results were reported by Bishop et al. [36] who found larger inter-limb asymmetries in SLCMJ (12.5%) compared to SLHJ (6.8%). Both of these studies were conducted on football players, which indicates that the variability between the testing methods might be substantially higher than the variability between the athletic populations. With that in mind, it can be suggested that vertical jumping is more sensitive for detecting asymmetries than horizontal jumping.
While all of our maximal strength measures showed an excellent reliability (displayed in Table 1), the explosive strength (rate of torque development) were only moderately reliable. As the structured strength and conditioning training as well as the experience level contribute to reliability of data [37], our data can be interpreted with confidence. In the past years, there has been a lot of debate about defining normal asymmetry threshold, most common one being 10%, but different authors suggested values from 5% to 20% [6]. Taking all that into consideration, variability of asymmetry results in our data shows that asymmetry magnitude is dependent on the specific movement, test and parameter which indicates that a unifying asymmetry threshold cannot be established.
Regression analysis revealed a relationship between asymmetries and performance: six variable model explained 49% of T-test performance variance. Independent variable Beta scores (0.27–0.58) show a small to medium individual relationship between different type of asymmetry and COD performance. Although several studies (including the present study) observed negative influence of asymmetries on COD performance, a number of studies identified contradicting evidence. Lockie et al. [10] showed negative influence (r = 0.638, 0.669, p < 0.01) of isokinetic concentric (60°/s, 180°/s, 240°/s) and eccentric (30°/s) knee strength asymmetries and COD performance (assessed with T-test). The study of Coratella et al. [11] reported similar results of association between knee strength asymmetries in slow (30°/s) and fast (300°/s) contractions and COD performance (T-test and 180° turn test). On the other hand, the relationship between COD performance (180° turn test) and strength asymmetries tested with the whole kinetic chain movements (e.g., IMTP) has not been detected [12,13]. This observation could be explained by local strength asymmetries show higher magnitudes. Negative influence of asymmetry in vertical drop jump height and COD performance (180° turn test) (r = 0.66, p < 0.01 and 0.52, p < 0.05; depending on the side of the turn) was found by Bishop et al. [21]. Also, using horizontal jumps to assess asymmetries, Madruga-Parera et al. [38] found much lower correlations (r = 0.32 and 0.31, p <0.05) between asymmetry in horizontal jumping length (SLLJ) and COD performance (V-cut and 180° turn test). Such a relationship was not found by Lockie et al. [15], who did not observe significant correlations between asymmetry in vertical (SLCMJ height) and horizontal (SLHJ and SLLJ distance) jumping and COD performance (T-test and 180° turn test). Similarly, Loturco et al. [18] suggested that asymmetry in various parameters during single-leg squat jump and CMJ do not influence COD performance (zig-zag test). The study conducted by Maloney et al. [22] is probably the most comparable to ours, it showed that stiffness and asymmetry in single-leg drop jump explained 63% variance of COD performance (2 × 90°cut test). However, they used just one type of asymmetry as the secondary predictor, while the stiffness during drop jump was main predictor in the model.
Our model consists of several independent variables, each representing a different type of asymmetry and together showing a significant relationship with COD performance. This is important because findings indicated an independent nature of asymmetry [39]. The most important finding of this study is the connection between asymmetry and COD performance, but also that testing large variety of asymmetry types is needed to gain a more complete understanding of athlete asymmetry and its relationship to performance.
Certain limitations of this study should be noted. The main limitation is the modest reliability of hip explosive strength measure, however, we find this acceptable as RTD is a highly variable parameter. Moreover, a slightly larger sample size would have been useful in the linear regression analyses, as the best model included a relatively large number of predictor variables.

5. Conclusions

This study was conducted to explore asymmetries in local strength, vertical jumping and ROM, and to investigate whether these asymmetries are related to COD performance in healthy elite-basketball players. A substantial variability among asymmetries in different tests was noted. This implies that coaches and physiotherapists should not rely exclusively on the <10 % threshold when they are deciding on the athletes return to play, or planning interventions for reducing asymmetries. In particular, it is expected for RTD asymmetries to be larger than maximal strength (i.e., peak torque) asymmetries. In the attempt to elucidate which asymmetries are more relevant for performance, specifically to the COD ability, we performed linear regressions which showed more than one type of asymmetry is should be considered in the analyses to sufficiently explain the COD performance. Notably, the best model for predicting COD performance included both maximal strength and RTD asymmetry, both hip and trunk asymmetry, one vertical jump asymmetry, one ROM asymmetry, as well as asymmetry in functional leg length. Therefore, interventions should likely target multiple types of asymmetries when trying to improve COD performance. We encourage practitioners to use a wide testing battery to test different aspects on local and global level of the body to obtain a clearer picture of athletes’ asymmetries.

Author Contributions

Conceptualization, F.U. and N.Š.; Data curation, F.U.; Formal analysis, F.U.; Funding acquisition, N.Š.; Investigation, F.U.; Methodology, N.Š.; Project administration, N.Š.; Resources, N.Š.; Software, N.Š.; Supervision, N.Š.; Validation, F.U. and N.Š.; Writing—original draft, F.U. All authors have read and agreed to the published version of the manuscript.

Funding

The study was supported by the Slovenian Research Agency through the project TELASI-PREVENT [L5-1845] (Body asymmetries as a risk factor in musculoskeletal injury development: studying etiological mechanisms and designing corrective interventions for primary and tertiary preventive care).

Acknowledgments

The authors would like to thank the athletes and management from the basketball clubs participating in this study. Additionally, many thanks to the research assistants who helped at testing.

Conflicts of Interest

The authors declare no conflict of interest. The funders had no role in the design of the study; in the collection, analyses, or interpretation of data; in the writing of the manuscript; or in the decision to publish the results.

References

  1. Bates, N.A.; Ford, K.R.; Myer, G.D.; Hewett, T.E. Impact differences in ground reaction force and center of mass between the first and second landing phases of a drop vertical jump and their implications for injury risk assessment. J. Biomech. 2013, 46, 1237–1241. [Google Scholar] [CrossRef] [Green Version]
  2. Zwolski, C.; Thomas, S.; Schmitt, L.C.; Hewett, T.E.; Paterno, M.V. The Utility of Limb Symmetry Indices in Return-to-Sport Assessment in Patients With Bilateral Anterior Cruciate Ligament Reconstruction. Am. J. Sports Med. 2016, 44, 2030–2038. [Google Scholar] [CrossRef]
  3. Mayer, S.W.; Queen, R.; Taylor, D.; Moorman, I.C.T.; Toth, A.P.; Garrett, J.W.E.; Butler, R. Functional Testing Differences in Anterior Cruciate Ligament Reconstruction Patients Released Versus Not Released to Return to Sport. Am. J. Sports Med. 2015, 43, 1648–1655. [Google Scholar] [CrossRef]
  4. Paterno, M.V.; Ford, K.R.; Myer, G.D.; Heyl, R.; E Hewett, T. Limb Asymmetries in Landing and Jumping 2 Years Following Anterior Cruciate Ligament Reconstruction. Clin. J. Sport Med. 2007, 17, 258–262. [Google Scholar] [CrossRef] [PubMed]
  5. Bishop, C.; Turner, A.; Read, P. Effects of inter-limb asymmetries on physical and sports performance: A systematic review. J. Sports Sci. 2017, 36, 1135–10144. [Google Scholar] [CrossRef] [PubMed]
  6. McGrath, T.M.; Waddington, G.; Scarvell, J.M.; Ball, N.; Creer, R.; Woods, K.; Smith, D. The effect of limb dominance on lower limb functional performance – a systematic review. J. Sports Sci. 2015, 34, 289–302. [Google Scholar] [CrossRef] [PubMed]
  7. Engstrom, C.M.; Walker, D.G.; Kippers, V.; Mehnert, A. Quadratus Lumborum Asymmetry and L4 Pars Injury in Fast Bowlers. Med. Sci. Sports Exerc. 2007, 39, 910–917. [Google Scholar] [CrossRef] [PubMed]
  8. Bishop, C.; Read, P.; Bromley, T.; Brazier, J.; Jarvis, P.; Chavda, S.; Turner, A. The Association Between Interlimb Asymmetry and Athletic Performance Tasks. J. Strength Cond. Res. 2020. [Google Scholar] [CrossRef]
  9. Bishop, C.; Read, P.; Chavda, S.; Turner, A. Asymmetries of the Lower Limb. Strength Cond. J. 2016, 38, 27–32. [Google Scholar] [CrossRef] [Green Version]
  10. Lockie, R.G.; Schultz, A.B.; Jeffriess, M.D.; Callaghan, S.J. The relationship between bilateral differences of knee flexor and extensor isokinetic strength and multi-directional speed. Isokinet. Exerc. Sci. 2012, 20, 211–219. [Google Scholar] [CrossRef]
  11. Coratella, G.; Beato, M.; Schena, F. Correlation between quadriceps and hamstrings inter-limb strength asymmetry with change of direction and sprint in U21 elite soccer-players. Hum. Mov. Sci. 2018, 59, 81–87. [Google Scholar] [CrossRef] [PubMed]
  12. Chiang, C.-Y. Lower Body Strength and Power Characteristics Influencing Change of Direction and Straight-Line Sprinting Performance in Division I Soccer Players: An Exploratory Study. Ph.D. Thesis, East Tennessee State University, Johnson City, TN USA, July 2014. [Google Scholar]
  13. Dos’Santos, T.; Thomas, C.; Jones, P.A.; Comfort, P. Asymmetries in Isometric Force-Time Characteristics Are Not Detrimental to Change of Direction Speed. J. Strength Cond. Res. 2018, 32, 520–527. [Google Scholar] [CrossRef] [PubMed]
  14. Hoffman, J.R.; Ratamess, N.A.; Klatt, M.; Faigenbaum, A.D.; Kang, J. Do Bilateral Power Deficits Influence Direction-Specific Movement Patterns? Sport. Med. 2007, 15(2), 125–132. [Google Scholar] [CrossRef] [PubMed]
  15. Lockie, R.G.; Callaghan, S.J.; Berry, S.P.; Cooke, E.R.A.; Jordan, C.A.; Luczo, T.M.; Jeffriess, M.D. Relationship Between Unilateral Jumping Ability and Asymmetry on Multidirectional Speed in Team-Sport Athletes. J. Strength Cond. Res. 2014, 28, 3557–3566. [Google Scholar] [CrossRef] [PubMed] [Green Version]
  16. Dos’Santos, T.; Thomas, C.; Jones, P.A.; Comfort, P. Asymmetries in single and triple hop are not detrimental to change of direction speed. J. Trainology 2017, 6, 35–41. [Google Scholar] [CrossRef] [Green Version]
  17. Fort-Vanmeerhaeghe, A.; Montalvo, A.; Sitjà-Rabert, M.; Kiefer, A.W.; Myer, G.D.; Fort-Vanmeerhaeghe, A. Neuromuscular asymmetries in the lower limbs of elite female youth basketball players and the application of the skillful limb model of comparison. Phys. Ther. Sport 2015, 16, 317–323. [Google Scholar] [CrossRef]
  18. Loturco, I.; Pereira, L.A.; Kobal, R.; Abad, C.C.C.; Rosseti, M.; Carpes, F.P.; Bishop, C. Do Asymmetry Scores Influence Speed and Power Performance in Elite Female Soccer Players? Biol. Sport 2019, 36, 209–216. [Google Scholar] [CrossRef]
  19. Sheppard, J.M.; Young, W.B. Agility literature review: Classifications, training and testing. J. Sports Sci. 2006, 24, 919–932. [Google Scholar] [CrossRef] [Green Version]
  20. Fort-Vanmeerhaeghe, A.; Bishop, C.; Buscà, B.; Aguilera-Castells, J.; Vicens-Bordas, J.; Gonzalo-Skok, O. Inter-limb asymmetries are associated with decrements in physical performance in youth elite team sports athletes. PLoS ONE 2020, 15, e0229440. [Google Scholar] [CrossRef] [Green Version]
  21. Bishop, C.; Turner, A.; Maloney, S.J.; Lake, J.P.; LoTurco, I.; Bromley, T.; Read, P. Drop Jump Asymmetry is Associated with Reduced Sprint and Change-of-Direction Speed Performance in Adult Female Soccer Players. Sports 2019, 7, 29. [Google Scholar] [CrossRef] [Green Version]
  22. Maloney, S.J.; Richards, J.; Nixon, D.G.D.; Harvey, L.J.; Fletcher, I.M. Do stiffness and asymmetries predict change of direction performance? Sports Sci. 2017, 35, 547–556. [Google Scholar] [CrossRef] [PubMed] [Green Version]
  23. Sarabon, N.; Kozinc, Z.; Bishop, C.; Maffiuletti, N.A. Factors influencing bilateral deficit and inter-limb asymmetry of maximal and explosive strength: Motor task, outcome measure and muscle group. Graefe’s Arch. Clin. Exp. Ophthalmol. 2020, 120, 1681–1688. [Google Scholar] [CrossRef] [PubMed]
  24. Ben Abdelkrim, N.; Castagna, C.; Jabri, I.; Battikh, T.; El Fazaa, S.; El Ati, J. Activity Profile and Physiological Requirements of Junior Elite Basketball Players in Relation to Aerobic-Anaerobic Fitness. J. Strength Cond. Res. 2010, 24, 2330–2342. [Google Scholar] [CrossRef] [PubMed]
  25. Beck, T.W. The Importance of A Priori Sample Size Estimation in Strength and Conditioning Research. J. Strength Cond. Res. 2013, 27, 2323–2337. [Google Scholar] [CrossRef] [PubMed]
  26. Markovic, G.; Šarabon, N.; Greblo, Z.; Križanić, V. Effects of feedback-based balance and core resistance training vs. Pilates training on balance and muscle function in older women: A randomized-controlled trial. Arch. Gerontol. Geriatr. 2015, 61, 117–123. [Google Scholar] [CrossRef]
  27. Markovic, G.; Šarabon, N.; Pausic, J.; Hadžić, V. Adductor Muscles Strength and Strength Asymmetry as Risk Factors for Groin Injuries among Professional Soccer Players: A Prospective Study. Int. J. Environ. Res. Public Health 2020, 17, 4946. [Google Scholar] [CrossRef]
  28. Semenick, D. The T-Test. NSCA J. 1990, 12, 36–37. [Google Scholar]
  29. Koo, T.K.; Li, M.Y. A Guideline of Selecting and Reporting Intraclass Correlation Coefficients for Reliability Research. J. Chiropr. Med. 2016, 15, 155–163. [Google Scholar] [CrossRef] [Green Version]
  30. Bishop, C.; Read, P.; Lake, J.P.; Chavda, S.; Turner, A. Inter-Limb Asymmetries. Strength Cond. J. 2018, 40, 1. [Google Scholar] [CrossRef] [Green Version]
  31. Althorpe, T.; Beales, D.; Skinner, A.; Caputi, N.; Mullings, G.; Stockden, M.; Boyle, J. Isometric hip strength and strength ratios in elite adolescent and senior Australian Rules Football players: An initial exploration using fixed-point dynamometry. J. Sci. Med. Sport 2018, 21, S81. [Google Scholar] [CrossRef]
  32. Oliveira, A.; Barbieri, F.A.; Goncalves, M. Flexibility, torque and kick performance in soccer: Effect of dominance. Sci. Sports 2013, 28, e67–e70. [Google Scholar] [CrossRef]
  33. Trivers, R.; Palestis, B.G.; Manning, J.T. The Symmetry of Children’s Knees Is Linked to Their Adult Sprinting Speed and Their Willingness to Sprint in a Long-Term Jamaican Study. PLoS ONE 2013, 8, e72244. [Google Scholar] [CrossRef] [PubMed]
  34. Bell, D.R.; Sanfilippo, J.L.; Binkley, N.; Heiderscheit, B.C. Lean Mass Asymmetry Influences Force and Power Asymmetry During Jumping in Collegiate Athletes. J. Strength Cond. Res. 2014, 28, 884–891. [Google Scholar] [CrossRef] [PubMed] [Green Version]
  35. Knutson, G.A. Anatomic and functional leg-length inequality: A review and recommendation for clinical decision-making. Part I, anatomic leg-length inequality: Prevalence, magnitude, effects and clinical significance. Chiropr. Osteopat. 2005, 13, 11. [Google Scholar] [CrossRef] [Green Version]
  36. Bishop, C.; Read, P.; McCubbine, J.; Turner, A. Vertical and Horizontal Asymmetries are Related to Slower Sprinting and Jump Performance in Elite Youth Female Soccer Players. J. Strength Cond. Res. 2018. Available online: http://eprints.mdx.ac.uk/23569/ (accessed on 23 September 2020). [CrossRef] [Green Version]
  37. Bishop, C.; Berney, J.; Lake, J.; LoTurco, I.; Blagrove, R.; Turner, A.; Read, P. Bilateral Deficit During Jumping Tasks. J. Strength Cond. Res. 2019. Available online: http://eprints.chi.ac.uk/id/eprint/4183/ (accessed on 23 September 2020). [CrossRef]
  38. Madruga-Parera, M.; Bishop, C.; Read, P.; Lake, J.; Brazier, J.; Romero-Rodriguez, D. Jumping-based Asymmetries are Negatively Associated with Jump, Change of Direction, and Repeated Sprint Performance, but not Linear Speed, in Adolescent Handball Athletes. J. Hum. Kinet. 2020, 71, 47–58. [Google Scholar] [CrossRef] [Green Version]
  39. Raya-González, J.; Bishop, C.; Gómez-Piqueras, P.; Veiga, S.; Viejo-Romero, D.; Navandar, A. Strength, Jumping, and Change of Direction Speed Asymmetries Are Not Associated With Athletic Performance in Elite Academy Soccer Players. Front. Psychol. 2020, 11, 1. [Google Scholar] [CrossRef] [Green Version]
Figure 1. Position of subjects during isometric hip strength testing. (A) flexion; (B) extension; (C) abduction/adduction; and (D) internal/external rotation.
Applsci 10 06984 g001
Figure 2. Schematic representation of the T-test.
Applsci 10 06984 g002
Table 1. Reliability results for outcome measures.
Outcome/TaskRepetition 1Repetition 2Systematic BiasRelative ReliabilityAbsolute Reliability
MeanSDMeanSDTPICC95% CI for ICCTECV95% CI for CV
Peak torques at the hip (Nm)Hip Abduction—Left73.118.872.919.80.9080.3650.970.960.983.44.654.594.74
Hip Abduction—Right71.918.671.519.41.3840.1680.970.960.983.34.544.494.63
Hip Adduction—Left70.419.571.219.7−1.6950.0920.930.910.955.07.096.907.43
Hip Adduction—Right69.019.169.819.3−1.4350.1530.930.910.955.07.166.967.50
Hip Internal rotation—Left73.121.772.620.70.6170.5380.920.890.945.98.067.828.51
Hip Internal rotation—Right74.820.974.619.9−0.5920.5550.930.900.955.47.267.067.63
Hip External rotation—Left62.532.264.516.80.1720.8720.850.800.8810.216.0615.0717.69
Hip External rotation—Right63.816.663.716.3−0.2630.7930.860.810.9011.517.9917.0119.83
Hip Flexion—Left139.845.9138.839.8−0.5540.7120.940.910.9620.614.7714.3315.53
Hip Flexion—Right146.142.7146.842.7−0.1140.9090.960.940.9718.212.4112.1912.79
Hip Extension—Left163.371.5160.955.21.1950.2340.840.780.8827.817.1315.9919.30
Hip Extension—Right169.453.0169.450.6−0.7210.4720.910.870.9316.69.839.4510.51
Peak force at the trunk (N)Trunk extension534.5199.2560.3190.7−3.5060.0010.880.830.9165.311.829.6413.32
Trunk flexion415.5144.2431.0144.9−4.1060.0000.940.910.9633.57.915.429.11
Trunk lat. flexion—Left395.4121.2393.9125.30.1140.9100.880.840.9151.813.110.0215.89
Trunk lat. flexion—Right395.3129.8405.5129.8−2.4740.0140.920.880.9436.89.227.8811.76
Hip RTD (Nm/s)Hip Abduction—Left268.2138.9278.8145.1−0.8360.4040.500.370.61102.637.5227.6162.50
Hip Abduction—Right257.0132.8269.2136.1−1.2660.2080.510.380.6294.435.8926.8358.25
Hip Adduction—Left285.9157.2299.2170.8−1.3750.1710.610.500.71101.434.6728.1649.22
Hip Adduction—Right276.6157.7285.4163.4−1.1670.2450.620.510.7197.134.5528.1948.71
Hip Internal rotation—Left209.1117.3219.7121.8−1.4410.1520.620.510.7172.833.9528.0347.11
Hip Internal rotation—Right215.9119.5221.0119.6−0.7840.4340.560.430.6679.236.2428.2854.91
Hip External rotation—Left244.5257.8229.8123.71.1120.2640.720.610.7977.732.7827.7842.33
Hip External rotation—Right236.9129.1225.3122.11.4250.1560.690.600.7679.634.4629.8644.02
Hip Flexion—Left418.9283.9427.7289.9−0.7990.4260.580.450.69193.545.7035.3869.83
Hip Flexion—Right444.1290.6446.4283.10.3430.7320.670.560.76170.038.1831.9051.54
Hip Extension—Left460.3321.9487.9289.1−1.4210.1580.530.400.64207.043.6733.1069.40
Hip Extension—Right534.9303.3518.1313.40.2710.7860.630.510.72191.436.3429.7051.05
SD—standard deviation; t—T-test statistics; p—statistical significance; CI—confidence interval; TE—typical error; CV—coefficient of variation; RTD—rate of torque development
Table 2. Descriptive and normality analysis of asymmetry variables.
Asymmetry (%)MeanSDS-W
Functional leg length0.760.620.002
Single-leg Countermovement Jump— height11.128.360.005
Single-leg Countermovement Jump— PF4.774.400.000
Single-leg Countermovement Jump—PP7.065.980.001
Single-leg Horizontal Jump—distance4.603.190.051
Single-leg Lateral Jump—distance4.823.700.001
Single-leg Triple Jump—distance3.482.670.005
Hip Abduction—PT3.683.150.001
Hip Abduction—RTD11.239.670.000
Hip Adduction—PT5.594.770.001
Hip Adduction—RTD10.7210.340.000
Hip External Rotation—PT7.905.820.000
Hip External Rotation—RTD13.188.830.000
Hip Internal Rotation—PT11.527.170.150
Hip Internal Rotation—RTD13.179.550.020
Hip Extension—PT11.018.920.000
Hip Extension—RTD30.5621.790.031
Hip Flexion—PT9.868.360.000
Hip Flexion—RTD40.3520.420.619
Trunk Lateral Flexion—PT12.819.610.013
Trunk Lateral Flexion—ROM8.985.940.054
Hip Abduction—ROM8.945.720.165
Hip Adduction—ROM8.836.730.002
Hip Flexion—ROM5.916.240.000
Hip Extension—ROM12.8010.950.000
Hip External Rotation—ROM 13.0014.100.000
Hip Internal Rotation—ROM 13.5410.570.002
Hip extension/flexion strength ratio (left leg)1.320.330.183
Hip extension/flexion strength ratio (right leg)1.300.250.011
Hip abduction/adduction strength ratio (left leg)1.080.190.048
Hip abduction/adduction strength ratio (right leg)1.070.200.010
Hip internal/external rotation strength ratio (left leg)1.130.270.266
Hip internal/external rotation ratio (right leg)1.180.260.279
Trunk extension/flexion strength ratio1.270.270.331
T-test9.100.500.013
SD = standard deviation, S-W = Shapiro–Wilks tests, PF = peak force, PP = peak power, RTD = rate of torque development, ROM = range of motion.
Table 3. Peak torque and Rate of torque development differences (Mann–Whitney U test).
Asymmetry (%)PT Mean ± SDRTD Mean ± SD p-Value Effect Size
Hip abduction3.68 ± 3.1511.23 ± 9.670.0000.56
Hip adduction5.59 ± 4.7710.72 ± 10.340.0020.23
Hip external rotation7.90 ± 5.8213.18 ± 8.830.0010.27
Hip internal rotation11.52 ± 7.1713.17 ± 9.550.5140.01
Hip extension11.01 ± 8.9230.56 ± 21.790.0000.38
Hip flexion9.86 ± 8.3640.35 ± 20.420.0001.00
PT = peak torque, RTD = rate of torque development; SD = standard deviation.
Table 4. Hip strength ratio differences between left and right leg (Mann–Whitney U test).
Hip Strength RatioLeft Leg Mean ± SDRight Leg Mean ± SDp-ValueEffect Size
Extension/Flexion1.32 ± 0.331.30 ± 0.250.7790.00
Abduction/Adduction1.08 ± 0.191.07 ± 0.200.8260.00
Internal/External Rotation1.13 ± 0.271.18 ± 0.260.2180.03
SD = standard deviation
Table 5. Final regression model with six independent variables (dependent T-test).
Depended VariableIndependent VariableBBetaR2p-Value
T-test (s)---0.48<0.001
-Left hip internal/external rotation strength ratio−1.08−0.58-0.00
-Asymmetry in hip abduction RTD (%)−0.02−0.38-0.01
-Asymmetry in hip flexion ROM (%)0.030.32-0.03
-Asymmetry in functional leg length (%)0.250.31-0.02
-Asymmetry in SLTJ (%)0.060.29-0.04
-Asymmetry in peak force during trunk lateral flexion (%)0.010.27-0.05
RTD—rate of torque development; ROM—range of motion; SLTJ—single-leg triple jump.

