Design of Experiment in the Milling Process of Aluminum Alloys in the Aerospace Industry

 ,
,  ,
,  ,
, 


Abstract
1. State of the Art
2. Experimental Procedure
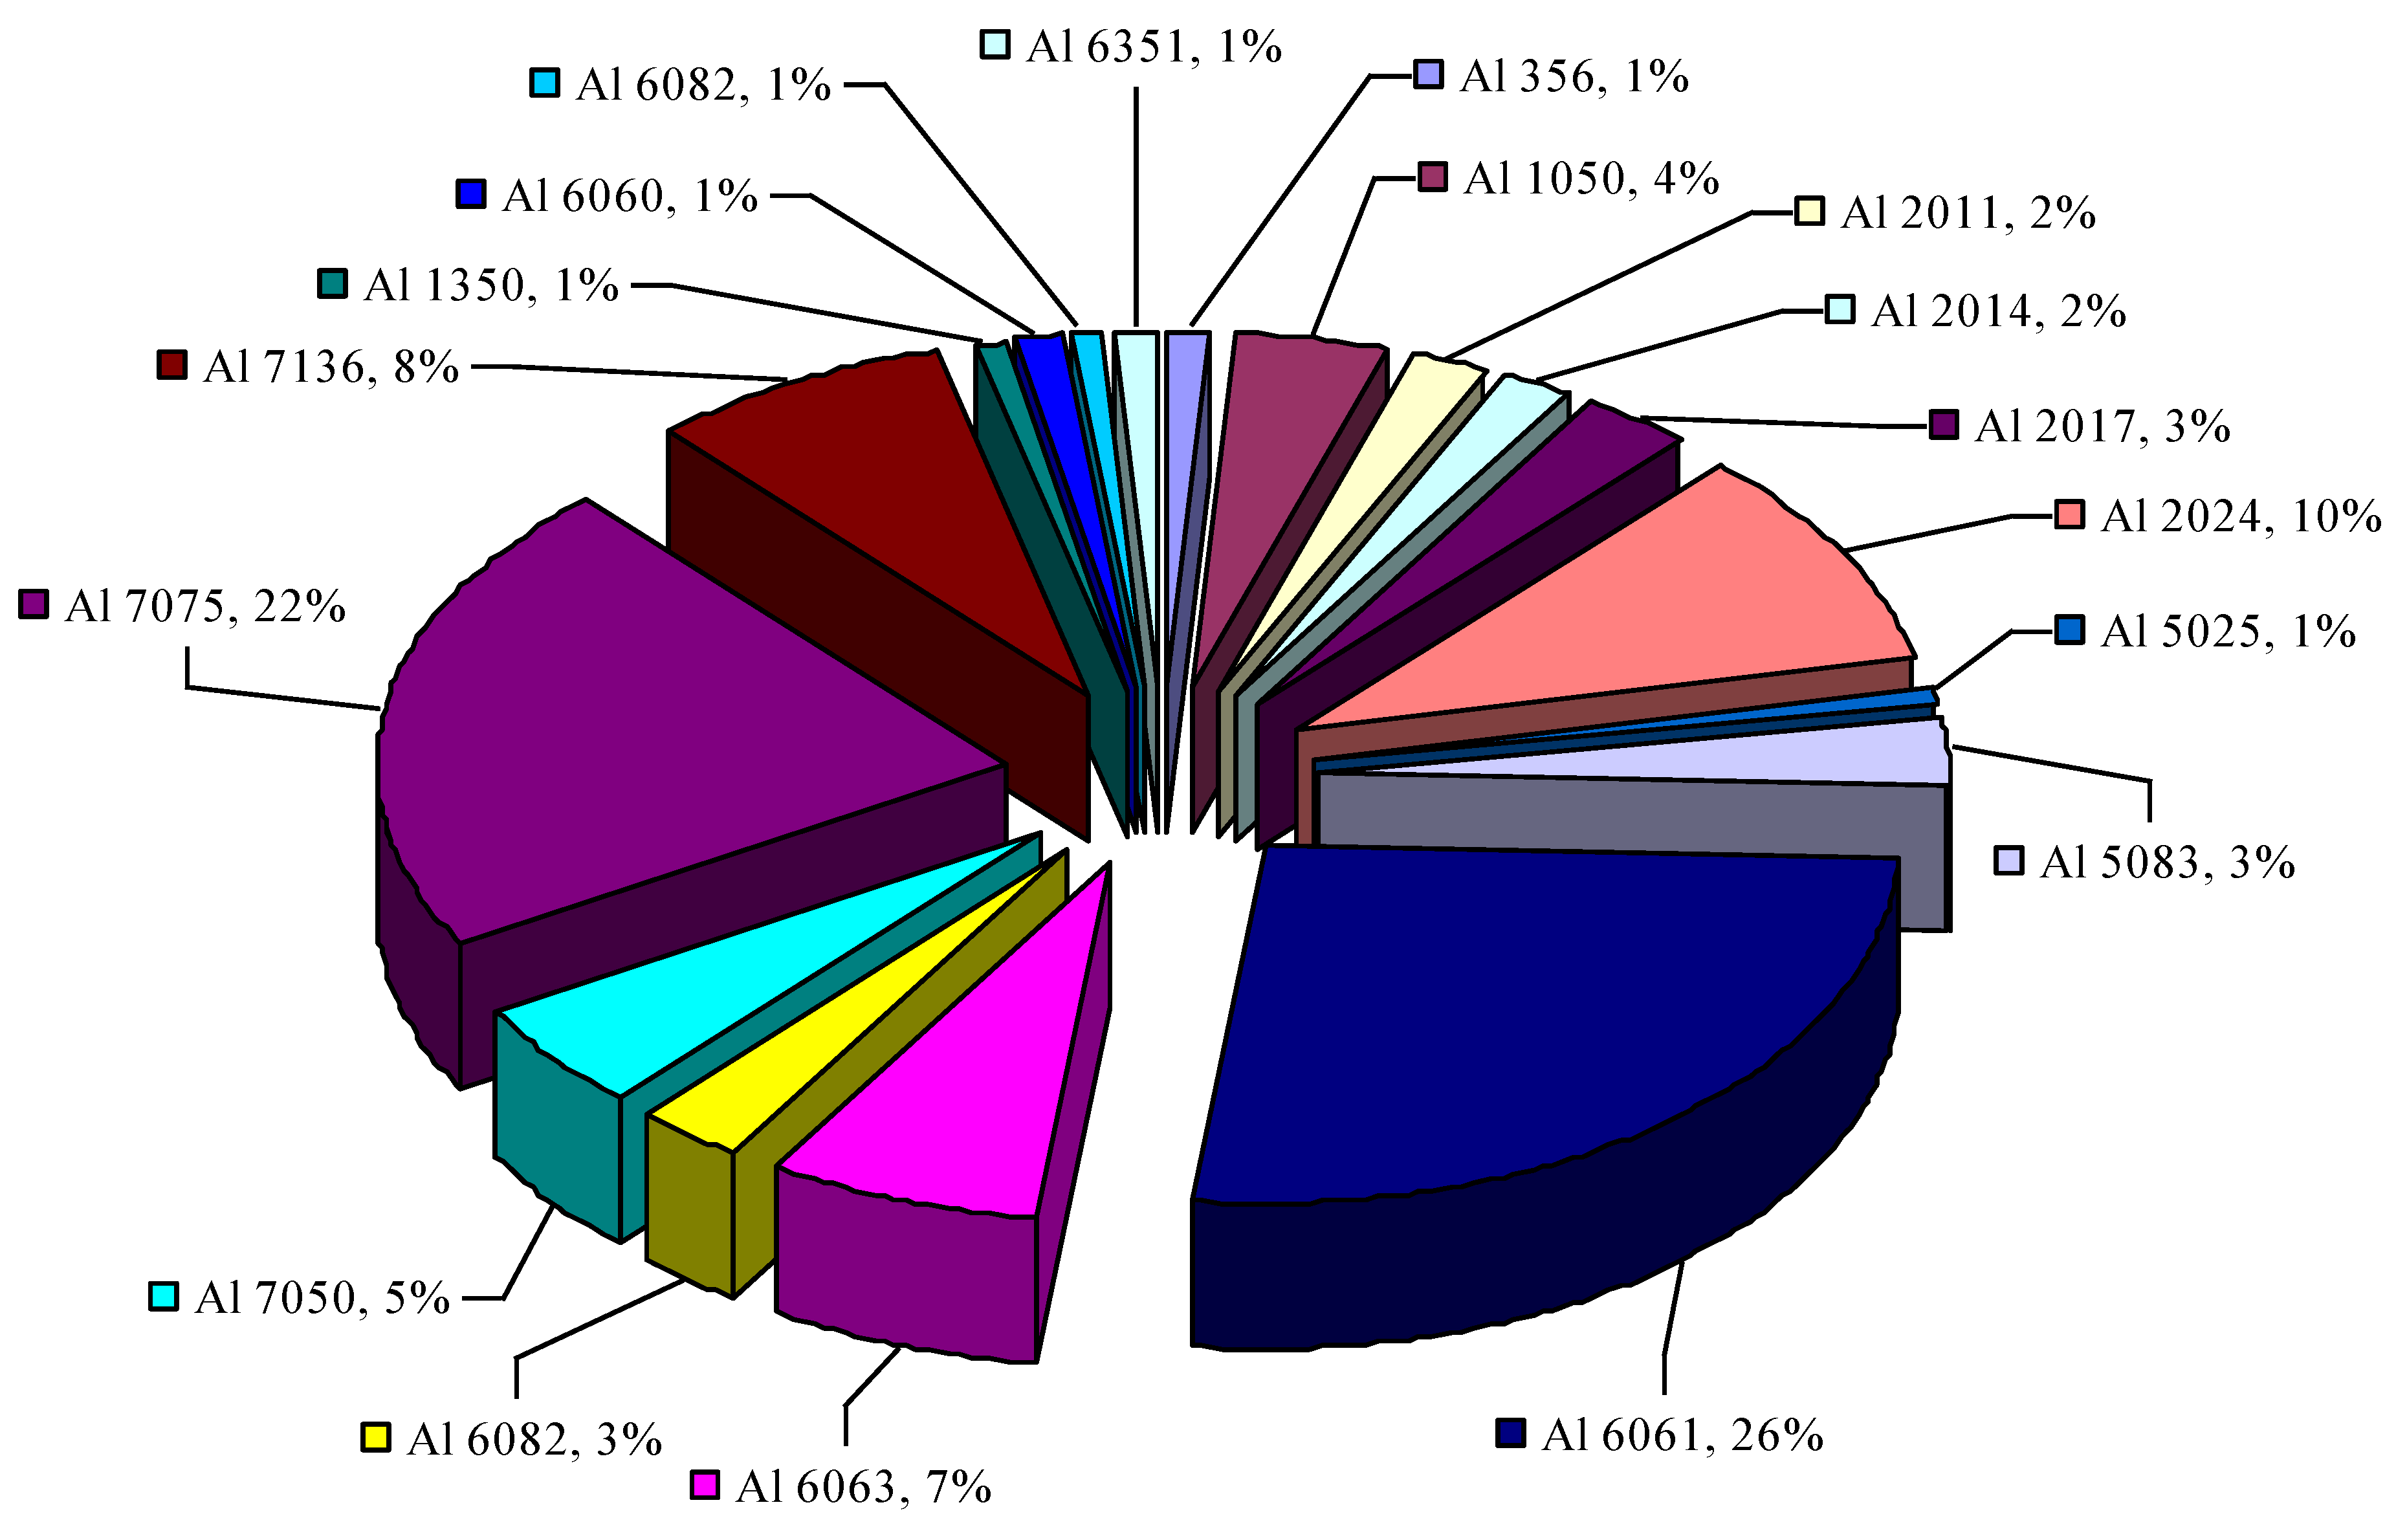
2.1. Work Material
- High strength to weight ratio;
- High wear resistance;
- Low thermal expansion;
- Corrosion resistance;
- Durability;
- Ductility;
- Conductivity, which makes it a versatile material [22].
2.2. Cutting Tool
2.3. CNC Machine
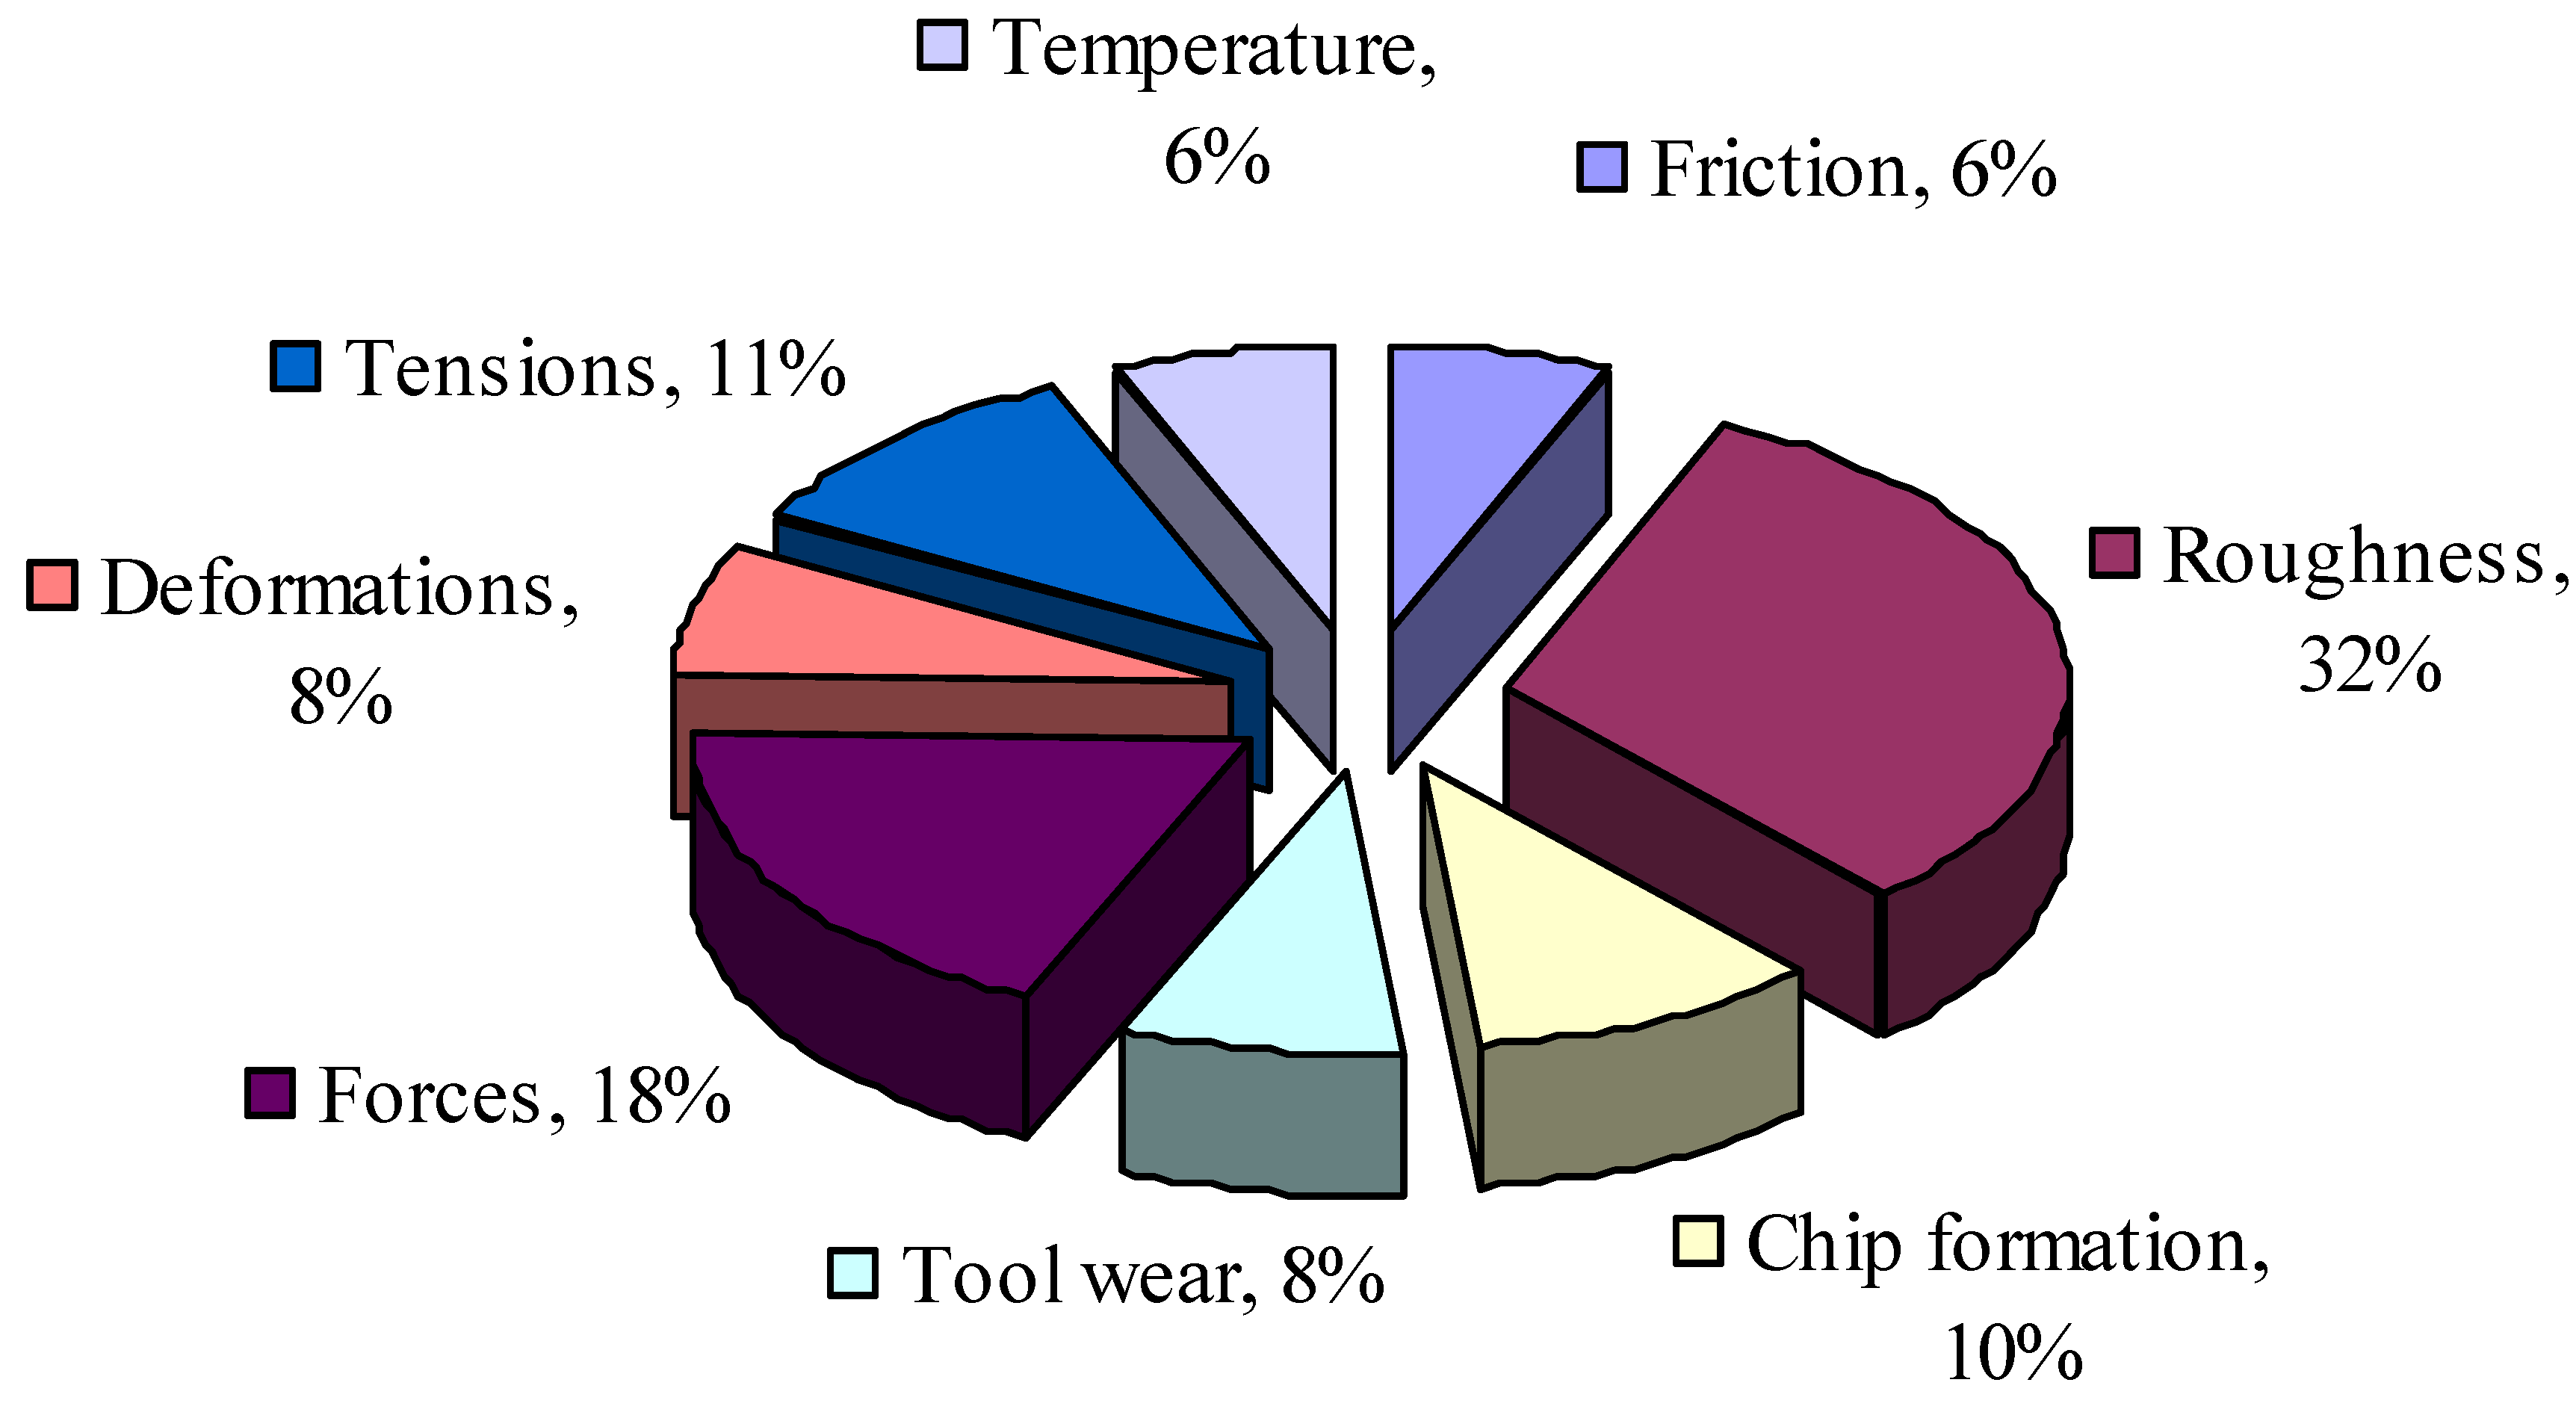
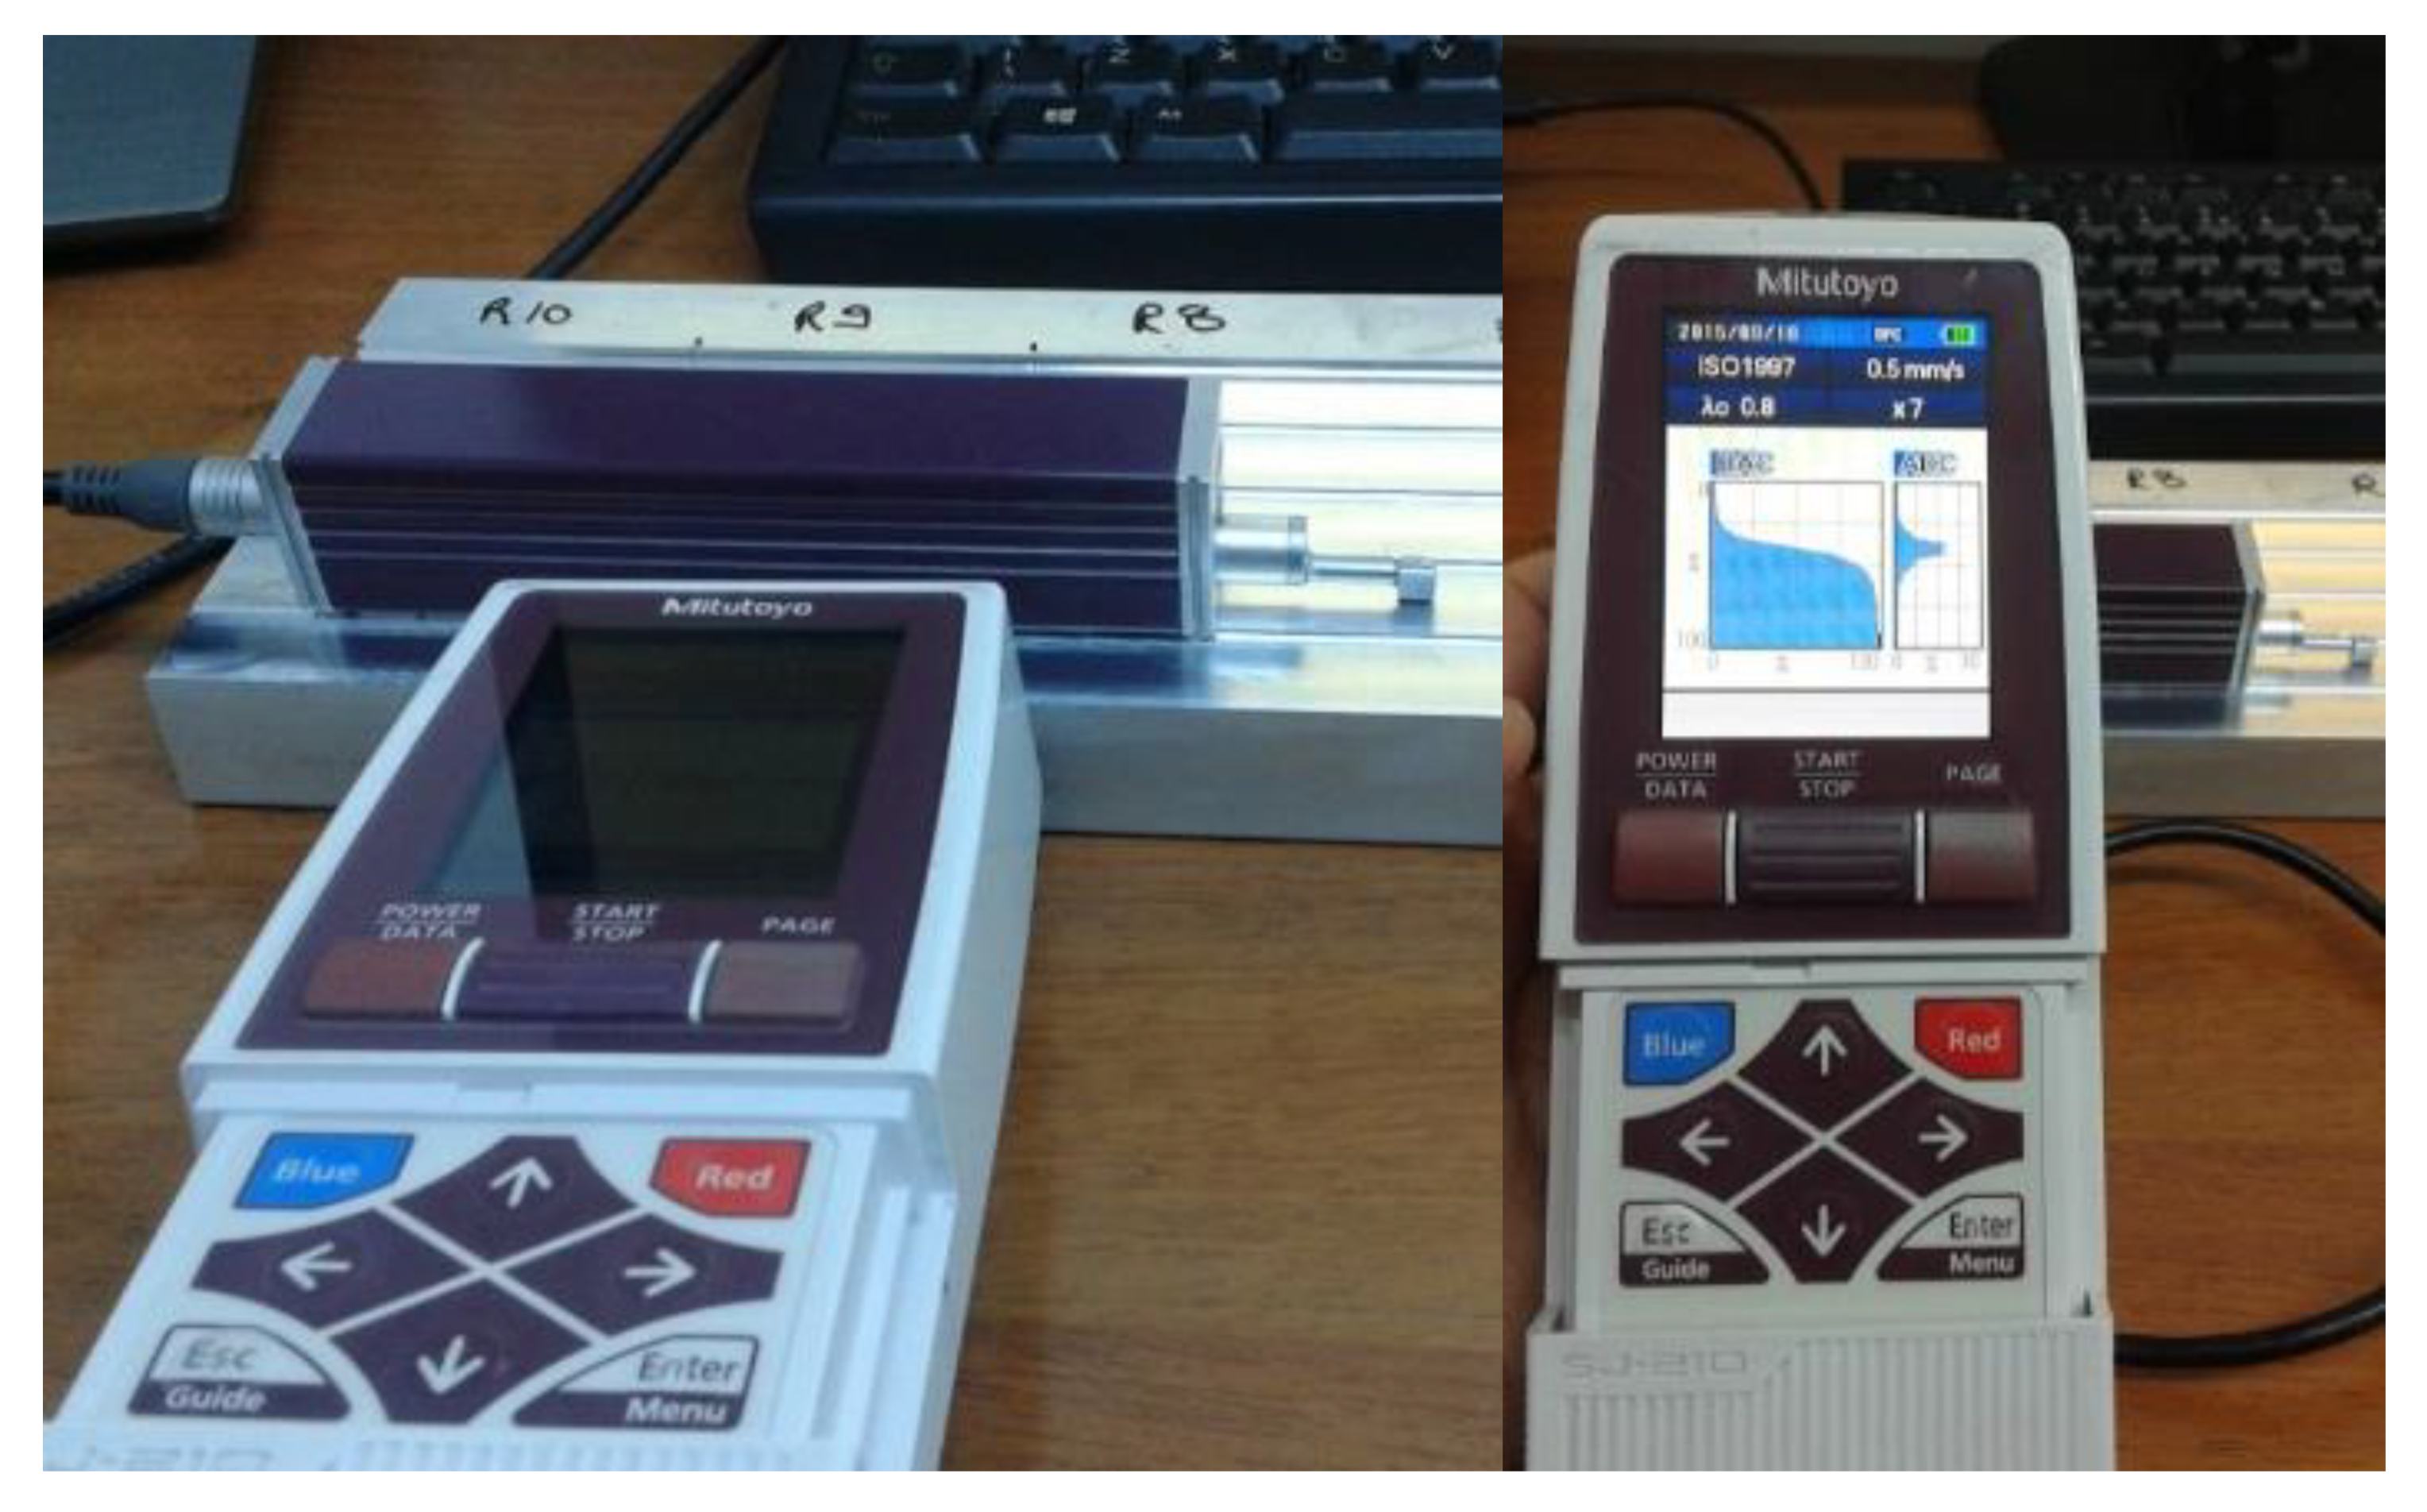
2.4. Response
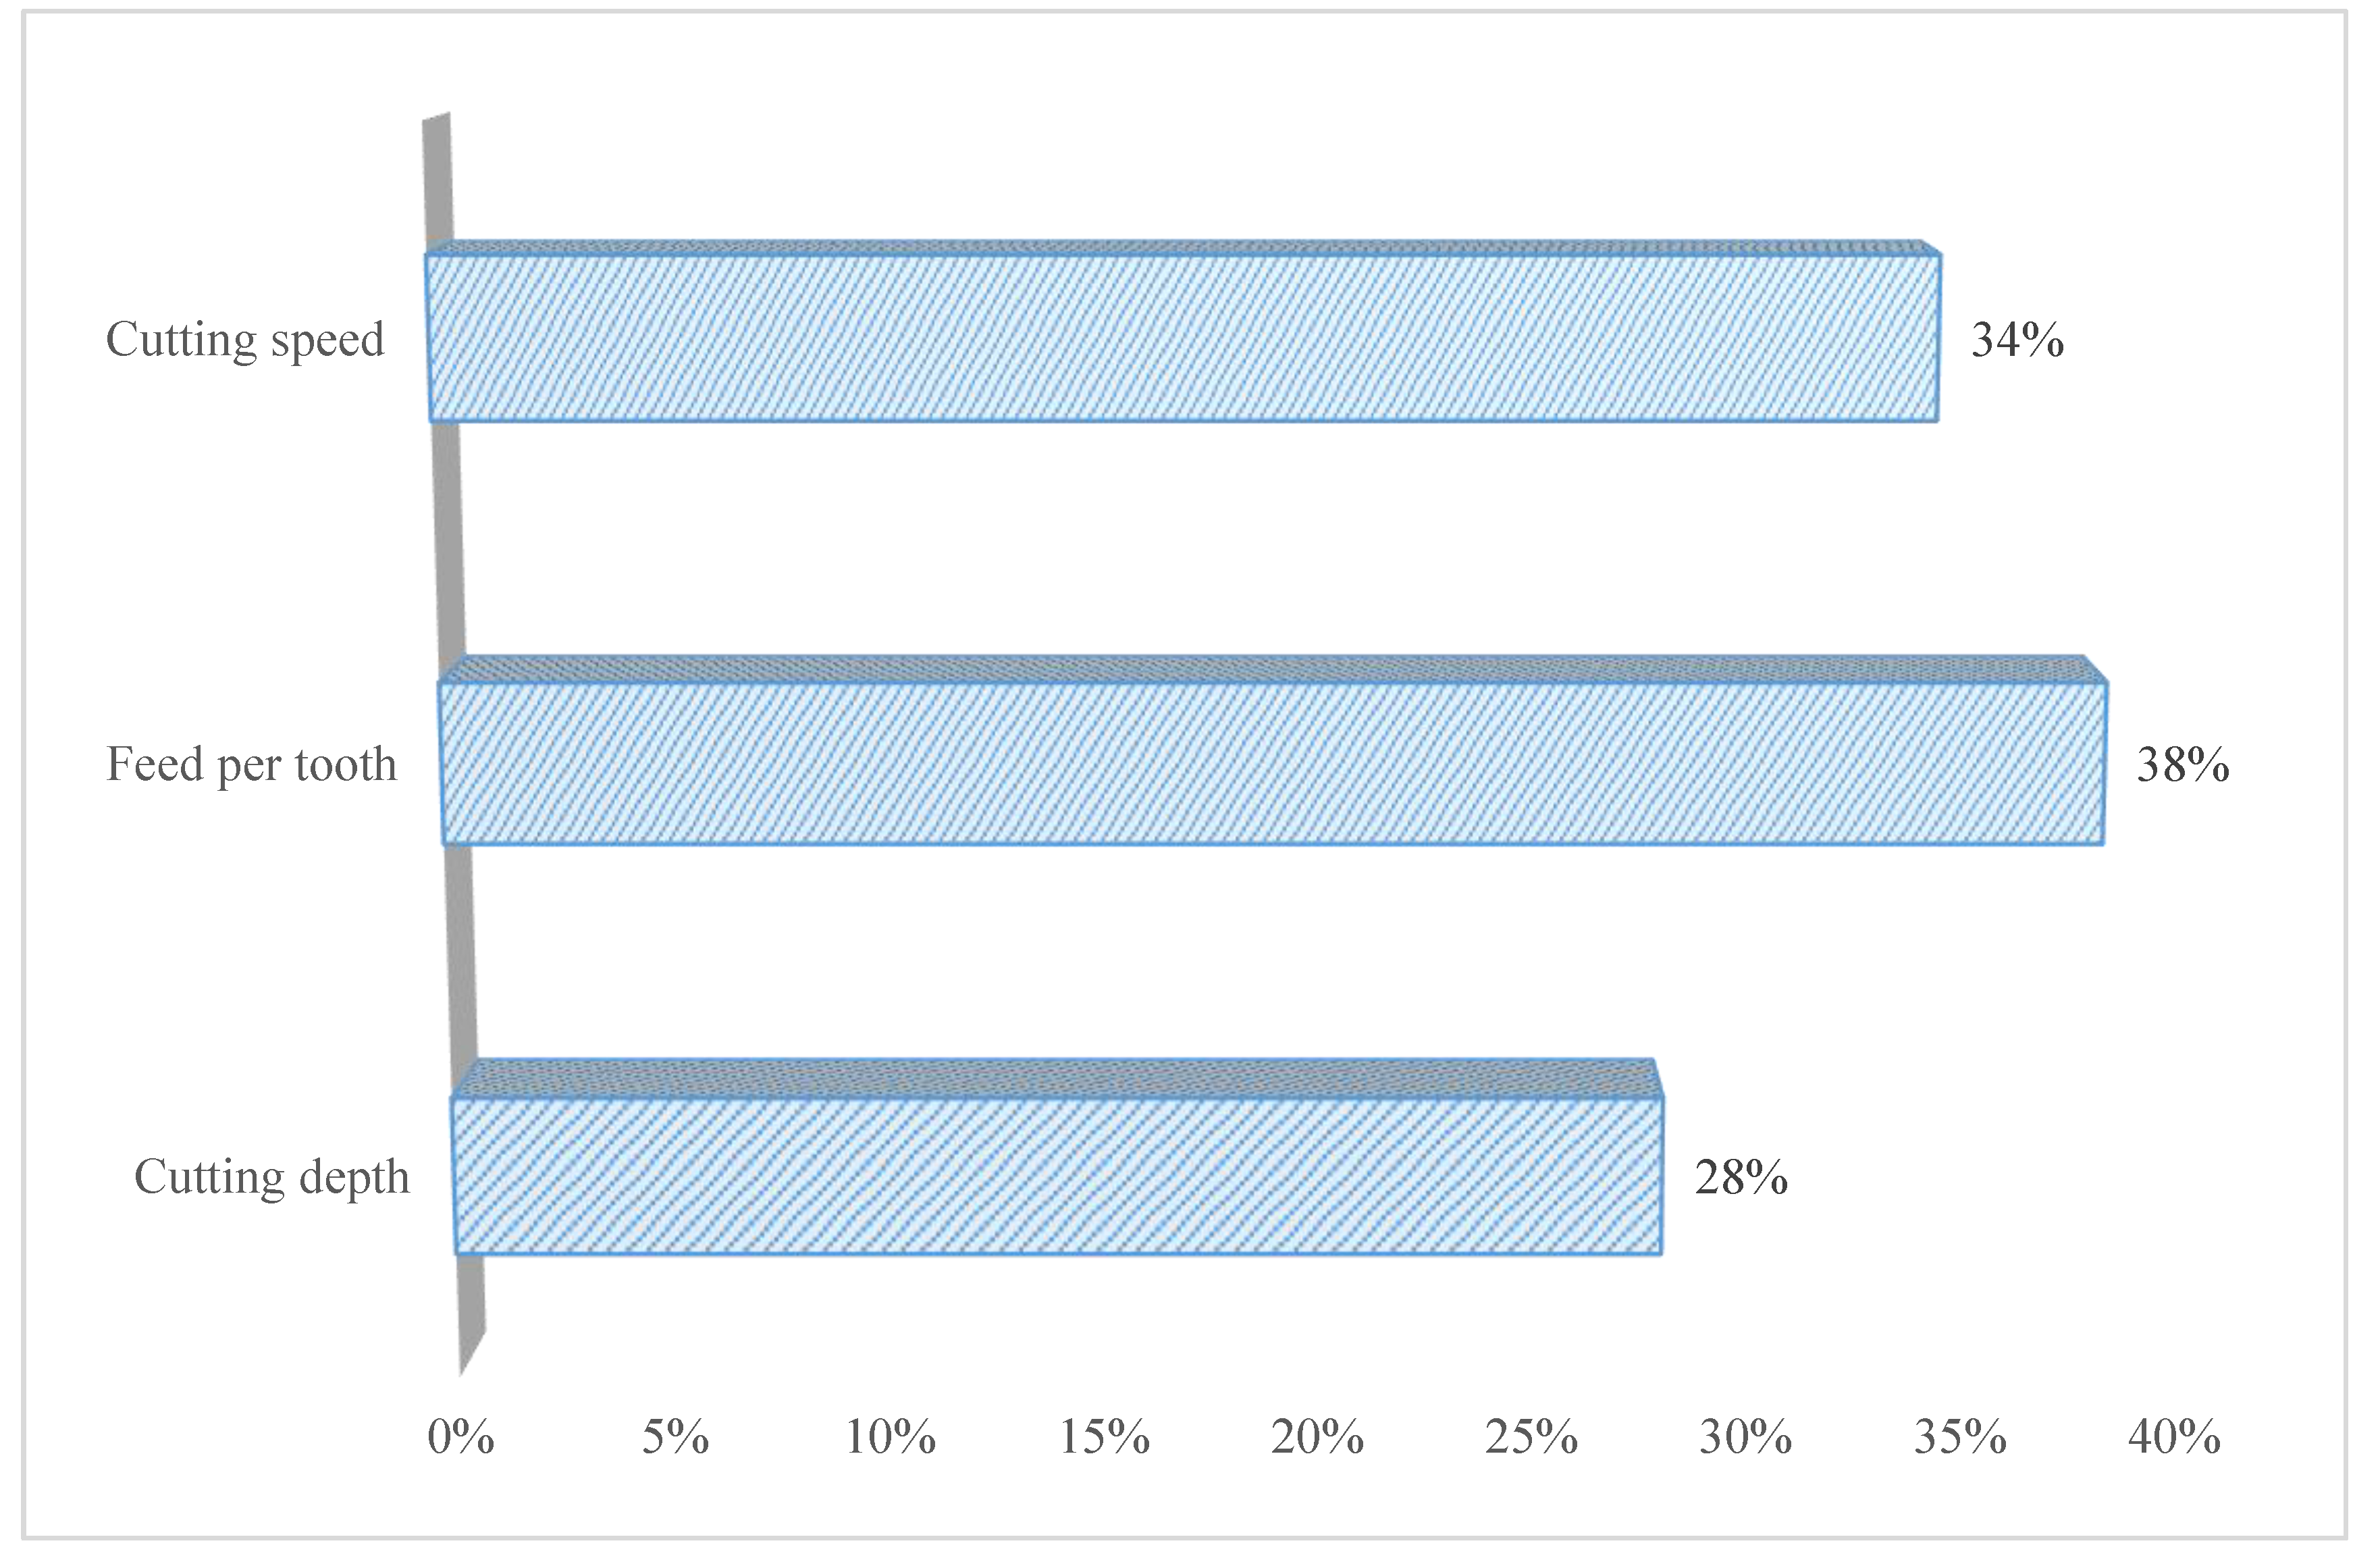
2.5. Process Variables and Their Parameters
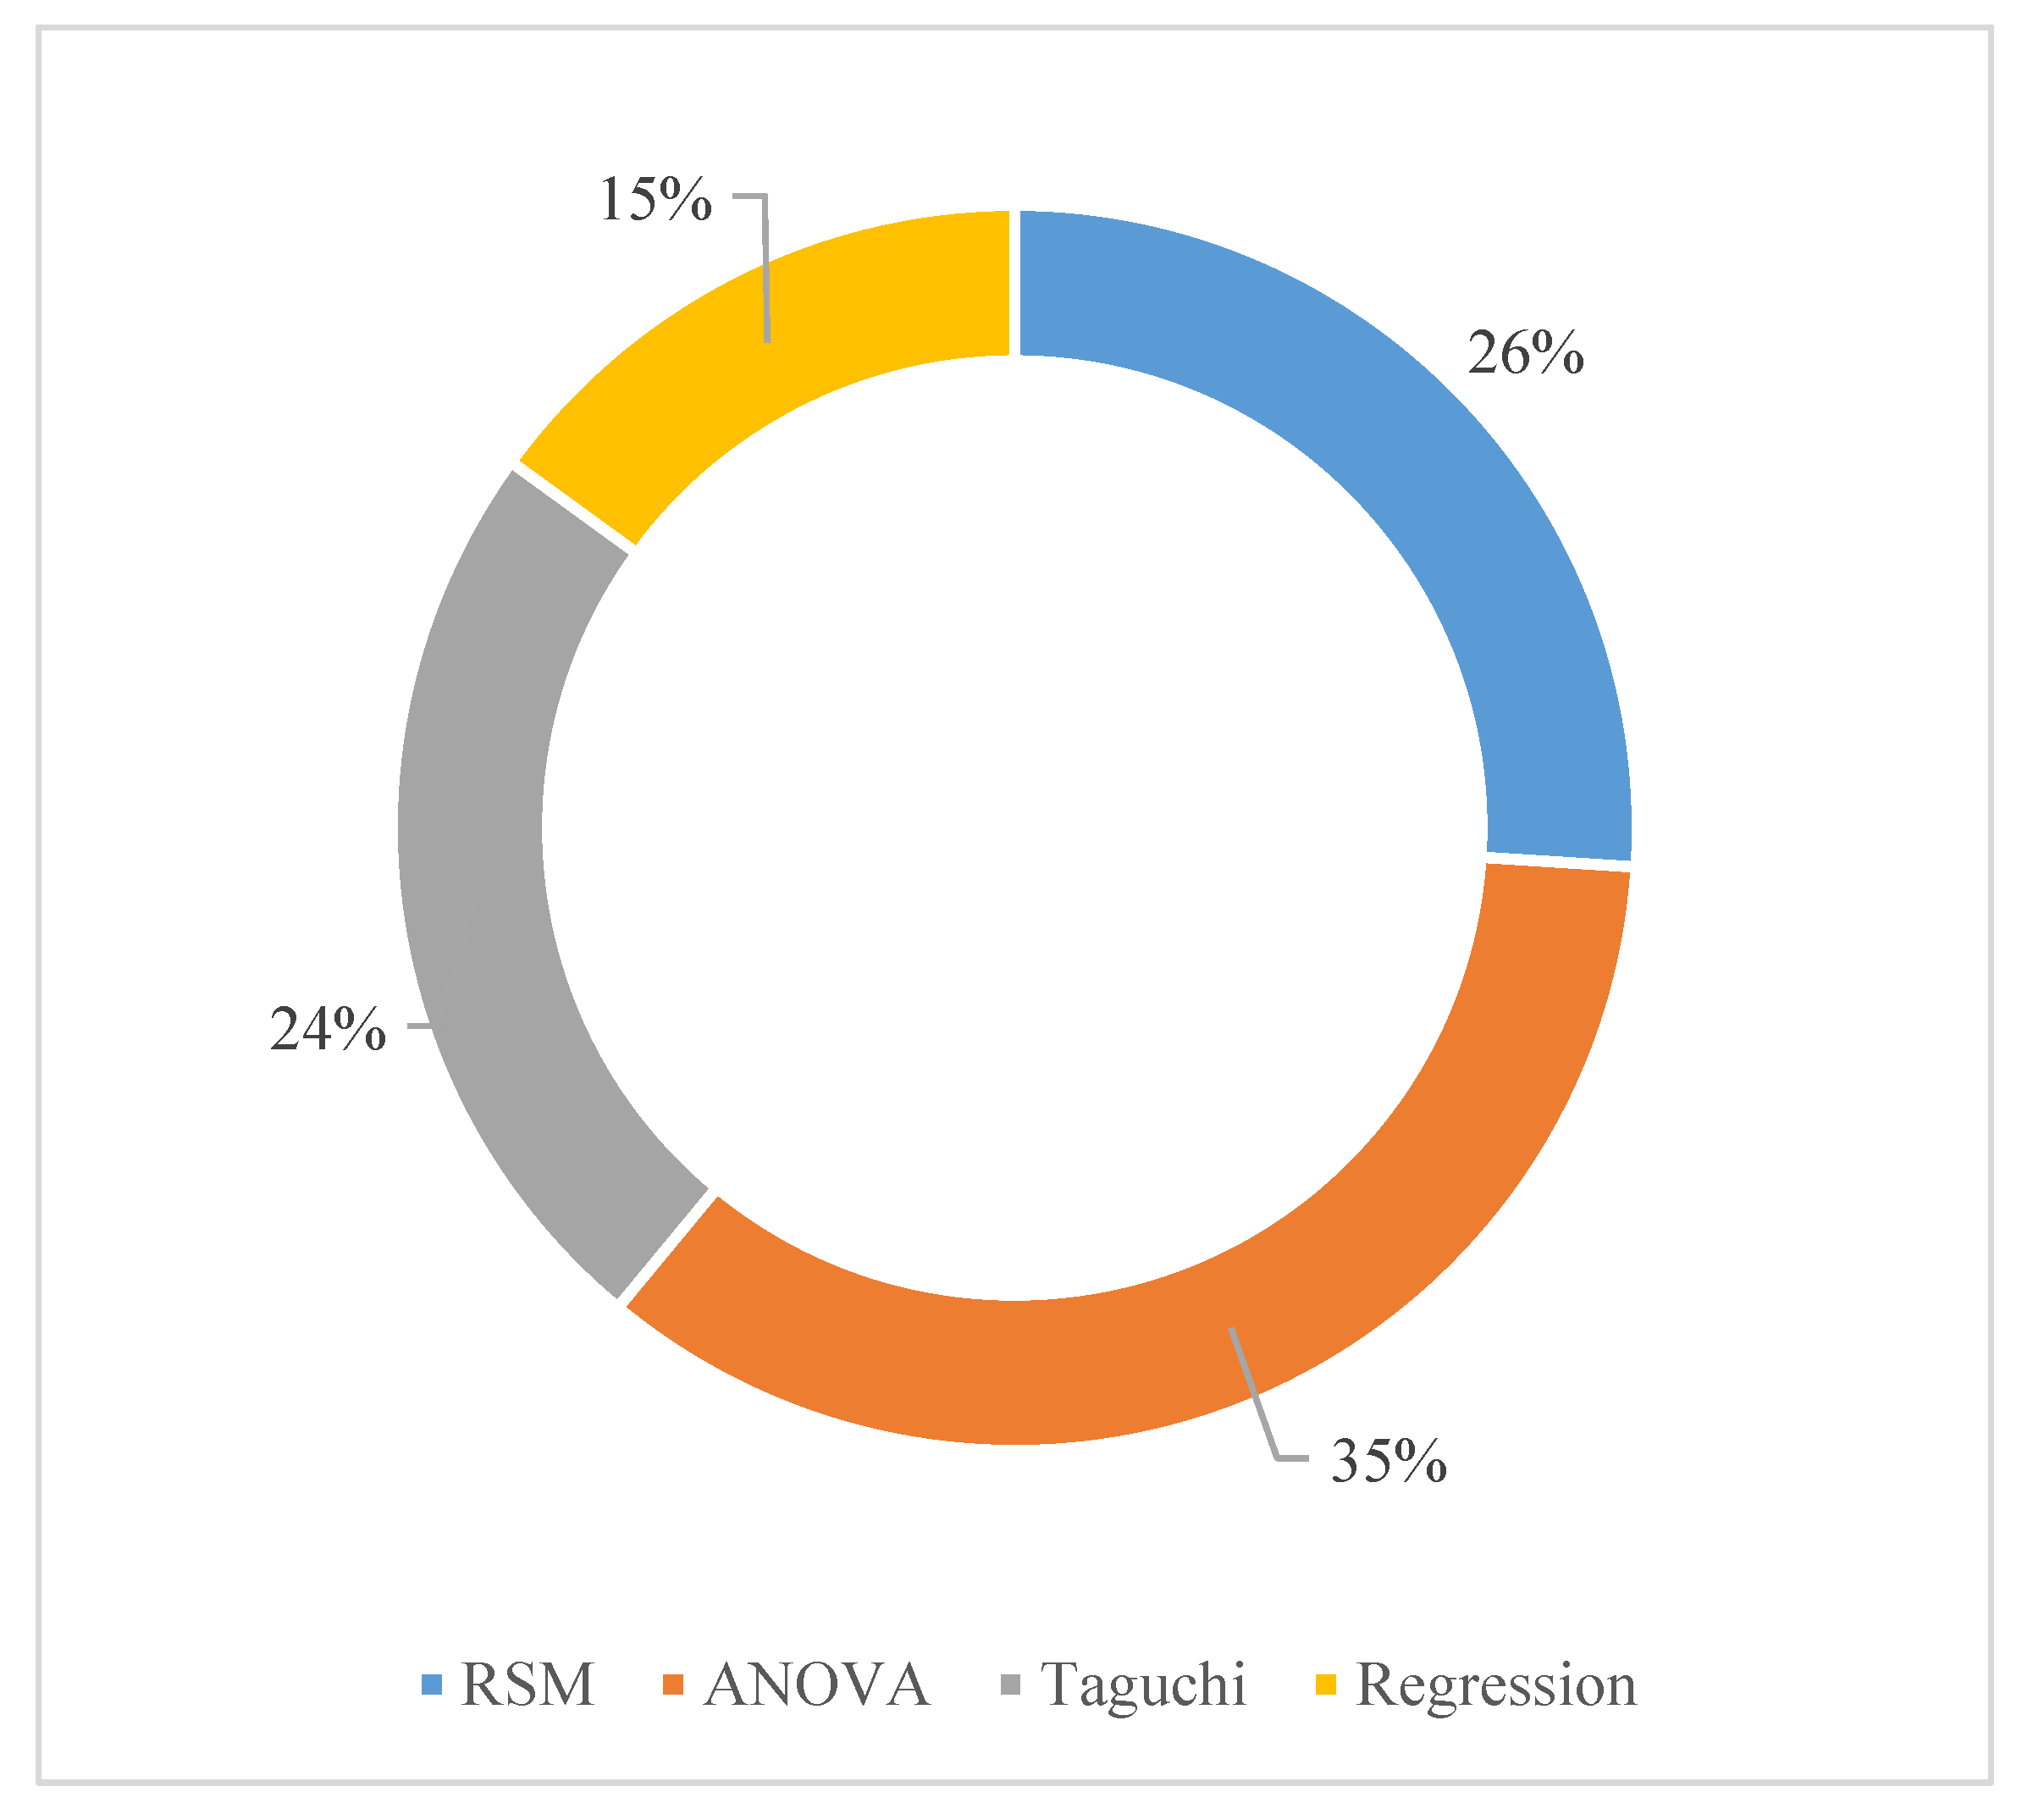
3. Taguchi Design versus Central Composite Design
3.1. Contribution of Parameters and Their Interactions
3.2. The Regression Equation of the Surface Roughness
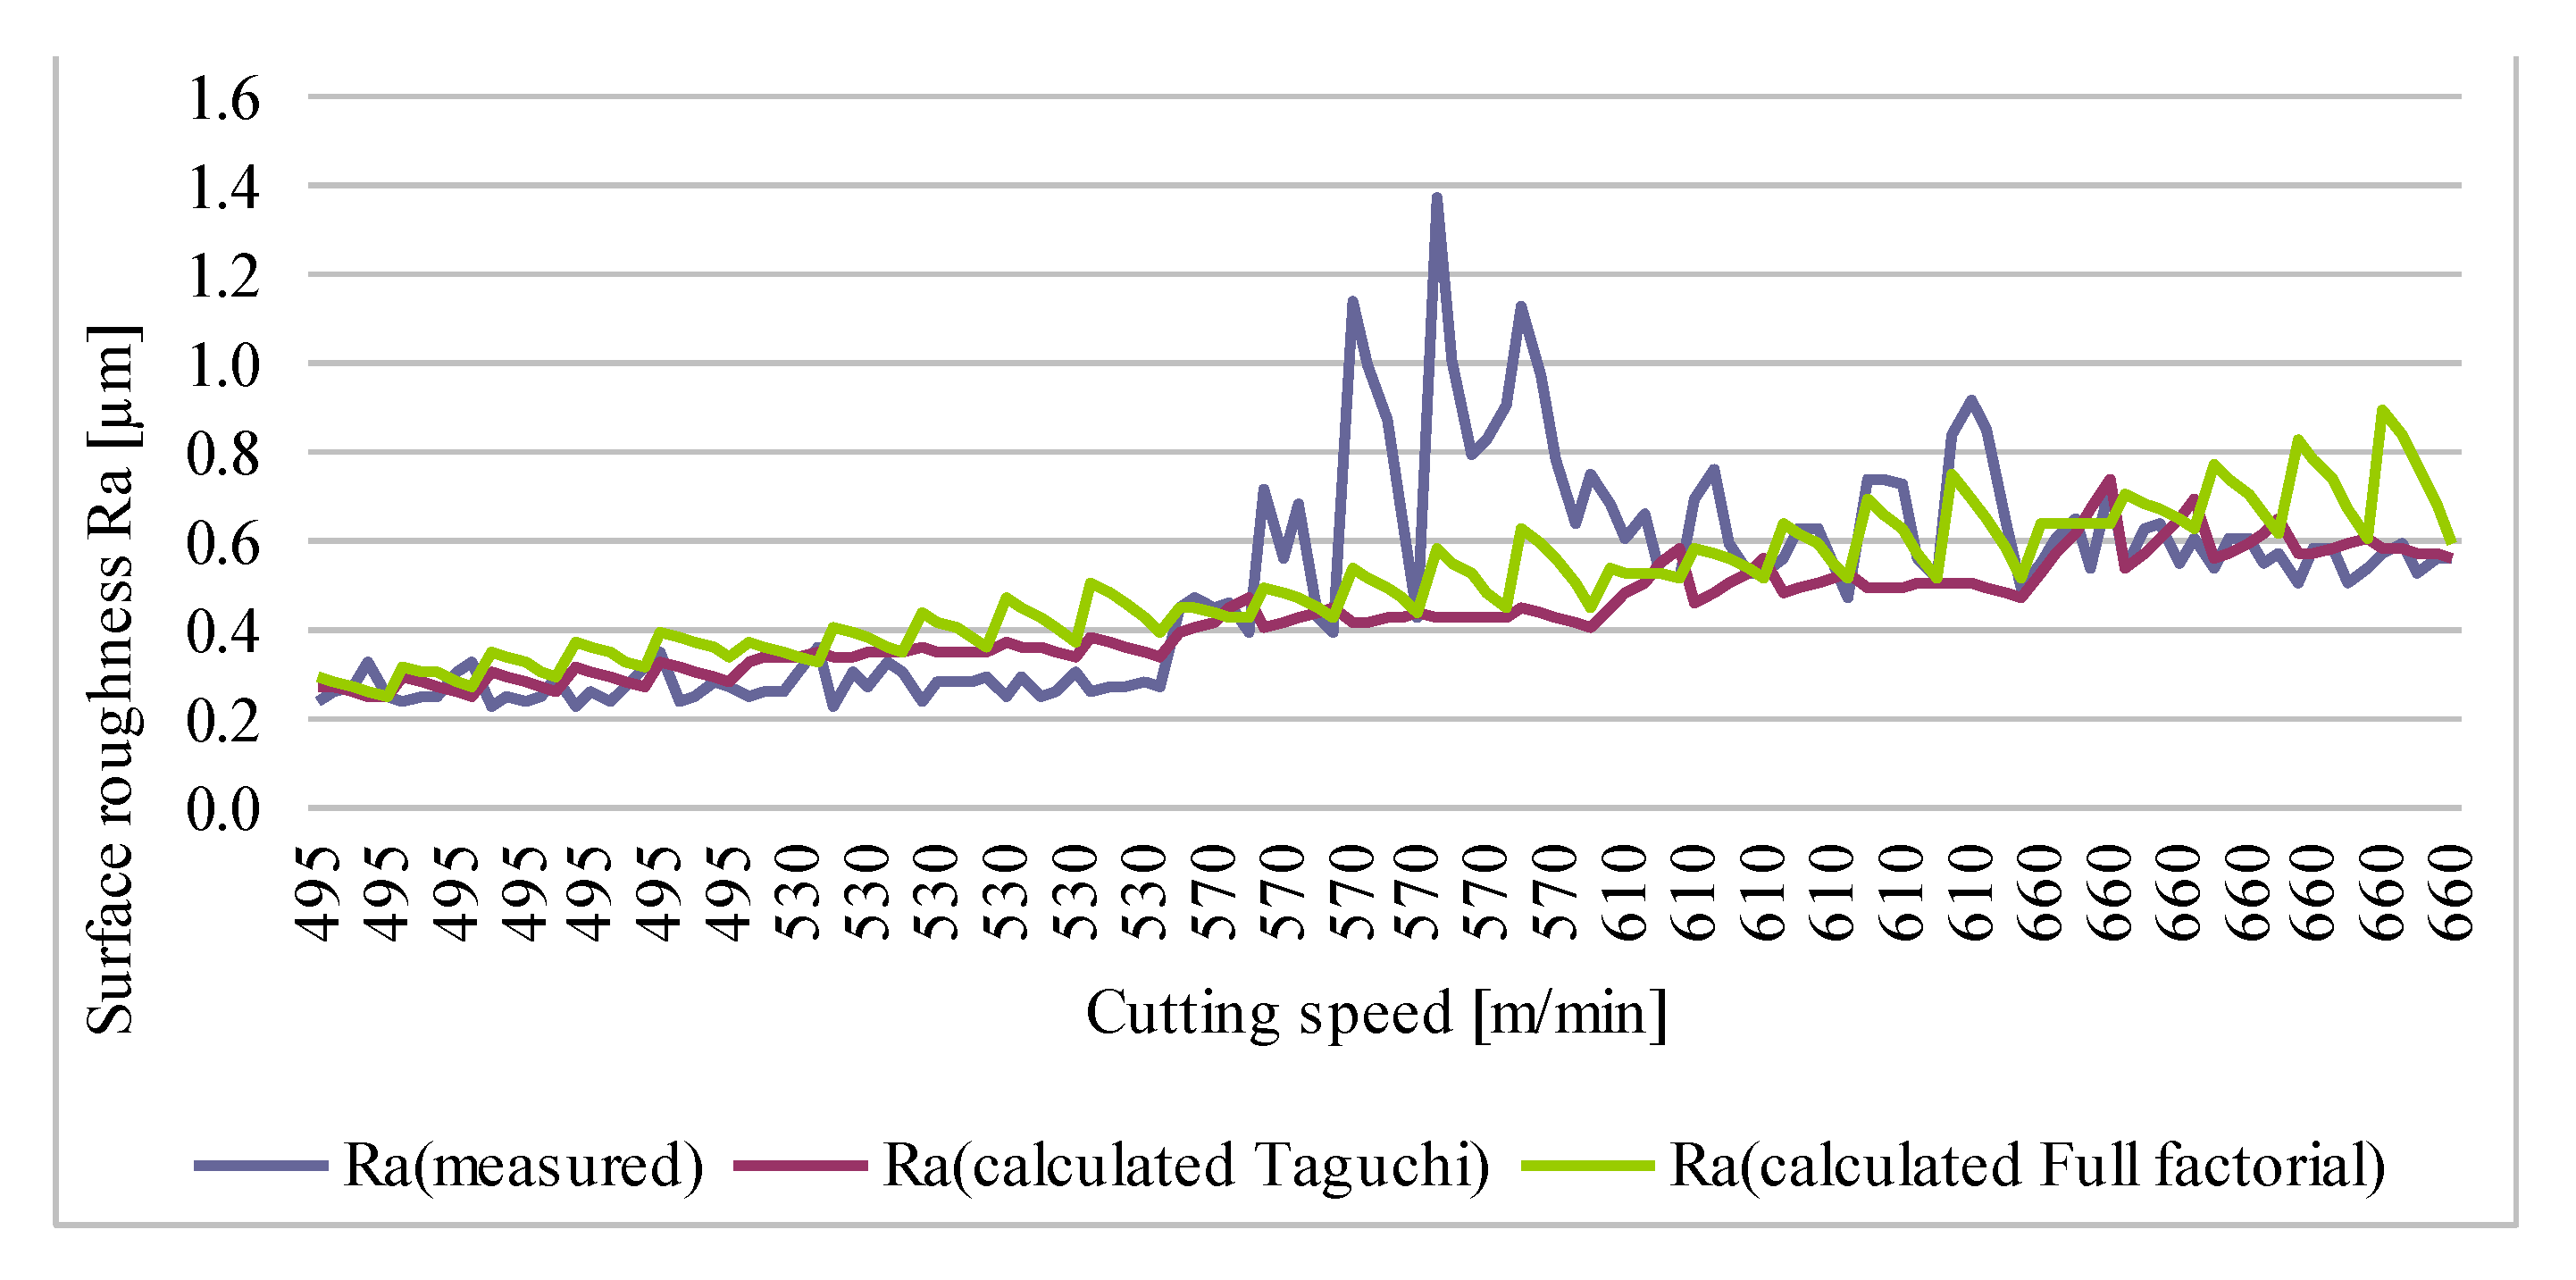
3.3. Comparison Between the Two Regression Equations Determined
4. Results and Discussions
5. Conclusions
Author Contributions
Funding
Conflicts of Interest
References
- Santos, M.C.; Machado, A.R.; Barrozo, M.A.S.; Jackson, M.J.; Ezugwu, E.O. Multi-objective optimization of cutting conditions when turning aluminum alloys (1350-O and 7075-T6 grades) using genetic algorithm. Int. J. Adv. Manuf. Technol. 2015, 76, 1123. [Google Scholar] [CrossRef]
- Tan, E.; Ögel, B. Influence of heat treatment on the mechanical properties of AA6066 alloy. Turk. J. Eng. Environ. Sci. 2007, 31, 53–60. [Google Scholar]
- Troeger, L.P.; Starke, E.A.Jr. Microstructural and mechanical characterization of a superplastic 6xxx aluminum alloy. Mater. Sci. Eng. 2000, A 277, 102–113. [Google Scholar] [CrossRef]
- Demir, H.; Gündüz, S. The effects of aging on machinability of 6061 aluminium alloy. J. Mater. Des. 2009, 30, 1480–1483. [Google Scholar] [CrossRef]
- Singh, D.P.; Mall, R.N. Optimization of surface roughness of aluminium by ANOVA based Taguchi method using Minitab15 software. Int. J. Technol. Res. Eng. 2015, 2, 2782–2787. [Google Scholar]
- Aamir, M.; Tu, S.; Giasin, K.; Tolouei-Rad, M. Multi-hole simultaneous drilling of aluminium alloy: A preliminary study and evaluation against one-shot drilling process. J. Mater. Res. Technol. 2020, 9, 3994–4006. [Google Scholar] [CrossRef]
- Aamir, M.; Tolouei-Rad, M.; Giasin, K.; Vafadar, A. Machinability of Al2024, Al6061, and Al5083 alloys using multi-hole simultaneous drilling approach. J. Mater. Res. Technol. 2020, 9, 10991–11002. [Google Scholar] [CrossRef]
- Ravindra, T. Comparison between multiple regression models to study effect of turning parameters on the surface roughness. In Proceedings of the 2008 IAJC-IJME International Conference, Nashville, TN, USA, 17–19 November 2008; Volume 133. [Google Scholar]
- Somashekara, H.M.; Swamy, N.L. Optimizing surface roughness in turning operation using taguchi technique and ANOVA. Int. J. Eng. Sci. Technol. 2012, 4, 1967–1973. [Google Scholar]
- Devkumar, V.; Sreedhar, E.; Prabakaran, M.P. Optimization of machining parameters on AL 6061 Alloy using response surface methodology. Int. J. Appl. Res. 2015, 1, 1–4. [Google Scholar]
- Ranganath, M.S.; Vipin, R.; Mishra, S. Optimization of process parameters in turning operation of aluminium (6061) with cemented carbide inserts using taguchi method and ANOVA. Int. J. Adv. Res. 2013, 1, 13–21. [Google Scholar]
- Abdallah, A.; Bhuvenesh, R.; Embark, A. Optimization of cutting parameters for surface roughness in CNC turning machining with aluminum alloy 6061 material. IOSR J. Eng. 2014, 4, 1–10. [Google Scholar] [CrossRef]
- Alagarsamy, S.V.; Rajakumar, N. Analysis of influence of turning process parameters on MRR & surface roughness of AA7075 using taguchi’s method and RSM. Int. J. Appl. Res. Stud. 2014, 3, 1–8. [Google Scholar]
- Ezuwanizam, M. Optimization of Tool Life in Miling. Ph.D. Thesis, Universiti Malaysia Pahang, Pahang, Malaysia, 2010. [Google Scholar]
- Țîțu, M.; Pop, A.B. A comparative analysis of the machined surfaces quality of an aluminum alloy according to the cutting speed and cutting depth variations. In New Technoloies, Development and Application II, NT 2019, Lecture Notes in Networks and Systems; Karabegović, I., Ed.; Springer: Cham, Switzerland, 2020; Volume 76. [Google Scholar] [CrossRef]
- Pop, A.B.; Țîțu, M. A comparative analysis of the machined surfaces quality of an aluminum alloy according to the cutting speed and feed per tooth variations. In New Technoloies, Development and Application II, NT 2019, Lecture Notes in Networks and Systems; Karabegović, I., Ed.; Springer: Cham, Switzerland, 2020; Volume 76. [Google Scholar] [CrossRef]
- Pop, A.B.; Ţîţu, M.A. Optimization of the surface roughness equation obtained by Al7136 End-Milling. MATEC Web Conf. 2017, 137, 3011. [Google Scholar] [CrossRef]
- Pop, A.B.; Ţîţu, M.A. Experimental research regarding the study of surface quality of aluminum alloys processed through milling. MATEC Web Conf. 2017, 121, 05005. [Google Scholar] [CrossRef]
- Țîțu, M.; Pop, A.B. Contribution on taguchi’s method application on the surface roughness analysis in end milling process on 7136 aluminum alloy. Mater. Sci. Eng. 2016, 1, 012014. [Google Scholar] [CrossRef]
- Pop, A.B.; Țîțu, M. Regarding to the variance analysis of regression equation of the surface roughness obtained by end milling process of 7136 aluminum alloy. IOP Conf. Ser. Mater. Sci. Eng. 2016, 161, 012014. [Google Scholar] [CrossRef]
- Bonțiu Pop, A.B.; Lobonţiu, M. The influence of feed per tooth variation on surface roughness of 7136 aluminum alloy in end milling. Appl. Mech. Mater. 2015, 808, 34–39. [Google Scholar] [CrossRef]
- Bonțiu Pop, A.B. Surface Quality Analysis of Machined Aluminum Alloys Using End Mill Tool. Ph.D. Thesis, Technical University of Cluj-Napoca, Baia Mare, Romania, 2015. [Google Scholar]
- SAE Aerospace - AMS4451A, Aerospace Material Specification, Aluminum Alloy Extrusions 8.9Zn - 2.2Cu - 2.2Mg - 0.15Zr (7136-T76511, -T76510) Solution Heat Treated, Stress-Relieved, Straightened, and Overaged; SAE International: Warrendale, PA, USA, 2008.
- AMS2355M—Quality Assurance, Sampling and Testing Aluminum Alloys and Magnesium Alloy Wrought Products (Except Forging Stock), and Rolled, Forged, or Flash Welded Rings; SAE International: Warrendale, PA, USA, 2019.
- SAE Aerospace AS1990—Aluminum Alloy Tempers; SAE International: Warrendale, PA, USA, 1990.
- DIN EN515 E, 2017—Aluminium and Aluminium Alloys—Wrought Products—Temper Designations; German Institute for Standardisation (Deutsches Institut für Normung), Comite Europeen de Normalisation: Brussels, Belgium, 2017.
- Catalog and Technical Guide Seco, Milling 2014, SECO. Available online: https://pdf.directindustry.com/pdf/seco-tools/mn-2014-milling/5699-261905.html (accessed on 8 December 2017).
- Technical Book HAAS VF-2YT, Haas Technical Publications, Manual_Archive_Cover_Page Rev A June 6. 2013. Available online: https://www.haascnc.com/content/dam/haascnc/en/service/manual/service/english---vf-series-service-manual---2002.pdf (accessed on 8 December 2017).
- Blasocut BC 35 Kombi SW. Available online: https://www.lastuamisnesteet.fi/wp-content/uploads/2017/02/Blasocut-BC-35-esite.pdf (accessed on 8 December 2017).
- Hanif, I.; Aamir, M.; Ahmed, N.; Maqsood, S.; Muhammad, R.; Akhtar, R.; Hussain, I. Optimization of facing process by indigenously developed force dynamometer. Int. J. Adv. Manuf. Technol. 2019, 100, 1893–1905. [Google Scholar] [CrossRef]
- Kumar, S. Optimization and process parameters of CNC end milling for aluminum alloy 6082. Int. J. Innov. Eng. Res. Technol. 2015, 2, 2394–3696. [Google Scholar]
- Malvade, N.V.; Nipanikar, S.R. Optimization of cutting parameters of end milling on VMC using taguchi method. J. Eng. Res. Stud. 2014, 5, 14–17. [Google Scholar]
- Moshat, S.; Datta, S.; Bandyopadhyay, A.; Pal, P. Optimization of CNC end milling process parameters using PCA-based Taguchi method. Int. J. Eng. Sci. Technol. 2010, 2, 95–102. [Google Scholar] [CrossRef]
- Zahoor, S.; Mufti, N.A.; Saleem, M.Q.; Mughal, M.P.; Qureshi, M.A.M. Effect of machine tool’s spindle forced vibrations on surface roughness, dimensional accuracy, and tool wear in vertical milling of AISI P20. Int. J. Adv. Manuf. Technol. 2017, 89, 3671–3679. [Google Scholar] [CrossRef]
- David, C.; Sagris, D.; Stergianni, E.; Tsiafis, C.; Tsiafis, I. Experimental analysis of the effect of vibration phenomena on workpiece topomorphy due to cutter runout in end-milling process. Machines 2018, 6, 27. [Google Scholar] [CrossRef]


| Machining Process | Aluminum Alloy | Process Parameters | Objectives | Optimization/Prediction Technique | Ref. |
|---|---|---|---|---|---|
| End-Milling | 7136 | cutting speed, cutting depth | Comparison between the evolution of the machined surfaces quality according to process parameters | Practical experiment | [15] |
| End-Milling | 7136 | cutting speed, feed per tooth, cutting depth | Comparison of the surface quality evolutions in different situations related to the cutting regimes resulting from the combination of the process parameters | Practical experiment | [16] |
| End-Milling | 7136 | cutting speed, feed per tooth, cutting depth | Optimization of the regression equation of the surface roughness | Taguchi | [17] |
| Milling | 7136 | cutting speed, feed per tooth, cutting depth | Determination of the cutting parameters influence, on the surface quality | Taguchi, full factorial design | [18] |
| Milling | 7136 | cutting speed, feed per tooth, cutting depth | Determination of the proper configuration of the optimum values of machining parameter and their interactions to obtain the better cutting process performance and to reduce the surface roughness sensitivity to uncontrollable factors | Taguchi | [19] |
| End-Milling | 7136 | cutting speed, feed per tooth, cutting depth | To reduce manufacturing costs and processing time. To identify the quantitative relationships between cutting parameters and the surface roughness. | Regression analysis, ANOVA | [20] |
| Element | min | max |
|---|---|---|
| Silicon | - | 0.12 |
| Iron | - | 0.15 |
| Copper | 1.9 | 2.5 |
| Manganese | - | 0.05 |
| Magnesium | 1.8 | 2.5 |
| Chromium | - | 0.05 |
| Zinc | 8.4 | 94 |
| Titanium | - | 0.10 |
| Zirconium | 0.1 | 0.20 |
| Other Elements, each | - | 0.05 |
| Other elements, total | - | 0.15 |
| Aluminum | remainder |
| Nominal Diameter or Least Thickness (Bars, Rods, Wire, Profiles) or Nominal Wall Thickness (Tubing) Millimeters | Tensile Strength MPa | Yield Strength at 0.2% Offset MPa | Elongation in 50 mm % | Elongation in 5D or 5.65√A |
|---|---|---|---|---|
| 1.00–6.300 | 621 | 593 | 7 | - |
| 6.30–12.50 | 627 | 600 | 7 | - |
| 12.50–50.00 | 634 | 607 | - | 6 |
| 50.00–80.00 | 627 | 607 | - | 7 |
| 80.00–100.00 | 621 | 593 | - | 7 |
| Travels | Metric |
|---|---|
| X Axis | 762 mm |
| Y Axis | 508 mm |
| Z Axis | 508 mm |
| Spindle Nose to Table (~max) | 610 mm |
| Spindle Nose to Table (~min) | 102 mm |
| TABLE | METRIC |
| Length | 914 mm |
| Width | 457 mm |
| T-Slot Width | 16 mm |
| T-Slot Center Distance | 125.0 mm |
| Number of Std T-Slots | 3 |
| Max Weight on Table (evenly distributed) | 1361 kg |
| SPINDLE | METRIC |
| Max Rating | 22.4 kW |
| Max Speed | 8100 rpm |
| Max Torque | 122 Nm @ 2000 rpm |
| Drive System | Inline Direct-Drive |
| Max Torque w/opt Gearbox | 339 Nm @ 450 rpm |
| Taper | CT or BT 40 |
| Bearing Lubrication | Air/Oil Injection |
| Cooling | Liquid Cooled |
| FEEDRATES | METRIC |
| Rapids on X | 25.4 m/min |
| Rapids on Y | 25.4 m/min |
| Rapids on Z | 25.4 m/min |
| Max Cutting | 16.5 m/min |
| AXIS MOTORS | METRIC |
| Max Thrust X | 11343 N |
| Max Thrust Y | 11343 N |
| Max Thrust Z | 18683 N |
| TOOL CHANGER | METRIC |
| Type | Carousel (SMTC Optional) |
| Capacity | 20 |
| Max Tool Diameter (full) | 89 mm |
| Max Tool Weight | 5.4 kg |
| GENERAL | METRIC |
| Air Required | 113 L/min, 6.9 bar |
| Coolant Capacity | 208 L |
| Parameter | Taguchi′s Method | Central Composite Design | |
|---|---|---|---|
| Value 1 | Value 2 | Values | |
| Cutting Speed v (m/min) | 495 | 660 | 495, 530, 570, 610, 660 |
| Cutting Depth ap (mm) | 2 | 4 | 2, 2.5, 3, 3.5, 4 |
| Feed per Tooth fz (mm/tooth) | 0.04 | 0.14 | 0.04, 0.06, 0.08, 0.11, 0.14 |
| Parameters and Interactions | A - | B | AB | C | AC | BC | |
|---|---|---|---|---|---|---|---|
| Parameter | Cutting Speed [m/min] | Cutting Depth [mm] | Feed per Tooth [mm/tooth] | ||||
| Column | |||||||
| 1 | 2 | 3 | 4 | 5 | 6 | ||
| Experiment | 1 | 1 | 1 | 1 | 1 | 1 | 1 |
| 2 | 1 | 1 | 1 | 2 | 2 | 2 | |
| 3 | 1 | 2 | 2 | 1 | 1 | 2 | |
| 4 | 1 | 2 | 2 | 2 | 2 | 1 | |
| 5 | 2 | 1 | 2 | 1 | 2 | 1 | |
| 6 | 2 | 1 | 2 | 2 | 1 | 2 | |
| 7 | 2 | 2 | 1 | 1 | 2 | 2 | |
| 8 | 2 | 2 | 1 | 2 | 1 | 1 | |
| No. | v (m/min) | ap (mm) | fz (mm/tooth) | Ra Med (μm) |
|---|---|---|---|---|
| 1 | 495 | 2 | 0.04 | 0.235 |
| 2 | 495 | 2 | 0.14 | 0.25 |
| 3 | 660 | 4 | 0.04 | 0.565 |
| 4 | 660 | 4 | 0.14 | 0.561 |
| 5 | 495 | 4 | 0.04 | 0.342 |
| 6 | 495 | 4 | 0.14 | 0.27 |
| 7 | 660 | 2 | 0.04 | 0.549 |
| 8 | 660 | 2 | 0.14 | 0.723 |
| No. | v (m/min) | ap (mm) | fz (mm/tooth) | Ra Med (μm) |
|---|---|---|---|---|
| 1 | 495 | 2 | 0.04 | 0.235 |
| 2 | 495 | 2 | 0.06 | 0.254 |
| 3 | 495 | 2 | 0.08 | 0.266 |
| 4 | 495 | 2 | 0.11 | 0.325 |
| 5 | 495 | 2 | 0.14 | 0.250 |
| 6 | 495 | 2.5 | 0.04 | 0.234 |
| 7 | 495 | 2.5 | 0.06 | 0.247 |
| 8 | 495 | 2.5 | 0.08 | 0.240 |
| 9 | 495 | 2.5 | 0.11 | 0.303 |
| 10 | 495 | 2.5 | 0.14 | 0.322 |
| 11 | 495 | 3 | 0.04 | 0.226 |
| 120 | 660 | 3.5 | 0.14 | 0.529 |
| 121 | 660 | 4 | 0.04 | 0.565 |
| 122 | 660 | 4 | 0.06 | 0.590 |
| 123 | 660 | 4 | 0.08 | 0.526 |
| 124 | 660 | 4 | 0.11 | 0.550 |
| 125 | 660 | 4 | 0.14 | 0.561 |
| Source | DF (Degree of Freedom) | Contribution | ||||
|---|---|---|---|---|---|---|
| Taguchi | Central Composite Design | Taguchi | p | Central Composite Design | p | |
| Regression | 7 | 7 | 99.85% | 0.078 | 88.93% | 0.000 |
| Cutting Speed (A) | 1 | 1 | 94.00% | 0.270 | 85.53% | 0.283 |
| Cutting Depth (B) | 1 | 1 | 0.76% | 0.455 | 0.00% | 0.017 |
| Feed per Tooth (C) | 1 | 1 | 0.02% | 0.179 | 1.00% | 0.193 |
| A x B | 1 | 1 | 2.44% | 0.345 | 2.06% | 0.003 |
| A x C | 1 | 1 | 1.43% | 0.159 | 0.00% | 0.154 |
| B x C | 1 | 1 | 0.26% | 0.278 | 0.07% | 0.148 |
| A x B x C | 1 | 1 | 0.95% | 0.238 | 0.27% | 0.094 |
| Error | 1 | 118 | 0.15% | - | 11.07% | - |
| Total | 8 | 125 | 100.00% | - | 100.00% | - |
| No | A | B | C | Ra (measured) | Ra Taguchi (calculated) | Ra Central Composite Design (calculated) | Relative Error εx[%] | |
|---|---|---|---|---|---|---|---|---|
| εx Taguchi | εx Central Composite Design | |||||||
| 1 | 495 | 2 | 0.04 | 0.235 | 0.270 | 0.288 | 15% | 23% |
| 2 | 495 | 2 | 0.06 | 0.254 | 0.264 | 0.279 | 4% | 10% |
| 3 | 495 | 2 | 0.08 | 0.266 | 0.258 | 0.269 | 3% | 1% |
| 4 | 495 | 2 | 0.11 | 0.325 | 0.249 | 0.256 | 23% | 21% |
| 5 | 495 | 2 | 0.14 | 0.250 | 0.240 | 0.242 | 4% | 3% |
| 6 | 495 | 2.5 | 0.04 | 0.234 | 0.284 | 0.315 | 21% | 34% |
| 7 | 495 | 2.5 | 0.06 | 0.247 | 0.277 | 0.305 | 12% | 23% |
| 8 | 495 | 2.5 | 0.08 | 0.240 | 0.270 | 0.295 | 12% | 23% |
| 9 | 495 | 2.5 | 0.11 | 0.303 | 0.259 | 0.280 | 14% | 8% |
| 10 | 495 | 2.5 | 0.14 | 0.322 | 0.249 | 0.265 | 23% | 18% |
| 11 | 495 | 3 | 0.04 | 0.226 | 0.297 | 0.341 | 32% | 51% |
| 121 | 660 | 4 | 0.04 | 0.565 | 0.578 | 0.891 | 2% | 58% |
| 122 | 660 | 4 | 0.06 | 0.590 | 0.574 | 0.830 | 3% | 41% |
| 123 | 660 | 4 | 0.08 | 0.526 | 0.570 | 0.770 | 8% | 46% |
| 124 | 660 | 4 | 0.11 | 0.550 | 0.563 | 0.679 | 2% | 24% |
| 125 | 660 | 4 | 0.14 | 0.561 | 0.557 | 0.589 | 1% | 5% |
| Cutting Speed [m/min] | Medium Error Taguchi [%] | Medium Error Central Composite Design [%] |
|---|---|---|
| 495 | 16% | 26% |
| 530 | 28% | 48% |
| 570 | 36% | 28% |
| 610 | 21% | 10% |
| 660 | 8% | 23% |
© 2020 by the authors. Licensee MDPI, Basel, Switzerland. This article is an open access article distributed under the terms and conditions of the Creative Commons Attribution (CC BY) license (http://creativecommons.org/licenses/by/4.0/).
Share and Cite
Țîțu, A.M.; Sandu, A.V.; Pop, A.B.; Țîțu, Ș.; Frățilă, D.N.; Ceocea, C.; Boroiu, A. Design of Experiment in the Milling Process of Aluminum Alloys in the Aerospace Industry. Appl. Sci. 2020, 10, 6951. https://doi.org/10.3390/app10196951
Țîțu AM, Sandu AV, Pop AB, Țîțu Ș, Frățilă DN, Ceocea C, Boroiu A. Design of Experiment in the Milling Process of Aluminum Alloys in the Aerospace Industry. Applied Sciences. 2020; 10(19):6951. https://doi.org/10.3390/app10196951
Chicago/Turabian StyleȚîțu, Aurel Mihail, Andrei Victor Sandu, Alina Bianca Pop, Ștefan Țîțu, Dragos Nicolae Frățilă, Costel Ceocea, and Alexandru Boroiu. 2020. "Design of Experiment in the Milling Process of Aluminum Alloys in the Aerospace Industry" Applied Sciences 10, no. 19: 6951. https://doi.org/10.3390/app10196951
APA StyleȚîțu, A. M., Sandu, A. V., Pop, A. B., Țîțu, Ș., Frățilă, D. N., Ceocea, C., & Boroiu, A. (2020). Design of Experiment in the Milling Process of Aluminum Alloys in the Aerospace Industry. Applied Sciences, 10(19), 6951. https://doi.org/10.3390/app10196951