1. Introduction
Modern products do not perform only one single function. While a product’s main function may be performed sufficiently, consumers’ evaluations of products in the market could be affected by their perception of how additional or secondary functions of the product perform. For example, in the case of a phone, the first function of calling has been developed into a mobile phone with the second function of “portability,” and the third and fourth functions of the Internet and cameras have been included to reach the current form of a smartphone. Different smartphones in the market have different performance distributions for functions in the product, and consumers’ preferences change depending on the distribution. In other words, quantitative and qualitative increases in product functions begin with the needs of the customer, and thus the importance of understanding these needs has become more important. This change is more apparent when looking at how products are distinguished in the marketing field. Moriarty and Kosnik set a product on two axes, technical uncertainty and market uncertainty [
1] (
Figure 1): technical uncertainty refers to the technical level required by the user and market uncertainty refers to the level of demand due to emotional factors rather than functions. While the preference for a single-function product is divided by the performance comparison of a single function, companies developing multifunctional products need to focus their resources on products that satisfy a multitude of consumers’ preferences. In other words, compared with single-function products, these products must satisfy customers’ requirements for each individual function as well as perform various functions. These functions have more variables because they may conflict with each other or be flexible by constraint requirements, increasing market uncertainty. For a single-function product, the objective is to maximize the performance (i.e., customer satisfaction) of the required function with a price and size that the customer could accept, and for a multifunctional product, the customer’s satisfaction depends on how a given total resource (constraints) would be distributed to each performance aspect. In this study, the importance of each function for a multifunctional product, as related to engineering design, is derived and quantified.
When a customer’s various needs are brought into the design domain, each performance of the multifunctional product has different dimensions, so a direct comparison is impossible. In other words, it is impossible to objectively compare what performance is focused on within a limited resource to create higher user value. To solve this problem, a dimensionless index is needed that can connect different dimensions. In this study, the satisfaction extracted from the review is set as a dimensionless index. By extracting satisfaction from user review and linking it with quantitative performance, the development direction is presented so that designers can design a product to maximize its value.
2. Conceptual Background
2.1. Product Development Process
Product development is carried out in the following order: Planning–Concept Design–Design–Test–Manufacturing, as shown in
Table 1 [
2]. In recent years, due to the segmentation of each role and the sophistication of each stage, different parts have been performing their roles separately at each stage. The conversion of this process to show an engineer’s point of view is indicated in
Figure 2.
Product design involves identifying the characteristics required by the user, “Customer Attributes” (CA), and setting up “Functional Requirements” (FRs), and “Design Parameters” (DPs) for functional implementation [
3]. Design is the process of mapping the relationship between FR and DP and has been actively studied through methodologies such as axiomatic design. Recent products require a more delicate approach to the relationship between CA and FR, as user demand characteristics have changed. For example, there is a greater demand for diversification of functions and increased emotional needs of users. Previously, CA and FR were thought of using the House of Quality (HOQ) methodology [
4,
5] and the Delphi technique [
6,
7], but these methods depend on engineers’ intuitions, and there is a risk of distortion or misunderstanding.
The existing product development method defines design requirements (FR) based on the judgment of the engineer. It will also determine the importance of each FR and, at the same time, establish a relative product design requirement by comparing the performance of competing products. Each of these processes is independent and lacks connectivity. Because there is no objective and integrated index or method that can be used in the entire product development process, errors in each step can be combined to present the wrong development direction. In addition, for multi-functional products, the engineers responsible for each function may be different, and decision making may be difficult due to the lack of an objective comparison of each performance. This is why we need an index that can quantitatively and objectively compare all performances and, in view of the complex user needs, this needs to be extracted directly from the user base, not from the intuition of the engineer.
2.2. Online Reviews
As mentioned in
Section 2.1, the direct extraction of CA is very important because it is the starting point for establishing a suitable development direction. This is because valid FRs can be derived and further affect the DP in the design phase. Its importance has been further enhanced by diversified competitive products and complicated user needs. When various functions are embedded within a single product, it becomes more important to accurately identify the customers’ needs in order to distribute performance in a product. Various studies have attempted to understand customers’ needs related to product developments. The methods used include face-to-face surveys that directly ask customers’ opinions, non-face-to-face surveys, and indirect customer demand verification through comparative evaluations of competing products. There are pros and cons to each of these methods. In the case of face-to-face surveys, the disadvantage is that they are costly and time consuming. These shortcomings make them difficult to perform repeatedly and frequently. In addition, there is concern about bias when selecting a survey subject that is not representative, because of the small number of samples. One advantage is being able to understand customer opinions in detail. Conversely, in the case of online surveys, they are more cost-effective and time-efficient compared to face-to-face surveys, but only responses to the survey questionnaire can be identified, which can lead to significant differences in results depending on the survey design, and it is difficult to identify causal relationships. A number of studies have confirmed that the two methods are somewhat lacking in reliability or depth of investigation, as participation is often due to compensation rather than voluntary participation by customers [
8,
9].
Recently, there have been studies using online reviews from customers to overcome the limitations of the other survey methods. Online reviews are sentences or paragraphs that users formulate to post their opinions about the product after using it on the Internet, which can be collected from a community, forum, or blog. Online reviews have an efficiency and reliability advantage compared to the aforementioned methods [
10]. First, they have an edge in terms of the reliability of the reviews because they are based on voluntary participation. In addition, when research methodologies related to big data and natural language processing are introduced, the risk of bias and reliability is reduced by using overwhelmingly more samples than other types of surveys [
11]. Based on natural language processing techniques and big data, Dedy and Harrison used these advantages to examine users’ use environment through customer reviews [
12] and, in other studies, they extracted consumers’ choice sets based on reviews [
13]. In addition, Park and On classified topics in reviews and conducted an analysis to quantitatively extract consumers’ emotional evaluations of product reviews [
14].
For basic online review analysis, the process is carried out in the following order: collection–preprocessing–analysis. An overview is shown in
Figure 3. This involves collecting a number of reviews and doing preprocessing work, such as deleting unused words and dismantling sentences from reviews. In the analysis stage, text mining techniques are used to check the frequency of vocabulary appearance; sentimental analysis [
15] is performed using machine learning or positive/negative vocabulary dictionaries. Sentimental analysis is one of the methods of opinion mining, which sorts out the positive and negative opinions of sentences and extracts the author’s opinions. There are ways to utilize mechanical learning and pre-based methods. The dictionary-based method is used to extract the sensibility of a sentence by using the emotional vocabulary dictionary to express a specific emotion, and the method using machine learning is used to label the emotion in some sentences to form a training set, and analyze the sensibility of the sentence using the machine learned from it [
16,
17]. Embedding techniques are also used to identify associations or similarities between words [
18].
3. Methodology
Based on the basic information that can be obtained through online review analysis, this section defines an index that can be used in design and proposes ways to utilize it.
3.1. Functional Importance
In online reviews, customers refer to characteristics or performance aspects that they consider important, which can be considered those that are universally required by the market. In the case of mass-produced products, it is more efficient to aim for the universal satisfaction of a customer group, rather than that of specific customers. Therefore, if you check the vocabulary and quantity of the performance of multifunctional products from a number of online reviews, you can identify what is considered important by the market, and you can define the importance index (I) as shown in Equation (1) below.
is the importance of function
x, which means the frequency of words about function
x. This can be obtained by dividing the number of words associated with function
x by the sum of all performance-related vocabularies.
The importance index (I) has a value of 1 in the case of a single-function product and a lower value for multifunctional products. In order to intuitively check the importance, it can be confirmed by comparing the equally distributed importance (the reciprocal of the total number of performance groups).
3.2. Functional Satisfaction
User reviews basically correspond to product evaluations. In other words, each review can be classified as a positive/negative/neutral reaction to a function. These classifications can represent customer or market evaluations of product performance, especially as the number of samples analyzed increases. In fact, in ergonomics, dimensions, sizes, and the usability of products are designed under the condition of satisfying more than a certain percentage of all users. This concept was introduced as “satisfaction”. The higher the frequency of positives for the function, the more users make positive evaluations. Conversely, the higher the frequency of negatives, the more users make negative evaluations. As mentioned above, it is appropriate for mass-produced products to target a large number of users rather than maximizing individual satisfaction, so the positive/negative frequency for the whole is used as an index representing satisfaction. We set the difference in the frequency of positive and negative opinions of all users as a representative index, and this was defined as a satisfaction index (SI) representing the satisfaction of performance, as follows.
S is the satisfaction index of function
x, which is the difference between the ratio of positive reviews (
) and negative reviews (
), with the exception of neutral reviews.
Reviews without positive/negative opinions indicate that everyone has a neutral assessment; therefore, the denominator of the above expression (Equation (2)) is zero and satisfaction cannot be extracted. In practice, this does not extract satisfaction because it can be seen that the user is neutral about a performance that is simply listed without evaluation. Except where applicable, the performance satisfaction (SI) will be between −1 and 1. The closer to 1, the more satisfied all users are with the performance, and the closer to −1, the more dissatisfied all users are.
3.3. Product Satisfaction Index
Section 3.1 and
Section 3.2 define the importance and satisfaction of specific performance aspects of a product through the analysis of the frequency of performance vocabulary and the analysis of emotion using performance vocabulary. As previously mentioned, product development is evolving to pursue a diversity of functions. Therefore, the satisfaction of multifunctional products can be extracted based on the importance of each function and users’ satisfaction with that function. In other words, assuming that the satisfaction level of the product is expressed by the sum of the satisfaction level of the performance, the satisfaction level of the product can be expressed as follows:
The satisfaction level of the entire product (PSI) will also have a value between −1 and 1. If performance is 100% satisfactory, the value of 1 will be the same regardless of materiality, and if performance is unsatisfactory, the value will be −1. According to Equation (3), an unsatisfactory performance will have a negative contribution to the overall performance. In other words, if the function can be removed in context, it can be considered to relieve the pressure on the limiting requirements and increase the satisfaction of other performances. Conversely, if a large amount of resources have been invested in the performance and the performance has been improved for subsequent products, a greater increase in user satisfaction can be achieved.
When importance and satisfaction are taken into account at the same time, strategic choices for product performance distributions are made. For example, if there is no positive/negative opinion (S = 0), but that function has a large I, it will be efficient in improving the function. In addition, conflicts between compatible performance may arise when considering the limiting requirements of the product. In such cases, giving priority to performances with higher I values is effective in increasing overall satisfaction.
As shown above, quantifying importance (I), satisfaction (S), and satisfaction of the entire product (PSI) can quantitatively indicate customers’ opinions of importance and satisfaction. This enables the determination of a product’s strengths and weaknesses in the distribution method of performance when companies are working within resource constraints and planning marketing for their products. It can be seen that, within engineering design, this is an indicator that can be used not only for decision making about multifunctional design, but also for decision making in other areas.
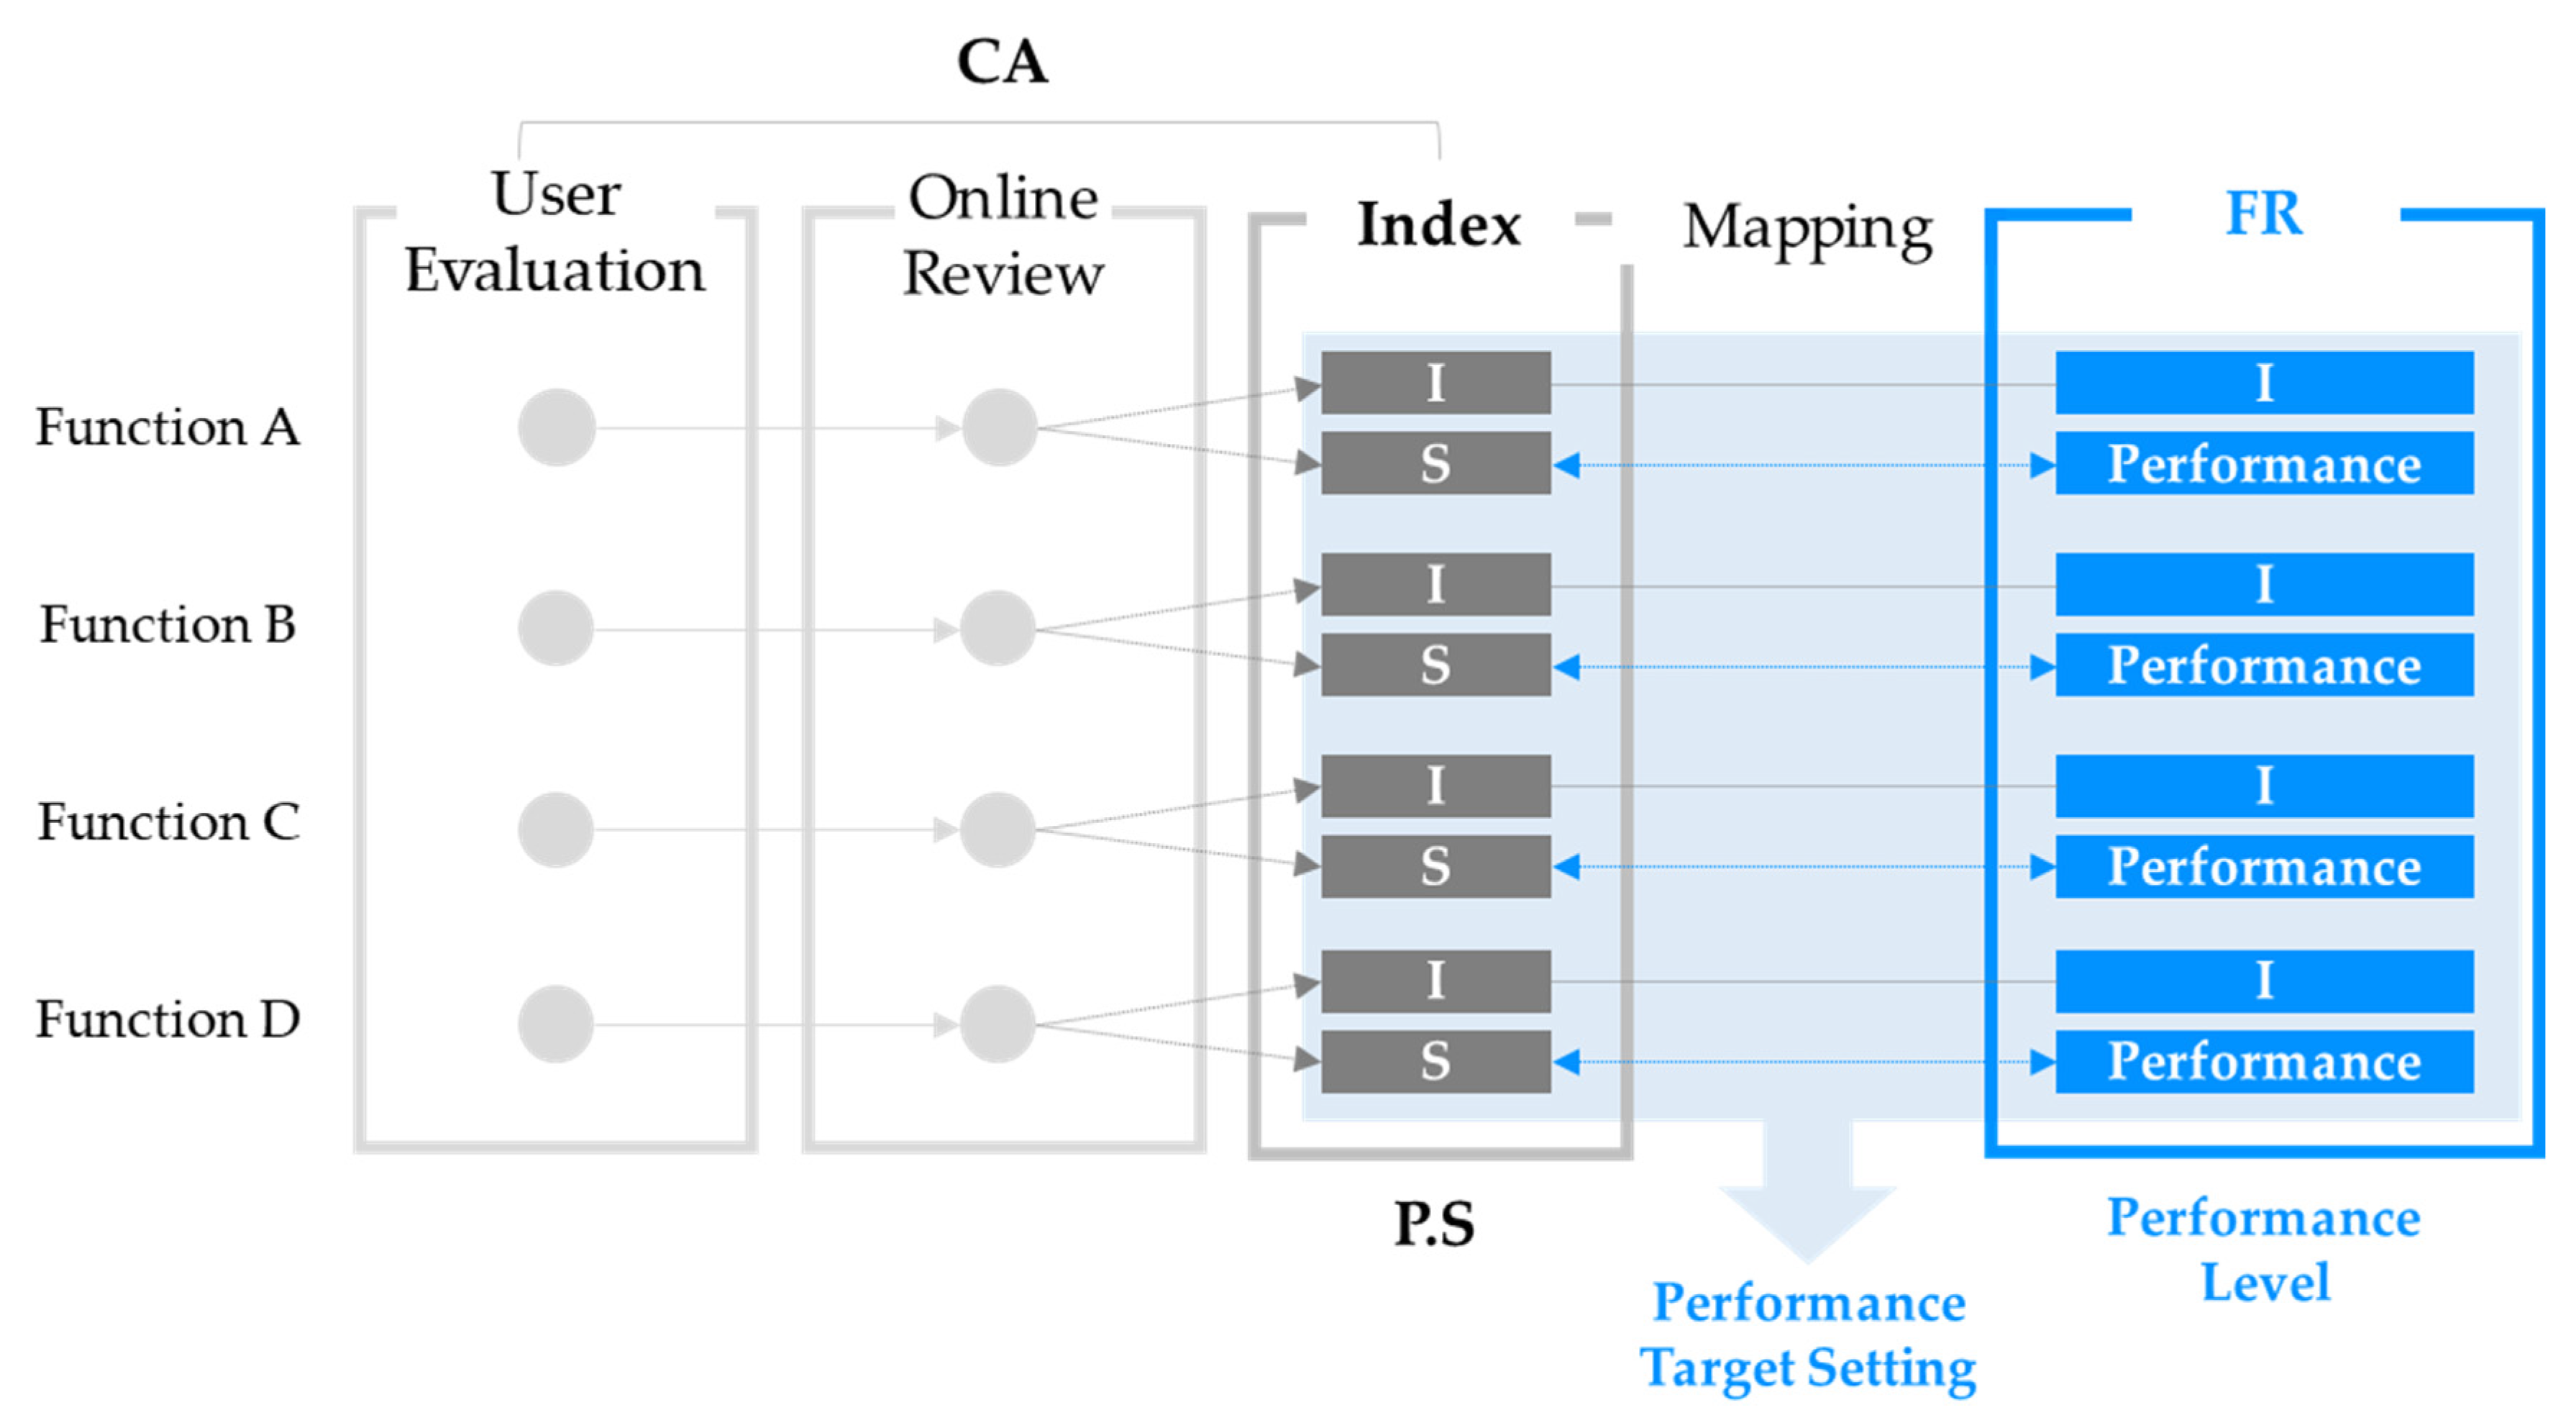
3.4. Relationship between Quantitative Performance and Satisfaction Index
This section establishes a correlation between performance and satisfaction by mapping the previously indexed user satisfaction with quantitative performance. The relationship between performance and satisfaction can be seen when the reference probability and satisfaction for each performance aspect corresponding to the CA are connected by the importance and performance of the aspects, respectively (
Figure 4). The performance objectives are set in
Section 3.5 through the relationship between the satisfaction with and performance of each product line present in the market.
3.5. Target Setting with S and I
When setting performance goals for a single-function product, the function of the product should be satisfactory to many users. That is, S must be greater than or equal to zero. According to a previous study, a review is followed up in a way that strengthens positivity or negativity [
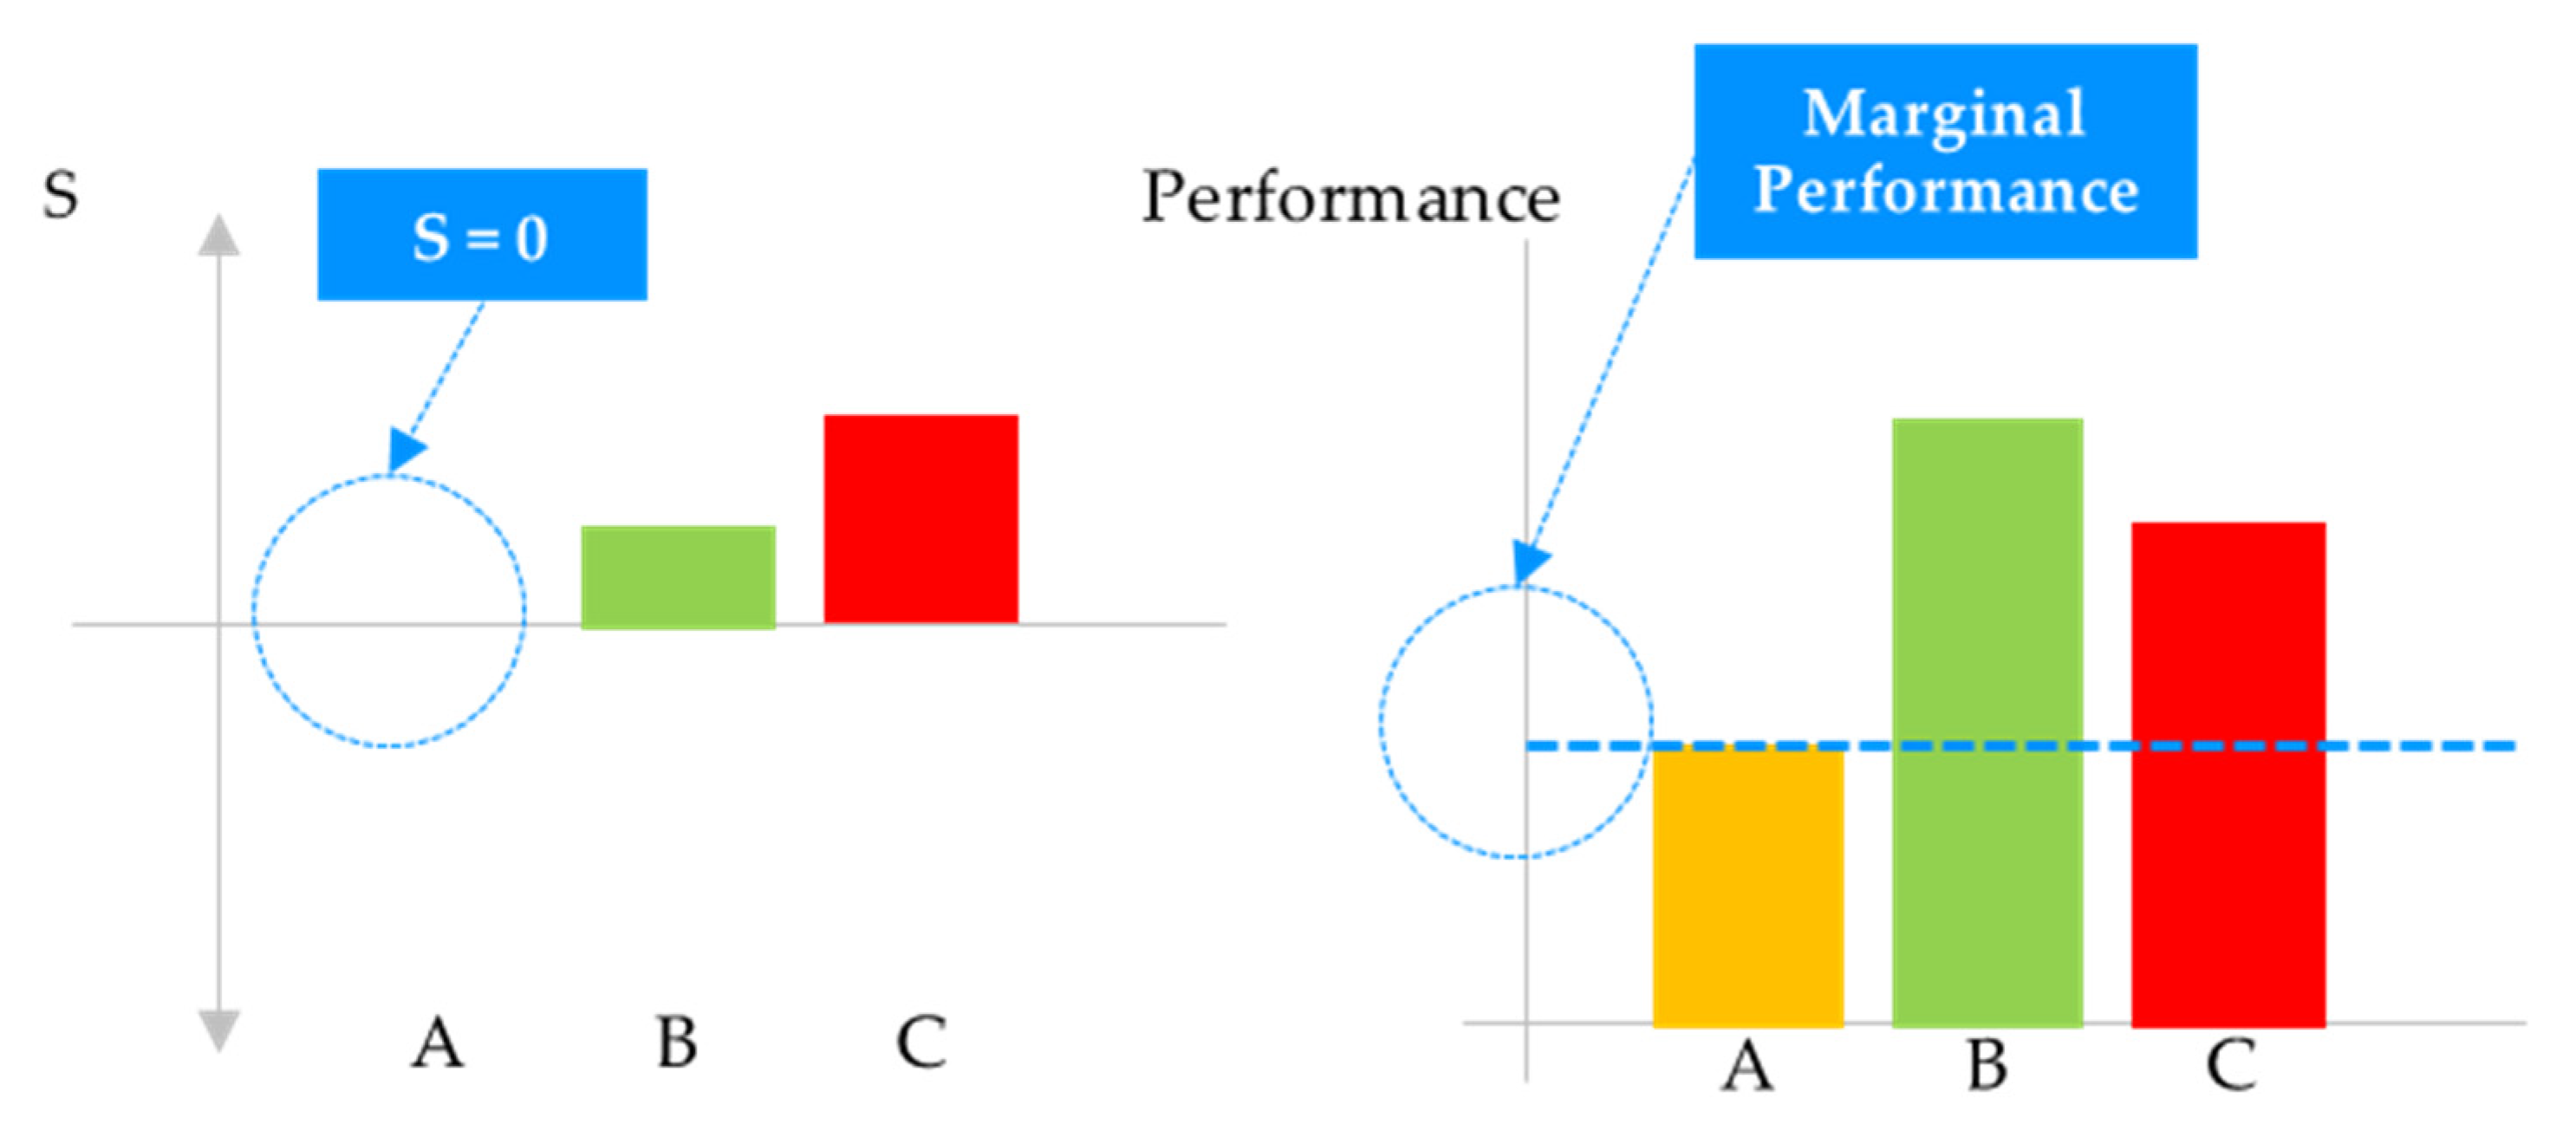
19]. Therefore, if negative opinions have dominant negative satisfaction, the perception of the product becomes worse. This is also because negative levels of satisfaction with the performance will adversely affect the overall satisfaction, and it is reasonable to want to prevent this. However, for the latest products, there are limitations that accompany a variety of functions in a single product, and, therefore, the set target satisfaction levels will be zero (i.e., the level at which the performance does not adversely affect the overall satisfaction of the product). This can be used as the minimum target satisfaction level that the product should have. As shown in
Figure 5, the specific performance of Product A is S = 0. This means that Product A’s performance does not have a positive or negative impact on the overall satisfaction of the product, and that setting this level allows the saved resources to be utilized to increase other performance aspects. For engineering design use, satisfaction (S) and performance level must be mapped after finding the critical point (S = 0). The proper performance-level target is the same as the performance level of Product A because S = 0. This can be the marginal performance level of the market.
Conversely, the upper limit of the product performance target maximizes customer satisfaction. However, it is not necessary to exceed the user’s threshold if we consider profit and limitations. In other words, it is appropriate to set an upper limit on product performance by referring to (1) performance increase when comparing products in the market but not satisfaction level, or (2) performance increase, but decrease as the satisfaction level decreases. From an economic perspective, increased performance causes increased costs. This means that investments have been made to increase performance, but that users’ satisfaction has not increased. This is not an appropriate choice because it is not cost-effective from an economic perspective.
Figure 6 shows the process of setting the above product target upper limit. In summary, this can be identified by linking S with the representative quantitative figures of performance to levels that the majority of users will not be dissatisfied with, and areas that users will not recognize even if performance improvements are within reasonable performance level targets.
4. Case Study
We apply the above proposed product development theory to a representative multifunctional vehicle to confirm its suitability. The target product group is a subcompact SUV from the South Korean market that collected community/forum/expert reviews (19,338 posts) for three products released in the first half of 2019. We extract the previously defined “satisfaction” and “importance” and link them to quantitative performance. Examples of extracting index from reviews are as follows. Posts stating that “road noise and wind noise were relatively well blocked” posted on the community were collected. Then, we confirmed that each review was related to noise and vibration through “sound” and classified positive opinions through the expression “well blocked”. In this way, 19,338 postings were analyzed using a machine. The quantitative performance of the product was not directly measured, so we used quantitative figures published by Consumer Reports in the U.S. [
20]. For handling (avoidance maneuver maximum speed), acceleration “miles per hour” (MPH), fuel economy “miles per gallon” (MPG), and roominess (inches, sum of first and second law, and head/leg/shoulder room), where quantitative performance can be verified, the satisfaction–performance relationships are shown in
Figure 7.
It can be seen that the correlation between each performance category and satisfaction is a valid figure considering that it is a social phenomenon of more than 0.5. Handling has a lower satisfaction for vehicles with the highest avoidance maneuver maximum speed, and the same aspect is observed for acceleration. Acceleration has a lower acceleration as the number increases, indicating that performance and satisfaction have a positive correlation. It can be seen that fuel economy and roominess have the same aspect. In addition, the performance level of each category with a satisfaction of one (fuel economy: 26 MPG, roominess: 184 inches) can be checked for maximum performance from a user satisfaction perspective.
In addition to the satisfaction–performance relationship, we identified the amount of references in the reviews to representative performance. The purpose of this example was to identify important performance and satisfaction information within the market before the release of “Product D” (January–June 2019) and to indirectly demonstrate that the index and methodology presented in this study are valid by ensuring that the product released has been designed to meet the needs of the market previously analyzed. The number of reviews about “Product D” was 17,378.
First,
Figure 8 refers to each performance category of major vehicles in the South Korea subcompact SUV market in the first half of 2019. These data can be seen as key characteristics of users for subsequent developers of products to refer to, and they exemplify the importance of the function defined in this study. In the following order, noise, fuel economy, trunk space, and roominess are the most important. In particular, in the case of noise and vibration, the negatives are more dominant, hampering the overall satisfaction in the market. This can also be confirmed through the satisfaction levels shown in
Figure 9. In other words, if a product is improved in terms of maximizing satisfaction in the market, improvements should be focused on decreasing noise, and increasing fuel economy, trunk space, and roominess; reducing dissatisfaction with noise is especially important. These points are summarized in
Table 2.
The volume of performance words and the satisfaction with “Product D”, released in the second half of 2019, are expressed in
Figure 10 and
Figure 11. First, we confirmed that the percentage of performance references is significantly the same at the 95% confidence level. In other words, products that were released subsequently follow the same market characteristics. The results show that satisfaction improved in the categories of noise and vibration and the satisfaction with roominess and trunk space increased. Through these results, it has been confirmed that improvements in performance that are of high importance to the market can lead to increased customer satisfaction (
Table 3). In addition, Product D has the highest level of satisfaction among the four major competitors in the market (
Table 4), and its market share is also ranked first (41%), confirming its successful entry into the market.
5. Discussion
Existing studies have been aimed at eliciting valuable information from online reviews [
21,
22,
23]. The information extracted can help develop qualitative information, but it is somewhat abstract for use in actual product development. In this study, the results of preceding studies were quantified for use in product design, and the quantified satisfaction was connected to product performance to set the product performance level and performance distribution of multi-functional products.
The aforementioned case study shows that users’ “satisfaction” and “performance” are correlated as defined in this study. In many performance aspects, they had a positive correlation, but a negative correlation for handling performance. This shows that handling does not directly affect customer satisfaction, as identified by the Kano model, and it is valid to increase (improve) the satisfaction of other performance aspects rather than handling. In fact, for a vehicle, handling has a tradeoff relationship with the ride, which makes it more effective to improve the performance of the ride than handling. In fact, the previous case study’s “Product D” had a higher ride effectiveness/importance versus the market mean and a lower handling detection/importance (
Figure 12).
6. Conclusions
In this study, we proposed a method to quantify customer needs by utilizing online reviews to clarify customer demand characteristics and functional needs from a company’s perspective at the product development stage. A customer’s needs can be quantified by the importance and satisfaction with each function of a multifunctional product, and the quantified satisfaction through these indices correlates with the actual performance of the product. Based on these correlations, user satisfaction/quantitative performance objectives can be established, and the importance of each performance aspect identified in the case study enables the user-oriented performance distribution of multifunctional products. Using these methods, companies can prioritize designing products that reflect the characteristics preferred by consumers, and practical design tools can be combined with other existing design theories such as utilitarian design. In this way, the accuracy of existing customer demand survey methods can be further enhanced by using big data technology. However, this study provides a direction for the improvement of existing products, and only examples of such areas have been verified. With respect to product innovation, it is necessary to present new methodologies through further research.
Author Contributions
Conceptualization, S.W.K. and K.L.; methodology, S.W.K. and K.L.; software, K.L.; validation, K.L.; formal analysis, S.W.K.; investigation, S.W.K.; data curation, S.W.K.; writing—original draft preparation, S.W.K.; writing—review and editing, S.W.K. and J.S.S.; visualization, S.W.K. and J.S.S.; supervision, S.W.C.; funding acquisition, S.W.C. All authors have read and agreed to the published version of the manuscript.
Funding
This research received no external funding.
Conflicts of Interest
The authors declare no conflict of interest.
References
- Moriarty, R.T.; Kosnik, T.J. High-tech marketing: Concepts, continuity, and change. Sloan Manag. Rev. 1989, 30, 7. [Google Scholar]
- Ulrich, K.T. Product Design and Development; Hanol Publishing Company: Hanoi, Vietnam, 2003. [Google Scholar]
- Suh, N.P. The Principle of Design; Oxford University Press: Oxford, UK, 1990. [Google Scholar]
- Akao, Y. Quality Function Deployment; Taylor & Francis: London, UK, 2004. [Google Scholar]
- Akao, Y. Development History of Quality Function Deployment. The Customer Driven Approach to Quality Planning and Deployment; Asia Productivity Organization: Tokyo, Japan, 1994. [Google Scholar]
- Hsu, C.-C.; Sandford, B.A. The Delphi Technique: Making sense of consensus. Pract. Assess. Res. Eval. 2007, 12. [Google Scholar] [CrossRef]
- Ishikawa, A.; Amagasa, M.; Shiga, T.; Tomizawa, G.; Tatsuta, R.; Mieno, H. The max-min Delphi method and fuzzy Delphi method via fuzzy integration. Fuzzy Sets Syst. 1993, 55, 241–253. [Google Scholar] [CrossRef]
- Lim, S.; Tucker, C.S. Mitigating Online Product Rating Biases Through the Discovery of Optimistic, Pessimistic, and Realistic Reviewers. J. Mech. Des. 2017, 139, 11. [Google Scholar] [CrossRef]
- Jiang, H.; Kwong, C.K.; Yung, K.L. Predicting Future Importance of Product Features Based on Online Customer Reviews. J. Mech. Des. 2017, 139, 11. [Google Scholar] [CrossRef]
- Ponathil, A.; Gramopadhye, A.; Chalil Madathil, K. Decision Aids in Online Review Portals: An Empirical Study Investigating Their Effectiveness in the Sensemaking Process of Online Information Consumers. Multimodal Technol. Interact. 2020, 4, 32. [Google Scholar] [CrossRef]
- Decker, R.; Trusov, M. Estimating aggregate consumer preferences from online product reviews. Int. J. Res. Mark. 2010, 27, 93–307. [Google Scholar] [CrossRef]
- Baek, J.; Choe, Y. Differential Effects of the Valence and Volume of Online Reviews on Customer Share of Visits: The Case of US Casual Dining Restaurant Brands. Sustainability 2020, 12, 5408. [Google Scholar] [CrossRef]
- Suryadi, D.; Kim, H.M. A Data-Driven Methodology to Construct Customer Choice Sets Using Online Data and Customer Reviews. J. Mech. Des. 2019, 141, 11103. [Google Scholar] [CrossRef]
- Park, S.-M.; On, B.-W. Latent topics-based product reputation mining. J. Intell. Inf. Syst. 2017, 23, 128–131. [Google Scholar] [CrossRef]
- Chen, W.; Xu, Z.; Zheng, X.; Yu, Q.; Luo, Y. Research on Sentiment Classification of Online Travel Review Text. Appl. Sci. 2020, 10, 5275. [Google Scholar] [CrossRef]
- Clarizia, F.F.; Lombardi, C.M. A Sentiment Analysis Approach for supporting Blended Learning Process. In Proceedings of the DMSVIVA 2018: 24th International DMS Conference on Visualization and Visual Languages, San Francisco Bay, CA, USA, 29–30 June 2018; pp. 8–14. [Google Scholar]
- Clarizia, F.; Colace, F. Sentiment Analysis in Social Networks: A Methodology Based on the Latent Dirichlet Allocation Approach. In Proceedings of the 11th Conference of the European Society for Fuzzy Logic and Technology (EUSFLAT 2019), Prague, Czech Republic, 9–13 September 2019; pp. 241–248. [Google Scholar]
- Sutherland, I.; Sim, Y.; Lee, S.K.; Byun, J.; Kiatkawsin, K. Topic Modeling of Online Accommodation Reviews via Latent Dirichlet Allocation. Sustainability 2020, 12, 1821. [Google Scholar] [CrossRef]
- Wang, H.; Wang, Y. A Review of Online Product Reviews. J. Serv. Sci. Manag. 2020, 13, 88–96. [Google Scholar] [CrossRef]
- Consumer Reports. Available online: https://www.consumerreports.org (accessed on 3 July 2020).
- Kumar, P.; Tandon, P. A paradigm for customer-driven product design approach using extended axiomatic design. J. Intell. Manuf. 2016, 30, 589–603. [Google Scholar] [CrossRef]
- Qian, L. Product price and performance level in one market or two separated markets under various cost structures and functions. Int. J. Prod. Econ. 2011, 131, 505–518. [Google Scholar] [CrossRef]
- Bi, J.-W.; Liu, Y.; Fan, Z.-P.; Cambria, E. Modelling customer satisfaction from online reviews using ensemble neural network and effect-based Kano model. Int. J. Prod. Res. 2019, 57, 7068–7088. [Google Scholar] [CrossRef]
Figure 1.
Product classification according to technical/market uncertainty.
Figure 1.
Product classification according to technical/market uncertainty.
Figure 2.
Areas of product development process.
Figure 2.
Areas of product development process.
Figure 3.
Overview of online review analyzing process.
Figure 3.
Overview of online review analyzing process.
Figure 4.
Relationship between satisfaction and performance in product development process.
Figure 4.
Relationship between satisfaction and performance in product development process.
Figure 5.
Method for setting up marginal performance target by comparing satisfaction index (SI) to engineering performance.
Figure 5.
Method for setting up marginal performance target by comparing satisfaction index (SI) to engineering performance.
Figure 6.
Method for setting up maximum performance target by comparing SI to engineering performance.
Figure 6.
Method for setting up maximum performance target by comparing SI to engineering performance.
Figure 7.
Relationship between satisfaction and several performance categories of subcompact SUV in South Korea: (A) handling; (B) acceleration; (C) fuel economy; (D) roominess.
Figure 7.
Relationship between satisfaction and several performance categories of subcompact SUV in South Korea: (A) handling; (B) acceleration; (C) fuel economy; (D) roominess.
Figure 8.
Amount of mentions for each performance aspect during the period from January to June 2019 (before the release of Product D).
Figure 8.
Amount of mentions for each performance aspect during the period from January to June 2019 (before the release of Product D).
Figure 9.
Market average satisfaction of each performance aspect.
Figure 9.
Market average satisfaction of each performance aspect.
Figure 10.
Amount of mentions for each performance aspect of “Product D”, released in the second half of 2019.
Figure 10.
Amount of mentions for each performance aspect of “Product D”, released in the second half of 2019.
Figure 11.
Satisfaction for each performance aspect of “Product D”, released in the second half of 2019.
Figure 11.
Satisfaction for each performance aspect of “Product D”, released in the second half of 2019.
Figure 12.
Importance and satisfaction of ride and handling in South Korean subcompact SUV market.
Figure 12.
Importance and satisfaction of ride and handling in South Korean subcompact SUV market.
Table 1.
Product development process.
Table 1.
Product development process.
| | Planning | Concept Design | Design | Test |
|---|
| MKTG 1 | Market analysis | Collect user voice | Set MKTG plan | Enhance field test |
| Design | Structure study
Technology study | Concept study
Prototyping | Structure design (shape/material) | Check performance |
| MFG 2 | Supply chain build
Check restriction | Set MFG cost | Tool design
Define MFG process | Set assemble plan
Start supply |
Table 2.
Importance index (I), satisfaction (S), and SI of each performance aspect in the South Korean subcompact SUV market.
Table 2.
Importance index (I), satisfaction (S), and SI of each performance aspect in the South Korean subcompact SUV market.
| Index | Noise | Vibration | Ride | Handling | Accel. | FE | Room | Trunk |
|---|
| I | 0.29 | 0.10 | 0.03 | 0.05 | 0.08 | 0.24 | 0.09 | 0.13 |
| S | −0.96 | −0.92 | 0.60 | 0.73 | 0.34 | 0.96 | 0.65 | 0.80 |
| S*I | −0.28 | −0.09 | 0.02 | 0.03 | 0.03 | 0.23 | 0.06 | 0.11 |
| P.S1 | 0.11 |
Table 3.
I, S, and SI of each performance aspect for “Product D”.
Table 3.
I, S, and SI of each performance aspect for “Product D”.
| Index | Noise | Vibration | Ride | Handling | Accel. | FE | Room | Trunk |
|---|
| I | 0.21 | 0.05 | 0.04 | 0.04 | 0.08 | 0.22 | 0.14 | 0.21 |
| S | −0.92 | −0.61 | 0.95 | 0.64 | 0.84 | 0.98 | 0.94 | 0.73 |
| S*I | −0.20 | −0.03 | 0.04 | 0.03 | 0.07 | 0.22 | 0.13 | 0.15 |
| P.S | 0.41 |
Table 4.
Product satisfaction in the South Korean subcompact SUV market.
Table 4.
Product satisfaction in the South Korean subcompact SUV market.
| Product | A | B | C | D |
|---|
| P.S | 0.36 | −0.10 | −0.11 | 0.41 |
© 2020 by the authors. Licensee MDPI, Basel, Switzerland. This article is an open access article distributed under the terms and conditions of the Creative Commons Attribution (CC BY) license (http://creativecommons.org/licenses/by/4.0/).


