1. Introduction
Over the years, as the concept of Smart Grids slowly became one of the highly discussed topics, certain needs and expectations on the whole meaning of such networks emerged. The whole idea of the concept is built up on a communication network that would allow a large number of connected nodes in various topologies to communicate and transmit important data about the power grid. This, via usage of devices on all structures of the power grid, should lead to a substantial improvement in stability, effectivity and higher safety of power generation, transmission and distribution processes [
1,
2,
3]. The concept also counts on the involvement of renewable energy sources in the power grid and higher level of energy demand management. Thus, the concept of Smart Grids is tightly associated with smart metering and the possibility of controlling different parts of the power grid as well [
4].
For enabling the possibility of measuring and controlling key points, a reliable bidirectional communication infrastructure has to be built along the important devices deployed on the power grid. Controlling the key points would allow the network operational centers to operate circuit breakers, indicate fault detection and could lead to better detection of unequal phase loads. Besides well-known, highly reliable technologies such as optical networks or microwave point-to-point links [
5], other types of technologies are being deployed. Therefore, the communication network has a heterogeneous character [
6,
7]. In remote areas, where the whole process of building up optical networks might not be cost-effective, alternative communication technologies are being used. Usually, cellular network communication technologies, or enabling communication on already established power lines by the technology called PLC (Powerline Communication), are used [
8,
9].
Powerline communication technologies are usually divided into two groups based on their operating frequencies [
10]:
Narrowband PLC (NB-PLC) operating in the frequency range 3–500 kHz, using ARIB, FCC or CENELEC bands.
Broadband PLC (BB-PLC) or Broadband over Power Lines (BPL) operating in the frequency range from 1.8 MHz up to 80 MHz. Bands are not strictly divided and are usually based on recommendations of respective standards and specifications—IEEE 1901, Homeplug specifications or G.hn.
Especially with demands of a sufficient level of cybersecurity, extra overhead caused by the securing mechanism should be expected. Thus, implementing technologies with sufficient throughput is vital [
11]. Adding features such as tunneling also causes significant overhead, which should be taken into account when planning Smart Grid infrastructures [
12].
1.1. Motivation—Why BPL?
Common communication technologies, such as cellular networks, sometimes deal with the limitation of increased attenuation due to the landscape profile. In built-up areas, problems related to communication, especially high attenuation levels under the ground level, and interference issues are experienced. Another drawback of cellular network solutions is the absolute dependence on services of the third party, therefore, ensuring a desired level of cybersecurity becomes more complicated.
Particularly, electric utilities consider the future of the Smart Grid concept in using power lines as communication media for reading out values of key measuring points in the power grid. Deployment of BPL technology would be beneficial due to the independence on telecommunication service providers and, thus, lower operational costs and own management over service operations when needed [
13]. As a primary communication technology, BPL is also being considered due to its sufficient throughput for enabling asymmetric cryptography and usage of certificates.
1.1.1. BPL for Transformer Substation Automation
In upcoming years, roll-outs of smart technologies such as AMM (Automated Meter Management), smart substations, sensoric systems and others are expected. On the level of substations, usage of the optical networks would be an ideal solution. However, in historical city centres, deployment of optical networks is complicated and slow. Sometimes radio frequency (RF) or BPL is the only possible solution. BPL would be used in this transition period until dense optical networks will cover all the substations in such areas. After that it can be turned into a backup communication channel for optical network outage maintenance, fiber cuts, etc.
Recent research [
14] has also introduced the possibility of analyzing powerline cable conditions and enabling detailed evaluation of the actual physical state of the interconnected nodes.
1.1.2. BPL on Medium Voltage (MV)
Distribution and transmission grids are being divided into two main groups based on the used topology—the radial grid topology and the mesh grid topology. The radial grid forms a tree where closed loops are being avoided. This topology is very simple and cheap, but when a line is being disconnected, power delivery to distant nodes is immediately interrupted. The mesh grid topology is based on closed loops where power might be delivered to nodes through different lines; thus, this topology performs with higher reliability through higher complexity and higher costs [
15,
16,
17]. The issue of performance and availability of the whole communication system depending on network topology is being further discussed in [
18,
19]. A BPL solution could be deployed in both segments of the power grid—LV (low voltage) and MV (medium voltage) [
20,
21]. In comparison, MV has more suitable communication channels due to the lower attenuation, time-invariant behavior and simplified network configurations without any branches and with less significant sources of noise.
On the other hand, in BPL networks on the LV, longer distances without repeaters are typical [
22], but in MV topologies the positions of repeaters are fixed. Those repeaters are deployed in every distribution substation, and it is also necessary to implement repeaters on both sides of a transformer due to its physical disconnection and galvanic isolation of the powerline [
23,
24]. For this reason, an absolute maximum communication distance cannot be achieved without a repeater, and it is necessary to count repeaters in every substation. BPL technology is being deployed mostly in the underground MV distribution substations, where it sometimes serves as the only possible way of communication. Based on the physical interconnections of MV distribution substations, managing the desired level of Quality of Service (QoS) and the impact of stream concurrence are important topics.
The impact of repeaters on communication parameters (throughput, latency and reliability of communication) is a key question. Therefore, the knowledge of impact of repeaters on throughput helps with network architecture planning before the massive deployment (roll-out).
The key parameters, indicating network performance of Smart Grids, are the communication availability and stability [
25]. For ensuring an adequate level of cybersecurity, in terms of substation automation as a part of the critical infrastructure, methods such as tunneling, usage of Virtual Private Networks (VPN), Access Point Names (APN), IPSec and Transport Layer Security (TLS) are usually involved. It is also crucial to take into acount demands on protocols with regard to availability and sufficient network throughput of such networks; thus, knowledge of the PLC repeater’s impact on network performance is vital.
The contribution of this article is two-fold. Firstly, research on the exact influence of a repeater’s operation on the network throughput is conducted, and values indicating throughput drop are discussed. Secondly, the topic of bottlenecks in linear topologies is a commonly discussed issue and is investigated through the usage of simulation. Simulations provide the times when multiple stream throughputs equalize over time with different influencing input values. Results obtained by measurements of real on-field topologies are used as input data for provided simulations. Outcomes of this paper should be helpful in further designs of complex Smart Grid networks based on powerline communication technology.
2. State of the Art
A standard power grid transmits energy from the power supply to end customers via high-voltage (HV) overhead lines, then MV lines and LV lines close to the final destination of energy consumption. In Smart Grids, CPEs (slaves) installed on a customer’s property send data upwards in the communication hierarchy within the distribution segment of the power grid. Usually at LV/MV substations, data are concentrated and sent towards the network operational center [
26]. For such transmissions, an optical network or other means of data transmission can be used. If no such technology is present, transmission can be provided by PLC technology [
27]. Especially in such cases, BPL can serve as a bridge technology towards the closest optical network interconnection point [
28]. From LV/MV substations, data can be sent towards the transmission part of the power grid network-MV/HV substation, where flow significantly increases towards the backhaul interconnection network point.
Network topology and communication needs of different devices on the network reveal demands on reliability, latency and data rate [
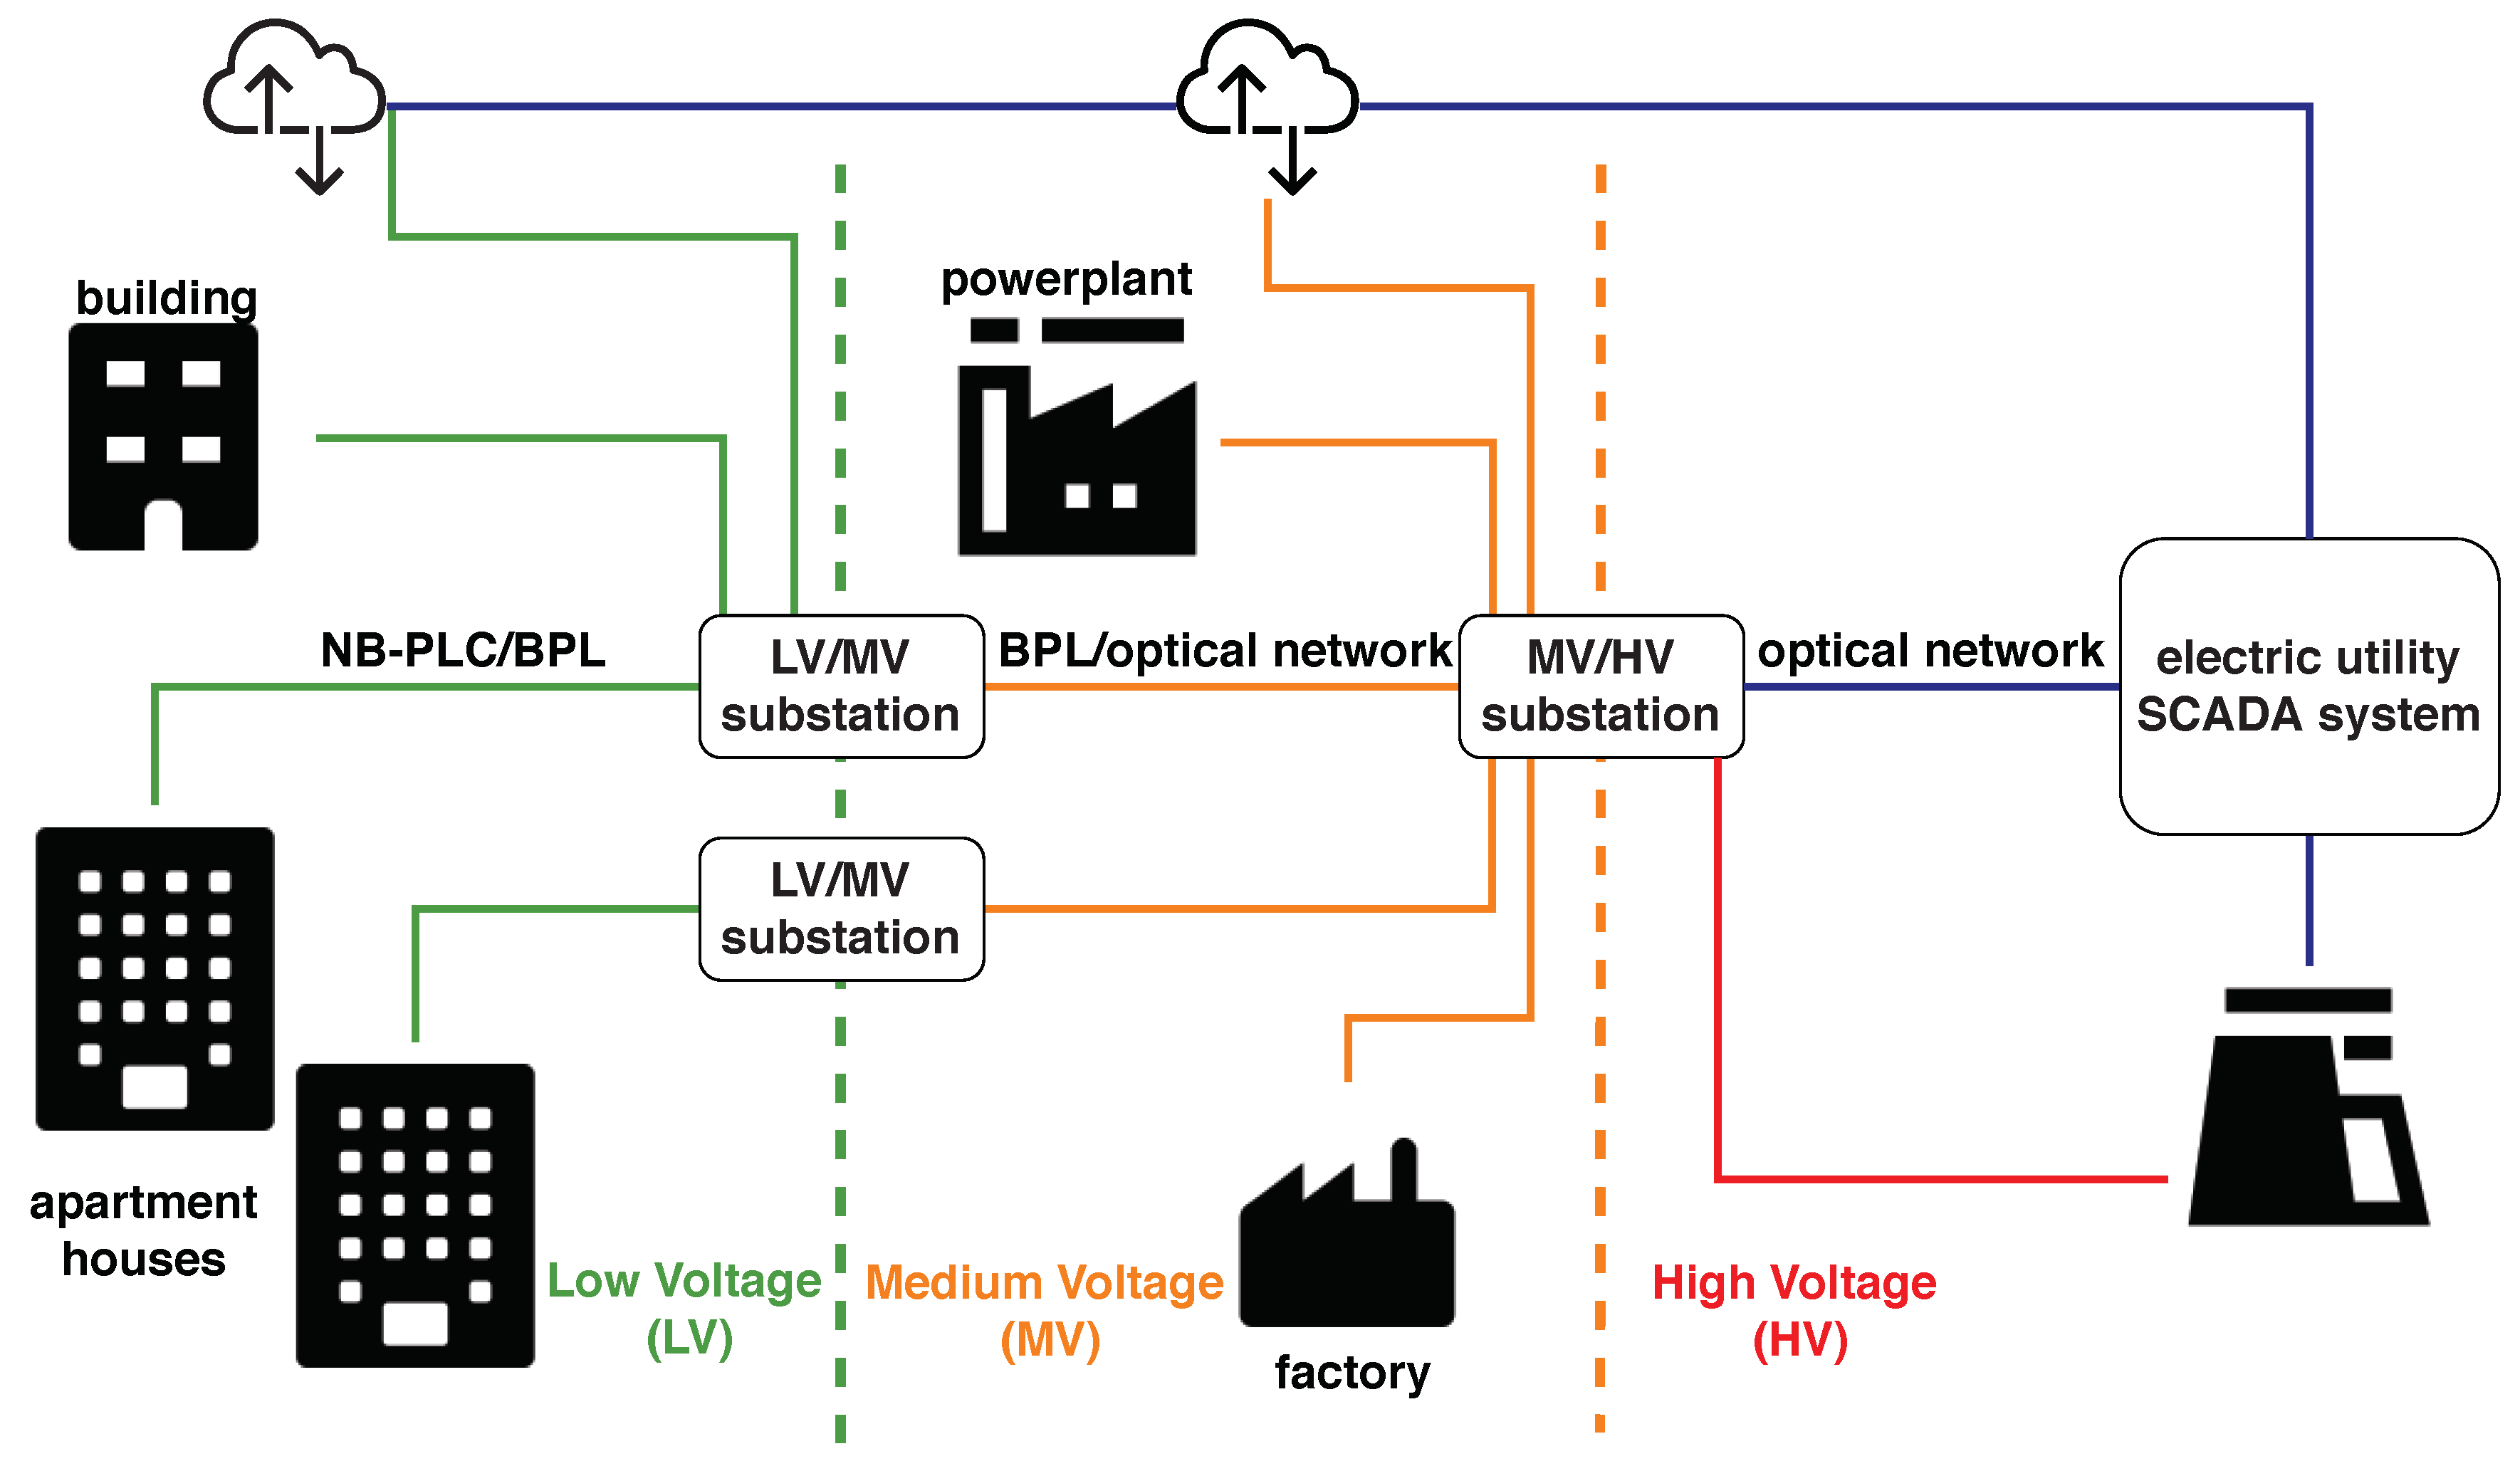
29]. An example of a communication scenario with usage of power line communication on LV and MV is shown in
Figure 1. Resulting from lower traffic volumes, with no extra need of low-latency response, usually NB-PLC can be used for data transmission from buildings towards LV/MV substations. Summed traffic transmitted over the MV network reaches higher volumes, and thus usage of BB-PLC is recommended [
30]. If devices with the ability to indicate fault detection are also present on location, the network has to provide low-latency service to fulfill the needs of communication protocols which are used for such purposes (e.g., IEC 61850) [
31].
In terms of BPL implementation on the MV, attention has to be paid to the choice of proper coupling method [
32]. For underground power distribution, usually inductive couplers are used since they more easily maintain good levels of electrical insulation [
33]. To improve parameters, usually an air gap in the coupler is increased [
34], which might lead to significant increase in both weight and volume of such a coupler.
Signals that are transmitted through power lines tend to being attenuated by the transmission environment properties of power lines, which also increases over distance and frequency [
35,
36]. Attenuation is also partially determined by devices placed along the power grid (e.g., transformers), which highly influence impedance at a particular frequency range among cable lengths and spacings between them [
29,
37]. More importantly, knowing such characteristics is beneficial in terms of designing good PLC solutions [
38]. Since the frequency determines a signal’s behavior and attenuation, frequency bands are also chosen depending on the country where the system is being deployed, and its purpose and therefore volume of traffic are expected in both directions. Wider bands enable higher data throughput, but higher frequencies are more attenuated over distances.
When the signal attenuation is too high, then the transmitted data might not arrive at the receiver side. To overcome this problem, the usage of a repeater is required [
39]. Unfortunately, deployment of repeaters introduces certain degradation of network throughput as a result of its operation [
40]. Repeaters re-amplify and re-package the signal to restore its previous signal level; thus, compensation of attenuation along a power line is achieved. To transmit signals over long distances, repeaters are used to overcome losses resulting from physical characteristics of the powerline. Depending on the distances involved, electric utilities often have to install repeaters to maintain signal strengths within acceptable limits. Increasing the number of involved nodes always leads to a decrease in throughput and increase in latency [
41].
Another important factor influencing data transmission within PLC network is noise [
41,
42]. PLC networks are under the permanent influence of two noise components: external/background noise and impulsive noise with both periodic and aperiodic components introduced by noisy loads or switching devices [
40,
43]. Impulsive noise influences PLC networks significantly, so minimizing its impact has crucial influence on the performance of the whole network [
44]. In some cases the noise effect might be minimized by using a phase-to-phase signaling scheme instead of traditional phase-to-ground systems, as stated in [
45]. The time variance of a power line and its impact on communication is further described in [
46,
47,
48,
49,
50,
51]. PLC devices during their operation also radiate into nearby areas, so the device itself has to meet current EMC (Electromagnetic compatibility) regulation limits [
52].
Utility equipment related RF noise (the source of this type of noise normally must be identified, and the device or component causing the noise must be replaced) typically has a high amplitude and spans a significant section of the BPL-usable spectrum (broadband noise). A field trial revealed that most of the MV line noise causing low signal-to-noise ratios was generated by utility equipment, components or devices [
53].
Unfortunately, there is not a simple formula that would easily determine the need to involve repeaters in the powerline network. Such knowledge would help in establishing locations of nodes, where deployment of repeaters would be vital for successful operation. Sufficient data throughput, low latency and no need for extra devices would be extremely beneficial.
2.1. Impact of Repeaters on the Network Performance—Theoretical Background
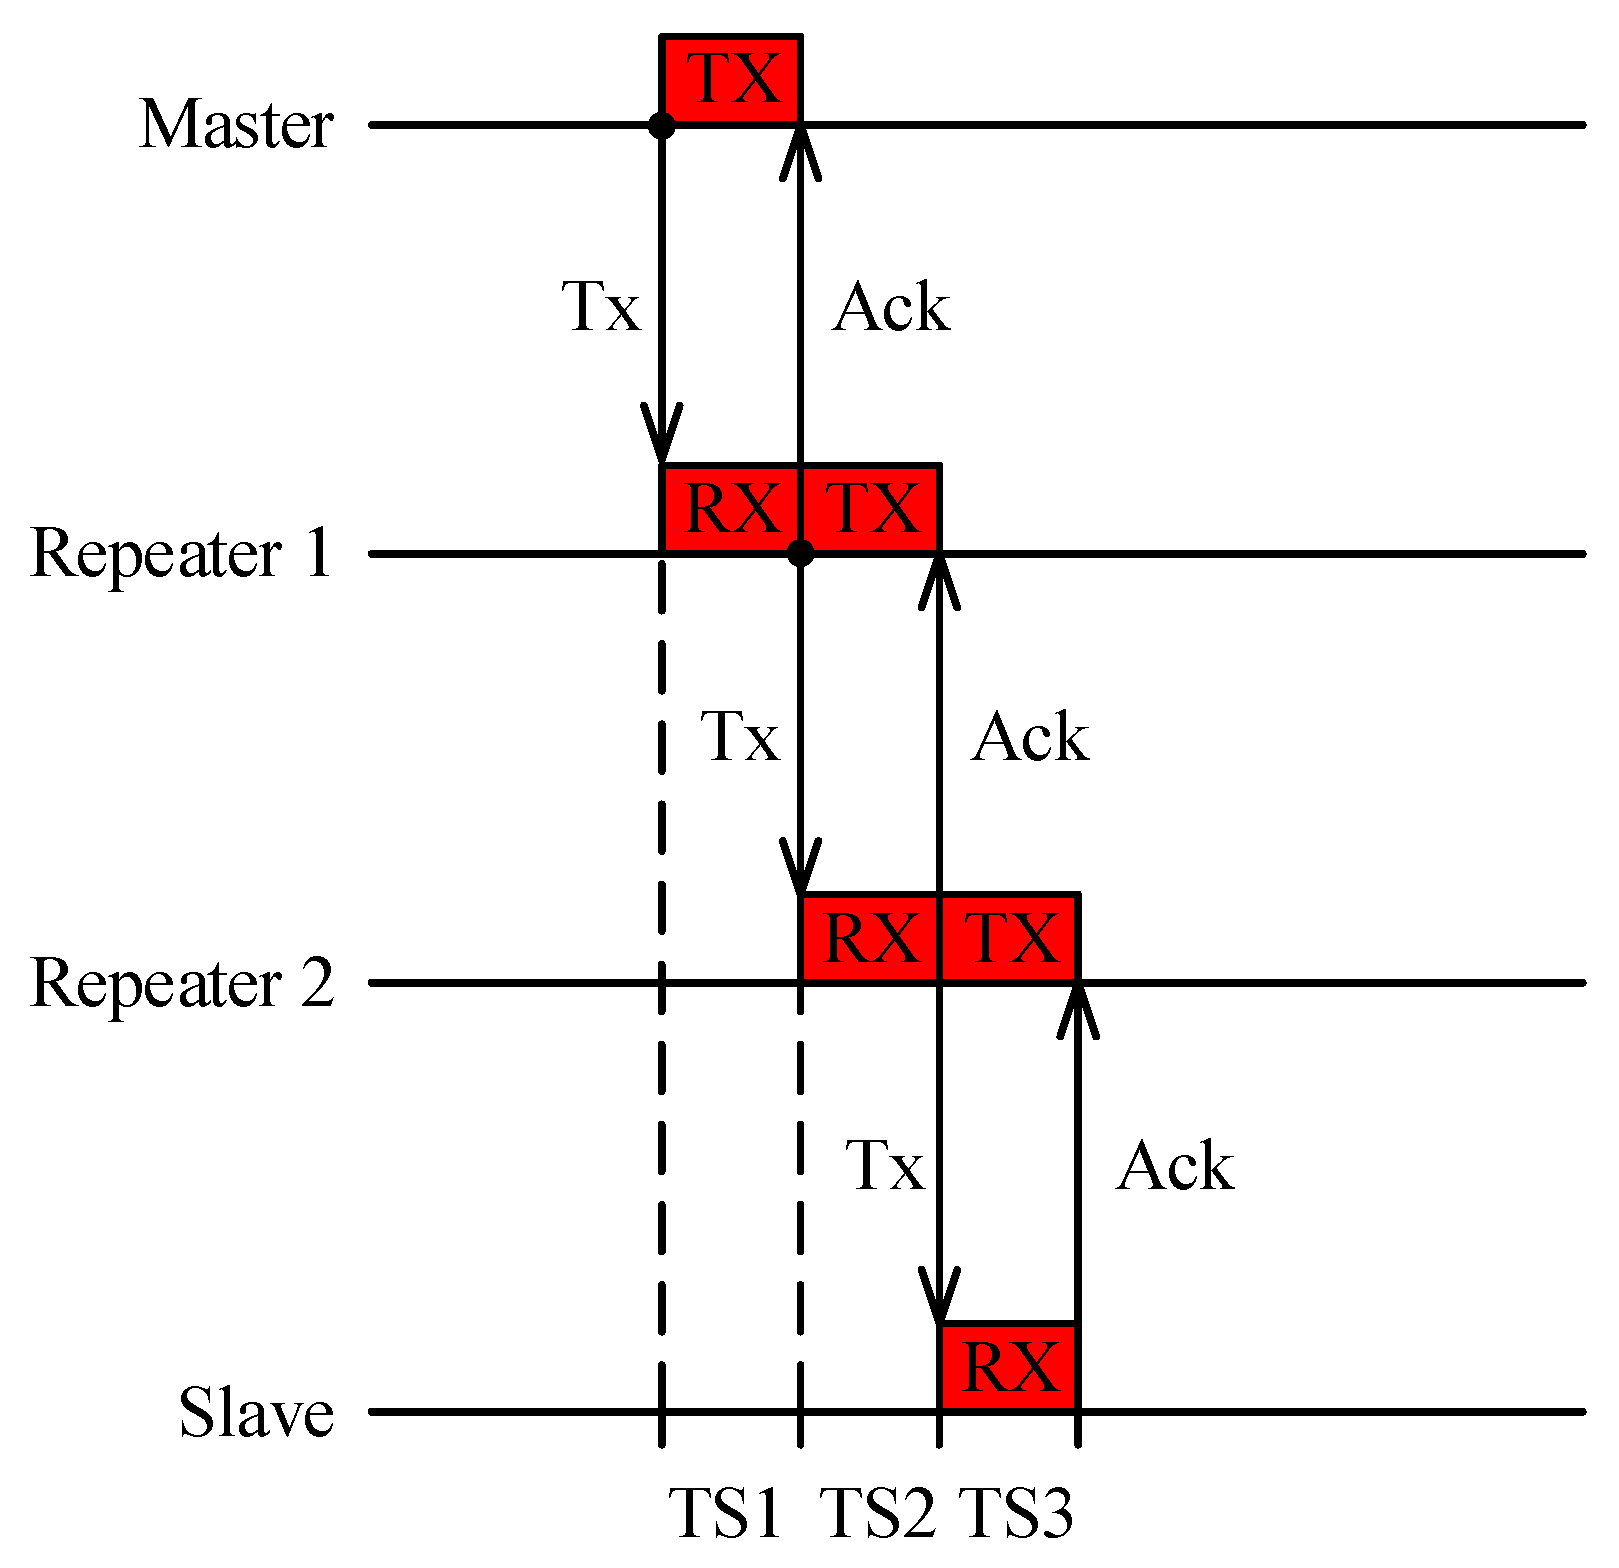
A BPL repeater extends the coverage of the access part of the network (last mile). The repeater could be a particular slave modem, e.g., Smart Meter, which is used as customer premises equipment (CPE). A designated modem only for repeating also must be used, which reduces the network cost because the modem is more expensive than repeater. However, repeater utilization increases the delay and reduces the throughput. Because the Head-End (HE) modem master and repeaters (REP) use the same medium, their transmissions have to be multiplexed. Based on technical solutions of particular vendors and costs considerations, the Time Division Multiplex (TDM) was considered.
The delay, D, caused by TDM for a repeater could be written in the following form:
where
is the time slot (TS) in which any packet transmission has to occur at the beginning of a TS, and the packet arrives to its destination in this same TS (see
Figure 2).
R is the number of repeaters between communication nodes (e.g., master modem in transformer substation and slave modem in Smart Meter).
2.2. Impact of Multiple Data Streams on Performance in a Topology with Bottlenecks
Based on utilized services and scenarios in medium-voltage linear topology, it is necessary to consider bottlenecks where multiple sources communicate with a concentrator. A link with the lowest throughput defines the total network throughput [
54,
55]. Nowadays, high automation is considered for use of periodic data transfers from distribution substations. A common case is that, during the data transfer, another request for different, possibly higher-priority data arrives and must be served as soon as possible. These reasons were the motivation for our simulations shown in
Section 4.2 and
Section 4.3. The main goal is to compare simulations to field measurements.
2.3. Impact of PLC Repeaters on Network Performance-Related Works
Many researchers conducted their studies on power line behavior in terms of its suitability for transmitting signals in a given frequency range or resistance towards noise which is typical for these lines, but very few of them focused on the exact impact of the repeater on network performance.
Of the published works about a repeater’s influence on network performance, two types of research methods were recognized: simulations and real measurements. An overview of related works is summarized in
Table 1 including the number of HEs, REPs and CPEs involved.
2.4. Simulations—Related Works
The concept of simulations is a convenient solution for predicting the behavior of complex systems based on their input values. By simply adjusting input values, the behavior and its results can be easily observed. Simulations benefit from software-based platforms, which usually do not require any additional costs (except for hardware and licenses). Results can be obtained in reasonable time, but sometimes missing knowledge on certain parameters leads to the risk of getting incorrect or misleading outcomes. For simplifying the process of simulation, some input factors are skipped on purpose due to their predicted minor impact on the final results. Sometimes, those seemingly non-significant values can also result in a synergistic effect, which could have a much stronger influence on some values or behaviors in a particular area of simulation.
Simulations investigating the influence of repeaters on network performance have been introduced in some research papers. Research presented in [
56] evaluates a PLC network with tree-based topology with use of repeaters in regards to OPERA (Open PLC European Research Alliance) specifications. Authors implemented TDMA (Time-division multiple access) with spatial reuse, and they observed its impact on the overall network performance. Authors in [
57] introduce a simulation of Adaptive Layer Switching (ALS) for a PLC network. The authors describe ALS and its influence on performance while switching between CSMA/CA and TDMA with possible benefits resulting from resilient switching between both methods.
The topic of noise influence on network performance is partially covered by research in [
58]. This simulation of a PLC network in the 1–20 MHz band is based on a measured communication channel model of a real power grid in the suburbs of Paris. Results of the simulations are provided based on a simplified noise model on combined bus and linear topology.
2.5. Real Measurements—Related Works
Whereas simulations and adjustment of values can be conducted easily on a computer by defining input values, real measurements represent the whole set of permanently varying input factors. Such changes are caused by irregular events both on the power grid and the effects caused outside network itself. This behavior is strongly influenced by stochastic processes of different types. Real measurements in the majority of cases reflect a more accurate performance of the whole system, often while conclusively revealing its limitations.
Authors in [
59] describe the results of real measurements of pilot BPL technology deployed in India (Topology for Site-2 scenario). Authors offer very few results, especially the influence of repeaters used in the project are discussed in a limited range. The main focus is on throughput analysis with regard to day time and utilization of power grid network and its events.
Authors in [
60] focus mainly on PLC communication with a maximum distance of 200 m, including 21 nodes field tested in Germany. The topic of usage repeater is discussed with regard to the quality of communication channels, round-trip time and throughput. The exact influence of one or more repeaters is not fully recognized. Network topology changes dynamically throughout time and number of repeaters, then it may vary. Even though this article is based on measurements with devices working in a narrow band of PLC, the principles applied to the communication mechanism remain the same.
Project MoMa, which is described in article [
61], plans deployment of 10,000 repeaters and 550 headends which should cover up to 120,000 households in Germany. A repeater’s typical latency per hop is recognized as 15–20 ms. This paper is mostly focused on promotion of the whole project, and results are not included nor discussed. This paper summarizes benefits of massive BPL technology deployment and emphasizes its importance in the Smart Grid concept.
A study on the influence of repeaters on overall performance (throughput and latency) of the network is described in research [
62]. In most of the scenarios, only direct connections by copper wire were used. A scenario containing a real BPL network is missing, and there are no details on its parameters; hence, the results lack validity. The authors suggest results for different network topologies (linear, star, etc.). Nevertheless, this article shares some main ideas, which are going to be further developed.
Based on the literature review covered in this section, we found that there are no pertinent articles presenting differences between common methods of powerline communication simulations and real results of devices deployed on power lines under the load. With our experiences, with performance evaluation of networks based on PLC and mutual cooperation with electric utilities in the Czech Republic [
22,
63,
64,
65,
66,
67], we mainly focus on correlating simulations and real measurements with consequent outcomes. Our goal is to enhance knowledge in terms of determining the necessity of repeater usage in PLC network design.
3. Measurements
Based on our previous experiences with the deployment of repeaters in PLC networks and their impact on network performance, we found out that repeaters in specific cases had a large impact on throughput and latency. Compared to results published in [
62], we experienced more significant drop, especially in terms of throughput of the whole network. This outcome lead us to further research the impact of repeaters.
For purposes of testing powerline communication, we decided to perform laboratory and on-field tests of the impact of repeaters used in such networks to observe its impact on network performance. For the acquisition of exact results, a pair of network testers together were used to analyze the behavior of a PLC network. Devices fully supported benchmarking methodology RFC 2544, RFC 6349 methodology and the Transmission Control Protocol (TCP) throughput tool. Depending on the type of data transmitted through the network, different demands on the protocol side were recognized.
On the level of transport layer of the ISO/OSI hierarchy system, two common protocols prevail: User Data Protocol (UDP) and Transmission Control Protocol (TCP). For the real-time transmission of connection-less messages and transaction-oriented communication, UDP is used. This protocol is typical by its lightweight structure, which does not rely on confirmation of sent and received packets. Verification of successful transmission of all packets should be covered by higher layers, if necessary. In its simple form, this protocol tries to deliver information in the shortest amount of time, otherwise it might be discarded due to its discontinuous character.
On the other hand, for some communication tasks direct confirmation on specific numbers of sent/received packets might be required. Transport protocol, called TCP, is designed for this purpose with its connection-oriented reliable type of communication. For enabling such communications, a three-way handshake is required. After that, bidirectional communication can be performed. Communication protocols adopted by electric utilities such as IEC 60870-5-104 or Modbus TCP/IP are based on principles of TCP/IP networks.
Regarding the types of data which are transmitted in Smart Grid networks, and due to communication requirements, TCP is usually preferred. Further in this article, testing methods based on TCP communication are going to be used.
3.1. Laboratory Testing
An advantage of testing in the laboratory lies in the possibility of having a certain level of control over the testing environment. Powerlines used as communication channels can be easily connected through flexible electrical power cables to achieve desired lengths of power line. External devices reducing or adding noise into the network can also be easily connected.
For our laboratory testing, four different topologies with BPL modems were prepared:
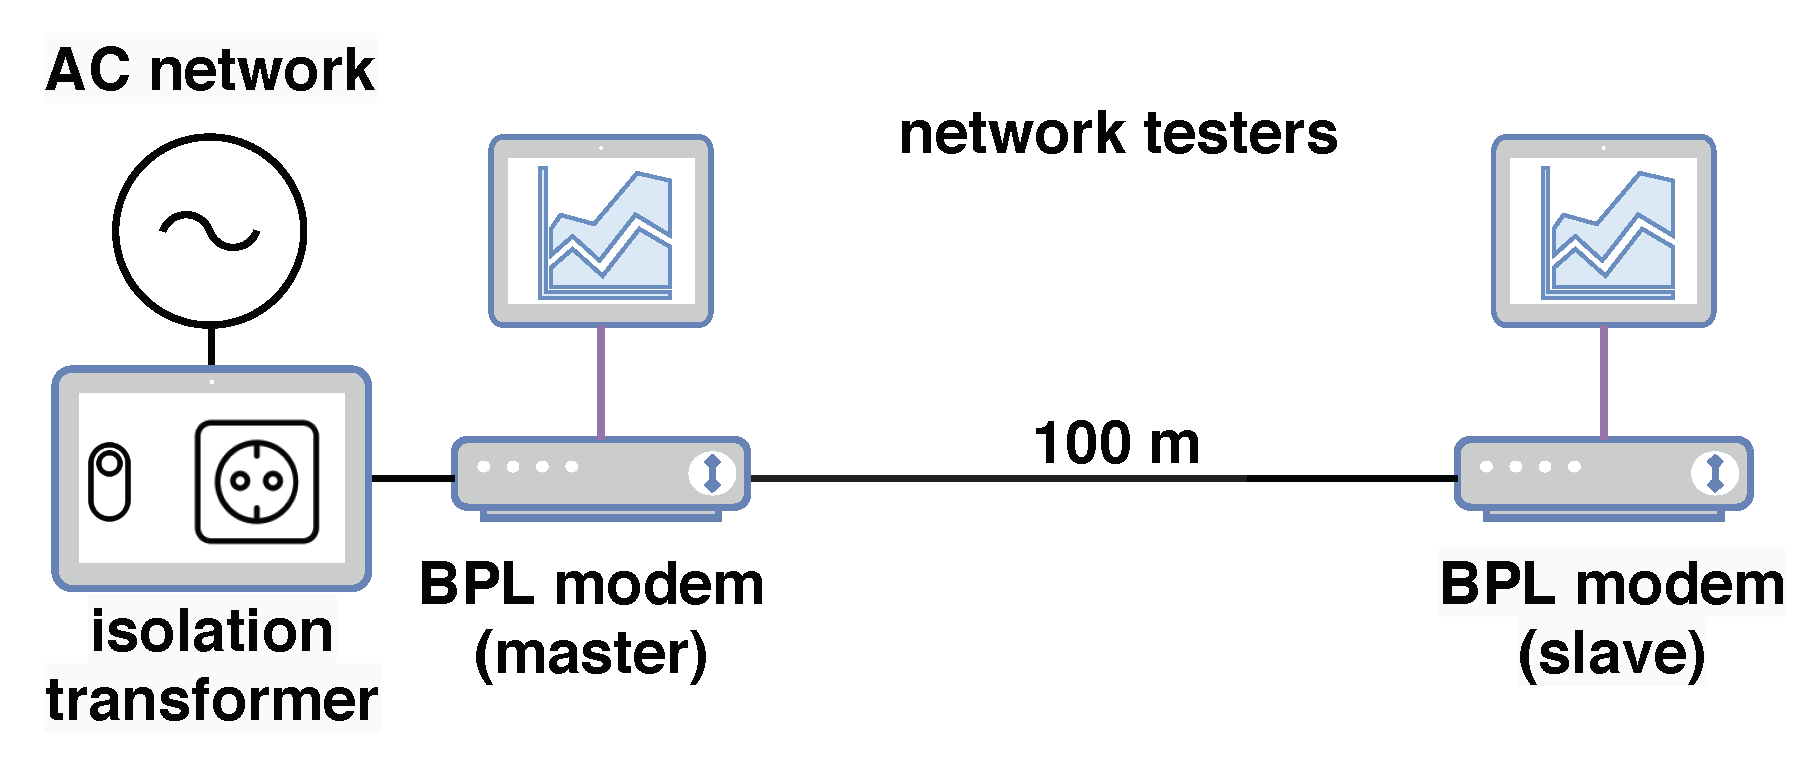
A—Isolated network:
A pair of BPL modems and 100 m of extension cord, see
Figure 3;
A pair of BPL modems and 100 m of cord, where a repeater was placed in the middle of the power line, see
Figure 4.
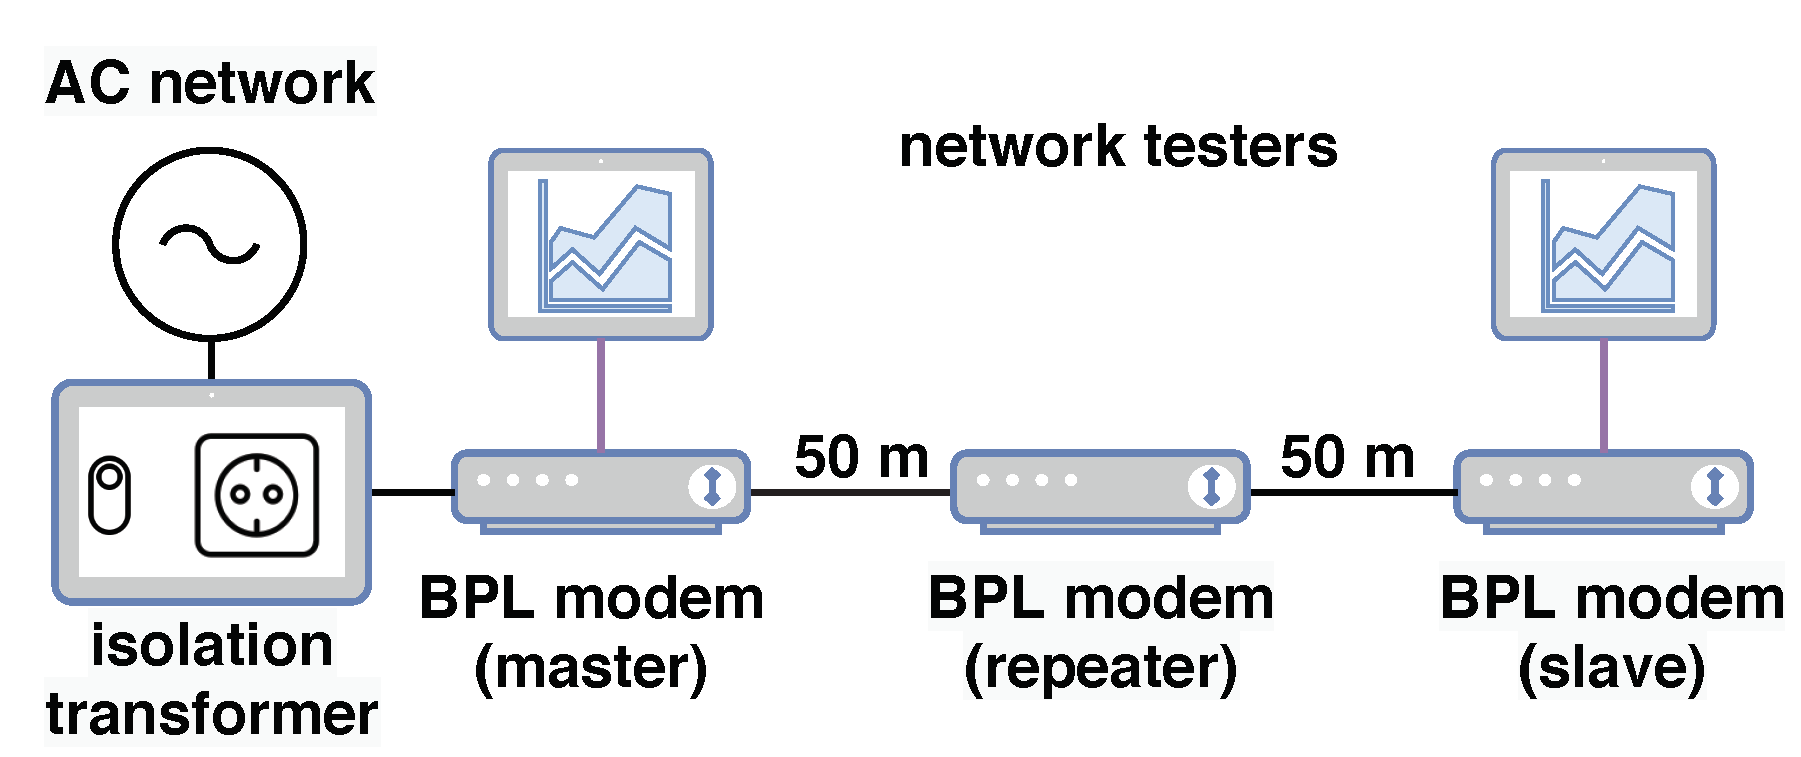
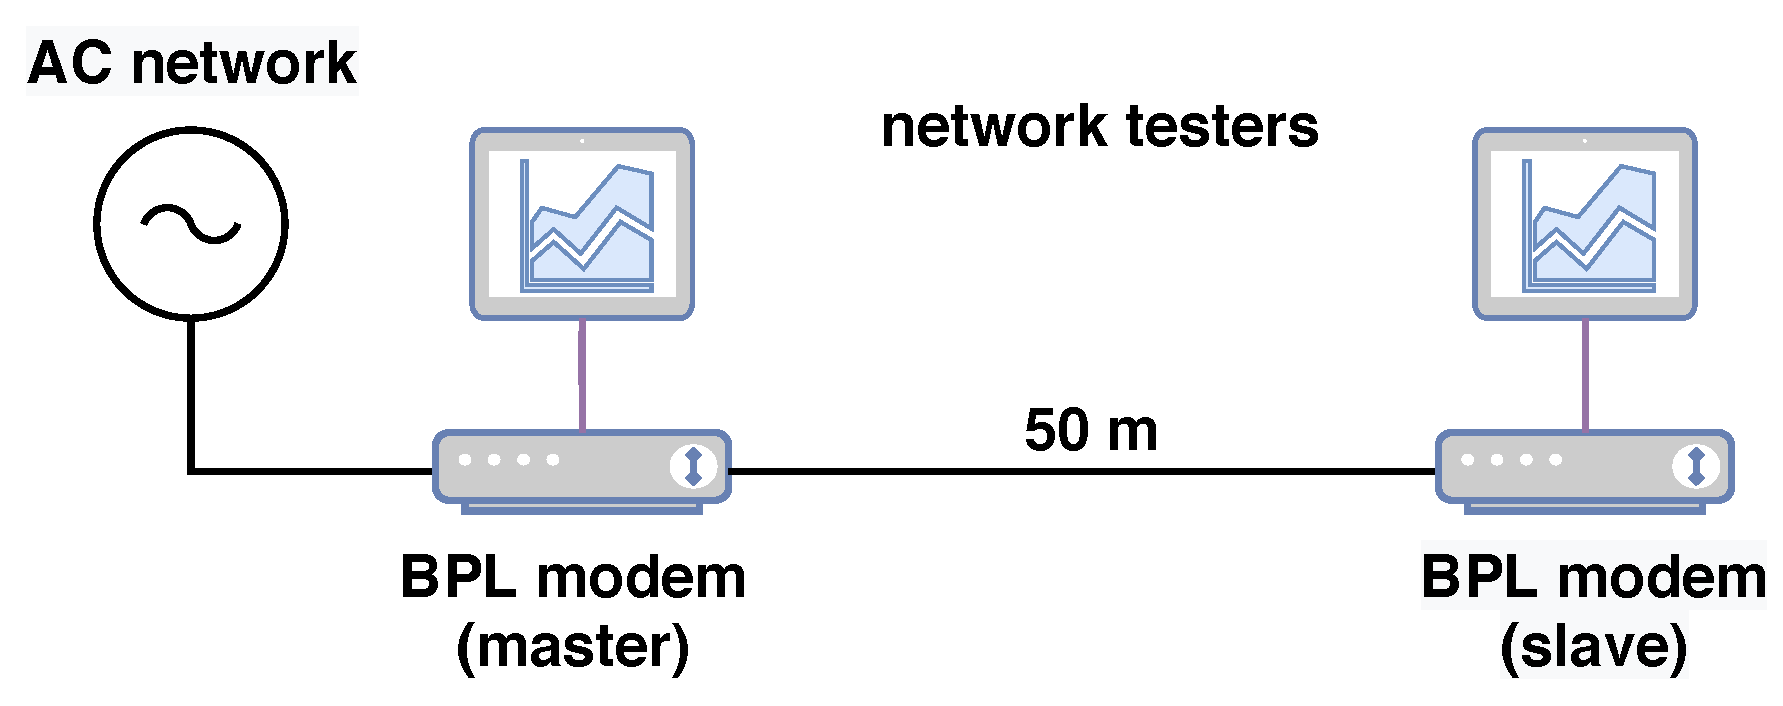
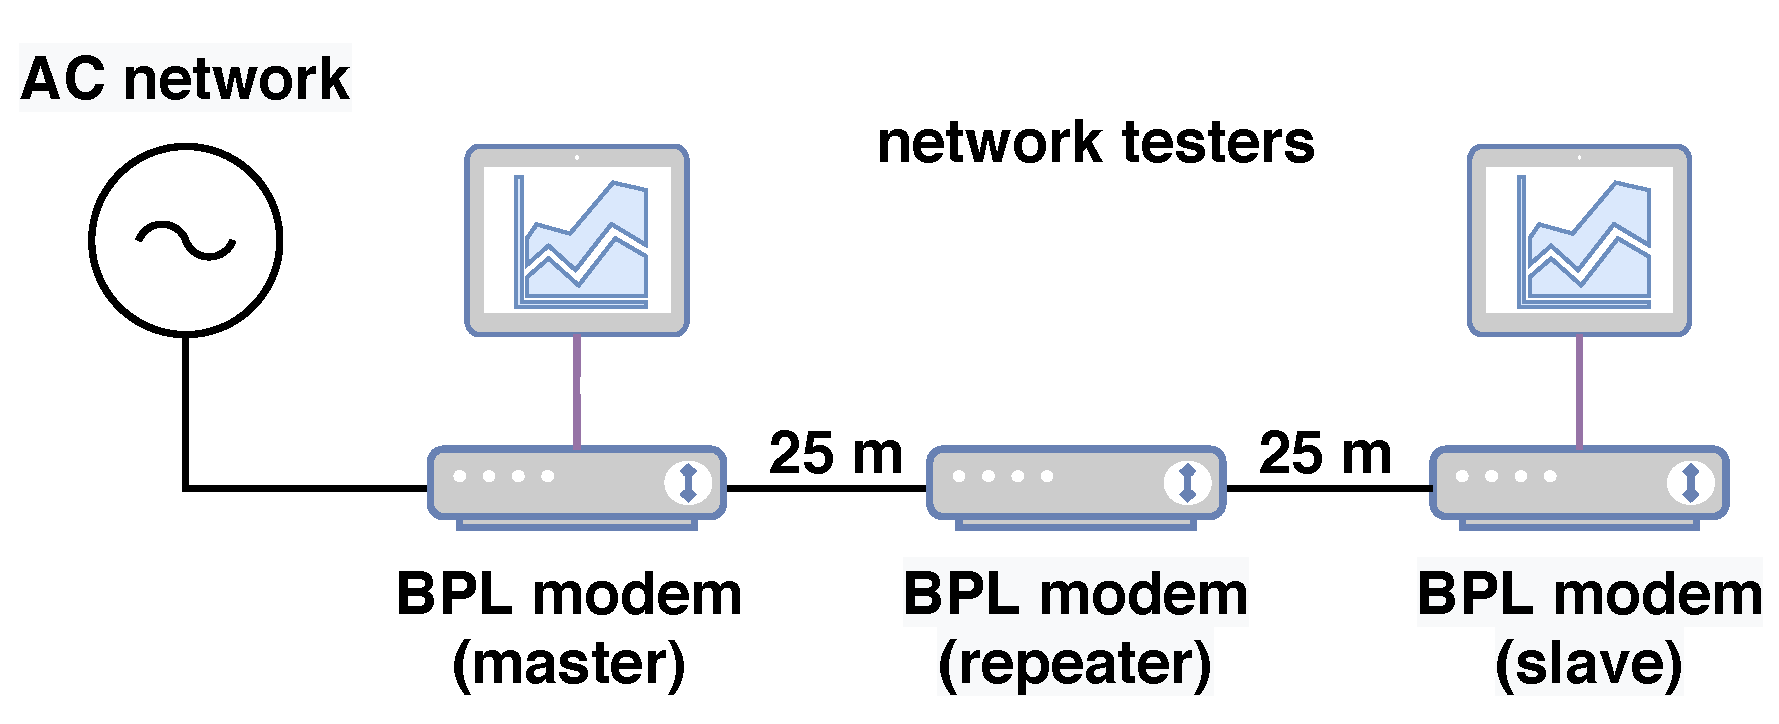
B—Laboratory network:
A pair of BPL modems and 50 m of extension cord, see
Figure 5;
A pair of BPL modems and 50 m of extension cord, where a repeater was placed in the middle of the power line, see
Figure 6.
For examination of noise effects, in an isolated network, the isolation transformer and its filtration ability ensure the best possible communication channel for BPL modems.
BPL modems in laboratory testing used a frequency range of 2–12 MHz with the Fast Fourier transform orthogonal frequency-division multiplexing (FFT OFDM) on the physical layer. The cable used in this set of measurements was CGSG 3Gx2.5.
Both ends of all presented topologies were terminated by network analyzers. For all four topologies, the RFC 6349 test was performed. Results can be seen in
Figure 7.
It is obvious that the repeater caused a significant drop in throughput, especially for the isolated network topology. Throughput in topology (A2) with the repeater was reduced to 36.2% of the throughput in the direct connection (A1) topology.
In the laboratory network, the repeater did not lead to such an extreme throughput drop. The throughput drop experienced in this topology (B2) was 56.1% of throughput of the direct connection topology (B1). It is important to remember that in the laboratory network topology, the distance between modems was reduced to half to compensate for the significant noise present on powerlines in such configuration.
An isolated network, via usage of an isolation transformer, provides almost ideal conditions for PLC network communication in terms of noise level. On the other hand, noise present in topologies B1 and B2 represents a common level of noise, which is typical for powerlines in buildings. Devices connected into the powerline network closest to the tested PLC network were computers, displays and racks with telecommunication devices such as routers and switches. These devices introduce noise typical for switch-mode power supplies. Usage of any devices based on electric motors was avoided during tests of topologies B1 and B2.
The main motivation for using both isolated and laboratory networks was to investigate differences between the performance of PLC network in almost ideal conditions and in conditions with regular noise present in powerlines. Isolated networks also enable the same tests to be repeated under the same conditions for all PLC technologies (replicable and repeatable conditions).
Based on the measurements presented in this section, we expect the throughput drop caused by the repeater to be in the range from 35% to 60% of throughput of the direct connection without repeater.
3.2. Field Testing
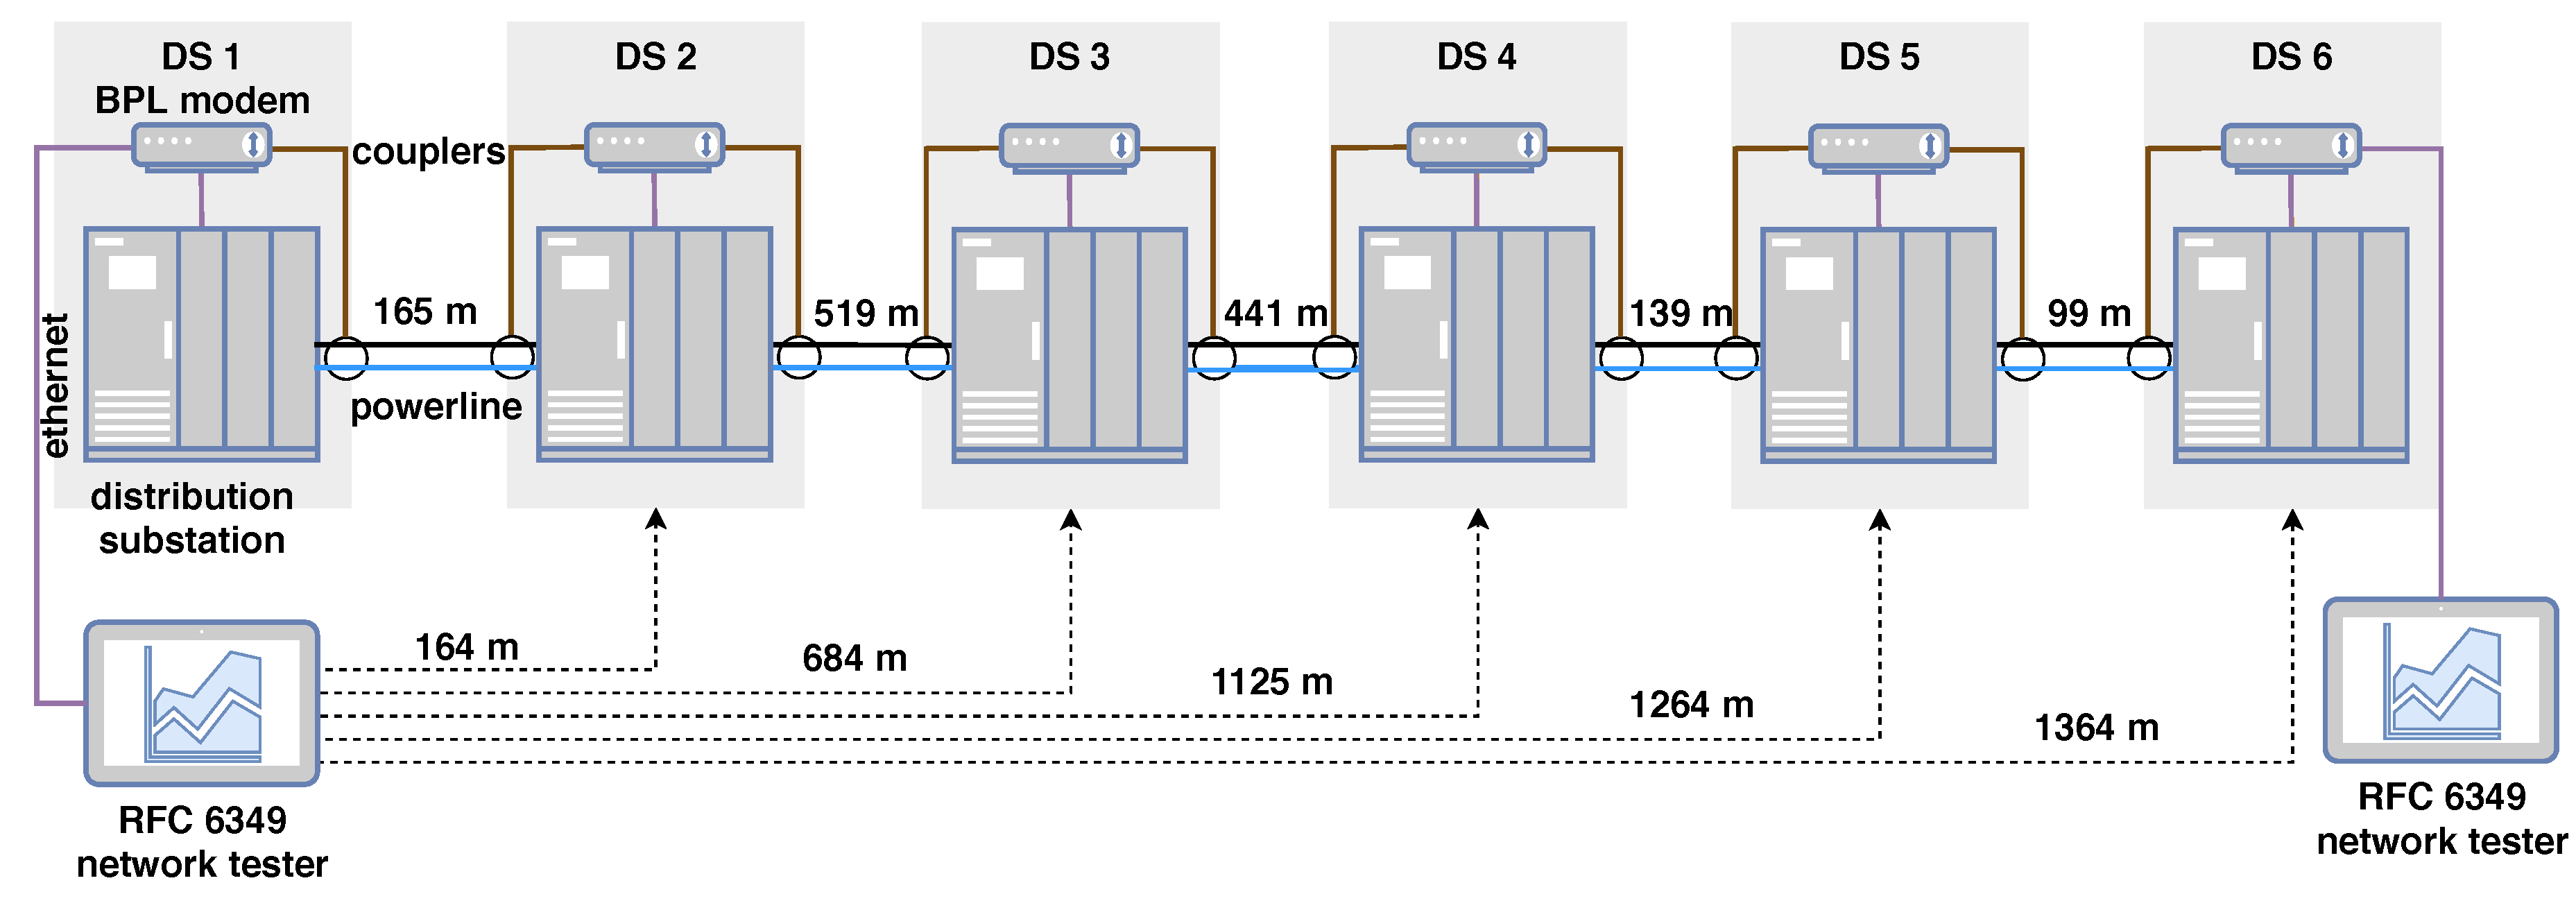
For performing tests in field conditions, a network consisting of six nodes was chosen. For excluding the impact of BPL modem, which was used in
Section 3.1, a set of different modems was installed along the existing power grid. BPL modems used in field testing are based on IEEE 1901 standards, using a frequency band of 2–30 MHz with FFT OFDM on the physical layer. The linear topology of such a network with the length of power lines connecting the secondary substation is shown in
Figure 8. The cable used in this topology was AXEKVCEY. Measurements were performed under a usual load of all involved secondary substations. Besides BPL modems, two network testers were used. The total distance from the first to last node was 1364 m.
Distances between BPL modems in
Figure 8 are given by already existing topology. Values of distances between BPL modems in the mentioned distribution substations were provided by an electric utility from the documentation of installation process, and these values represent exact lengths of used cables. Chosen topology represents real-field scenario, where the PLC network provides a communication channel between substations in the Smart Grid network.
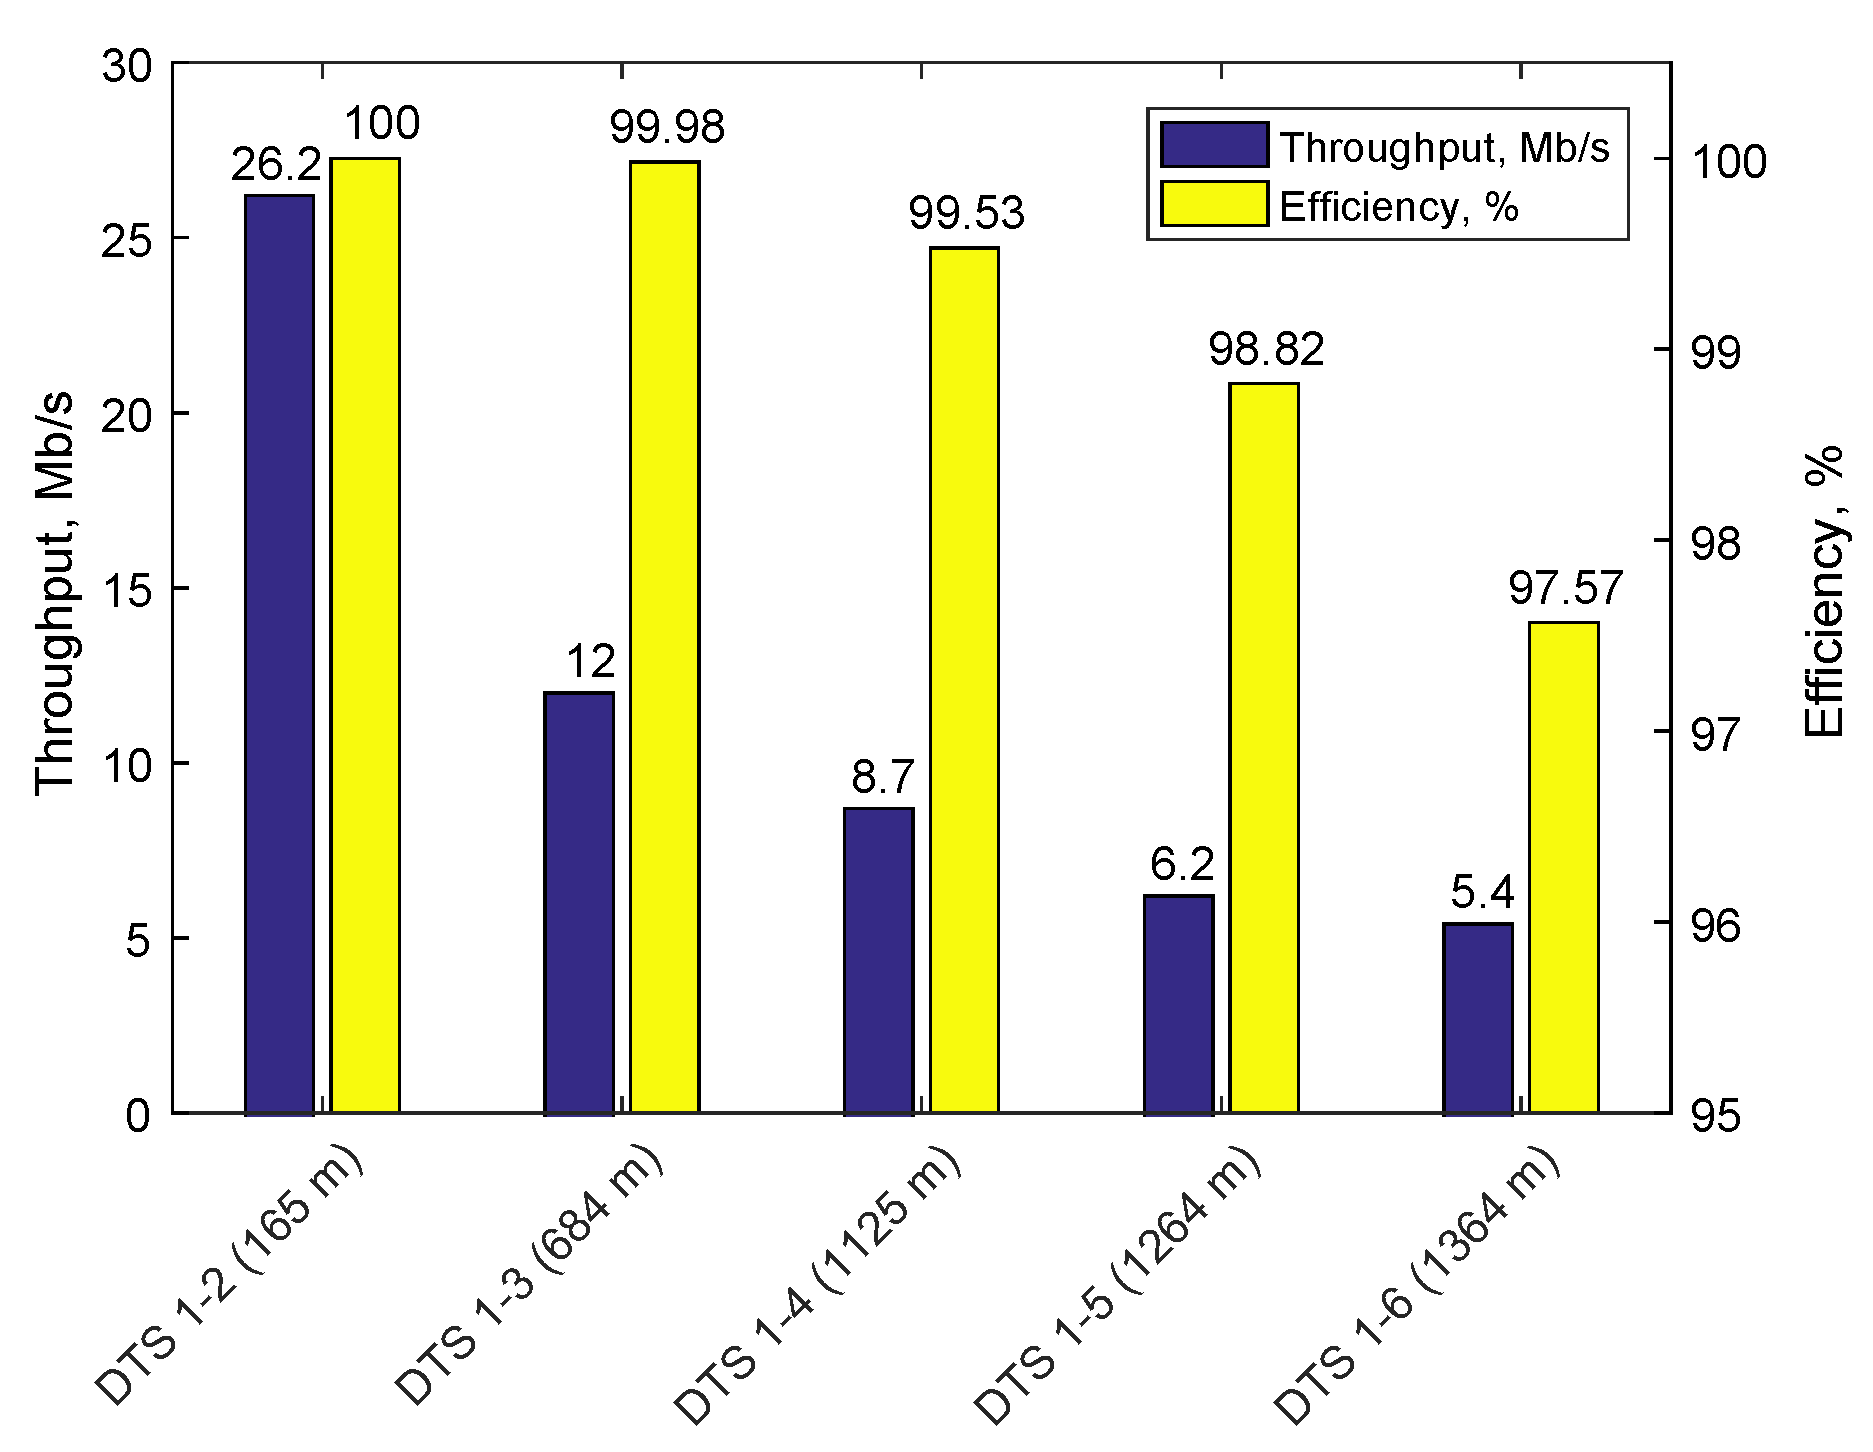
Results of the measurements can be seen in
Figure 9. For the whole network, throughput at the last node was reduced to 5.4 Mb/s. In RFC 6349 communication, efficiency is also calculated. This value is calculated based on Equation (
2) [
68]. For the last node, the value of efficiency reached 97.57%.
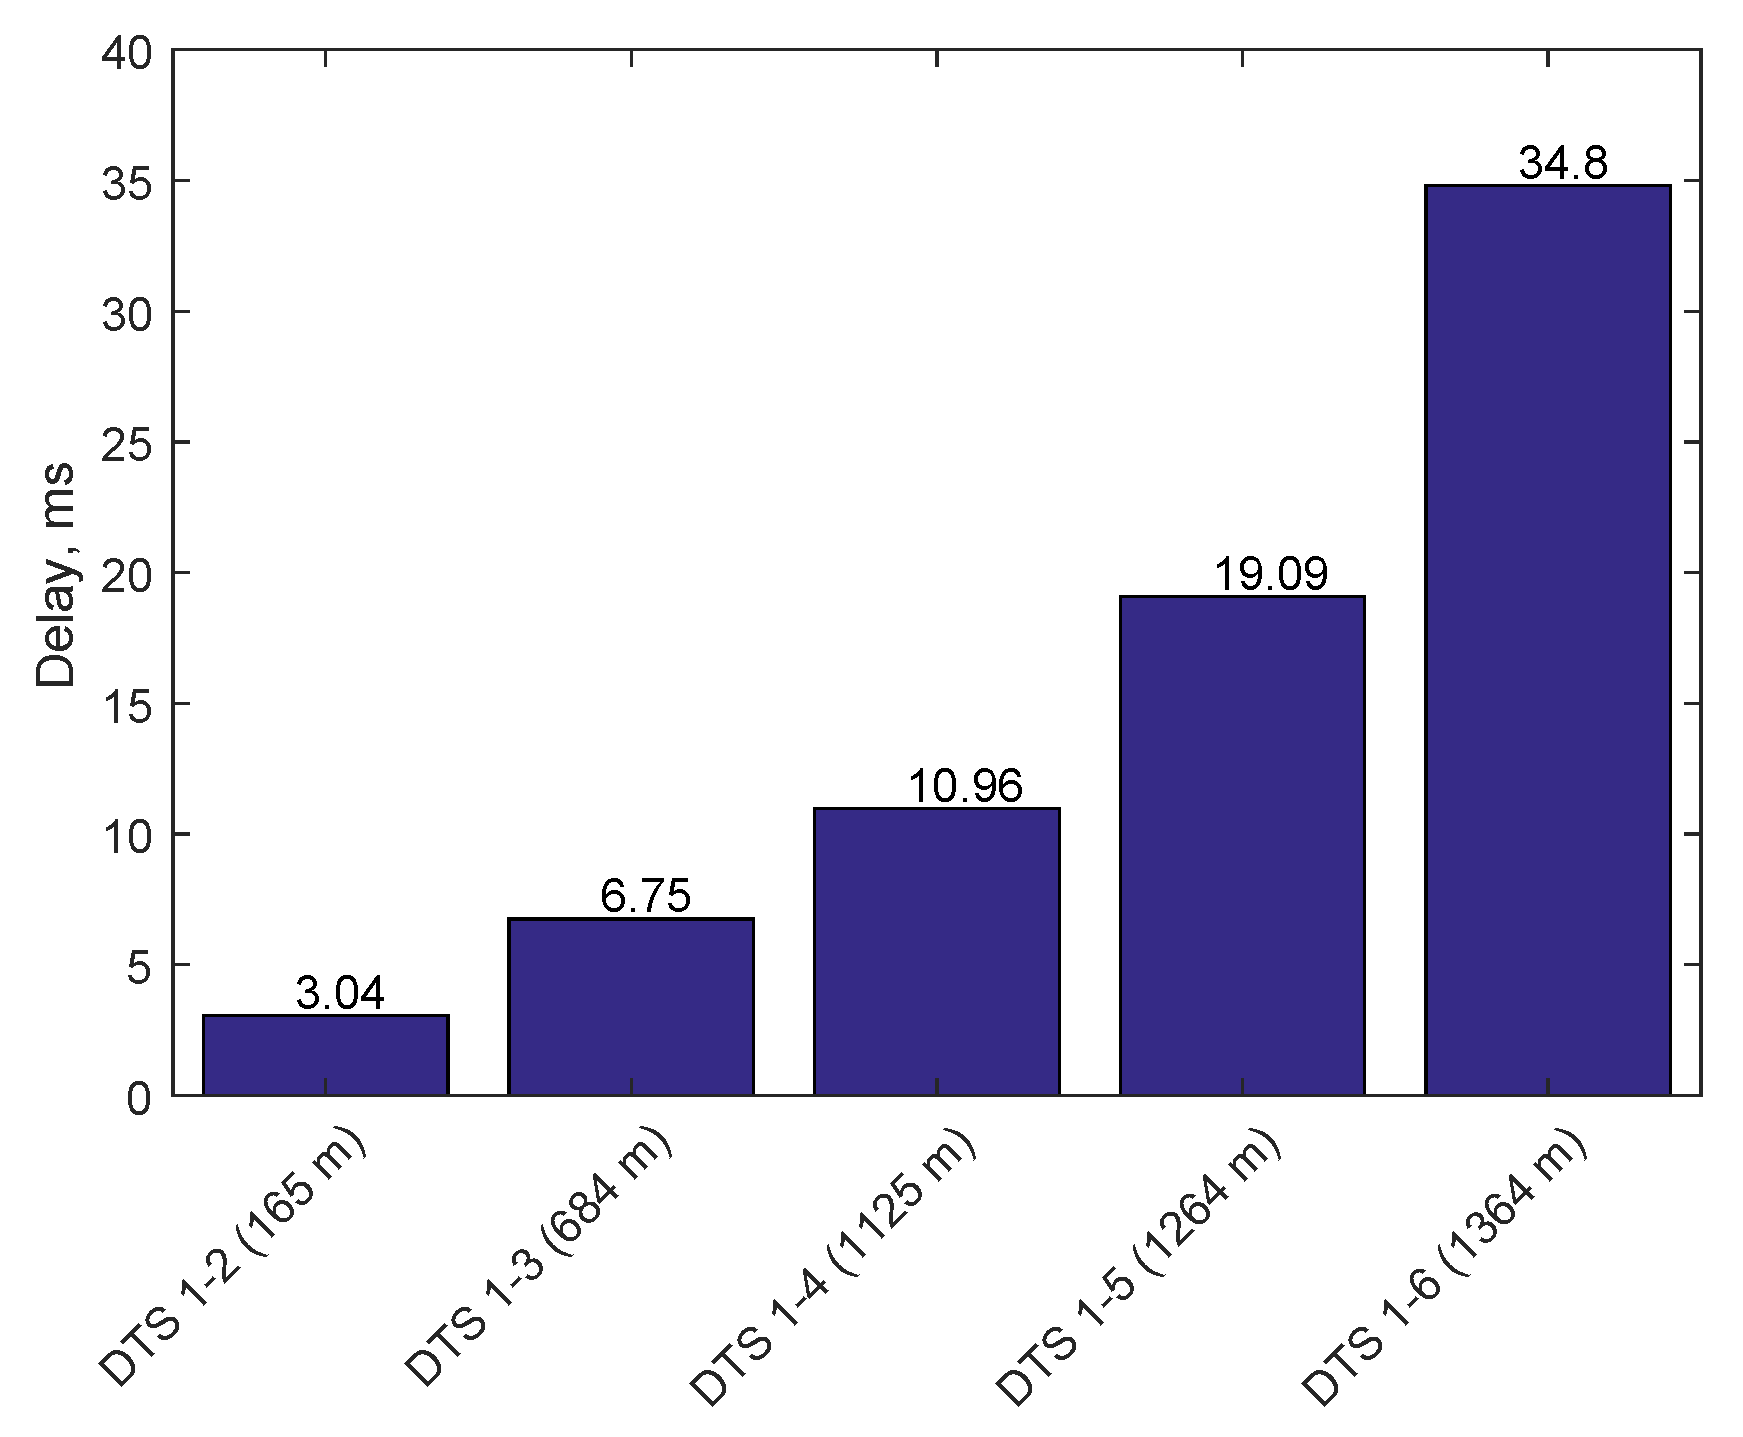
During the TCP synchronization phase for calculating TCP windows size, round-trip time (RTT) was measured [
69].
Figure 10 shows RTT values for this process, where the first node RTT was 3.04 ms and the last node RTT was 34.8 ms.
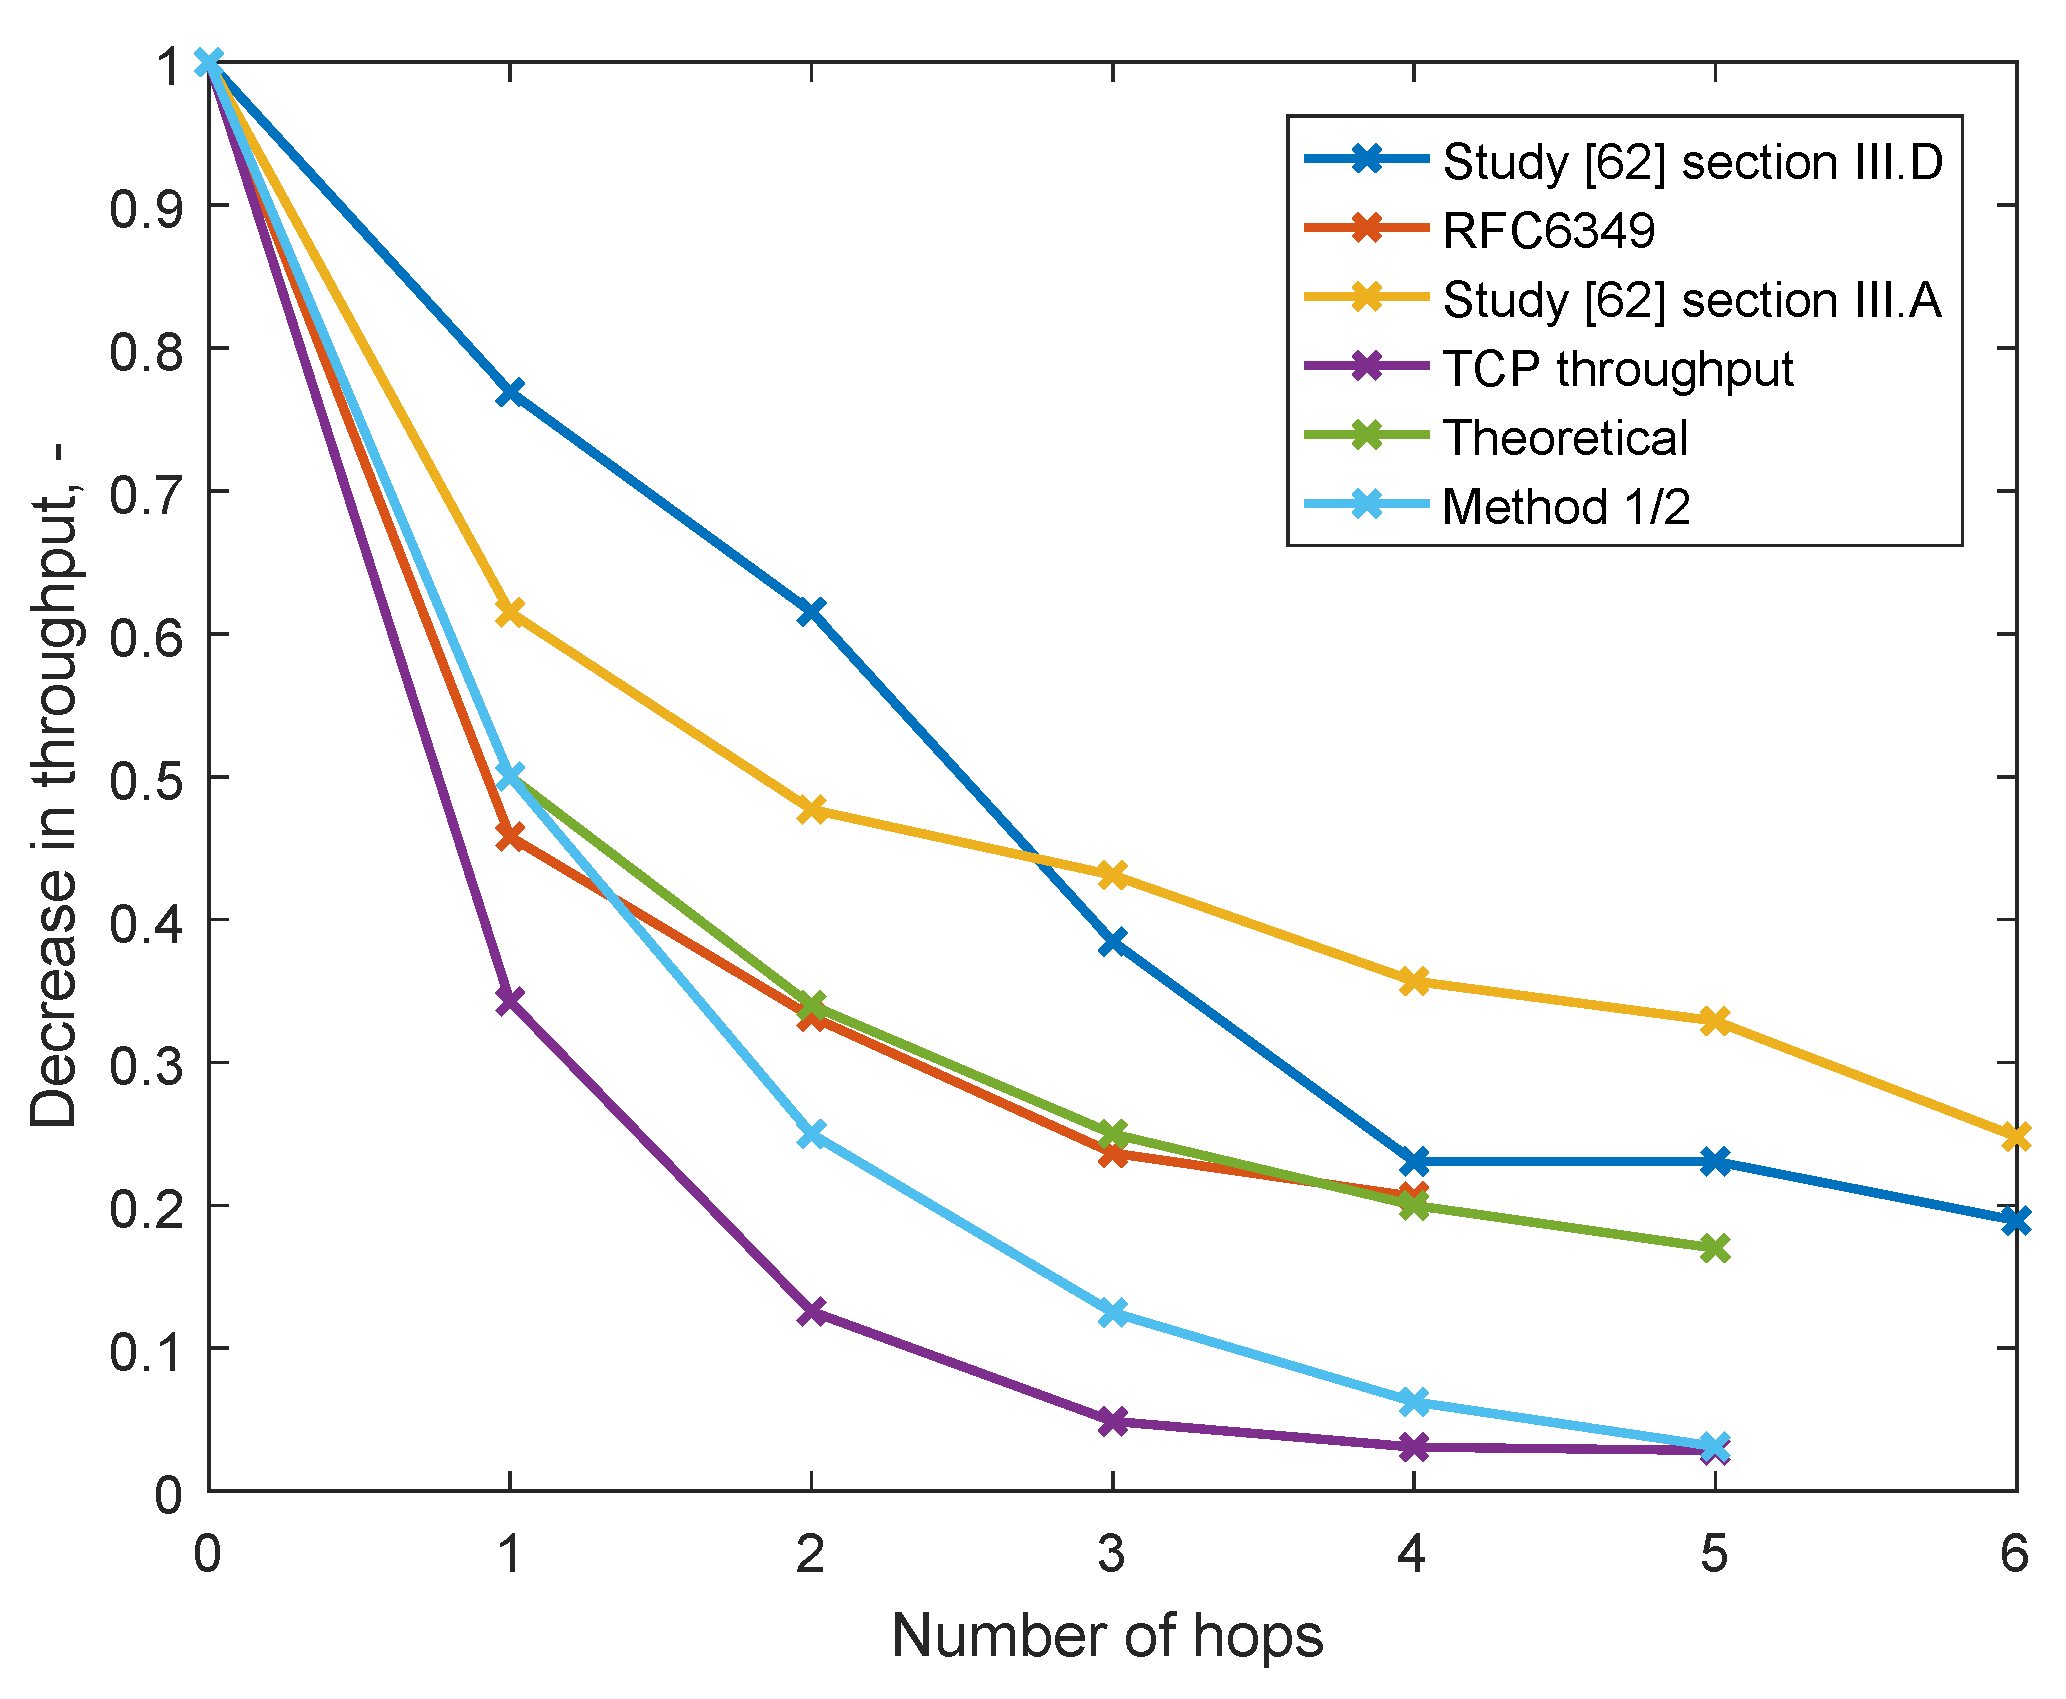
Results obtained from the measurements are summarized in
Figure 11. This figure shows a comparison of a decrease in throughput and the impact of repeaters on linear PLC network for different network testing specifications and recommendations. Method 1/2 is based on the idea that every repeater reduces the throughput to half that of the two previous communicating nodes. In comparison, the TCP throughput tool test showed results close to those of Method 1/2, but only with a more significant drop for the first couple of hops. We also compared our results in terms of throughput drop caused by the repeater to outcomes of another study [
62]. As we experienced before, when we tested PLC networks, our measurements showed a more significant throughput drop. Charts showing the most representative character of the decrease of throughput caused by repeater are obtained by methodology RFC6349. The impact of different methodologies of network testing can be also observed.
Based on the results described in this section, we determined the expected impact of a repeater in linear topology with repeaters with regard to all results described above. Expected impact is summarized in
Table 2, and in
Figure 11 the chart is theoretical. These values are further used as input data to simulate the impact of bottleneck on network performance with topology with multiple repeaters.
4. Simulations
As we previously discussed in
Section 2.2, in field measurements [
67] there were situations when requests for data with possibly higher priority occurred. The key question was how those streams are going to be transferred through the bottlenecks of linear network topology.
As a part of our research in PLC networks, three types of simulations were conducted. In the first, the behavior of multiple streams on one shared medium was studied. In the second, balancing time of two streams was studied with one and two repeaters. In the third, previously obtained measurement results were used as input values for determining the effect of repeaters on data throughput. Multiple repeater scenarios are investigated with network bottlenecks alongside the route.
4.1. Existing Simulators
There is a number of simulation tools that can be used for simulation of network traffic. However, no tool is capable of simulating complete PLC networks. These tools were evaluated in this study: Netsim, Riverbed, OMNET++, and NS-3, and details of these tools are shown in
Table 3. A similar topic on PLC simulation tools is described in [
22,
70]. There are other tools that can simulate or emulate networks, but they are more suitable for protocol and topology verification, e.g., Eve-NG, GNS3, and Packet tracer.
NetSim is a very capable network simulator and emulator providing all types of typical protocols, e.g., Ethernet, IEEE 802.11a/b/g/n/ac, routing protocols—RIP and OSPF, VLANs and many others. The official source does not provide any information regarding PLC simulations within this tool, and the licence is also fairly expensive. For these reasons, we mention it as a very powerful tool, but it is more suitable for other researchers.
Riverbed modeler (former OPNET) is a simulator with capabilities of traffic and infrastructure analysis in communication networks. As OMNET++, it also does not provide realistic implementation of PLC elements. There were a few trials on implementing this, provided chronologically. In [
71], capabilities of MAC protocols for broadband PLC networks are evaluated. Authors in [
72] developed a flooding protocol running on a Single Frequency Network PLC which should provide better performance by using a smaller overhead. Characteristics of PLC channels in cargo ships were measured in [
73,
74], and the authors planned as future work to model the results in OPNET by using measured transfer functions in OPNET’S Wireless LAN model. A realistic model for narrowband PLC was designed in [
75], and the authors validated this model against a real-world testbed. The model proved to be accurate for PLC G3, but the authors claim that the model can be used also for ITU-T9903, IEEE P1901.2 and LOADng.
OMNET++ is not a simulator itself, but it is a modular framework to which extensible modules can be plugged in. From the list of currently available modules, none support PLC or BPL communication technologies. There is one paper introducing a cross-platform simulator for G3-PLC in OMNET++ [
76]. OMNET++ is free to use, as well as the official modules, which makes this this tool attractive for all kinds of research.
NS-3, unlike NetSim or Riverbed modeler, is free to use and provides support for many protocols and technologies, but likely not on such a scale as the two aforementioned tools. The simulation parameters and setting are defined by programming code in C++, which may be more time consuming and more difficult to get familiar with, on the other hand it is easy to control versions and can be more flexible in developing specific scripts and functions to suit the users’ needs. In [
70], the authors create a PLC channel simulator that runs in NS-3. This tool, however, does not include the node types for repeaters which are used in
Section 4.3 and
Section 4.4.
The goal of our simulations was to simulate the effect of repeaters on the network throughput. Since none of the analyzed simulators can provide tools suitable specific to our needs, the simulator was selected based on the authors’ preferences. NetSim and Riverbed modeler are unnecessarily complex simulators with high price. OMNET++ and NS-3 seem more research-focused with high variability, and they both support two main operating systems. Ultimately, NS-3 was selected as the optimal tool not only because it fulfills the requirements but because of the authors’ prior experience with it.
Simulations were conducted in NS-3 network simulator (version 3.26) running on a virtual machine Linux Ubuntu 16.04.1. The topology code was written in Eclipse IDE in version Neon.2 (Release 4.6.2), and it was also executed in the IDE. “Node” object type was used for nodes, “PointToPointHelper” was used for links. For simplicity and to avoid unnecessary overhead traffic, the routing was set to static with IPv4 protocol. The BULK application was selected for data transmitting with the use of TCP protocol on transport layer.
4.2. Multiple Data Streams on Shared Medium
In this subsection, the behavior of multiple streams on shared medium was studied. Four types of scenarios were investigated, and the summary is shown in
Table 4. The scenarios differed by three variable parameters: (i) data generation throughput, (ii) order of data stream start, and (iii) starting time of specific stream. Details of the scenarios and results are described below, and the topology is shown in
Figure 12. There are a total of four simulation plots. The delay of 5 s for second and third streams was selected as a value that is typical for real-field scenarios and from experience from Smart Grid network pilots.
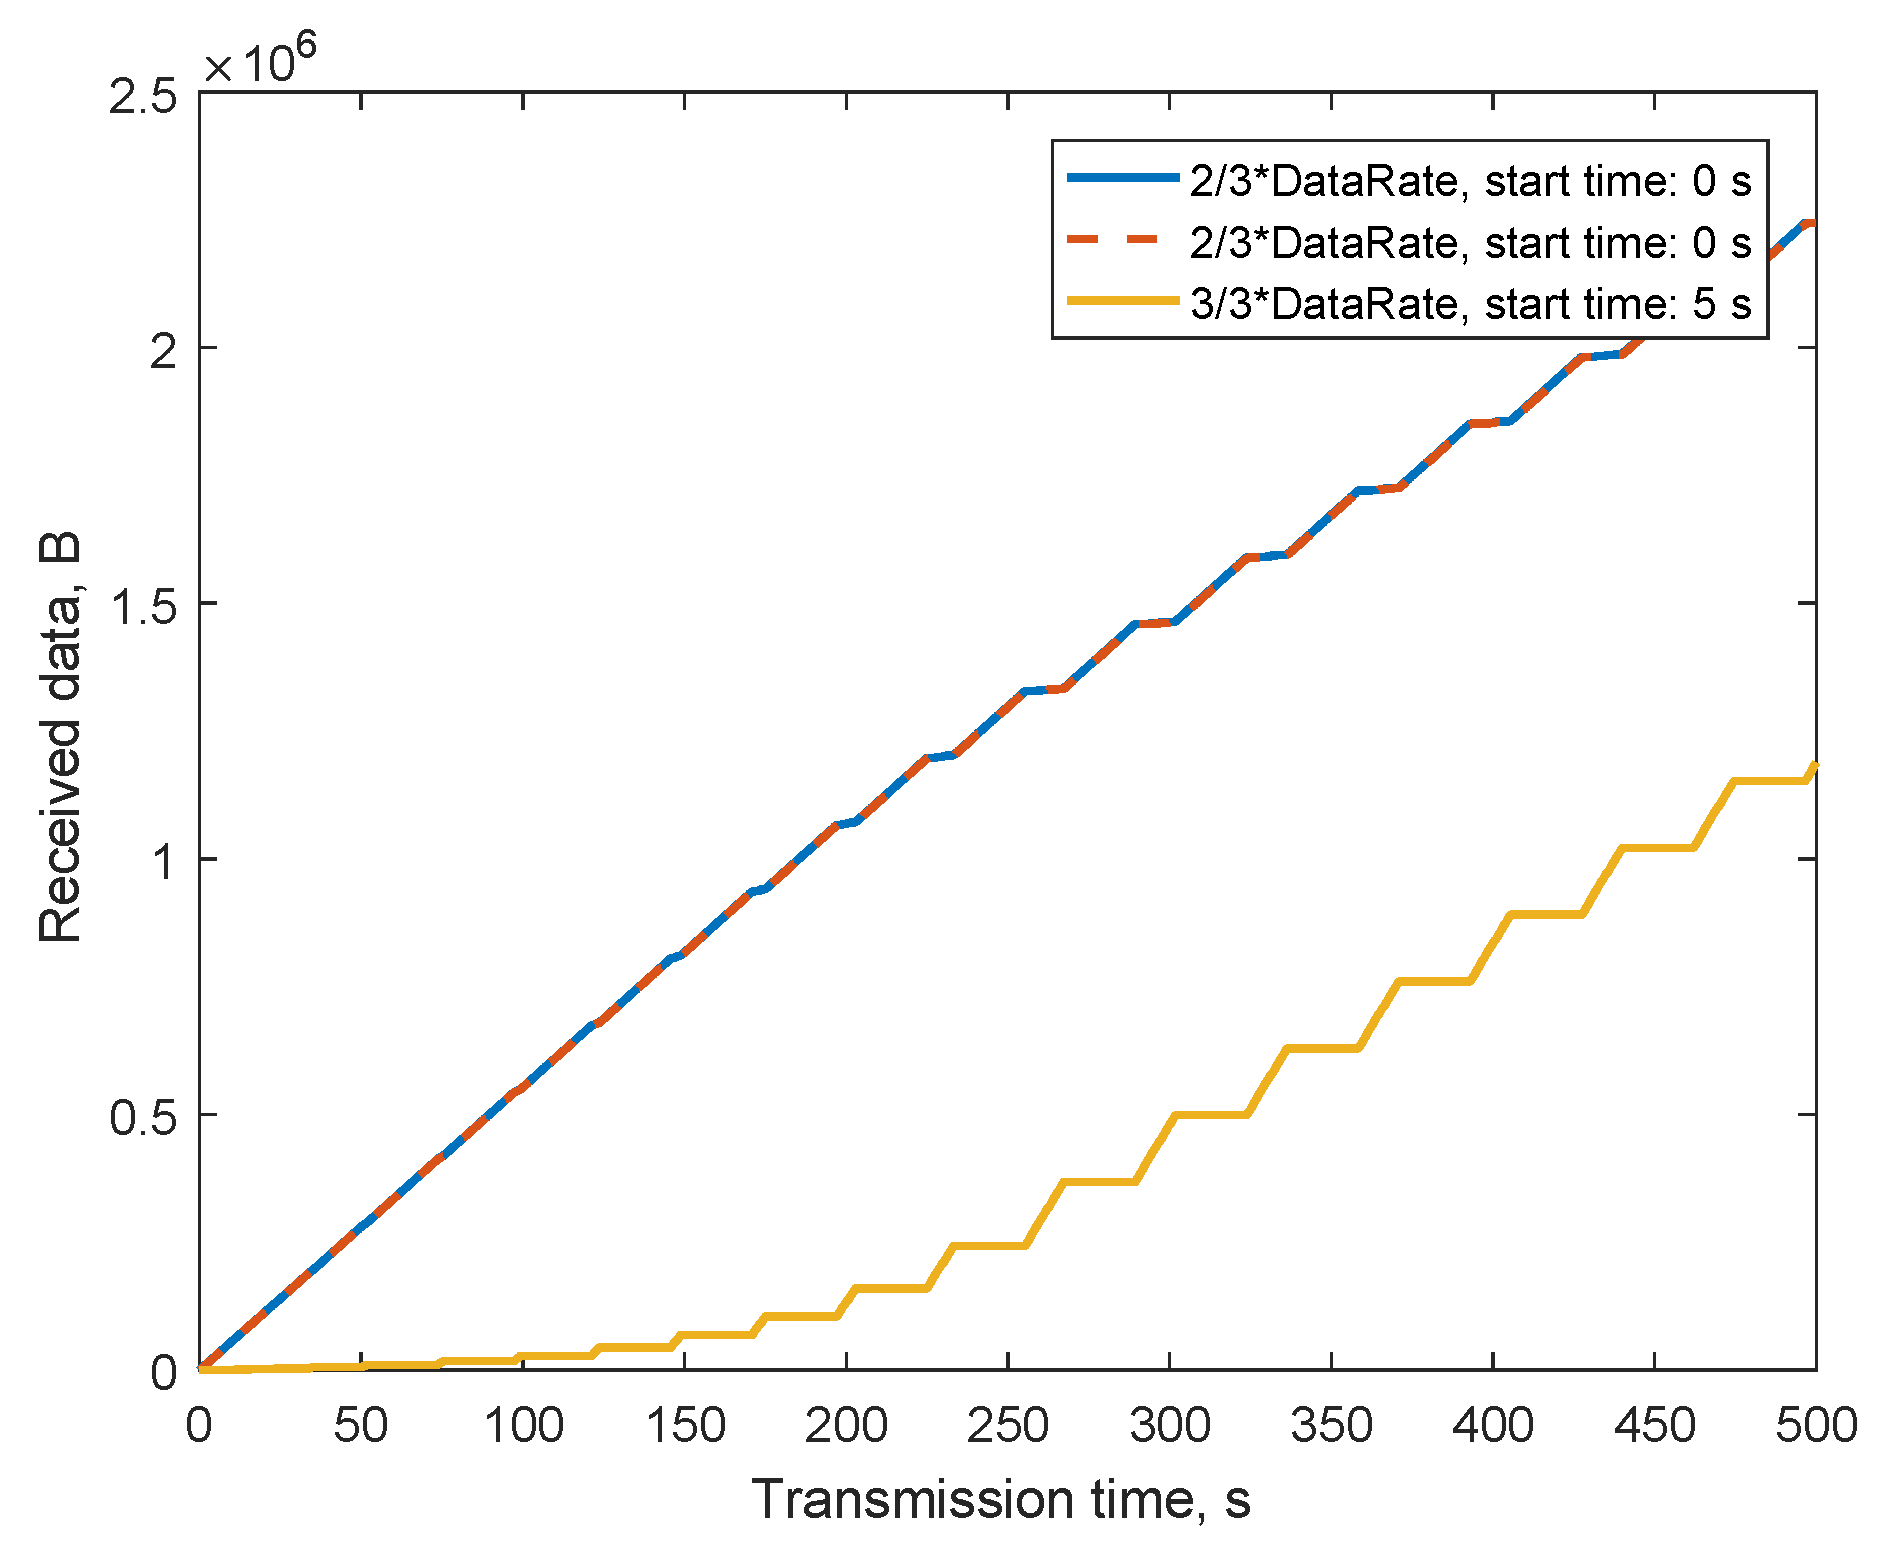
Scenario 1A: First two streams generate data with speed of 2/3 of maximum data throughput, and their transmission starts at time 0 s. Last stream starts to transmit data after 5 s.
Figure 13 shows the results with the delay of the last stream of 5 s. First two streams completely overlap and in the beginning cover the full channel throughput. When the last stream joins, the speed starts to decrease. The last stream starts with a very low data rate but it slowly increases until the speed of all the streams is equal.
Scenario 1B: This scenario differs from the previous in bandwidth allocation for first two streams. The first now generates data with the maximum channel throughput whereas the second with only 1/3 of the maximum. Other parameters remained unchanged.
Figure 14 shows the result. First two streams stopped overlapping due to the different data rates. The first stream now occupies most of the throughput and second the stream keeps the speed approximately in between stream one and three. As in the previous case, after some time the transmission speeds of all the streams stabilized on a certain level. The speeds remain equal until one of the stream stops transmitting.
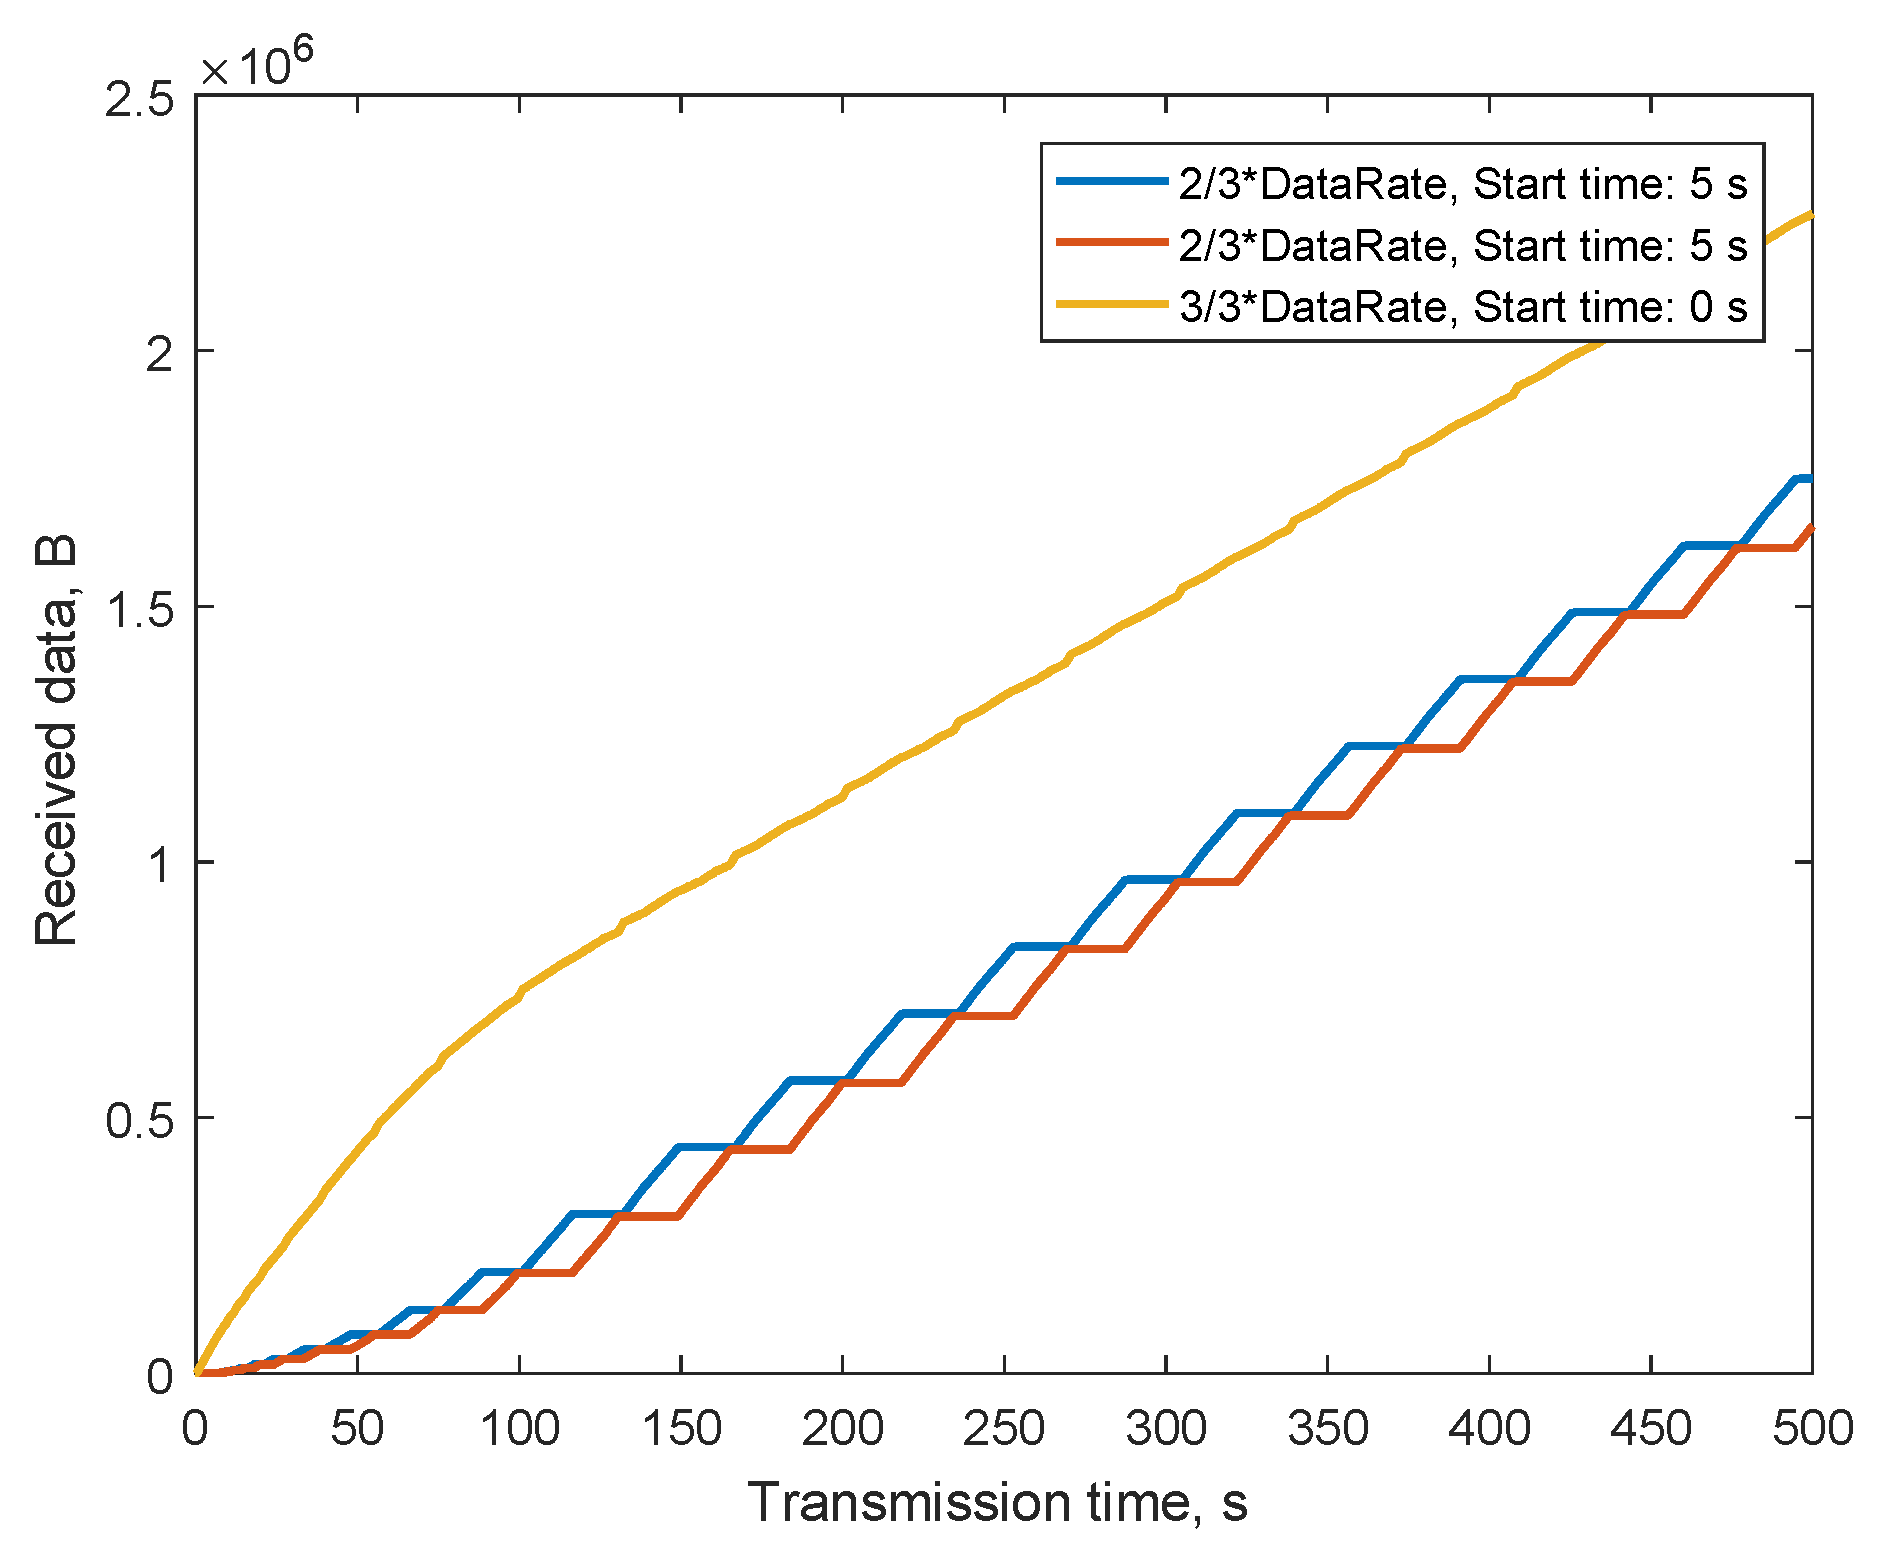
Scenario 2A: Here, the first two streams start generating data at the same time but are delayed by 5 s. In
Figure 15, a third stream generates data from the time 0 s and the first two streams are delayed by 5 s. After some time, the throughput of all streams balances to the same level.
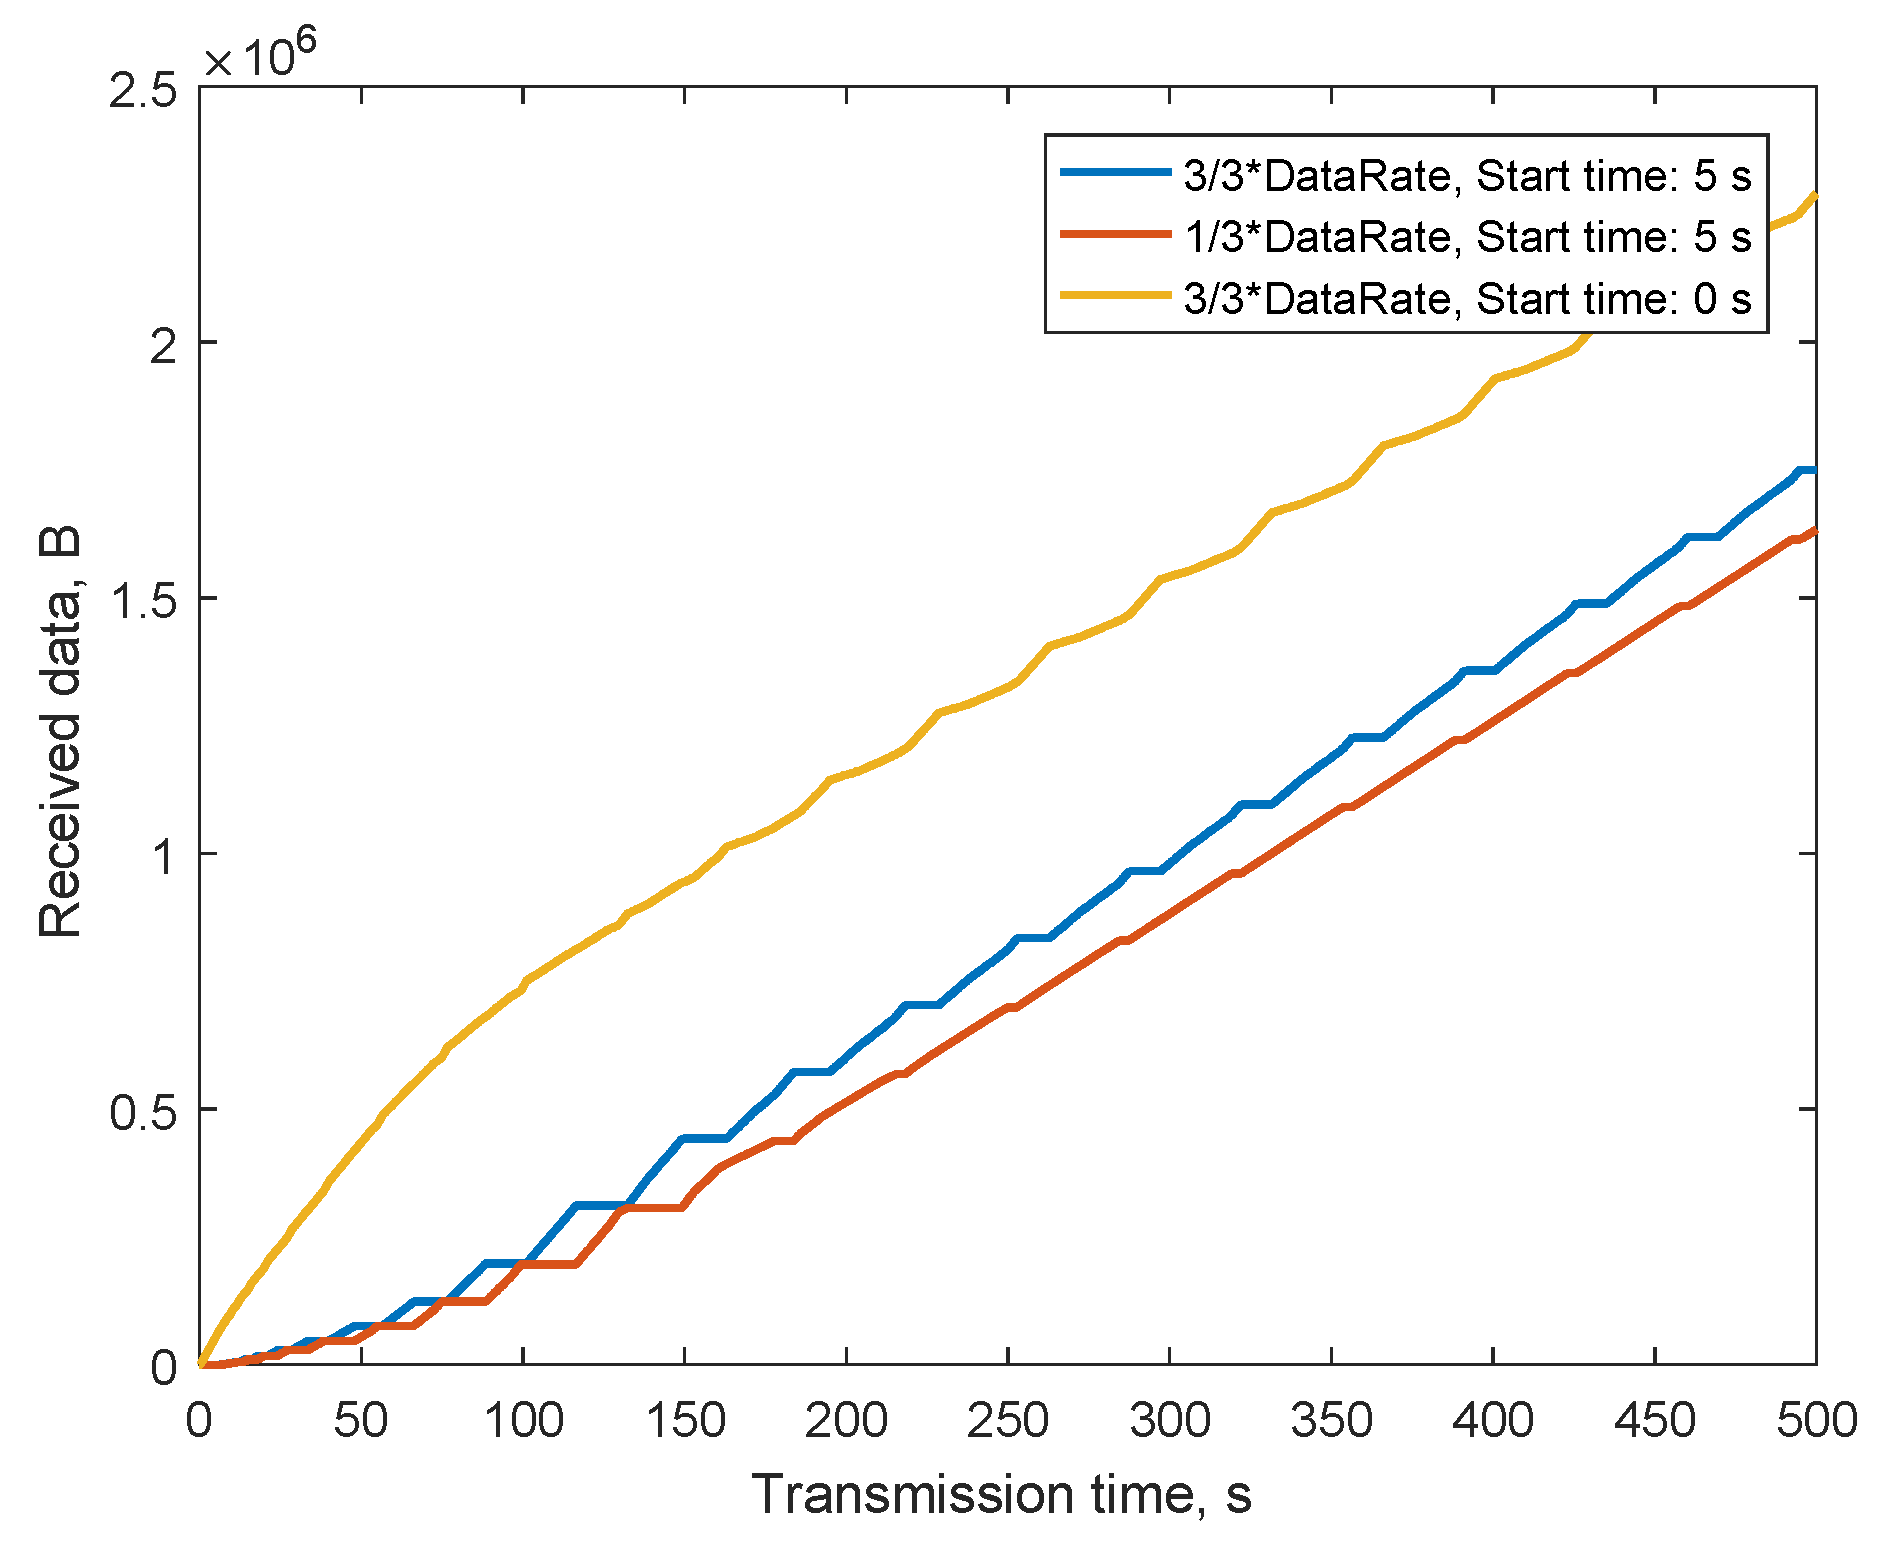
Scenario 2B: In comparison to the previous case, generation speeds of the first two streams (delayed streams) were modified to 3/3 and 1/3 of the maximum throughput, and the major difference was only in the time of reaching the balanced throughput. First stream reaches that slightly faster then the second as shown in
Figure 16.
From the results it is obvious that generation speeds do not affect the final throughput of any stream. In all cases, the line throughput was split equally among all transmitting streams. Via the simulations, it was discovered that when the second stream started transmitting after five seconds (real-case scenario with delay transmission from different end-point equipment, e.g., Smart Meters), it will take 200 to 250 s before the streams are balanced in scenario 1A and from 150 to 200 s in scenario 1B. This suggests that if at least one stream transmits data with one-third of the bandwidth, it takes less time for the streams to balance. For the cases where two streams out of three start to transmit after five seconds, it will take approximately 100 s in scenario 2A and between 80 to 100 s in scenario 2B.
4.3. Throughput Balancing in Multiple Stream Scenarios
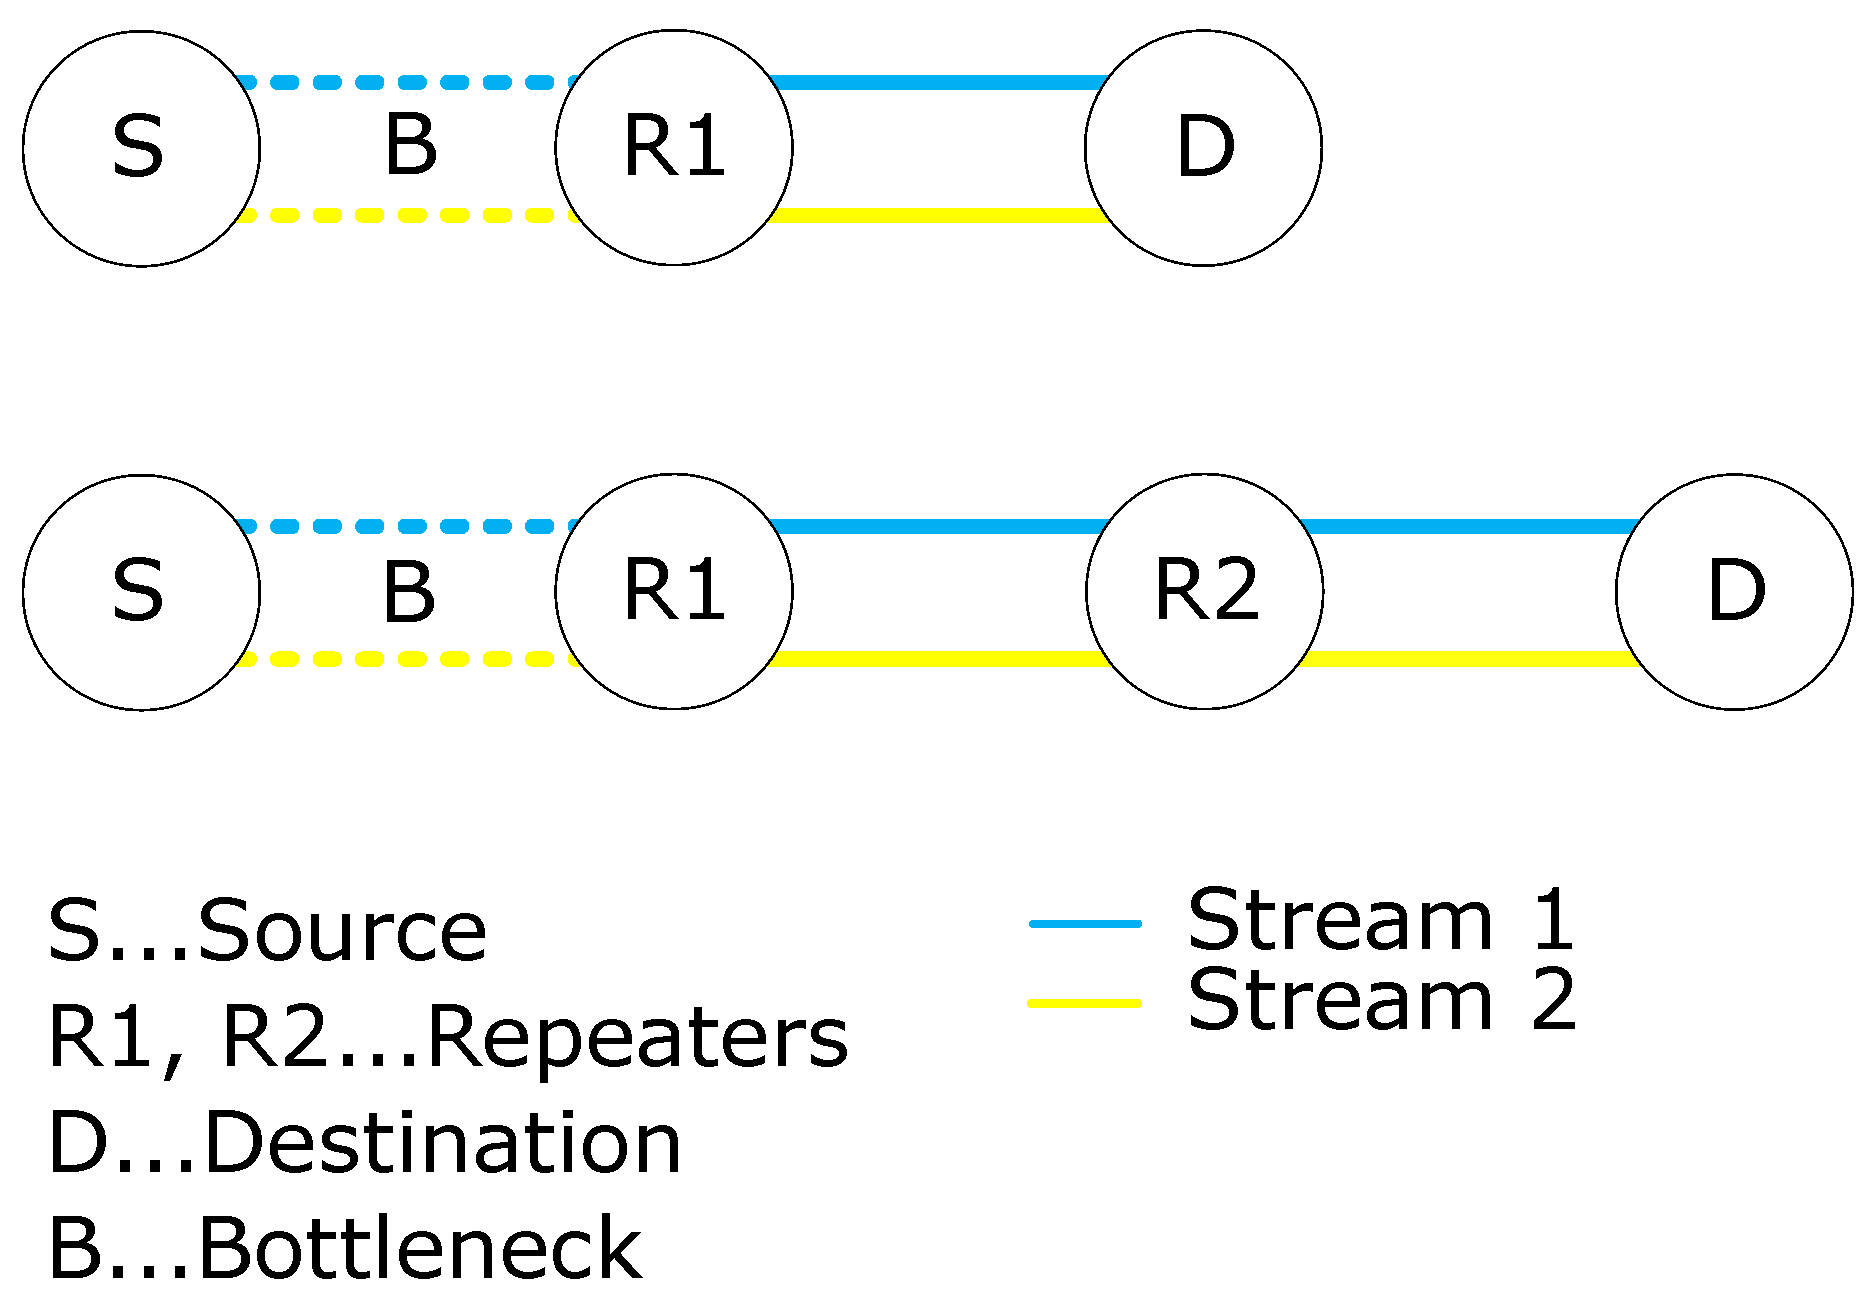
In this simulation, the throughput balancing between two streams was studied. One important parameter to investigate is the amount of time it takes to balance multiple streams if one or multiple streams start to transmit data with some delay. Two topologies from
Figure 17 were implemented with two UDP data streams. They consist of three and four nodes, two nodes as end points and one or two routers in the middle serving as repeaters. Simulations ran on both of these topologies. Maximum channel throughput between every node was set to 1 Mb/s, except for the channel between first end node and first repeater where the artificial bottleneck was inserted to observe its effect on the simulations. In these simulations, only two data streams were used for simplicity of the scenarios, and three values of bottleneck (100, 200 and 300 kb/s) and five delay times were applied (1, 5, 10, 100, 200 s) to determine the pattern for the balancing time.
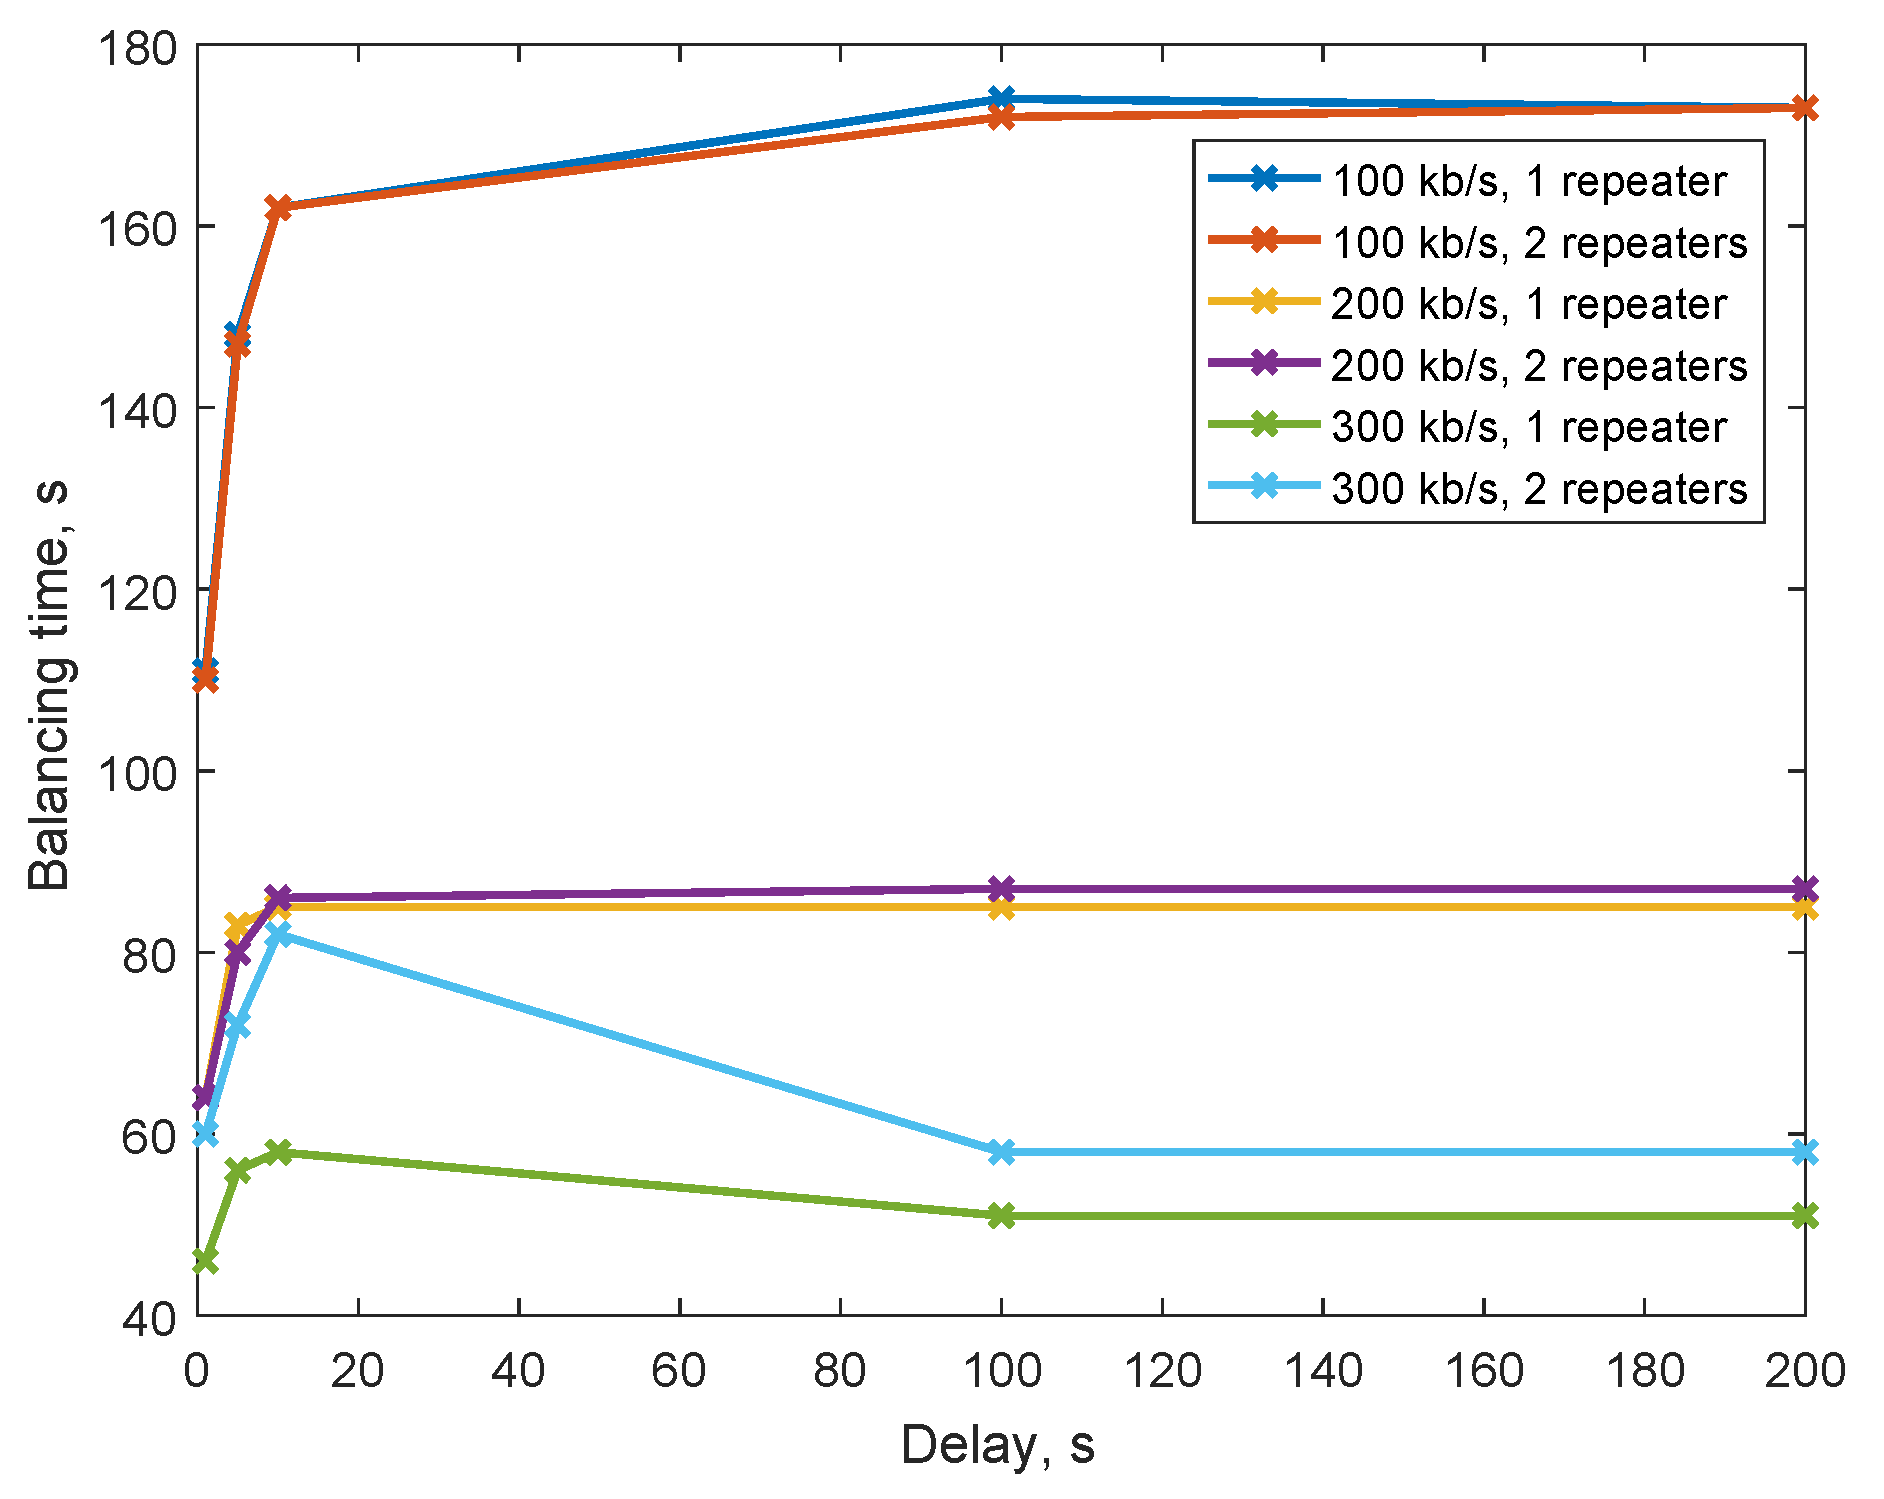
The resulting values shown in
Figure 18 are absolute values of balancing time, i.e., from the time the second stream started transmitting to the time the transmitting speeds were balanced. The lower value the bottleneck has, the longer time interval it takes to balance the streams. The number of repeaters does affect the balancing speed; however, in our simulations only bottleneck with 300 kb/s was significantly affected. It caused the balancing to take less time with delays 100 and 200 s. The reason why significant differences occurred only with the bottleneck value of 300 kb/s was most likely that bottlenecks 100 and 200 kb/s are extremely low values in comparison to the generation of data from both streams, which was 1000 kb/s (bottleneck 100–300 kb/s was considered from real-case scenarios obtained from our measurements [
22,
63,
64,
67]). Simulations discovered that when considering the implementation of PLC into the network in different locations, it is not necessary to take into consideration the influence of repeaters if there is a bottleneck link with lower throughput than around 30% of the stream data generation speed or of the link throughput between other nodes. If the second stream starts transmitting with delay higher than 10 s, the balancing time no longer rises, and in case of bottleneck value of 300 kb/s it even slightly decreases.
4.4. Effects of Repeaters and Bottlenecks on Data Throughput
The results from
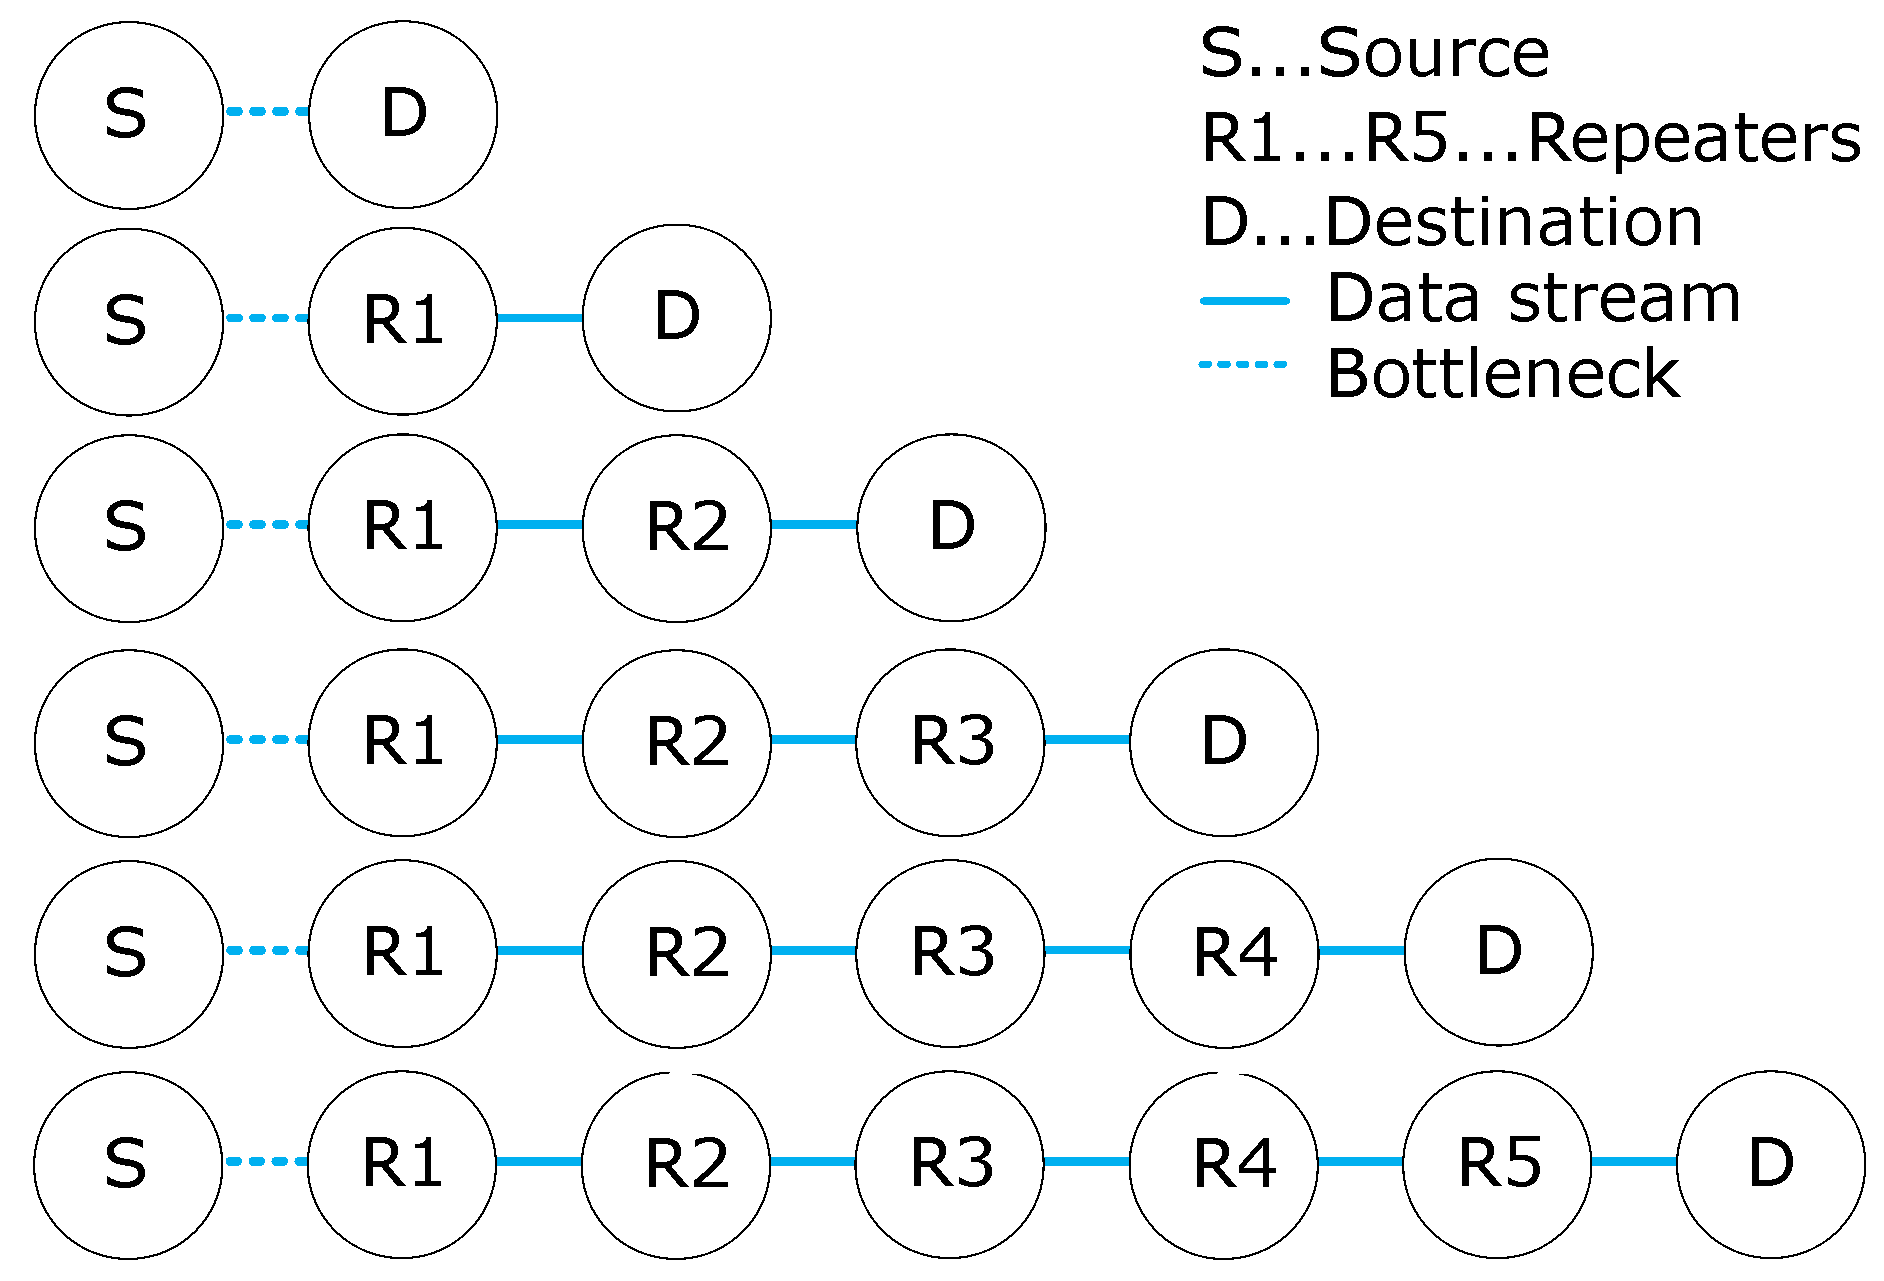
Figure 11 show that estimated theoretical values by the authors are decently accurate to the measured values in real infrastructure. For this reason, we introduce here simulations with real values as input. This section focuses strictly on the effect of repeaters on data throughput when bottlenecks are present on the route. Topologies, shown in
Figure 19, with 0 to 5 repeaters were used for simulation with 10 different values of bottleneck from 100 to 1000 kb/s. The bottleneck was always placed between the source and and router 1 (R1), except the topology with direct connection where the bottleneck was the direct link. The maximum throughput of all other links was set to 1000 kb/s. Significant throughput drop is expected in this simulation due to the delay caused by the repeaters during data re-transmission.
The results from the simulation are shown in
Figure 20. The most significant effect of repeater limitation is noticeable on higher bottleneck values. This means that calculating with repeater limitations is more important if the data throughput is significantly higher than the weakest point-to-point connection in a topology. The plot shows that maximum values do not reach the link available throughput, which is caused by the fact that the shown values of throughput are obtained on application layer that calculates with overhead.
The issue of influence of repeaters on data throughput was revealed via the measurements, which were after that used as an input for simulations. The reason is that the problems with bottleneck cannot be discovered via measurements on real topology because it has fixed parameters and usually only one particular bottleneck value. Through the simulations it was possible to simulate network throughput behavior with a small step of the bottleneck value. Lessons learned from the simulation provide information that can be used in another real location with different numbers of repeaters and bottlenecks. The results can provide utilities information about the suitability of the infrastructure for upgrade before implementing PLC/BPL technology. If the infrastructure proves to be unsuitable for the amount of traffic, it will prompt the utilities to upgrade connection points and power cables, which will ultimately provide higher performance of the PLC/BPL network.
5. Conclusions
This paper presents an evaluation of Broadband over Power Lines (BPL) technology, which benefits from the usage of already existing power lines as a communication channel. Over the years BPL has been considered as a promising technology in terms of future development of Smart Grids, and even in some cases it is the only available communication technology at the time; thus, knowledge of performance and its limitations is vital. In this paper, performance evaluation of Broadband over Power Lines technology with a focus on its use in linear topologies of distribution substations in modern Smart Grids was introduced. As we stated earlier in the state of the art section, the impact of repeaters on the network performance is still not exactly described, and thus planning of large-scale Smart Grid structures based on powerline communication technology lacks exact input values.
The main focus of this paper is to investigate the impact of repeaters in a linear topology of distribution substations on the performance of the communication network. In the measurement section, both laboratory and field tests were presented based on a real on-field scenario with six substations with a total power line length of 1364 m, where the impact of BPL repeater for different testing methodologies was observed in detail. Results discussed in the measurements section later served as input values for simulations of powerline networks with balancing of data throughput with multiple streams and throughput bottlenecks.
Besides the analysis of measured topologies, this research focused on simulations of the behavior of data transmission on the shared medium. In the first part, analysis of multiple streams on a simple point-to-point topology was studied. A total of 20 simulations were run. When the third stream joins the communication on the shared medium, its transmission speed rises and at the same time the transmission speed of the original streams slowly drops until they are equal. If there is a data stream transmitting at a significantly lower speed, as it was in scenario 1B, this stream’s speed is not affected in such scale.
Further, the focus was on balancing time—how long it takes for two streams to reach the same throughput if one starts to transmit with delay. The effect of repeaters was also studied here. Discovered balancing times were in general much higher than the delay times, e.g., for the delay of 10 s in two repeater scenario with a bottleneck of 300 kb/s, the balancing time was almost 60 s. This means that the streams that start to transmit sooner have more priority than the ones that start later. In this simulation, bottlenecks affect the results in a way that with higher bottleneck values balancing time decreases.
As our last investigation, the values taken from measurements were inserted into simulations to demonstrate the effect of repeaters and bottlenecks on the final throughput. According to the simulations, the throughput does not drop equally with different bottleneck values, lower bottleneck values mean lower throughput drop. This is most likely because of the fact that the limiting factor is not the repeater(s) but the bottleneck.
A significant contribution of this article is our focus on the effect of repeaters in PLC communication. From previous studies and our measurements presented in this paper, it is clear that the repeaters have a great impact on data throughput mainly because the repeaters introduce data processing delay on the communication route. In future work, we want to evaluate the possibilities of extending the existing PLC simulation tool in NS-3 for repeater nodes. Another option is to survey the possibilities of MATLAB and Simulink. The evaluation of multiple different simulators could bring higher precision prediction of PLC network behavior.


