Review

Endoscopic Optical Imaging Technologies and Devices for Medical Purposes: State of the Art

1
MENRVA Research Group, School of Mechatronic Systems Engineering, Simon Fraser University, Surrey, BC V3T 0A3, Canada
2
School of Engineering Science, Simon Fraser University, Burnaby, BC V5A 1S6, Canada
3
Imaging Unit, Integrative Oncology, BC Cancer Research Center, Vancouver, BC V5Z 1L3, Canada
*
Author to whom correspondence should be addressed.
Appl. Sci. 2020, 10(19), 6865; https://doi.org/10.3390/app10196865
Submission received: 11 August 2020 / Revised: 9 September 2020 / Accepted: 22 September 2020 / Published: 29 September 2020
(This article belongs to the Special Issue Recent Advances in Optical Bioimaging)

Abstract

:
The growth and development of optical components and, in particular, the miniaturization of micro-electro-mechanical systems (MEMSs), has motivated and enabled researchers to design smaller and smaller endoscopes. The overarching goal of this work has been to image smaller previously inaccessible luminal organs in real time, at high resolution, in a minimally invasive manner that does not compromise the comfort of the subject, nor introduce additional risk. Thus, an initial diagnosis can be made, or a small precancerous lesion may be detected, in a small-diameter luminal organ that would not have otherwise been possible. Continuous advancement in the field has enabled a wide range of optical scanners. Different scanning techniques, working principles, and the applications of endoscopic scanners are summarized in this review.

1. Introduction

The use of optical devices in medical applications has increased in the last few decades. The main purpose of optical imaging techniques is the direct localization of lesions and malignancies in the organs to inform and assist with surgical procedures. The imaging of internal organs can either be structure-based or surface-based. The former among these is a non-invasive technique used to scan a larger area and quickly localize the abnormality using an X-ray, ultrasound, computed tomography, or magnetic resonance imaging technique. These techniques are characterized by high penetration depths; but, the spatial resolution is limited (~50 µm to 2 mm), which hides the finer structure details. Thus, to accurately detect a malignant surface, follow-up imaging using surface-based imaging is performed. Even though these imaging modalities like endoscopy are invasive in some cases, they provide live and high-resolution imaging (in the micrometer range).
In surface-based imaging, the lesion area can be directly monitored by inserting an endoscopic device to observe the desired area. The size of the endoscopic probe determines the accessibility to the body area of interest. Traditional endoscopic devices have a rigid structure where the rigidity and difficulty of maneuvering it inside the body limits the accessible area. Miniaturization of micro-electro-mechanical systems (MEMSs) in conjunction with the evolution of optics permits the fabrication of small-sized and flexible endoscopes. Thus, the evolution in these fields allows medical users to image smaller areas of the body that were inaccessible in the past. The early detection of lesions, tumors, etc. permits more accurate diagnoses, which can enhance life expectancy in the case of cancerous tumors. The diagnostic procedure based on endoscopic imaging is a multi- step process where the lesion is first detected using an imaging device, characterized using advanced techniques, and confirmed using histological procedures [1].
Tissue imaging can be either performed using a backscattered or fluorescence light configuration [2]. In the former case, the image is provided by the light diffusely reflected (or backscattered) from the superficial layers of the tissue and contrast is provided by the differences in the scattered light from different tissue structures. In the latter case, the incoming light from the laser is absorbed by fluorophores in the tissue and re-emitted at a longer wavelength. In this case, the image contrast is provided by the fluorescence signatures of the different structures. The image contrast in fluorescence imaging can be reduced by background fluorescence. To increase the contrast, the tissue is often stained using a fluorophore material.
A large number of optical devices have been researched and developed for imaging purposes. Among these, optical coherence tomography (OCT), confocal microscopy (CM), and photoacoustic (PA) imaging are the predominant ones. The performance of an endoscopic device depends on the choice of the actuation method and the optical components used in its fabrication. Early flexible endoscopes were developed using coherent optical fiber bundles (CFBs) relying on multiple optical fibers to deliver the light to the imaging target surface, which subsequently receive the reflected light using a charge-coupled device (CCD), video chips, or optical fibers. The resolution of these devices is limited by the discrete fiber pixilation, which avoids the miniaturization of such devices below 3 mm [3,4]. Most of the current endoscopes use a complementary metal oxide semiconductor (CMOS) chip at the tip of the endoscopes due to its low fabrication cost, ability to withstand in magnetic fields, and the possibility of miniaturization [5].
The limited resolution in such cases can be improved using laser light scanning at the proximal end of the fiber. In this case, the resolution of the image is obtained in a temporal basis instead of a spatial one as a single pixel is detected at a time. The resolution in this case is still based on the number of fibers present in the bundle and can be increased using specific optical lenses that will be discussed later in the paper. The light beam can be scanned either by actuating an optical fiber at a resonance or non-resonance frequency, actuating a micromirror surface to deviate the light shining on it, or using a galvanometer scanner at the proximal end. The actuation of these components can be either performed using electrostatic, electrothermal, piezoelectric, electromagnetic, or shape memory alloy actuators. The size of an endoscopic device is highly limited by the size of the actuator used [3,6].
In addition to the actuation methods, the actuation frequency is an important parameter affecting the performance of the scanner. The scanning of the light in an endoscopic device must have a frame rate of over 5 Hz to overcome motion artifacts caused by the motion of the organs during respiration, peristalsis, and beating of the heart. The scanning of the target surface can be performed using a raster, spiral, Lissajous, circular, or a propeller pattern. In the raster scan, the fiber is scanned along one axis using a sinusoidal or triangular waveform and a step-sized increasing triangular wave in the other direction. In the spiral scan, the two axes are actuated with increasing sinusoidal waves with a 90° phase shift to sweep the area inside the spiral. In a Lissajous pattern, two axes are driven by two sinusoidal waveforms with different frequencies and phase shifts. Circular and propeller patterns are less frequently used in optical scanning devices [2].
This paper aims to describe the technology behind optical imaging devices used in medical applications. The paper is structured as follows: Section 2 describes some of the most used medical imaging technologies, including OCT, CM, nonlinear microscopy, and the PA imaging techniques. Section 3 discusses two different kinds of the optical scanners that are distinguished based on the imaging direction with respect to the axis of the device. Resonant, non-resonant, and semi-resonant scanning principles are reported in Section 4. Section 5 illustrates the different actuation methods along with their applications in optical imaging devices. Section 6 outlines the different scanning patterns followed during beam scanning. Section 7 reports some discussions and comparisons about different scanners available to date, along with some of their potential applications based on the literature study. Section 8 contains conclusions.

2. Medical Imaging Applications

The different techniques used for tissue and structural imaging are described below and include OCT, CM, nonlinear microscopy, and PA image acquisition.

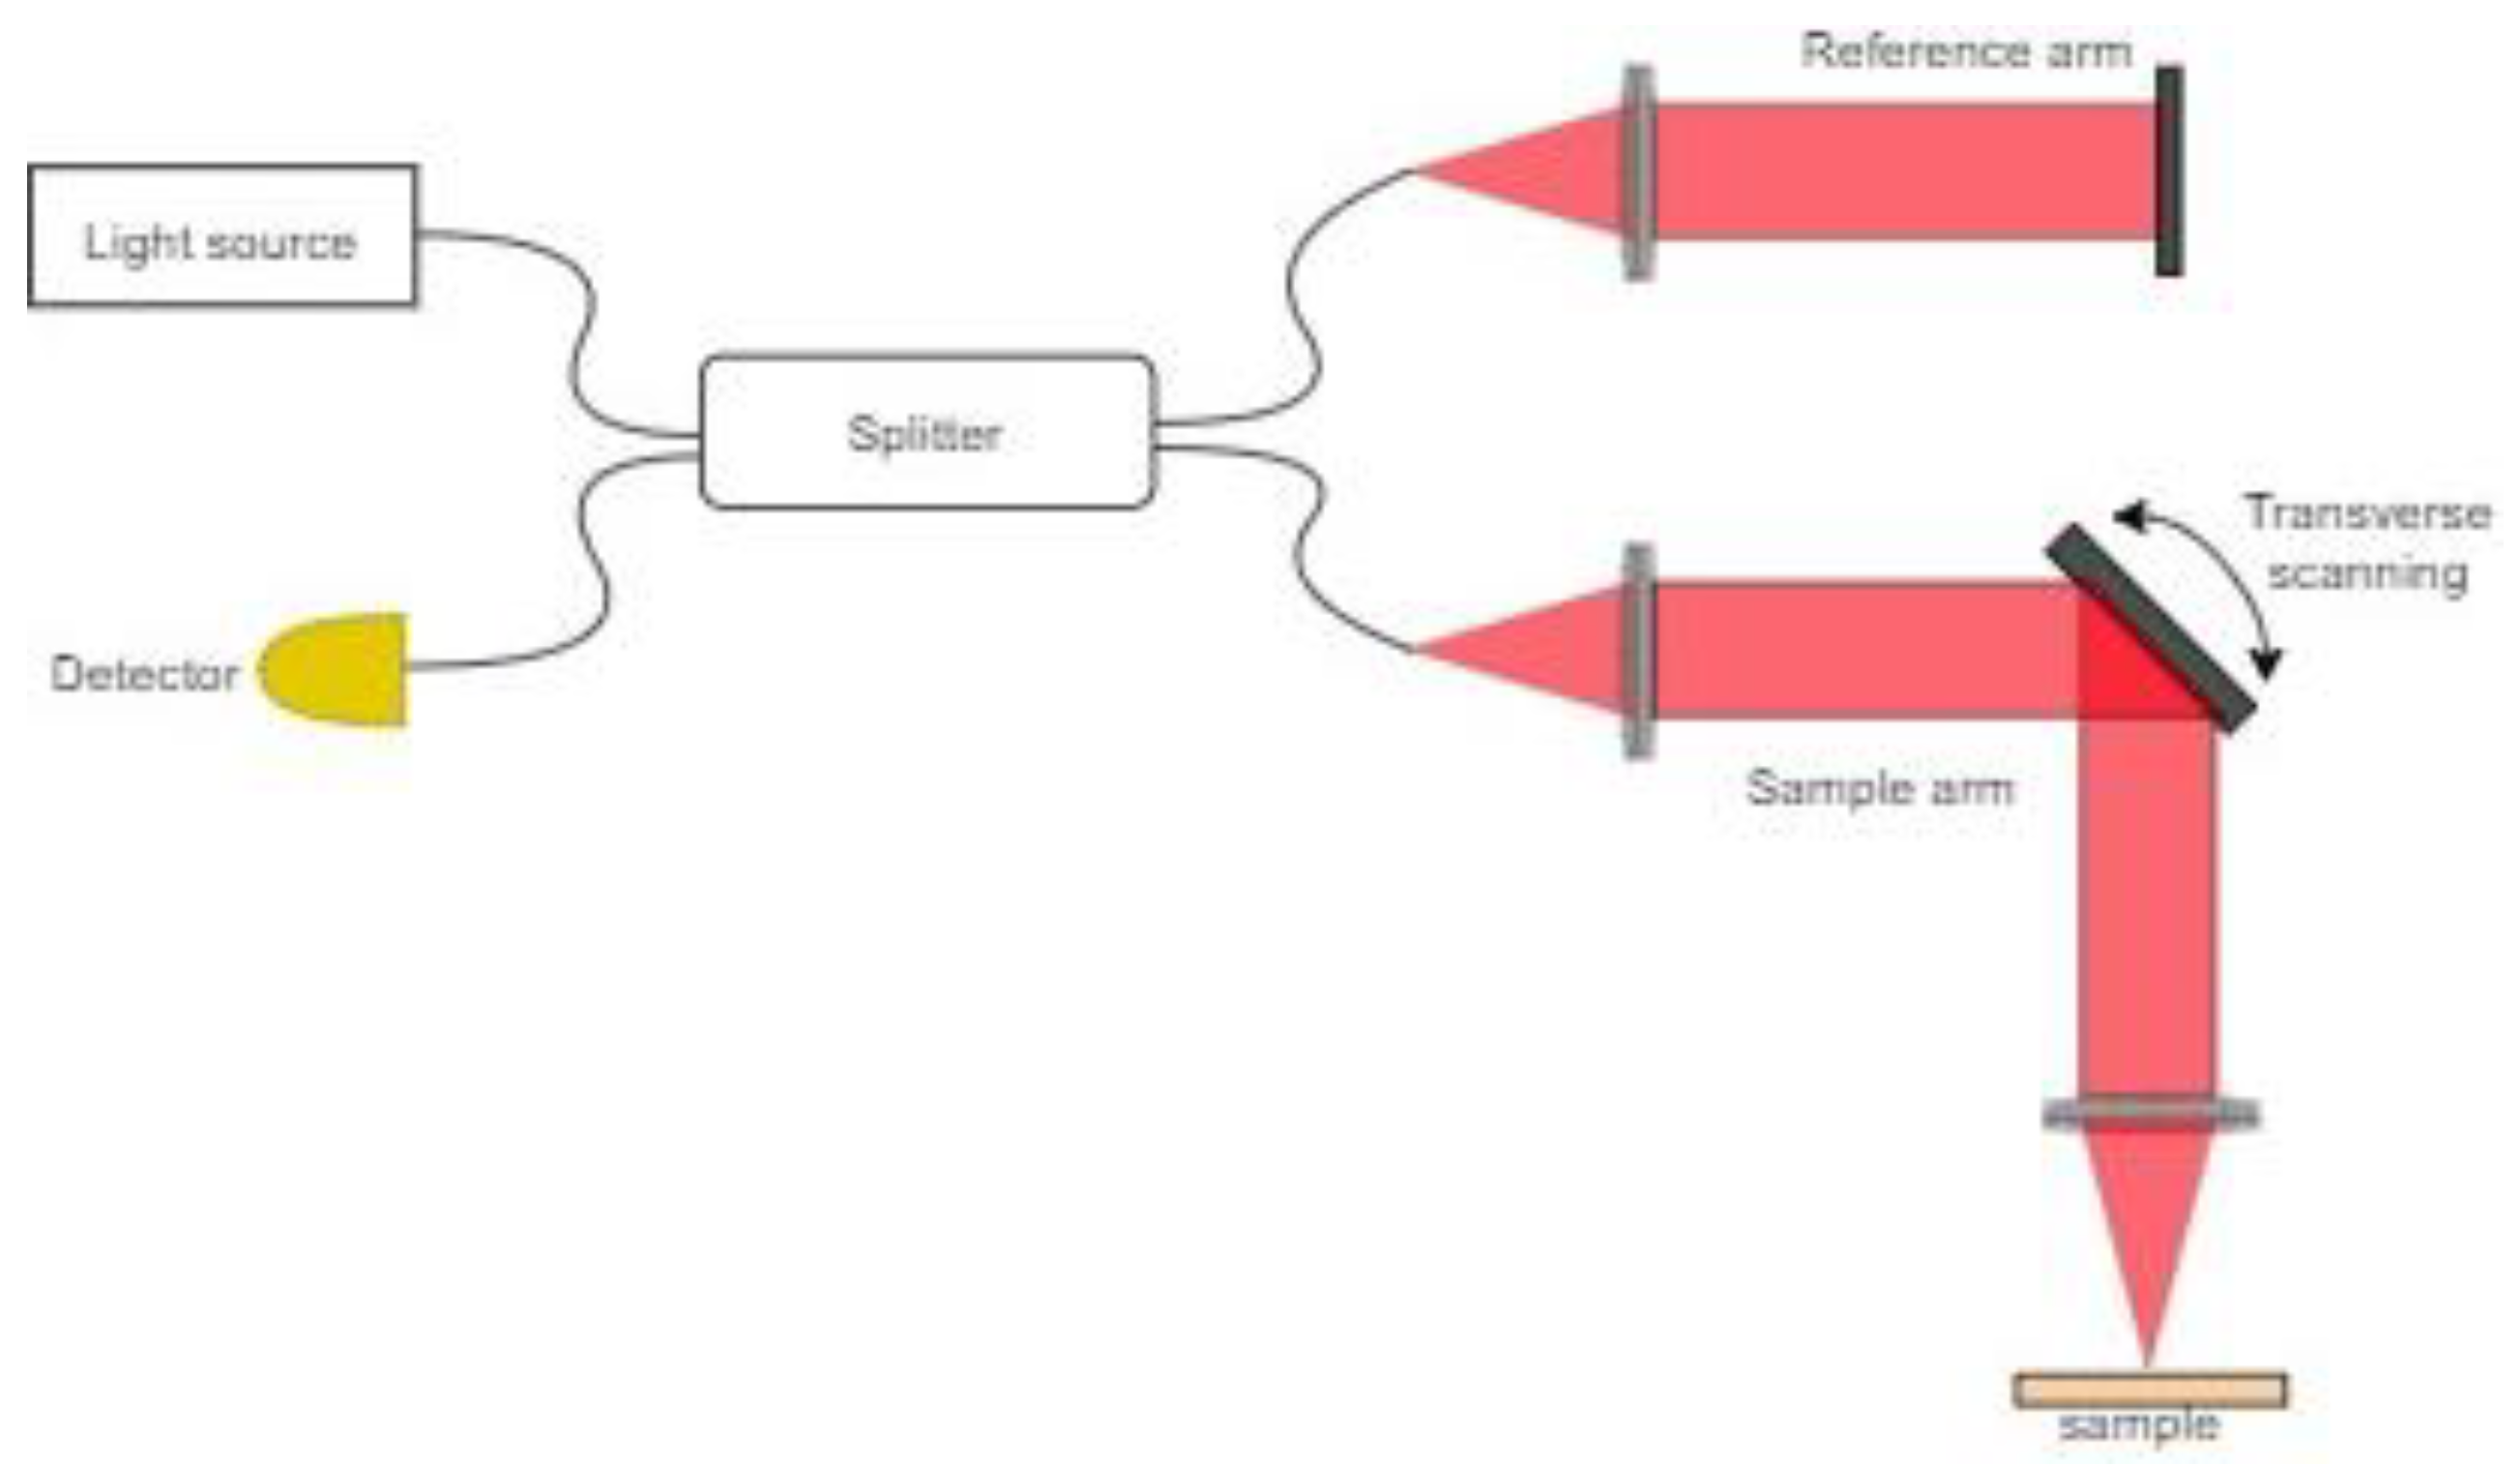
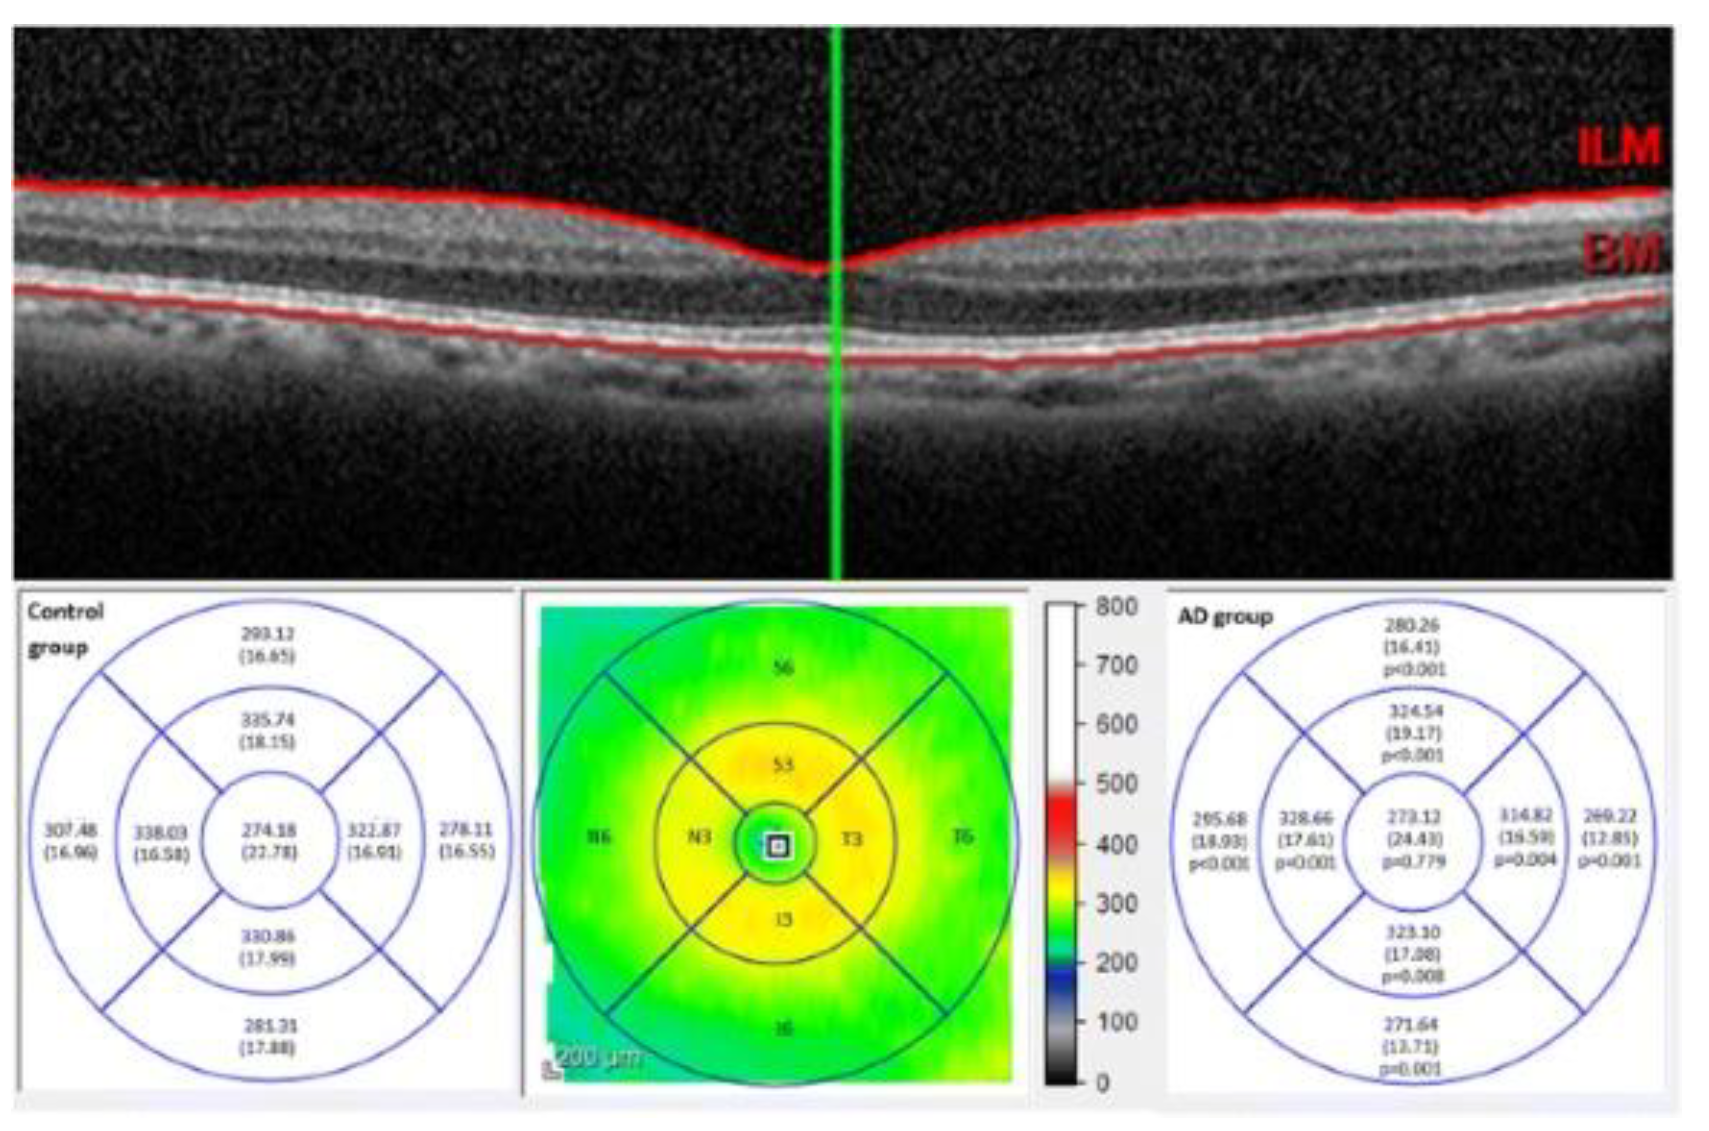
2.1. Optical Coherence Tomography

The working principle of OCT is analogous to that of an ultrasound, with the difference that low coherent light is used instead of sound. Laser light is transmitted to the semi-transparent tissue surface using an optical fiber or other means discussed later in the paper. The light backscattered from the tissue is monitored to reconstruct a cross-sectional image of the targeted tissue. The differential backscattered intensity from different tissue interfaces (refractive index changes) provides the contrast in OCT [7].
The speed of light in tissue (225 m/µs) is about five orders of magnitude larger than the speed of sound in tissue (150 × 10⁵ m/µs). The resolution of an image is directly proportional to the wavelength of the used signal. Smaller wavelength light provides a finer resolution (10 to 100 times) image as compared to that of ultrasound [8]. On the other hand, the time delay between the source signal and the reflected signal is much smaller and cannot be measured directly. Thus, an interference pattern must be measured either using a Michelson or a Mach–Zehnder interferometer [9]. The light coming from the laser source is split into two paths: one going towards the sample (called sample arm), and the other going towards a mirror (reference arm). The backscattered light from the tissue is compared with the light from the reference arm to form an interference pattern if the two light components are within the coherence length of the light source [10]. A schematic diagram of an OCT scanner is shown in Figure 1.
Scanning can be performed in a time domain (TD) or in a Fourier domain (FD). In TD-OCT, a low-coherence broadband light source provides light to the two arms through an optical splitter. The path length of the reference arm is changed in time by moving the reference mirror in the axial direction. The interference pattern between the reflected light from the reference arm mirror (with distance travelled variable in time) and the backscattered light from sample provides a depth profile of the sample tissue. The two-or three-dimensional structure image is obtained by transversally scanning the light beam along the sample arm [10,11].
In FD-OCT, the reference arm is static. Axial scanning can be performed in time using a frequency sweep of the light source to cover the broad bandwidth (swept-source OCT, or SS-OCT), or in space using a spectrometer to separate the different wavelengths on the detection side (spectral domain OCT or SD-OCT). Depth information of the sample is obtained using the inverse Fourier transformation. In SS-OCT, the light source is a rapidly tunable laser, and the detector is a simple photodiode. In SD-OCT, the light source is a low-coherence laser, and the detector is a line scan camera. The elimination of the mechanically moving mirror in FD-OCT allows the sample to image with higher acquisition speeds, which is the main reason that most of the current OCT systems are FD-OCT [10,11].
Analogous to ultrasound, it is also possible to use a doppler OCT (DOCT) to measure the velocity of the scattering materials flowing through a channel, such as a blood vessel [10].
In OCT, the lateral resolution depends on the lens system as:
( δ x ,   δ y ) = 0.56 λ N A ,
with λ being the central wavelength of the light spectrum, and NA is the numerical aperture. The lateral field of view (FOV) is given by:
F O V x , y = f   t a n θ 2 ,
where f is the focal length of the lens, and θ is twice the scanning angle [10].
The axial resolution depends on the light source used by:
δ z = 2 l n 2 π λ 2 Δ λ ,
where Δλ is the full width half maximum of the light spectrum.
The axial FOV or depth of field in the possible image zone is given by:
F O V z = 0.9 n λ N A 2 ,
with n being the index of refraction in the medium [9,10].
OCT has gone through enormous development since its first appearance in the early 1990s. These improvements comprise the higher imaging resolution (axial resolution in the range of 1–15 µm, lateral resolution in 2–25 µm range), acquisition rate, deep tissue penetration (up to 3 mm), and methods of light transmitted to the target area [2,10].
OCT is largely used in ophthalmology to image the retina [12,13]. The cross-sectional OCT image allows the identification of different structure layers in the eye, which can be used as a biomarker in diagnosis. Kim et al. imaged the thickness of the retinal layer using an SD-OCT device and correlated the thickness to the mini-mental state [12]. Cunha et al. determined that patients with Alzheimer’s disease (AD) have a thickness reduction of the peripapillary retinal nerve fiber layer (pRNFL) and the internal macular layer. An OCT image of the human retina is shown in Figure 2 along with the nine sector Early Treatment Diabetic Retinopathy Study (ETDRS) grid of the macular area with the average thickness values [14]. Recent development in the optical field utilizes and facilitates miniaturization of the OCT scanners at microscopic ranges enabling in vivo imaging of the blood vessels and hollow cavities in the body, such as the colon, esophagus, urinary tracts, and lungs [8,15,16]. Various instruments used to transmit and scan illuminating light on the target tissue sample and collect the backscattered light are discussed later in the paper.

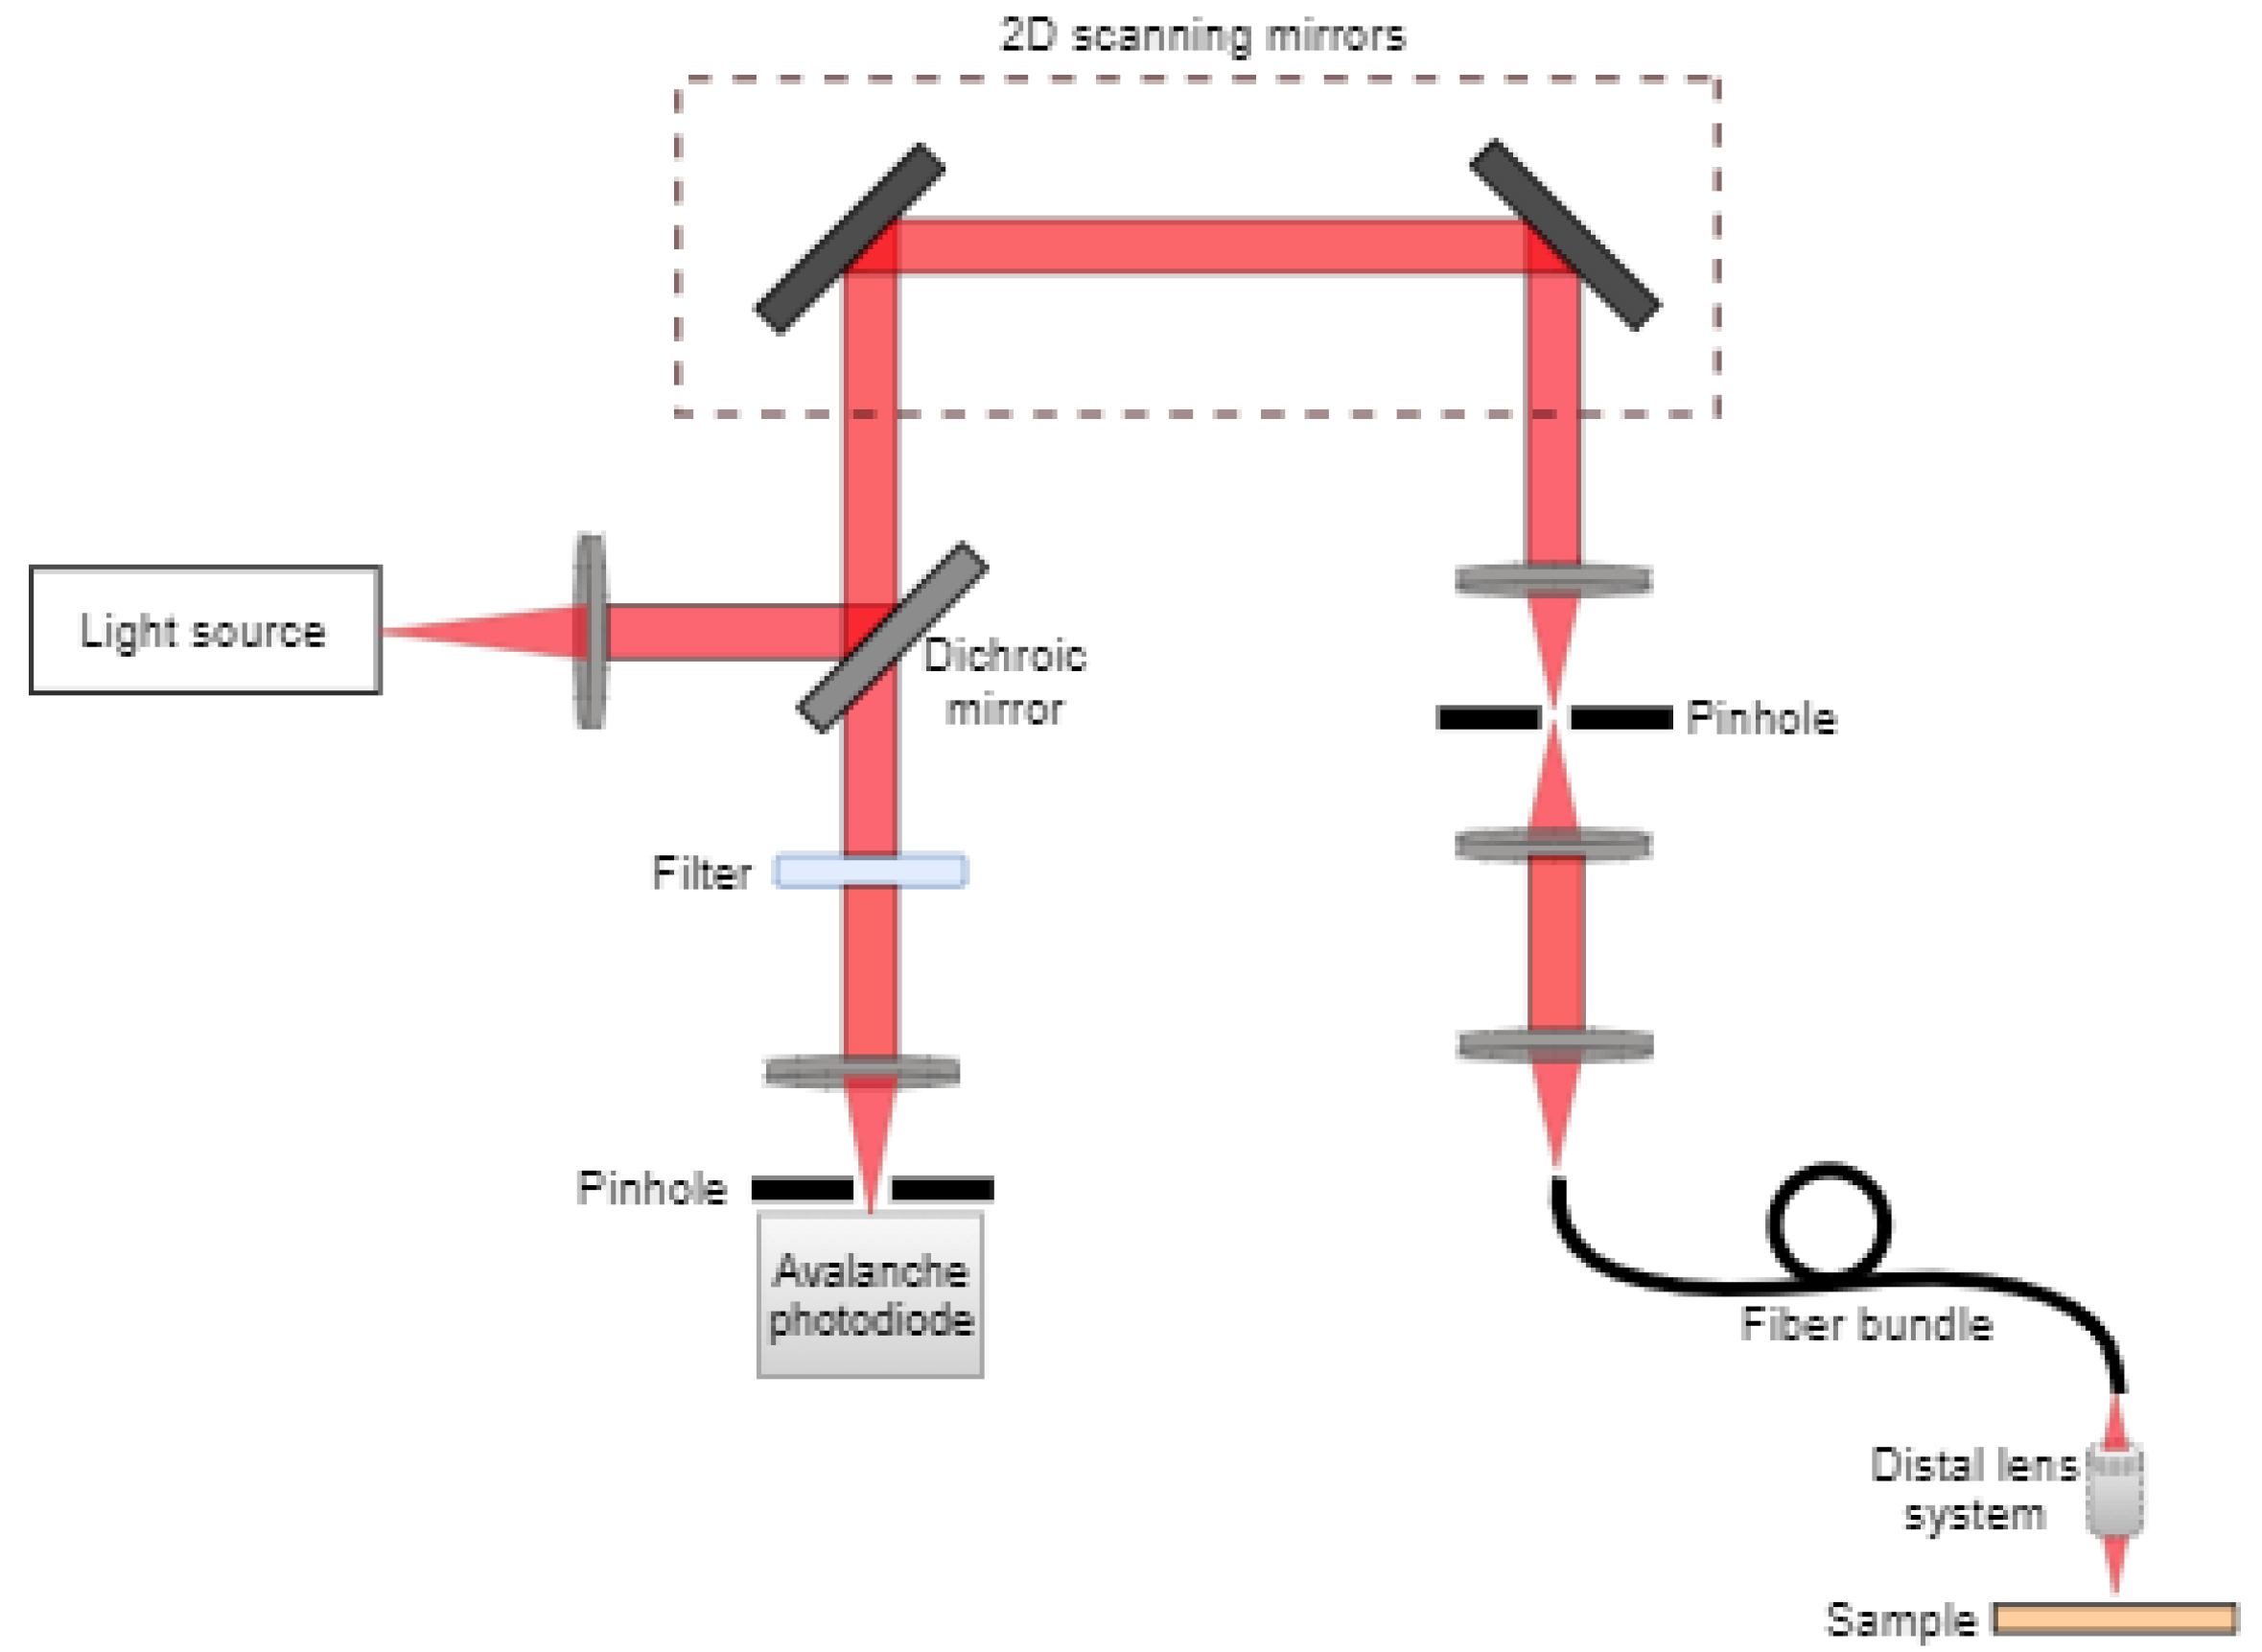
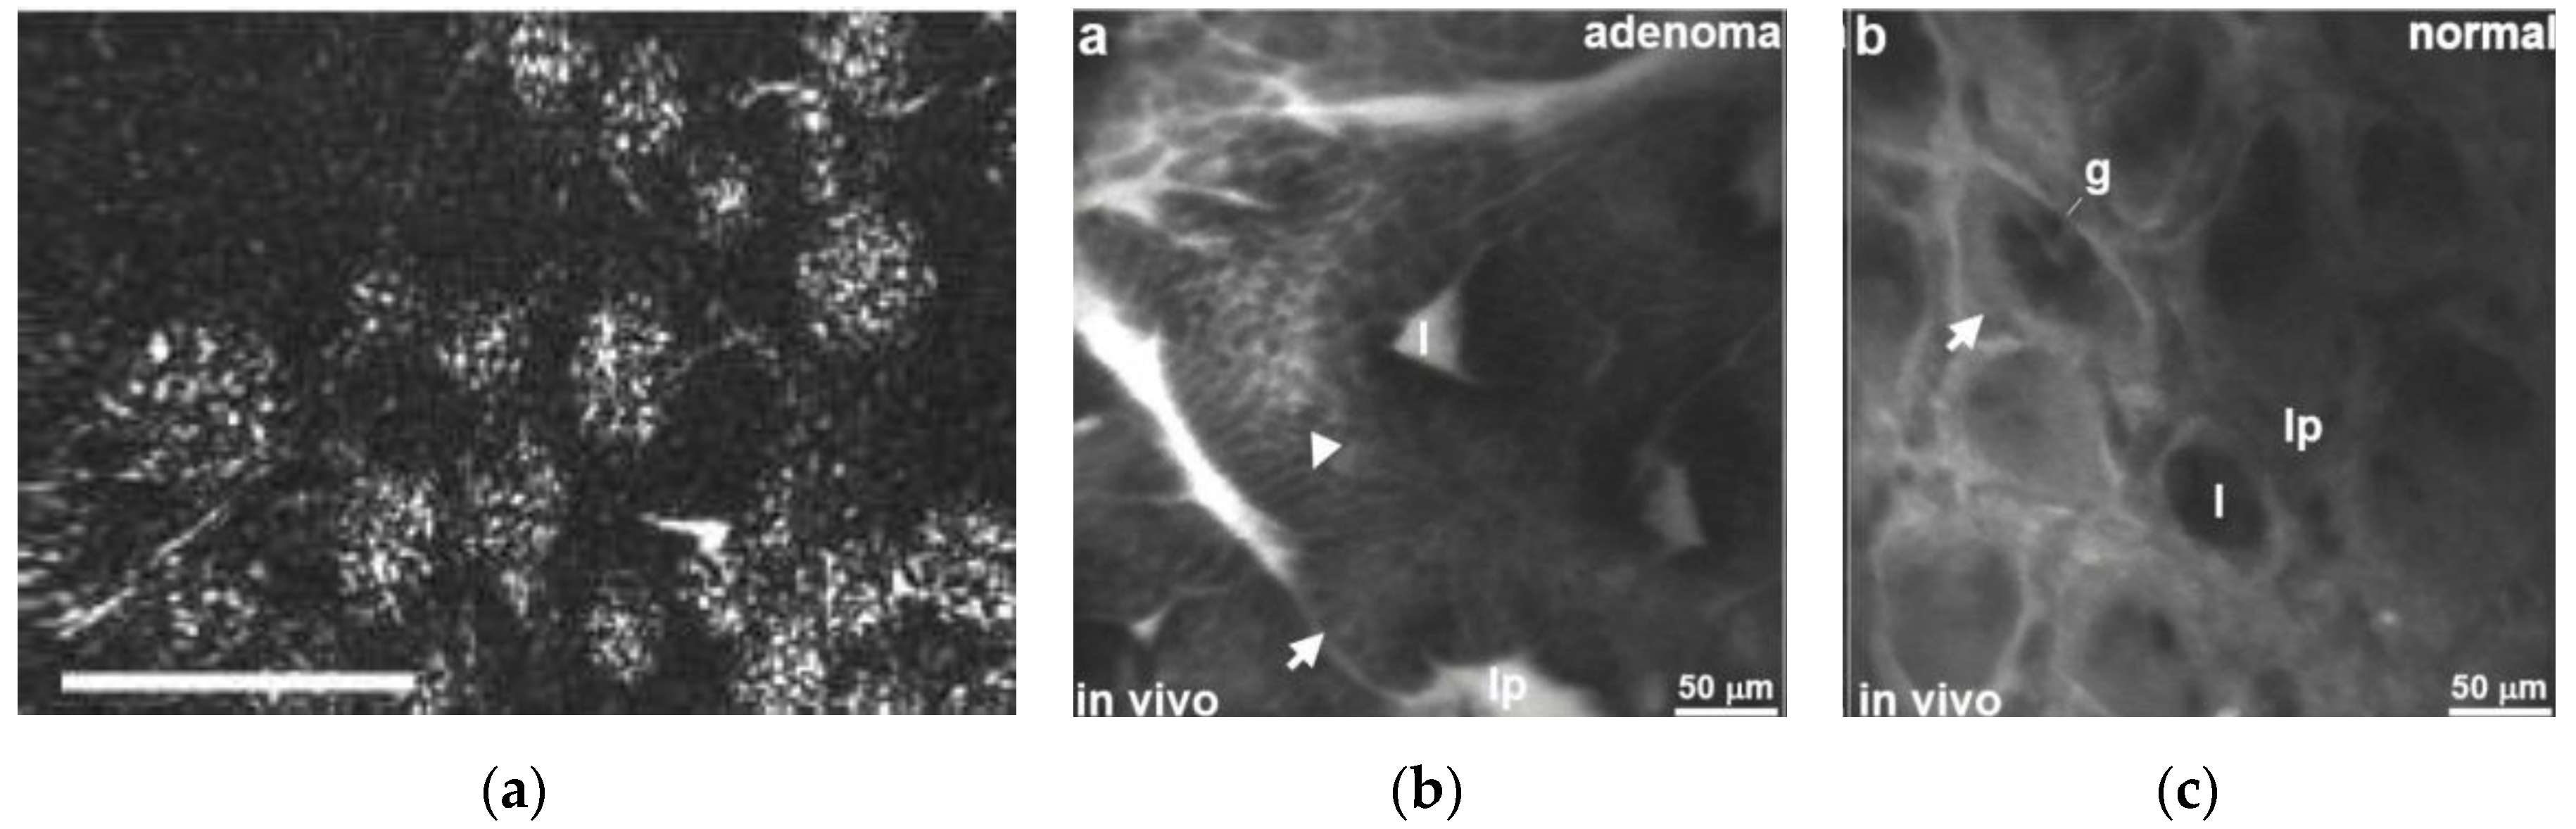
2.2. Confocal Microscopy

In a conventional epi-reflectance microscope, the object (specimen) is uniformly illuminated using a light source, and the image is obtained from the reflected light. Biological tissue is a highly light-scattering media. Thus, the scattered photons generated from the out of focus refractive index differences represent noise causing blur in the image. In confocal microscopy (discovered in 1957), the sample is illuminated using a point illumination system, where out-of-focus light is rejected by a pinhole placed at a plane optically conjugate to the object. As a single point of the sample is illuminated at a time, scanning methods are required to generate 2-D or 3-D images using a confocal microscope. For beam scanning, it is possible to use either a single beam for scanning using micro mirrors or other fiber optic techniques discussed later in the paper, or multiple beam scanning using the spinning Nipkow disks or spectral encoding. The imaging of thick sections is accomplished using optical sectioning by imaging virtual slices of the sample. The depth of imaging can be changed by refocusing the light [10,17].
The originally proposed trans-illumination confocal microscope used two objective lenses for illumination and detection of the light passed through a pair of pinholes placed at the light source to create a point source and at the detector to avoid the out-of-focus noise light signal. Thus, the pinholes act as a filter that pass information carrying ballistic photons and reject the scattered out-of-focus photons. Consequently, this configuration generates higher resolution images. The contrast in reflectance-based confocal microscopy is based on the scattering properties of the tissue sample; whereas, the contrast in fluorescence-based confocal microscopy is given by the fluorescent properties of the sample. In the latter case, the resolution is increased by staining the sample with fluorophores that increase the contrast and sensitivity of the image [10,18].
The size of the pinholes affects the lateral and axial resolution of the obtained image and can be measured by placing the point object at the focal point of the objective lens. The resolution can also be described in terms of the Airy pattern, which is the light intensity distribution near the focal point. The Airy pattern in confocal microscopy has a narrower central lobe and attenuated side lobes, providing for high resolution. The transverse resolution is given by Equation (1), while the axial resolution can be described as [10]:
δ z = 0.89 λ n ( 1 c o s θ ) ,
where θ is the angular aperture (half angle of the marginal ray).
The lateral resolution in confocal microscopy is less than 1 µm, and the axial resolution is about 1 µm. In a fluorescence-based system, the resolution depends on the point spread functions of the illumination and detection signals, which differ from each other due to the Stokes shift. In fiber optic confocal microscopy, the fibers used for illumination and detection act as pinholes [10].
Dickensheets and Kino fabricated one of the early fiber optic confocal microscopes, where the single mode fiber illuminates the beam on the target sample, and the beam is scanned along the sample using torsional scanning mirrors [19]. The continuous development in the MEMS field facilitates the miniaturization of devices and achieving better imaging with higher resolution. Liu et al. developed a 3-D scanning fiber optic confocal microscope, which is able to scan with a depth of field of over 400 µm. An optical fiber carrying the illuminating light is excited at resonance by an electrothermally actuated MEMS mirror. The scanner is able to image the tissue surface with a lateral resolution of 1 µm, and an axial resolution of 7 µm [18]. A large number of different confocal microscopes are reported in the literature and are based on different scanning methods to image different sections of the body organs, which are described later in the paper [20,21].
In case of confocal endoscopy, the illumination and collection system are aligned on a single focal plane. The laser light is transported to the distal lens using an optical fiber bundle focused at the tissue sample. The reflected light is refocused through the same lens with a pinhole, which excludes the out-of-focus scattered light, increasing the resolution. Usually, the scanning is made possible by placing the scanning mirrors at the proximal end of the fiber bundle. The systematic design of a confocal endoscope is shown in Figure 3.
Cell-viZio developed by Mauna Kea Technologies is one of the most widely used technologies for clinical applications that uses a variety of confocal miniprobes to provide high-quality in vivo tissue imaging [22]. The newly developed Cell-viZio device provides confocal fluorescence microscopy imaging using optical fibers. This technology is named fibered confocal fluorescence microscopy (FCFM). Laemmel et al. tested three different FCFM probes for microvascular observations and compared the results with intravital fluorescence imaging proving the flexibility, micro-invasiveness, and in vivo imaging of the deep areas over the conventional microscopy. The probe with the smallest cross-sectional area has a diameter of 650 µm, and provides images with lateral and axial resolutions of 5 and 15 µm, respectively, with a frame rate of 12 Hz [23]. Recently, Wang et al. developed an ultra-small sized confocal endomicroscope. The 2.4-mm-diameter probe (compatible with the 2.8-mm working channels of clinical endoscopes) used by Wang et al. to image the colon of a mouse provides images with a lateral and axial resolution of 1.5 and 12 µm, respectively. The rigid length of the head of an imaging probe is one of the key parameters that dictates the body part that can be imaged. The optical path of the light beam at the fiber tip is folded on-axis using reflecting mirrors to reduce its distal rigid length. The large field of view of 350 µm × 350 µm, the small working distance of 50 µm, and the small diameter make this device compatible in future clinical applications [24]. Figure 4a shows an in vivo confocal reflectance image of the tissue phantom containing cervical cells and collagen [20], and Figure 4b,c show confocal images of an adenoma [24], and the normal mucosal surface of the colon of a mouse in fluorescence [24].

2.3. Nonlinear Microscopy

Nonlinear microscopy is an alternative to conventional confocal microscopy and relies on the use of nonlinear optics, where the relation between the polarization and electric fields is non-linear. In confocal microscopy, a pinhole is used to exclude the out-of-focus light coming from the sample, but the illumination light still achieves a large excitation volume. The absorption of the illuminating energy by the tissue surface can cause damage to the tissue surface, denoted as phototoxicity. In nonlinear microscopy, high-energy pulses are emitted by a laser source with a low average energy provided to the sample, which reduces the chances of phototoxicity. In this process, the laser light excites the molecule, and its relaxation to ground state produces the fluorescence emission of light [25].
Different technologies using nonlinear optics relying on multiphoton processes, higher harmonic generation, and Raman scattering are briefly discussed below. By scanning a light beam using different technologies, it is possible to generate 2-D or 3-D images, as discussed further in this paper. Analogous to a microscopic device, it is possible to design a flexible endoscopic probe. The schematic design of such an endoscopic probe with the scanning mechanism at the distal end is shown in Figure 5.

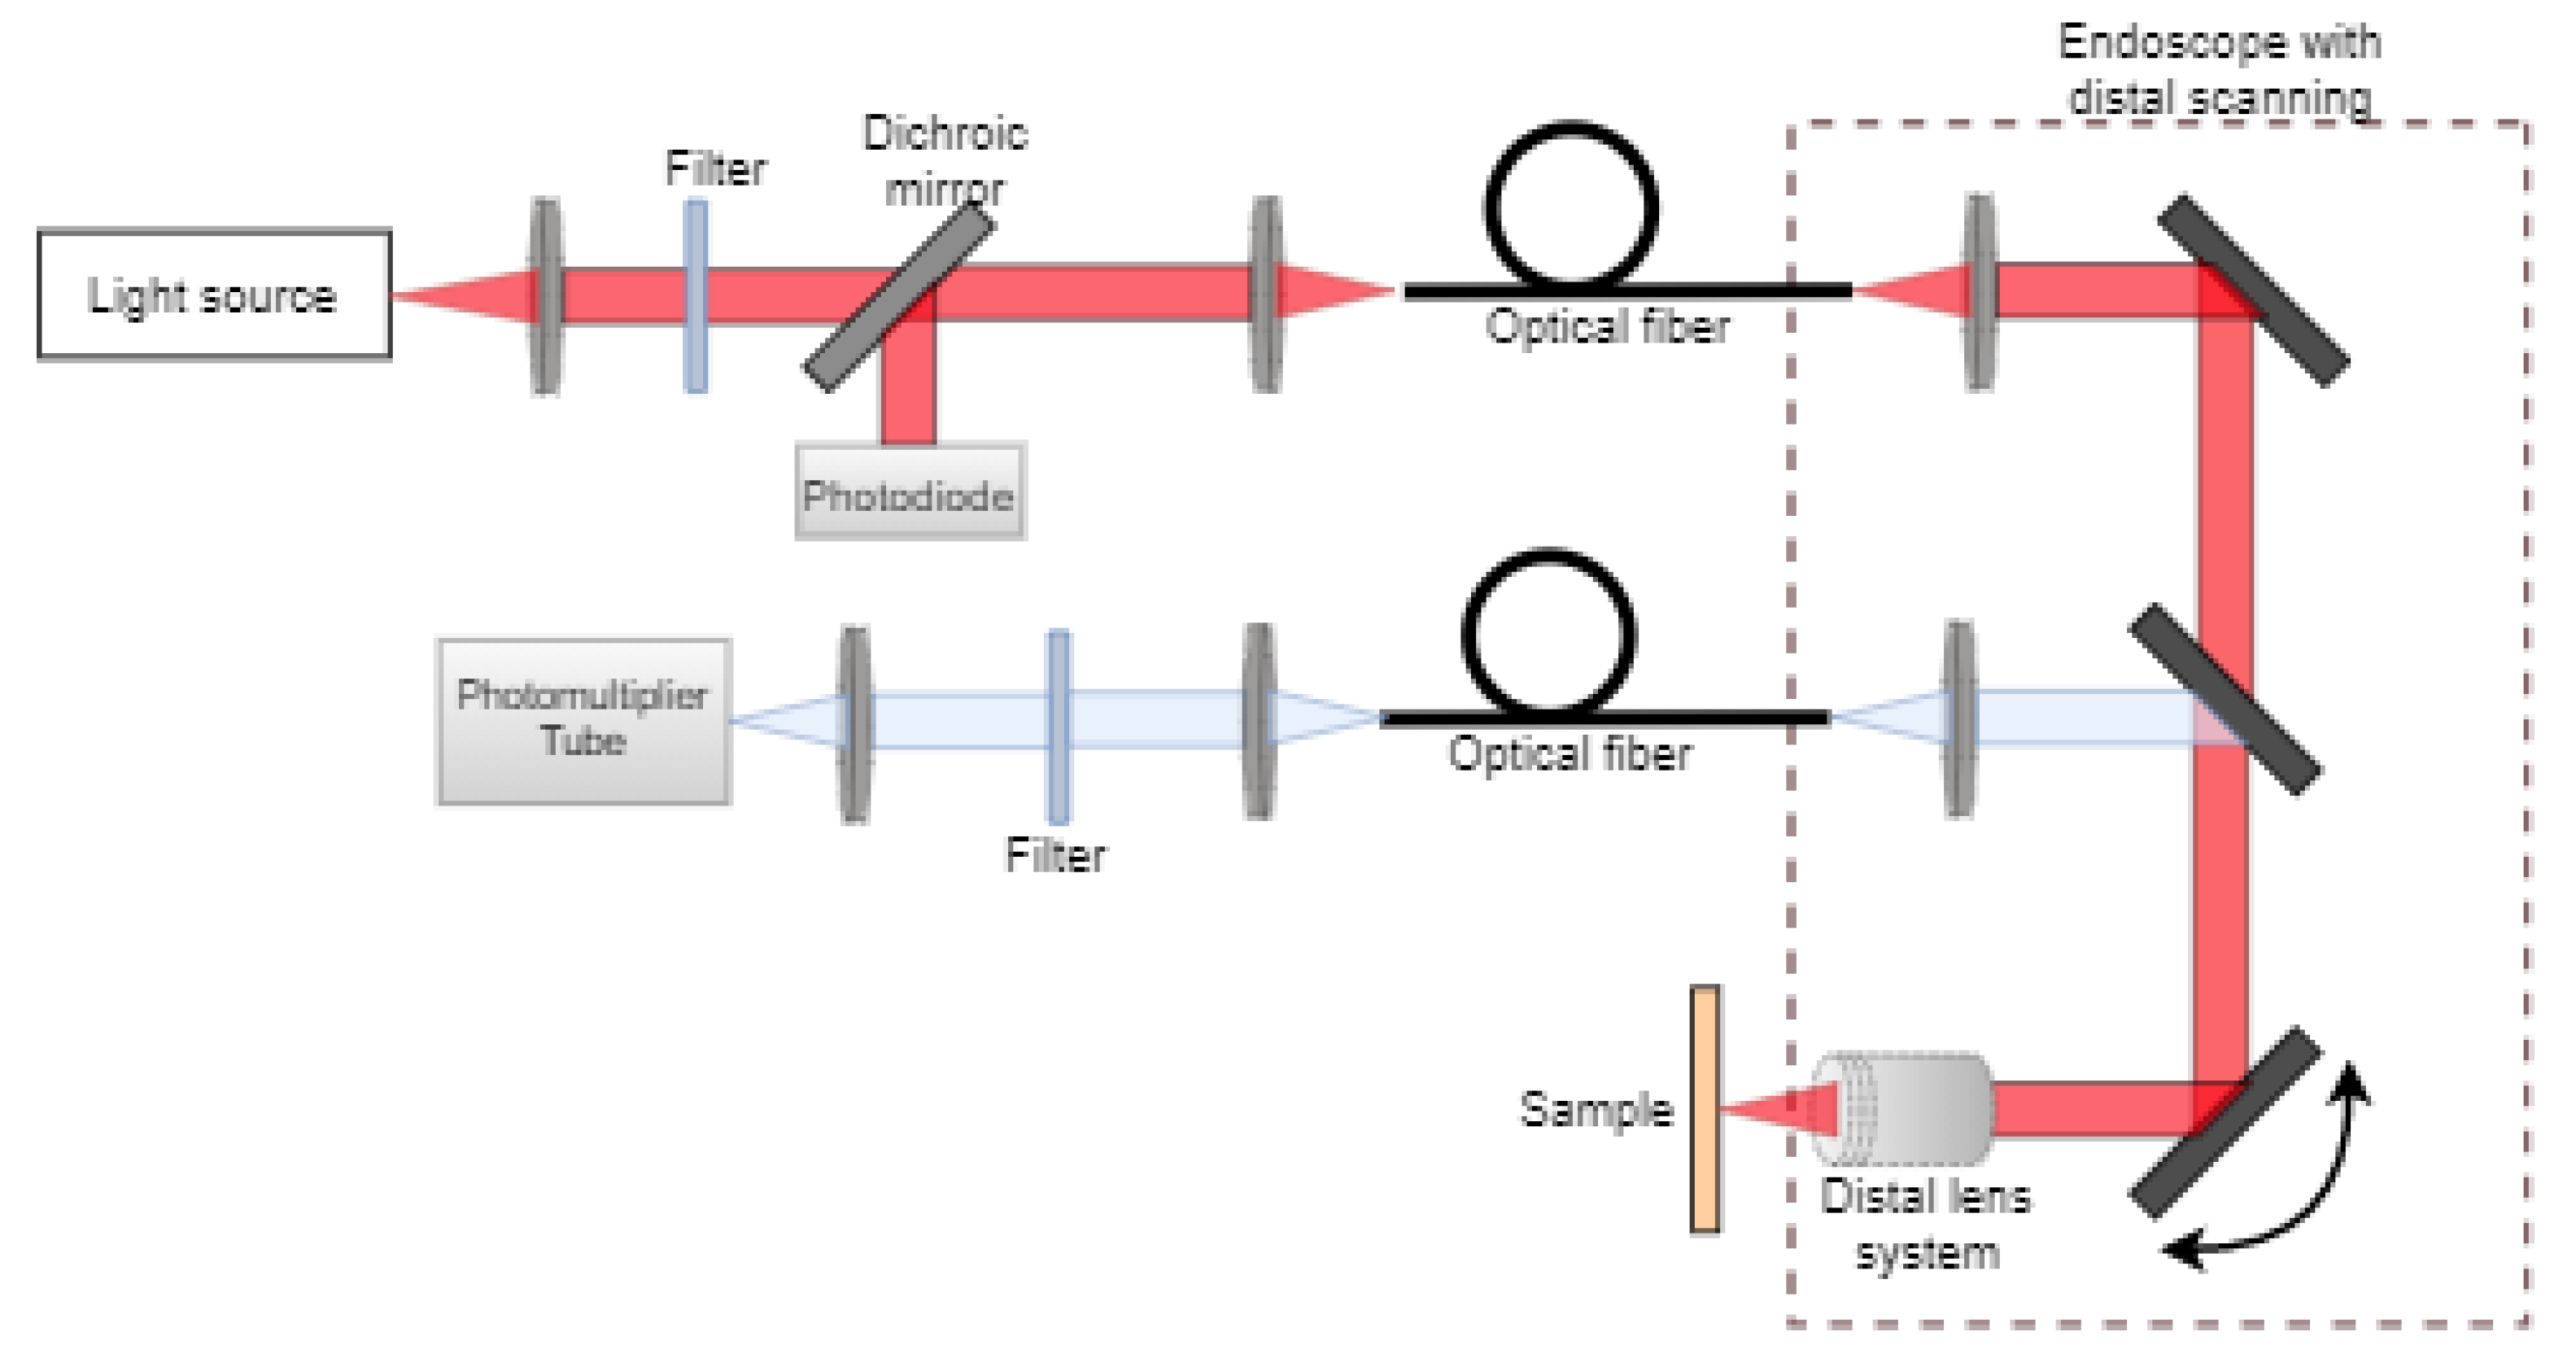
2.3.1. Multiphoton Microscopy

Multiphoton microscopy is based on the use of two or more photons to simultaneously excite a tissue surface. The contributing photons excite the molecules of the sample to its transitional state, which is unstable. The molecule comes to its stable ground state by releasing energy in the form of a fluorescent wave. In two-photon excitation, two photons are simultaneously absorbed in a single event; while in three-photon excitation, three photons are absorbed at the same time. Since the process requires the simultaneous absorption of more than one photon, absorption is most likely to occur in the focus where the photons’ flux is maximized [10].
To excite a molecule with multiple photons, very short (femtosecond to hundreds of femtoseconds) high-energy laser pulses are focused on the sample at a repetition rate of up to 80 MHz [10]. Usually, the excitation of a tissue surface requires an ultraviolet radiation to produce fluorescence. Consequently, near-infrared (NIR) light can be used for two-photon microscopy, and infrared (IR) light can be used for three-photon absorption. The longer wavelength light penetrates deeper in the tissue, permitting the possibility of imaging thick sections. Moreover, infrared light causes less scattering compared to employing UV laser light in a single-photon excitation. This characteristic, with no scattering from the out-of-focus zone, gives high contrast in the image without using a pinhole [26].
The resolution of multiphoton microscopy is of the same order as confocal microscopy, but the possibility of a greater penetration depth makes it a popular method for medical imaging. Huang et al. presented a two-photon exciting fluorescence (TPEF) microscope for detection of ovarian cancer [27]. In this case, β-Galactosidase (β-gal) enzyme is used as a biomarker to detect the ovarian cancer cells (Figure 6 [27]). Similarly, two-photon microscopes are used for investigating the biological functions and disorders in tumor cells [28] and to image the neural tissues of the brain [29]. Some of the multiphoton-based microscopes presented in the literature are listed by Li et al. in [25].

2.3.2. Higher Harmonic Generation Microscopy

Another kind of nonlinear microscopy method is based on the use of nonlinear scattering from the tissue molecules. The laser light interacts with the tissue and causes an electromagnetic field to interact with the tissue’s electric cloud, generating oscillating electric dipoles. In non-centro symmetric molecules, the output light beam generated by moving from the transition state to the ground state is a distorted version of the exciting light beam, which creates the harmonics. Analogous to the multiphoton microscopy, the higher energy density required to excite the molecule is possible at the focal point. The harmonic generation is a coherent process, and the electric field radiated by the different molecules interfere with each other. Thus, it requires an ordered tissue structure where the aligned molecules can construct interference [10].
Similar to the multiphoton process, the harmonic generation comprises second, third, and higher harmonic generation depending on the number of photons exciting the molecules. The energy of the output light beam is given by sum of the energies of the incoming light beams hitting the tissue surface. In second harmonic generation (SHG), the output photon has a wavelength that is double that of the two hitting photons. In other words, the incoming light from the laser induces a nonlinear polarization in the structure, which then generates a coherent wave with a frequency double that of incoming light. In third harmonic generation (THG), the output wave frequency is three times that of the exciting light beam [10]. The microscopic probe for the harmonic generation process is similar to that of a multiphoton microscopy. The only difference is the presence of a narrow band-pass filter, in front of the detector and centered at the SHG wavelength to block the residual excitation light [30].
This kind of microscopy is mainly used to image collagen fibers, myosin in muscle fibers, and microtubules in axons because of their ordered tissue structures [25]. Due to the similarity of SHG and TPEF, these techniques are often used together. A large number of SHG-based nonlinear microscopic devices are presented in the literature for imaging different tissue structures and diagnosis [31,32]. Campagnola et al. imaged living neuroblastoma cells using both SHG and TPEF techniques. Both techniques provide images with very fine resolution as can be seen in Figure 7 [31].

2.3.3. Raman Scattering Microscopy

The Raman effect arises when the incident photon on a molecule interacts with its electric dipole, causing a perturbation and moving it to a virtual state. The virtual vibrational state is unstable and is followed by a de-excitation state generating a scattered photon. When the initial state of the molecule is at ground level and the final state is characterized by a slightly higher energy, it is referred to as the Stokes scatter. The scattered photon in this case has less energy than the exciting photon (also called the red-shifted photon). When the initial state of the molecule is already in an excited virtual state, the incoming photon’s interaction with the molecule generates a scattered photon with higher energy than that of the incoming beam. It is called the anti-Stokes or blue-shifted photon [10].
Coherent anti-Stokes Raman scattering (CARS) microscopy is a nonlinear microscopy where a molecule is first excited from the ground state to an intermediate virtual state with a pump beam at an intermediate wavelength. Using a simultaneous illumination by a second Stokes beam, the molecule is excited into a higher vibrational level. The molecule is unstable at that state and returns to its ground level with higher energy given by the sum of energies of the two beams. In CARS microscopy, this scattered photon is used for imaging the tissue structure [25].
Stimulated Raman scattering (SRS) is another variation of Raman microscopy. It is similar to the Stokes-shifted Raman process, with the difference being that two lasers are coherently used to stimulate the scattering. The scattered signal is higher than that of the spontaneous Stokes shift [10]. A large number of CARS microscopy probes have been designed to image cancer cells [33,34], as well as SRS microscopy systems to image the distribution of molecules, intracellular particles, proteins, and tumor cells [35,36]. A list of CARS and SRS microscopy devices is included in. Romeike et al. combined the CARS and TPEF technologies to obtain detailed histo-morphological details of the tumor area from a squamous cell carcinoma metastasis, as shown in Figure 8 [33].

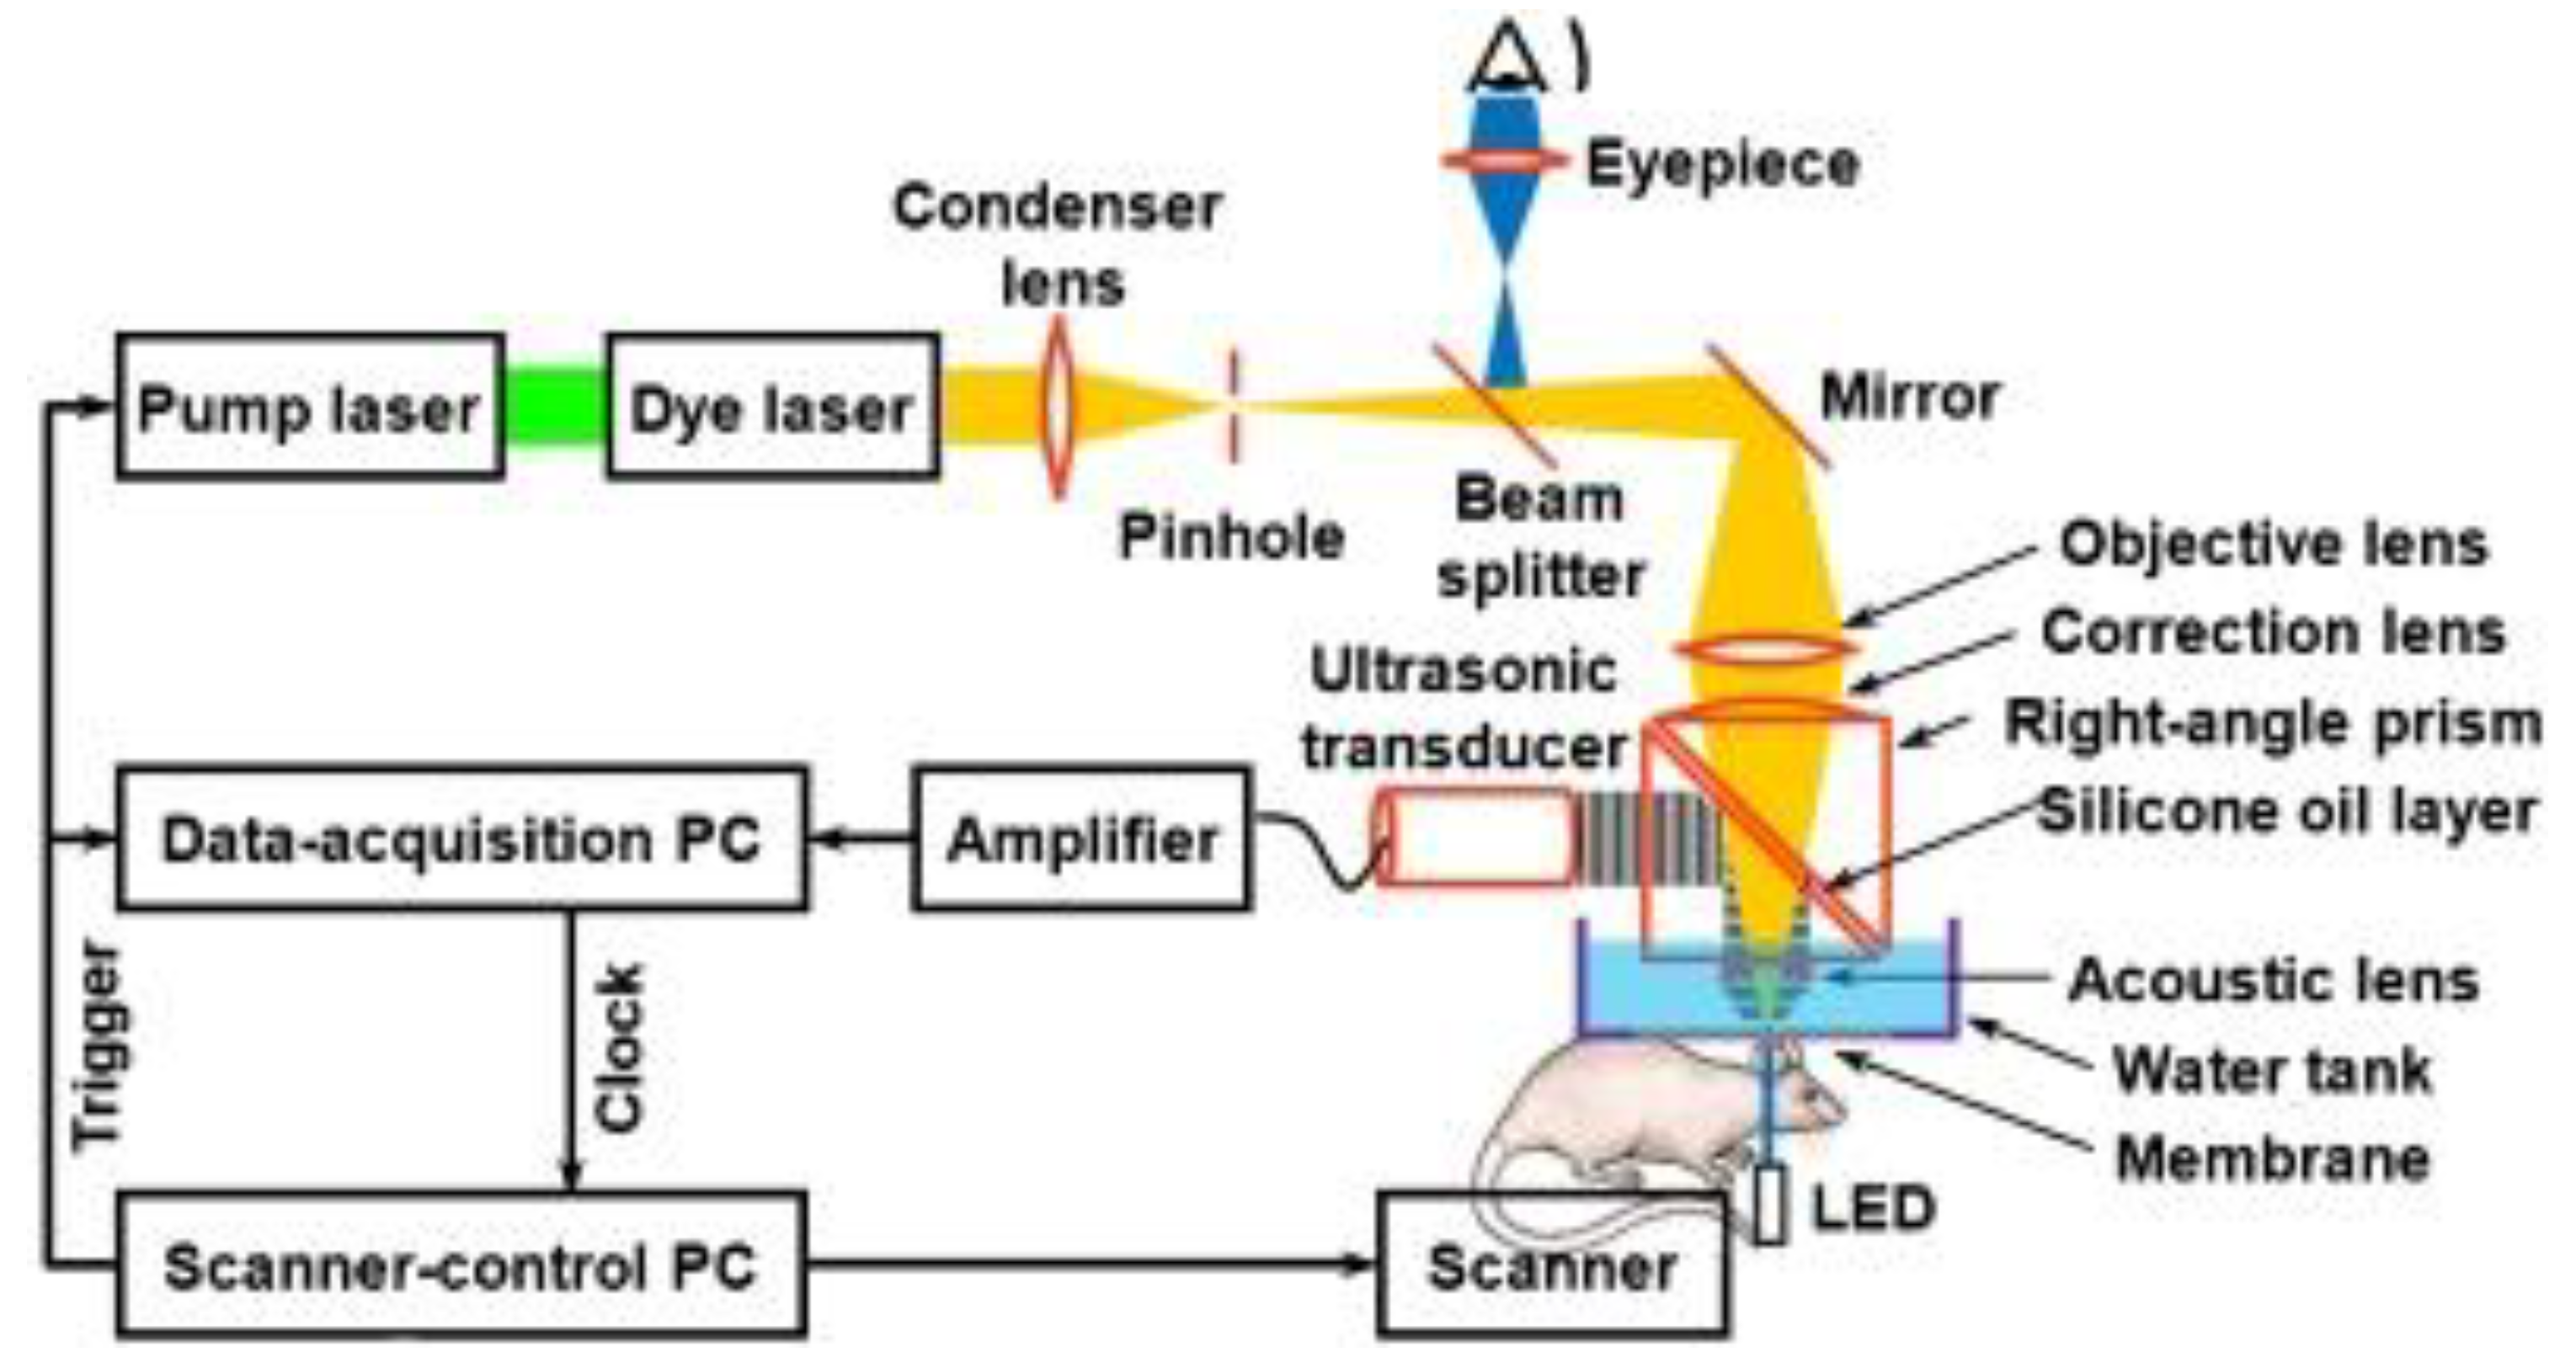
2.4. Photoacoustic Imaging

Photoacoustic (PA) imaging is a hybrid technology that uses light, which generates sound waves to image a tissue surface. In this technique, a tissue surface to be imaged absorbs the short pulsed high-intensity laser light, causing the heating of the local surface, which then emits a high-frequency acoustic wave due to the pressure rise. The emitted ultrasonic signal is very poor as compared to signals from other technologies, and thus requires the use of an acoustic transducer without blocking the optical signal. The PA microscopy provides an absorption contrast with a resolution at a subcellular level and has a capability to image anatomical, functional, and molecular structures at the same time [37,38]. A schematic of a photoacoustic system is reported in Figure 9 [39].
PA microscopy can be classified into optical resolution PA microscopy (OR-PAM) and acoustic resolution PA microscopy (AR-PAM) on the basis of the resolution technique used for imaging. In an OR-PAM device, the optical beam is focused inside the acoustic focus point. On the other hand, in an AR-PAM device, laser light is focused on a tissue surface through an optical system at a tight acoustic focus point. The lateral resolution of the PA microscopic device depends on the size of the focal spot. Since the wavelength of the optical wave is smaller than that of an acoustical wave, a small spot size can be obtained in the former case. Consequently, an OR-PAM system provides a finer resolution (ranges from submicrometer to submillimeter) compared to that of an AR-PAM (~45 µm). Conversely, a greater illumination area in AR-PAM allows higher numbers of photons to penetrate deep into the tissue, giving a higher penetration depth [37,38,40].
Another imaging technique based on the use of optical and acoustical wave interaction is PA computed tomography (PACT) [39]. It is based on a similar working principle as PA microscopy, with the difference in the fact that a reconstruction-based image is formed instead of a focused-based one.
Two-dimensional or three-dimensional tissue imaging is possible by scanning the optical and acoustical foci along a tissue surface using appropriate scanning methods. The penetration depth of imaging in this case ranges from a few micrometers to a few millimeters.
PA-based microscope catheters are largely used to image the bladder [41] and neurovascular systems [42], characterize microvascular parameters [39], and detect breast cancer [43]. A large number of devices based on PA microscopy are described in [2]. OR-PAM devices can achieve lateral and axial resolution as small as ~0.5 and 10 µm, respectively [44]. Maslov et al. imaged a large FOV image of the mouse ear using this technique. They are able to image the ear capillaries with finer resolution even at a depth of 150 µm as can be seen in Figure 10 [44]. It is possible to get an even finer resolution image using a high-frequency signal, but the higher attenuation of the acoustical wave limits the penetration depth at this point. Thus, there is a trade-off between the resolution and imaging depth, with the penetration depth:resolution ratio being about 200 [45]. The penetration depth also depends on the PA modality used for imaging and on the nature of the transducer used for signal detection [46]. Using NIR light, the penetration depth can reach up to 7 cm [45].
It is possible to use more than one technology to image the surface under consideration as every modality shows different aspects of the surface. The performance of different imaging techniques is compared in Table 1.

3. Scanning Directions

Considering the basis of the scanning mode and the light illumination direction, optical scanner probes can be divided into two groups: side-view imaging and forward-view imaging. Side imaging probes generate circumferential images by scanning the target area from the side of the probe. By moving the probe linearly along the axis while scanning, the beam will generate a cylindrical 2-D image area [53]. In the case of distal scanning, such devices can be as small as 1.65 mm [54]. On the other hand, forward imaging probes provide the target tissue surface image from the front. By scanning the light beam, 2-D images are generated. By moving the probe along the axis, it is possible to get 3-D images. Such devices are characterized by a high scan speed and can be used as a guide for medical devices used during surgery and other endoscopic procedures. However, these devices have a much larger size as their miniaturization is limited by the scanning elements. The smallest forward view imaging probe with the distal scanning method has a diameter of 2.4 mm [55]. It is possible to get more compact-sized probes using the proximal scanning. The diameter of the probe can be reduced up to 250 µm [56]. Further details about these devices are described below in the paper.

3.1. Side View Imaging

In side view transverse scanning, the light beam coming from an optical fiber is deflected at a certain angle by the presence of a prism, mirror, or a reflecting surface. The deflected light passes through a transparent optical window on the side of the probe. The optical fiber with the optics components attached to its distal end is rotated to scan the light beam in a circumferential pattern. In the first side-viewing OCT probe [15], a graded-index (GRIN) lens was attached to a single mode fiber (SMF) with a core diameter of 9 µm. A right-angle microprism was attached to the GRIN lens, which deviated the light beam perpendicularly to the catheter axis. The distal end can be rotated using a drive motor [15,57,58] or a rotational stage [53] and scans the beam circumferentially. It is possible to deflect the light beam avoiding the prism by polishing the optical fiber at certain angle, and coating the surface with a reflecting material like aluminum or gold [58]. Even though such a design is easier to fabricate, it has a poor resolution. This limitation can be surpassed by splicing the GRIN lens and having no core fiber (NCF) at the tip of the SMF. NCF polished at a certain angle and coated with a reflecting metal layer gives a deflected beam with a Gaussian-shaped beam profile [59]. Yang et al. used a polished ball-lens at the distal tip of an SMF to deflect and focus the light beam through an optical window. The rotation of the fiber is performed using a linear scanner [60].
Some of the image artifacts related to the rotation of the fiber and the attached components are eliminated by rotating the microprism at the distal tip of the probe. In such a case, the prism is separated from the GRIN lens and actuated using a micromotor placed at the distal end [54,61], providing the images with a finer resolution. The schematic of a catheter-based side viewing endoscope is shown in Figure 11a. More recent side viewing imaging probes rely on the use of parabolic or cone-shaped mirrors at the distal tip. Such mirrors permit the incoming light from the fiber to be reflected in all directions, giving an omnidirectional side view. Such devices, called catadioptric probes, provide a panoramic field of view, obviating the need for rotation of the probe components [62].

3.2. Forward View Imaging

Forward view imaging techniques provide images of the area in front of the probe. A laser beam incoming from the optical fiber is scanned laterally to cover the 2-D imaging area as in Figure 11b. A large number of these probes use piezoelectric [16,55,63,64], electromagnetic [65,66,67], electrothermal [6,68,69], shape memory alloy [70], or electroactive ionic polymer [71] actuators to excite an SMF acting as a cantilever beam in the desired scan pattern.
Another group of forward-viewing imaging probes use a scanning mirror at the distal end of the probe to deflect the light beam while scanning it. These mirrors can be actuated using an electrostatic actuator [72], electro-thermal bimorph actuator [73], piezoelectric actuation method [74], or servo motor [75].
Some of the forward viewing devices use a coherent fiber bundle (CFB) to shine the light on a target sample. Such devices permit the scanning mechanism to be employed at the proximal end [76]. Another type of forward-viewing devices utilize a pair of GRIN lenses rotating in opposite directions to deflect the beam in a fan-shaped scan [77,78].
The features of the scanners based on these two kinds of imaging modalities are compared in Table 2.

4. Scanning Principle

Optical scanners for medical imaging predominantly are scanning fiber endoscopes (SFEs). In these devices, an optical fiber is vibrated to shine light on a target tissue, and the reflected light is captured using one of the modalities described earlier. The main reason for the large demand of SFEs comes from the fact that the resolution in these devices is not limited by pixel elements in the image sensor but by the peak to peak displacement of the fiber tip and core diameter of the fiber. The optical fibers can be vibrated in resonant, non-resonant mode, or using an intermediate frequency to scan the light beam across the target tissue sample. The resonance actuation is used in cases where high-frequency operation and a high amplitude of the scanning fiber are required. The non-resonant scanners are preferred in cases when very different scan frequencies in two directions is a prerequisite. It is possible to avoid the drawbacks of both methods and keep the higher flexibility using a semi-resonant scanning mode.

4.1. Resonant Scanner

The distal tip of the fiber can achieve higher displacement when it is vibrated at resonance. In other words, the amplitude of the beam scanning and the obtainable resolution can be maximized by exciting the distal free end of the optical fiber at its natural (first resonant) frequency. From the vibrational theory, the resonance frequencies for a clamped-free configuration (called cantilevered) of the beam are given by:
f n = β n 2 2 π E I ρ A L 4 ,
where E, I, ρ, L, A, and β n are Young’s modulus, moment of inertia, density, length, cross-section area of the cantilevered beam, and the coefficient value depending on the resonance mode, respectively [80].
A large number of scanning fiber endoscopes are based on the first mode of resonance to scan the light. The proximal end of the fiber is usually excited at resonant frequency using piezoelectric [2,12,13,15], electromagnetic [16,17,18], electrothermal [19,20,21], shape memory alloy [25], or electroactive ionic polymer [26] actuators. The distal end follows the mode shape shown in Figure 12. Various resonant scanners in the literature are compared in [81].
In most cases, the cantilevered fiber scanners are characterized by having a symmetrical cylindrical section. In cases when the beam structure is excited with large displacements near its resonance frequency, the cross-coupling of the motion between the planes perpendicular to the beam axis leads to a whirling phenomenon. This nonlinear tip response of the excited fiber is highly unstable. In very small frequency ranges, a stable whirling motion can be produced, which allows the fiber to trace an elliptical shape pattern. The equation of motion describing the whirling phenomenon was studied by Haight and King in [82], and further developed by Hyer in the case of a cantilever beam [83].
It is possible to avoid the undesired whirling motion by changing the shape of the optical fiber beam or finding the two eigendirections on the beam where the excitation can cancel the whirling effect [84]. It is even seen that the whirling effect can be positively exploited for 2-D scanning using a single actuator. It is experimentally shown in [85] that exciting the cantilevered fiber at a second mode of resonance gives a stable circular-shaped pattern by tip displacement. Thus, it can be beneficially used for scanning the target area by sweeping the circular area by continuously increasing the driving voltage of the exciting actuator [85].

4.2. Non-Resonant Scanner

Resonant fiber scanners provide a large scan area for a given input power. However, it is difficult to get a resonant fiber scanner for an application requiring low-frequency scanning [81]. From Equation (6), it is clear that very long and slender beams are required to get a small resonant frequency. Moreover, the resonant scanners do not provide the flexibility in offsetting the center of the image field from the optical axis. It is possible to offset the center using additional deflectors, which, on the other hand, make the scanner more complex and bulkier.
Such problems can be partially solved by exciting the scanning fiber at a frequency away from its natural frequency. In this case, the tip displacement of the fiber, given the excitation power, will be much smaller. There are some non-resonant scanners available using a bimorph piezo bender actuator [86], and electro-magnetic actuators [87]. As stated earlier, these scanners use a high amount of power to produce the desired tip displacement, which can cause safety issues in such devices.
Park et al. developed an MEMS scanner for the design of an endoscopic OCT probe. In this case, a 40-mm-long fiber is actuated using a 3 V drive voltage [88]. Naono et al. designed a non-resonant thin-film piezoelectric actuated scanner for an OCT application [89].
Non-resonant scanners can be miniaturized by decreasing the length of the cantilevered portion and increasing the tip deflection using the leverage method. Sawinski and Denk used a double-lever method to amplify the tip displacement of the optical fiber. In this case, a piezo-bender actuator was connected to the fiber at the cross point of the leverage. Such an optical scanner provides a tip deflection comparable to that obtained in resonant scanners, with the possibility of shifting the center of the image [90].

4.3. Semi-Resonant Scanner

As seen above, the resonance operation mode limits the shifting of the center of the image and is operable in high-frequency scanning fields. The resonant scanner is also sensitive to the working conditions. A slight offset from the peak frequency can generate instability in the motion of the fiber. Conversely, a non-resonant scanner operates at a low-frequency range but requires high power consumption or longer fiber tips to cover a certain scanning area.
These problems can be circumvented using a semi-resonant scanning mode of operation. Such a scanner is proposed by Moon et al., where the cantilevered optical fiber is excited at an intermediate frequency, which is far from the resonance peak but provides some amplitude gain. An OCT endoscope designed based on this method prevents the sensitivity and nonlinear whirling problems related to resonant scanners [91].
A representative table highlighting the performance of three kinds of scanners described above is reported as Table 3 where the number of check marks indicates qualitatively the value of the parameter.

5. Actuation Methods

The continuous growth of MEMS devices enables the rapid growth of numerous industry sectors that support the batch fabrication of a wide variety of miniaturized components, including optical devices. MEMS-based actuators are largely used in optical scanners due to their small dimensions, low power consumption, light weight, fine performance characteristics, and easy integration with other devices. In optical scanners, MEMS actuators permit scanning by sweeping a light beam in one direction for 1-D scanners, or over a solid angle for 2-D scanners.
The MEMS actuators can mainly be classified into five categories based on their working principle, which are: electrostatic, electrothermal, piezoelectric, electromagnetic, and shape memory alloy actuators. The performance of these actuators is shown in Table 4 along with their strengths and limitations for one use as compared to others.

5.1. Electrostatic Actuators

Electrostatic actuators are the most used actuators in MEMS devices due to their simple structure, low power consumption, fast response, and use in fabrication, which does not require any unusual material [81,92]. An electrostatic actuator consists of two electrodes, one of which is fixed by anchors (called stator), and the other one which is moveable (called shuttle). When a driving voltage is applied to the electrodes, an attraction force between its structural components is generated, which causes motion of the moveable part in the parallel and perpendicular directions. This change in the gap or separation distance between the two parts is proportional to the change in the capacitance.
During the driving cycle, the voltage difference between the two electrodes causes the mobile part to move towards the fixed one. Based on the configuration of these parts, the electrostatic actuators can be classified into parallel plate and comb drive. The schematic configuration of electrostatic actuators is described in Figure 13 [93].
One of the main drawbacks of the electrostatic actuators is that a large driving voltage is required to get moderate deflection angles. However, this disadvantage can be partially overcome by using tapered electrodes instead of parallel-shaped ones [94].
It is experimentally characterized that a higher deflection of the mirror surface can be obtained by placing the electrodes around the mirror surface in a star-shaped pattern [95]. Pengwang et al. mentioned research on micromirrors driven by electrostatic actuators [93]. Dickensheets et al. developed one of the earliest confocal optical microscopes using a pair of scanning mirrors driven by electrostatic actuation [19]. Piyawattanametha et al. developed a 2-D optical scanning OCT catheter using an electrostatically actuated mirror at the distal end of the probe. The angular vertical comb actuators drive a 1-mm-diameter mirror deviating the light beam for side-view imaging, allowing the scanning of the sample. The 5-mm-diameter probe provides OCT images with a resolution of <5 µm. The electrostatically driven micromirror is shown in Figure 14 [96]. The same group used an electrostatically actuated micromirror for two-photon fluorescence imaging [97]. The recently developed ultra-small confocal endomicroscope by Wang et al. also uses an electrostatically driven micromirror to deflect the light beam in two directions at the distal end of the device [24].

5.2. Electrothermal Actuators

Electrothermal actuators are based on the principle of thermal expansion. When a current is passed through a material, it causes an increase in the temperature of the material due to the Joule/electric resistive heating effect. The rise in the temperature causes deformation, and consequently the motion of the electrothermal actuator material. Thus, the motion of an electrothermal actuator can be controlled by the driving voltage [98].
In electrothermal actuators, large actuation forces can be obtainable with less operating voltage as compared to the electrostatic actuators. However, the longer response time for thermal actuation and the heat dissipation limit the use of these actuators at a very high frequency. However, it has been proven that at sub-micrometer or nanometer scale, it is possible to use electrothermal actuators at very high frequencies (in the order of MHz) due to the very small response time [99].
The electrothermal actuators can be classified into three categories: hot-and-cold arm, Chevron, and bimorph actuators. Such actuators are schematized in Figure 15 [100].
Bimorph electrothermal actuators are frequently used in optical devices, especially to guide the optical mirror by connecting it to the tip of more than one bimorph actuator [101,102,103]. Pengwang et al. described many micromirror scanning devices actuated using a bimorph electrothermal actuator [93]. Tanguy et al. fabricated an electrothermally driven micro-scanner for OCT probes [104,105]. Seo et al. developed an MEMS fiber scanner actuated using an electrothermal bimorph actuator for a forward-viewing confocal endoscopic catheter [68,69]. The schematic diagram of an electrothermally driven endoscopic catheter is shown in Figure 16 [69].

5.3. Piezoelectric Actuators

Piezoelectric actuators are based on the characteristic properties of certain ceramic materials to induce reversible mechanical strain or force in the presence of an electric field applied to the material, and vice versa. In the presence of an electric field, the polarized molecules of the piezoelectric material tend to align themselves, thereby deforming the material structure. The magnitude of the force or strain generated in the material depends upon the geometry and electromechanical properties of the material. Among the various piezoelectric materials available, aluminum nitride (AlN) and lead zirconate titanate (PZT) are the most used materials in MEMS devices [106].
Depending upon the application, it is possible to use a single disc, plate, or tubular structure of piezoelectric material. A cantilever-shaped piezoelectric actuator is another promising structure used to obtain a bending motion where two different materials are combined in a cantilever structure [107].
Piezoelectric actuators are widely used in optical scanners, and fiber optic devices. Numerous micromirrors actuated using bulk piezoelectric actuators, and piezoelectric bender actuators are listed in [93]. It is possible to achieve 2-D motion by using a tube with split electrodes. The tubular piezoelectric actuator is mainly used to excite an optical fiber acting as a cantilever at the resonant frequency. By modulating the drive voltage in two pairs of electrodes, the desired scanning pattern from the fiber tip can be achieved. A large number of endoscopes are fabricated using this technique [84,91,108,109,110].
Some researchers developed 2-D fiber optic scanning devices using a single pair of piezoelectric electrodes. In such cases, the actuation in a direction perpendicular to that generated by the actuator is obtained using the asymmetry of the optical fiber [63,111]. Liu et al. developed an endoscope obtaining the 2-D actuation of a fiber using two piezoelectric ceramic cantilever benders [112]. Seibel et al. developed a tubular piezoelectric-based 1.06-mm-diameter endoscopic catheter. It was one of the earliest scanning fiber endoscopes used for fluorescence imaging. A schematic diagram of the developed SFE is shown in Figure 17 [3,64].

5.4. Electromagnetic Actuators

An electromagnetic actuator works based on the conversion of electric energy into mechanical energy by means of a magnetic field. It comprises a stationary part called a stator, and a moving part called a rotor. The conversion of energy takes place in the area separating the two components (also called an air gap). The interaction between the stator and rotor produces a high vibration of the rotor component. These actuators have two different configurations depending on the moving component. In one configuration, the moving part is represented by a bulk magnet or a thin magnetic film deposited on a device component, while the stationary part is represented by an electric coil. In the other configuration, an electric coil is the moving part, and the static magnetic field is provided by the stationary magnets placed around the coil [81].
Joos and Shen designed an OCT probe where the current passing through the outer coil slides the tube containing the magnet at its distal end and the fiber inside the tube. The developed OCT probe is shown in Figure 18 [113]. Sun et al. placed a magnet around an optical fiber, which was vibrated at resonance using the electromagnetic force generated by a tilted coil placed on the tube surface via lithography [114], and 3-D printing technology [115]. Later, the authors used a pair of driving coils embedded in polyimide film and wrapped it around the tube surface to drive an optical fiber at a second resonance mode to get a higher scanning angle [66].
Many MEMS micromirror scanners are actuated using a moving coil configuration of electromagnetic actuators. Barbaroto et al. developed an optical scanner by making the mechanical structure using bulk silicon micromachining, and the electric circuit coil was fabricated using deep UV lithography and gold electroplating [116]. Using this technique, Miyajima et al. developed a similar 1-D MEMS scanner for the confocal microscope, guaranteeing the reliability and stability of the scan angle. A macroscale scanner is used together with an electromagnetic scanner to achieve a 2-D scan [117,118]. Mitsui et al. designed a 2-D scanner driven using this kind of electromagnetic actuation method for OCT imaging. In this scanner, two different sets of coils are placed on a moveable plane to actuate the plane in the X or Y direction inside a permanent magnet. Two coils exhibit the X direction motion of the central mirror, and four coils placed at intermediate frames permit the Y axis motion [119].
Electromagnetic actuation also finds use in capsule endoscopy to achieve the movement of the device [120]. Recently, Hoang et al. proposed a new biopsy capsule endoscope, which uses an external rotating magnetic field to linearly actuate the permanent magnet connected to the biopsy needle. The linear motion of the needle permits the collection of the biopsy sample and brings it back in the capsule using the movement in the reverse direction. Such devices define a new field for less invasive diagnosis procedures [121].
Magnetic materials are characterized by a special property, which allows them to change their dimensions in the presence of a magnetic field. This effect is called magnetostriction. The material can undergo a change in dimension until it reaches the value of saturation magnetostriction, which depends on the magnetization and thus on the applied magnetic field [122]. Bourouina et al. developed a 2-D optical scanner based on the magnetostrictive effect where a silicon cantilever is coated with a magnetostrictive film [123].

5.5. Shape Memory Alloy Actuators

Shape memory alloys (SMAs) are metallic alloys that can be reversibly deformed. These materials can memorize their shape and are able to return to their pre-deformed shape by changing the temperature and the state of stress. Usually, these alloys undergo temperature-induced phase transformation between the less-ordered martensitic phase, and the ordered crystallographic austenitic phase. An SMA material is deformed at low temperature and then heat treated to memorize the shape; the plastic strain is recovered by increasing the temperature above the transition temperature. Frequently used shape memory materials are the alloys of nickel and titanium (Nitinol).
Conventional endoscopes are controlled by a wire traction to achieve bending of the endoscopes inside the body cavities. Many researchers have proposed the use of SMA coil actuators to permit bending of the tip of the endoscope. Maeda et al. used a pair of SMA coil springs to achieve the bending of optical guide fibers. One of the coils is heated via Joule heating, causing it to recover its shape and rotate the actuation ring connected to its free end. The actuation ring is connected to one end of the pull wire while the other end of the wire is connected to the distal end of the endoscope. The actuation of the coil bends the tip of the endoscope in one direction. By halting the current in this coil and activating the other coil, the endoscope is returned to its original position [124]. Haga et al. used three SMA coils distributed around the working channel of a catheter to achieve active bending of the endoscope in all directions [125].
Makishi et al. developed an endoscope based on a CCD imager, and the omni-direction bending was achieved using three SMA coil actuators [126]. Kobayashi et al. fabricated an endoscope where the bending of the CMOS imager and light-emitting diodes (LEDs) was obtained using three SMA wires that permit a large bending angle at a lower expense. The fabricated endoscope is shown in Figure 19 [70].

6. Scanning Patterns

In MEMS scanning mirrors or fiber optic scanners, the laser beam is scanned along two perpendicular axes to reconstruct the image of the target sample. The scan along the two directions can be implemented either using separate actuation methods or by a single actuation device. The resolution of the image obtained depends upon the scanning method used to scan the laser beam across the sample [127]. The different scanning methods used by the optical scanners are reported below in the detail.

6.1. Raster Scanning

Raster scanning (also called serpentine scanning) is a commonly used scanning pattern. In this case, the scanning image is subdivided into scan lines in one direction. The beam sweeps the sample in one direction along a line, comes back to other side, and again starts scanning along the next line. Thus, it follows a rectangular scan pattern. The axis of the line scan is called the fast axis (scanned rapidly), while the other axis is called the slow axis (scanned slowly). Usually, the fast axis is driven by oscillating the light beam at resonance, while the slow-axis scan is performed using a non-resonant scan [127]. Typically, the raster scan pattern is obtained using gimbal-mounted micromirrors or optical fiber scanners.
The scanning beam passes over the surface of the target object at different times. Thus, each pixel on the reconstructed image corresponds to a different time point. This kind of scanning in time leads to in-frame and inter-frame motion artifacts. The former among these takes place in the case where there is a displacement or movement of the sample within the acquisition time. The inter-frame artifacts occur due to motion occurring between the successive frames or image sequences. The in-frame motion artifact can be reduced by changing the motion path or using image processing algorithms. The inter-frame distortions can be reduced by increasing the scanning speed by implementing a bidirectional scan [128]. Duma et al. tested triangular, sinusoidal, and sawtooth scanning profiles and demonstrated that the triangular profile provides artifact-free images. The other two profiles display image distortion at the margins [129].
The raster scanners require high operating voltages to get slow-axis scans and have difficulties incorporating them in small spaces, which make them less usable in clinical devices [130].

6.2. Spiral Scanning

A spiral scan pattern is generated using a 2-D actuation method by employing the same actuation frequency along two axes. In other words, the spiral pattern is obtained by driving the light beam at the same frequency with increasing amplitude along two directions with a phase shift of 90° [130].
The phase shift between the two signals, and the amplitude variation in the driving signal affect the circularity of the obtained spiral. Such scanning patterns are obtained with resonant fiber-optic scanner. These scanners are activated with increasing actuation amplitude until they reach the maximum radius (rmax) followed by a breaking time to reset the fiber to its rest position, which then repeats the scan and moves to the next frame [3].
The motion of the fiber tip in time during the spiral scan in polar coordinates can be described by:
r ( t ) = r 0 + v r t ,
ϕ ( t ) = ϕ 0 + β t ,
where v r and β are the constant radial and angular velocities, respectively. The angular motion is fast with respect to the radial motion. The scanning pattern is smooth and is used in fiber-optic endoscopic scanners [3,110]. A higher frame rate can be achieved using a larger amplitude compared to a raster scanner. However, the illumination beam density is variable within the scanned image and is higher at the center compared to the outer surface [130].

6.3. Lissajous Scanning

A Lissajous scanning pattern is another 2-D scanning pattern obtained with variable frequencies (ωx, ωy), and phases (ϕx, ϕy) along two axes. The scanning pattern is governed by independent oscillatory equations along the two axes [131]:
x = A x s i n ( ω x t + ϕ x ) ,
y = A y s i n ( ω y t + ϕ y ) .
One of the main parameters characterizing the scanning pattern is its fill factor, defined as the ratio of the scanned area vs. the total pixel area in the image. The fill factor depends on the ratio of the frequencies along the two axes. For a higher fill factor, a high ratio between the two scanning frequencies is desired [81]. The scanning pattern is quasi-random and non-repetitive in time. The scanning beam is uniformly spread on the scanned surface, is highly smooth, and requires low power consumption [131]. Such patterns are not very useful for high quality displays; however, they are largely used in resonant fiber scanners [68,132].

6.4. Circular Scanning

A circular section optical fiber is characterized by having the same fundamental frequency along two directions. It is possible to get a circular-shaped pattern from the fiber tip by exciting it in the two directions with a 90° phase shift [133]. As stated earlier, it is also possible to get a circular-shaped pattern from the fiber tip by exciting it in a single direction at a second mode of resonance due to nonlinear coupling with longitudinal inertia [85].
By changing the amplitude of the driving signal, it is possible to sweep the area inside the circular shape like the spiral shape pattern. Wu et al. developed an imaging fiber optic catheter, where the 2-D scan is obtained using a concentric circle scan pattern with the help of a triangle amplitude modulated sinusoidal actuation wave [85]. Like the spiral-shaped pattern, the light density is higher in the center and decreases moving toward the outer circle.

6.5. Propeller Scanning

Propeller scanning consists of generating a line scan by actuating the optical fiber in one direction, or steering the beam using a mirror device. The line pattern is then rotated to generate a circular-shaped 2-D pattern [134]. The rotation motion can be transmitted from the proximal end to the distal end using torque cables, while the optical connection between the steady and rotating parts can be applied using fiber optic rotary joints.
The line scan direction represents the fast axis, while the rotation represents the slow axis. The light intensity is not uniform and is higher in the center compared to the edges. The rotation speed affects the resolution of the obtained image. Kaur et al. used a propeller scanning pattern to get a 2-D scan pattern using a single direction actuation of a cantilevered fiber. The fast-axis scan is obtained by using an electrothermal actuator, while the slow-axis scan is performed by rotating the target sample [6].
Scanning patterns and the actuation power provided to the two actuators to get the corresponding 2-D pattern are shown in Table 5 along with their advantages and disadvantages.

7. Discussion

Imaging devices used in medical applications are characterized by their resolution. Non-invasive technologies, such as MRI, CT, and ultrasound, provide in vivo imaging of tissue structures with a large penetration depth, but the resolution is limited. Endoscopic imaging permits imaging body structures with finer details, however, they are invasive in some cases. Fiber optics allow the fabrication of imaging devices that are flexible and can image the target area via hollow cavities. The recent advances in the optical and mechanical fields allow in vivo imaging of tissue surfaces to be performed by using devices having a very fine resolution at the micrometer level.
In an endoscopic optical imaging device, the laser light is illuminated on the target surface using an optical fiber or by deviating the light by micro mirrors. The image can be either reconstructed by direct reflectance, or via detection of the fluorescence light using optical fibers, lenses, or CCD/CMOS cameras. In the case of direct reflectance imaging, the morphological information of the tissue structure is obtained, while fluorescence provides information about the inner cell or tissue structures by labelling them using fluorophores. Fluorophore materials are usually added from outside to stain the target sample and emit light at a wavelength higher than that of illumination, increasing the contrast in the images.
In biomedical imaging devices, OCT is one of the most used techniques. OCT is a direct reflectance imaging technique where the imaging contrast is provided by the change in the refractive index of the tissue media causing a variation of intensity of the reflected light [7]. Most of the current OCT systems are FD-OCT based, where the information about the depth scan is calculated by using the inverse Fourier transform of the backscattered light spectrum. The fast-axial scanning is obtained by sweeping the light source, which gives high-resolution images due to fast signal acquisition and provides images with a large signal to noise ratio. Given the current state of the art, ophthalmology is the predominating application for OCT due to the low laser output compatible with the ophthalmological structures permitting the imaging without damaging the tissue structures [12,13,14]. The transparency and low light scattering of the aqueous humor media allows imaging of the ocular surfaces at a greater depth with resolution independent of the surface depth. In addition to ophthalmology, deep tissue penetration and high resolution morphological and functional imaging make OCT a promising technology to assess the artery lumens in cardiology [10], tissue structures of the biliary tract, and the gastrointestinal (GI) tract, especially for Barrett’s esophagus [135]. Furthermore, the skin is a highly light-scattering tissue that contains a large number of inhomogeneities. OCT makes it possible to detect and diagnose various skin diseases and lesions [136]. OCT is also a useful method to monitor lesions in the enamel and dental structures of the teeth [137].
Another promising technology is confocal microscopy, which provides high-resolution imaging of thick specimens by virtually slicing them using optical sectioning [10]. It is possible to image the tissue structures in either confocal or fluorescence mode. In the latter case, the target tissue structure is stained using fluorescent dyes to enhance the contrast in the image. Combining confocal microscopy with the optical fibers in an FCFM, Cell-viZio-developed mini optical probes can be used for microcirculation imaging of the stomach, ear, mesentery, kidney, and conjunctive tissues [23]. Other applications of confocal endomicroscopy include functional imaging of the GI tract [24], liver, pancreas, and reproductive tracts after the application of a fluorescent agent that provides contrast to the image [138].
In addition to OCT and confocal microscopy, nonlinear microscopy also finds many applications in tissue structure imaging. Nonlinear microscopy comprises multiphoton imaging, higher order harmonic generation, and coherent Raman scattering microscopy. These techniques allow the structural and chemical changes of cells, tissues, or organs to be inspected with deep tissue penetration and minimal photobleaching and phototoxicity. The use of a pinhole and the signal generation from only a localized specific area provide high-contrast images. The cellular level resolution allows these techniques to be used for imaging and diagnosing tumors at early stages in the skin and ovary. In particular, TPEF is used to image endothelial cells, while SHG is used to image collagen fibers, and CARS is used for the detection of chemical changes at the cellular levels [139].
Another technique is photoacoustic imaging. In this case, laser pulses are emitted towards the target tissue surface, which absorbs the light and generates an ultrasonic emission detected by an ultrasonic transducer. Thus, the imaging contrast is based on the absorption spectra of the media. These devices find applications in measuring the oxygen level in the blood and guiding surgical tools during surgical procedures. Furthermore, photoacoustic imaging is particularly suitable to image the breast, brain, and GI tract for cancer diagnosis due to the high optical absorption contrast [38,40].
Apart from imaging techniques, optical devices can monitor the target sample either from a side of the distal end perpendicular to its axis, or from the front end of the device providing a peripheric or en face image, respectively. In side-viewing devices, the probe is rotated to visualize the circumferential structural area. A forward-viewing imaging probe provides an image of the front surface and can be used as a guide for surgical procedures. It should be noted that forward-viewing imaging requires a transverse scan of the light beam, which poses challenges in the miniaturization of the imaging device.
In advanced imaging systems, the resolution of images is improved by scanning the laser beam across the surface. Often the systems are vibrated at resonance to get maximum light displacement at the distal end of the scanner. Since it is difficult to get resonant scanners for applications requiring low-frequency scanning, imaging devices based on the use of non-resonant or semi-resonant frequencies have been developed for this specific requirement.
Optical fibers are mainly actuated using electrostatic, electrothermal, piezoelectric, electromagnetic, or shape memory alloys. The electrostatic actuators are easy to fabricate and rapidly responsive but have a limited scanning range and moderate actuation force. On the other hand, electrothermal actuators can be made in very small dimensions and can provide large forces. In this case, they can actuate at very high frequencies, but the heat dissipation can compromise the material performance. Piezoelectric actuators are widely used in optical fiber endoscopes because of their fast response. However, the manufacturing of very small-sized endoscopes based on these actuators pose some challenges. The electromagnetic and shape memory alloy actuators are better suited for larger dimensional scales.
Base on the type of the actuator and power/voltage profile provided as the input, it is possible to generate 2-D scanning patterns in a raster, spiral, Lissajous, circular, or propeller shape. Raster and Lissajous patterns provide uniform light intensity within the light scanning area. The spiral pattern is easy to obtain but has more light intensity in the center compared to the edges. Each pattern has its own advantages and disadvantages. Table 5 summarizes the pros and cons of the different scanning patterns in detail.
A descriptive summary of some recently developed optical imaging devices for medical purposes using a variety of different imaging techniques, configurations, actuating methods, and scanning patterns is shown in Table 6. The scanning catheter developed by Aguirre et al. is a side-viewing OCT endoscope, where the light is transported to the distal end using an SMF, and the forward mirror used to deflect the light is vibrated at resonance using angular vertical electrostatic comb drives and generates a raster scanning pattern [96]. Park et al. developed a forward-viewing spectral domain OCT endomicroscope. In this case, an SMF is excited at resonance using piezoelectric tube actuators and describes a Lissajous scanning pattern [63]. Myaing et al. reported a forward-viewing two-photon fluorescence microscope. A double clad fiber (DCF) is used to deliver light to the target sample and collect the fluorescence signal. The spiral pattern is generated by the fiber tip using a piezoelectric actuator exciting the tip at resonance [108]. Recently, Li et al. developed a 2.4-mm confocal endomicroscope using electrostatic actuators for laser light scanning. Such a probe with a 1.5-µm lateral and 12-µm axial resolution is compatible with the finer operating channel of current endoscopes [24].
In summary, the choice of an optical scanner over another type often depends on the target tissue and the constraints it poses. For example, some tissue surfaces, such as the eye, cannot tolerate shining a laser light on it for a long period of time due to the energy of the laser beam causing photoablation of the tissue. Thus, some scanners are better fit for imaging certain tissue surfaces than others. Similarly, some of the optical scanning devices are better at imaging the tissue surface by illuminating the light from the side of the probe, while others are designed for direct en face imaging. In addition, the selection of an imaging device for a medical purpose is also based on the size, the usage simplicity, and the ergonomics of the device. Another relevant consideration for endoscopic devices is their suitability for reprocessing; that is their suitability multiple uses. Reprocessing, which generally requires washing optical devices using chemicals to reduce risks of infection, can be a very expensive process. Endoscopes should also be mechanically robust; the handling of the endoscopes during reprocessing may damage the endoscopes. For example, a small crack could be initiated, leading to light leakage and the consequent considerable degradation of the performance of the device.

8. Conclusions

In the present paper, we reviewed the different imaging techniques used in medical applications. The continuous growth of microfabrication techniques and optical components make the latest imaging devices much smaller, allowing visualization of narrower sections of the body and imaging of target areas with a very fine resolution. The thinner the imaging device is, the further the imaging device can be advanced into the body, which enables improved detection of the lesion/tumor surface.
In medical applications, OCT is a frequently used imaging modality to image tissue structures due to the smaller size of the probe device; among this type, FD-OCT is widely used. Among the other imaging modalities, nonlinear microscopy can generate images with a finer resolution, while photoacoustic imaging can image deeper into the tissue. A large number of imaging probes have been developed using electrostatic actuation due to the ease of fabrication and fast scanning speed.
In conclusion, the advancement of MEMSs and small-sized optical components enable the fabrication of imaging devices with promising performance as compared to the traditional medical devices. Such devices enable the detection of lesions/tumors at an earlier stage and act as a guide during surgical procedures, increasing diagnostic capabilities.

Author Contributions

Conceptualization, C.M. and M.K.; formal analysis, M.K.; investigation, M.K.; resources, M.K.; data curation, M.K.; writing—original draft preparation, M.K.; writing—review and editing, M.K., P.M.L., and C.M.; visualization, M.K.; supervision, C.M., and P.M.L.; project administration, C.M., and P.M.L.; funding acquisition, C.M., and P.M.L. All authors have read and agreed to the published version of the manuscript.

Funding

This work was supported by the Natural Sciences and Engineering Research Council (NSERC) of Canada, Canadian Institutes of Health Research (CIHR), the Canada Research Chair (CRC) program, and the Mitacs internship program.

Conflicts of Interest

The authors declare no conflict of interest. The funders had no role in the design of the study; in the collection, analyses, or interpretation of data; in the writing of the manuscript, or in the decision to publish the results.

References

  1. Kiesslich, R.; Goetz, M.; Hoffman, A.; Galle, P.R. New imahing techniques and opportunities in endoscopy. Nat. Rev. Gastroenterol. Hepatol. 2011, 8, 547–553. [Google Scholar] [CrossRef]
  2. Qiu, Z.; Piyawattanametha, W. MEMS Actuators for Optical Microendoscopy. Micromachines 2019, 10, 85. [Google Scholar] [CrossRef] [PubMed] [Green Version]
  3. Lee, C.M.; Engelbrecht, C.J.; Soper, T.D.; Helmchen, F.; Seibel, E.J. Scanning fiber endoscopy with highly flexible, 1-mm catheterscopes for wide-field, full-color imaging. J. Biophotonics 2010, 3, 385–407. [Google Scholar] [CrossRef] [PubMed] [Green Version]
  4. Udovich, J.A.; Kirkpatrick, N.D.; Kano, A.; Tanbakuchi, A.; Utzinger, U.; Gmitro, A.F. Spectral background and transmission characteristics of fiber optic imaging bundles. Appl. Opt. 2008, 47, 4560–4568. [Google Scholar] [CrossRef] [PubMed]
  5. Scheffer, D. Endoscopes Use CMOS Image Sensors. Vision Systems Design. Available online: https://www.vision-systems.com/home/article/16750278/endoscopes-use-cmos-image-sensors (accessed on 28 July 2020).
  6. Kaur, M.; Brown, M.; Lane, P.M.; Menon, C. An Electro-Thermally Actuated Micro-Cantilever-Based Fiber Optic Scanner. IEEE Sens. J. 2020, 20, 9877–9885. [Google Scholar] [CrossRef]
  7. Wang, L.V.; Wu, H.-I. Biomed. Opt.: Principles and Imaging; Wiley: Hoboken, NJ, USA, 2007. [Google Scholar]
  8. Fujimoto, J.G.; Pitris, C.; Boppart, S.A.; Brezinski, M.E. Optical Coherence Tomography: An Emerging Technology for Biomedical Imaging and Optical Biopsy. Neoplasia 2000, 2, 9–25. [Google Scholar] [CrossRef] [Green Version]
  9. Zysk, A.M. Boppart, Optical Coherence Tomography. In Optical Imaging and Microscopy: Techniques and Advanced Systems, 2nd ed.; Török, P., Kao, F.-J., Eds.; Springer: Heidelberg/Berlin, Germany, 2007; pp. 401–436. [Google Scholar]
  10. Boudoux, C. Fundamentals of Biomedical Optics: From Light Interactions with Cells to Complex Imaging Systems; Pollux: Montreal, QC, Canada, 2017. [Google Scholar]
  11. Popescu, D.P.; Choo-Smith, L.-P.; Flueraru, C.; Mao, Y.; Chang, S.; Disano, J.; Sherif, S.; Sowa, M.G. Optical coherence tomography: Fundamental principles, instrumental designs and biomedical applications. Biophys. Rev. 2011, 3, 155–169. [Google Scholar] [CrossRef]
  12. Kim, B.J.; Irwin, D.J.; Song, D.D.; Daniel, E.R.; Leveque, J.S.; Raquib, J.L.; Pan, W.L.; Ying, G.-S.L.; Aleman, T.L.; Dunaief, J.L.; et al. Optical coherence tomography identifies outer retina thinning in frontotemporal degeneration. Neurology 2017, 89, 1604–1611. [Google Scholar] [CrossRef]
  13. Lumbroso, B.; Huang, D.; Chen, C.J.; Jia, Y.; Rispoli, M.; Romano, A.; Waheed, N.K. Clinical OCT Angiography Atlas; Jaypee Brothers Medical Publishers: New Delhi, India, 2015. [Google Scholar]
  14. Cunha, J.P.; Proença, R.; Dias-Santos, A.; Almeida, R.; Águas, H.; Alves, M.; Papoila, A.L.; Louro, C.; Castanheira-Dinis, A. OCT in Alzheimer’s disease: Thinning of the RNFL and superior hemiretina. Graefe’s Arch. Clin. Exp. Ophthalmol. 2017, 255, 1827–1835. [Google Scholar] [CrossRef]
  15. Tearney, G.J.; Boppart, S.A.; Bouna, B.E.; Brezinski, M.E.; Weissman, N.J.; Southern, J.F.; Fujimoto, J.G. Scanning single-mode fiber optic catheter-endoscope for optical coherence tomography. Opt. Lett. 1996, 21, 543–545. [Google Scholar] [CrossRef]
  16. Boppart, S.A.; Bouma, B.E.; Pitris, C.; Tearney, G.J.; Fujimoto, J.G.; Brezinski, M.E. Forward-imaging instruments for optical coherence tomography. Opt. Lett. 1997, 22, 1618–1620. [Google Scholar] [CrossRef]
  17. Paddock, S.W.; Fellers, T.J.; Davidson, M.W. Introductory Confocal Concepts. Available online: https://www.microscopyu.com/techniques/confocal/introductory-confocal-concepts (accessed on 23 June 2020).
  18. Liu, L.; Wang, E.; Zhang, X.; Liang, W.; Li, X.; Xie, H. MEMS-based 3D confocal scanning microendoscope using MEMS scanners for both lateral and axial scan. Sens. Actuators A Phys. 2014, 215, 89–95. [Google Scholar] [CrossRef] [Green Version]
  19. Dickensheets, D.L.; Kino, G.S. Micromachined scanning confocal optical microscope. Opt. Lett. 1996, 21, 764–766. [Google Scholar] [CrossRef]
  20. Maitland, K.C.; Shin, H.J.; Ra, H.; Lee, D.; Solgaard, O.; Richards-Kortum, R. Single fiber confocal microscope with a two-axis gimbaled MEMS scanner for cellular imaging. Opt. Express 2006, 14, 8604–8612. [Google Scholar] [CrossRef] [PubMed] [Green Version]
  21. Jung, I.W.; Lopez, D.; Zhen, Q.; Piyawattanametha, W. 2-D MEMS Scanner for Handheld Multispectral Dual-Axis Confocal Microscopes. J. Microelectromechanical Syst. 2018, 27, 605–612. [Google Scholar] [CrossRef]
  22. Cellvizio Targeted Biopsies. Mauna Kea Technolgies. Available online: https://www.maunakeatech.com/en/cellvizio/10-cellvizio-targeted-biopsies (accessed on 25 August 2020).
  23. Laemmel, E.; Genet, M.; Le Goualher, G.; Perchant, A.; Le Gargasson, J.F.; Vicaut, E. Fibered Confocal Fluorescence Microscopy (Cell-ViZioTM) Facilitates Extended Imaging in the Field of Microcirculation. J. Vasc. Res. 2004, 41, 400–411. [Google Scholar] [CrossRef] [PubMed]
  24. Li, G.; Duan, X.; Lee, M.; Birla, M.; Chen, J.; Oldham, K.R.; Wang, T.D.; Li, H. Ultra-Compact Microsystems-Based Confocal Endomicroscope. IEEE Trans. Med. Imaging 2020, 39, 2406–2414. [Google Scholar] [CrossRef] [PubMed]
  25. Li, R.; Wang, X.; Zhou, Y.; Zong, H.; Chen, M.; Sun, M. Advances in nonlinear optical microscopy for biophotonics. J. Nanophotonics 2018, 12, 033007. [Google Scholar] [CrossRef]
  26. Piston, D.W.; Fellers, T.J.; Davidson, M.W. Multiphoton Microscopy. Available online: https://www.microscopyu.com/techniques/multi-photon/multiphoton-microscopy (accessed on 23 June 2020).
  27. Huang, J.; Li, N.; Wang, Q.; Gu, Y.; Wang, P. A lysosome-targetable and two-photon fluorescent probe for imaging endogenous β-galactosidase in living ovarian cancer cells. Sens. Actuators B Chem. 2017, 246, 833–839. [Google Scholar] [CrossRef]
  28. Liu, Z.-R.; Tang, Y.; Xu, A.; Lin, W. A new fluorescent probe with a large turn-on signal for imaging nitroreductase in tumor cells and tissues by two-photon microscopy. Biosens. Bioelectron. 2017, 89, 853–858. [Google Scholar] [CrossRef]
  29. Kawakami, R.; Sawada, K.; Kusama, Y.; Fang, Y.-C.; Kanazawa, S.; Kozawa, Y.; Sato, S.; Yokoyama, H.; Nemoto, T. In vivo two-photon imaging of mouse hippocampal neurons in dentate gyrus using a light source based on a high-peak power gain-switched laser diode. Biomed. Opt. Express 2015, 6, 891–901. [Google Scholar] [CrossRef] [PubMed] [Green Version]
  30. Tkaczyk, T.S. Endomicroscopy. In Biomedical Optical Imaging Technologies: Design and Applications; Liang, R., Ed.; Springer: Heidelberg/Berlin, Germany, 2013; pp. 255–296. [Google Scholar]
  31. Campagnola, P.J.; Wei, M.-D.; Lewis, A.; Loew, L.M. High-Resolution Nonlinear Optical Imaging of Live Cells by second Harmonic Generation. Biophys. J. 1999, 77, 3341–3349. [Google Scholar] [CrossRef] [Green Version]
  32. Liu, H.; Qin, W.; Saho, Y.; Ma, Z.; Ye, T.; Borg, T.; Gao, B.Z. Myofibrillogenesis in live neonatal cardiomyocytes observed with hybrid two-photon excitation fluorescence-second harmonic generation microscopy. J. Biomed. Opt. 2011, 16, 126012. [Google Scholar] [CrossRef] [PubMed] [Green Version]
  33. Romeike, B.F.; Meyer, T.; Reichart, R.; Kalff, R.; Petersen, I.; Dietzek, B.; Popp, J. Coherent anti-Stokes Raman scattering and two photon excited fluorescence for neurosurgery. Clin. Neurol. Neurosurg. 2015, 131, 42–46. [Google Scholar] [CrossRef]
  34. Le, T.T.; Huff, T.B.; Cheng, J.-X. Coherent anti-Stokes Raman scattering imaging of lipids in cancer metastasis. BMC Cancer 2009, 9, 42. [Google Scholar] [CrossRef] [Green Version]
  35. Wei, L.; Yu, Y.; Shen, Y.; Wang, M.C.; Min, W. Vibrational imaging of newly synthesized proteins in live cells by stimulated Raman scattering microscopy. Proc. Natl. Acad. Sci. USA 2013, 110, 11226–11231. [Google Scholar] [CrossRef] [Green Version]
  36. Haasterecht, L.V.; Zada, L.; Schmidt, R.W.; de Bakker, E.; Barbe’, E.; Leslie, H.A.; Vethaak, A.D.; Gibbs, S.; de Boer, J.F.; Niessen, F.B.; et al. Label-Free stimulated Raman scattering imaging reveals silicone breast implant material in tissue. J. Biophotonics 2020, 13, e201960197. [Google Scholar] [CrossRef] [Green Version]
  37. Hu, S.; Maslov, K.; Wang, L.V. Three-Dimensional Optical-Resolution Photoacoustic Microscopy. In Biomedical Optical Imaging Technologies: Design and Applications; Liang, R., Ed.; Springer: Heidelberg/Berlin, Germany, 2013; pp. 55–77. [Google Scholar]
  38. Yao, J.; Wang, L.V. Photoacoustic Microscopy. Laser Photonics Rev. 2013, 7, 758–778. [Google Scholar] [CrossRef]
  39. Hu, S.; Wang, L.V. Photoacoustic imaging and characterization of the microvasculature. J. Biomed. Opt. 2010, 15, 011101. [Google Scholar] [CrossRef]
  40. Stein, E.W.; Maslov, K.; Wang, L.V. Noninvasive mapping of the electrically stimulated mouse brain using photoacoustic microscopy. In Proceedings of the Photons Plus Ultrasound: Imaging and Sensing 2008: The Ninth Conference on Biomedical Thermoacoustics, Optoacoustics, and Acousto-optics, San Jose, CA, USA, 28 February 2008; International Society for Optics and Photonics: Bellingham, WA, USA, 2008; Volume 6856, p. 68561J. [Google Scholar] [CrossRef]
  41. Xie, Z.; Roberts, W.; Carson, P.; Liu, X.; Tao, C.; Wang, X. Evaluation of bladder microvasculature with high resolution photoacuostic imaging. Opt. Lett. 2011, 36, 4815–4817. [Google Scholar] [CrossRef]
  42. Hu, S.; Wang, L.V. Neurovascular Photoacoustic Tomography. Front. Neuroeng. 2010, 2, 10. [Google Scholar] [CrossRef] [Green Version]
  43. Ermilov, S.A.; Khamapirad, T.; Conjusteau, A.; Leonard, M.H.; Lacewell, R.; Mehta, K.; Miller, T.; Oraevsky, A.A. Laser optoacoustic imaging system for detection of breast cancer. J. Biomed. Opt. 2009, 14, 024007. [Google Scholar] [CrossRef] [PubMed]
  44. Maslov, K.; Ku, G.; Wang, L.V. Photoacoustic microscopy with submicron resolution. In Proceedings of the Photons Plus Ultrasound: Imaging and Sensing 2010, San Francisco, CA, USA, 23 February 2010; International Society for Optics and Photonics: Bellingham, WA, USA, 2010; Volume 7564, p. 75640W. [Google Scholar] [CrossRef] [Green Version]
  45. Wang, L.V.; Hu, S. Photoacoustic tomography: In vivo imaging from organelles to organs. Science 2012, 335, 1458–1462. [Google Scholar] [CrossRef] [Green Version]
  46. Chan, J.; Zheng, Z.; Bell, K.; Le, M.; Reza, P.H.; Yeow, J.T.W. Photoacoustic Imaging with Capacitive Micromachined Ultrasound Transducers: Principles and Developments. Sensors 2019, 19, 3617. [Google Scholar] [CrossRef] [PubMed] [Green Version]
  47. Xu, C.; Zipfel, W.; Shear, J.B.; Williams, R.M.; Webb, W.W. Multiphoton fluorescence excitation: New spectral windows for biological nonlinear microscopy. Proc. Natl. Acad. Sci. USA 1996, 93, 10763–10768. [Google Scholar] [CrossRef] [Green Version]
  48. Hoffmann, D.M.; Kuhnke, K.; Kern, L. Sum-frequency generation microscope for opaque and reflecting samples. Rev. Sci. Instrum. 2002, 73, 3221–3226. [Google Scholar] [CrossRef]
  49. Zumbusch, A.; Holtom, G.R.; Xie, S.X. Three-Dimensional Vibrational Imaging by Coherent Anti-Stokes Raman Scattering. Phys. Rev. Lett. 1999, 82, 4142–4145. [Google Scholar] [CrossRef] [Green Version]
  50. Campagnola, P. Second Harmonic Generation Imaging Microscopy: Applications to Diseases Diagnostics. Anal. Chem. 2011, 83, 3224–3231. [Google Scholar] [CrossRef] [Green Version]
  51. Ganikhanov, F.; Carrasco, S.; Xie, S.X.; Katz, M.; Seitz, W.; Kopf, D. Broadly tunable dual-wavelength light source for coherent anti-Stokes Raman scattering microscopy. Opt. Lett. 2006, 31, 1292–1294. [Google Scholar] [CrossRef]
  52. Baik, J.W.; Kim, J.Y.; Cho, S.; Choi, S.; Kim, J.; Kim, C. Super Wide-Field Photoacoustic Microscopy of Animals and Humans In Vivo. IEEE Trans. Med. Imaging 2020, 39, 975–984. [Google Scholar] [CrossRef]
  53. Kim, J.K.; Choi, J.W.; Yun, S.H. 350-um side-view optical probe for imaging the murine brain in vivo from the cortex to the hypothalamus. J. Biomed. Opt. 2013, 18, 050502. [Google Scholar] [CrossRef] [PubMed]
  54. Tran, P.H.; Mukai, D.S.; Brenner, M.; Chen, Z. In vivo endoscopic optical coherence tomography by use of a rotational microelectromechanical system probe. Opt. Lett. 2004, 29, 1236–1238. [Google Scholar] [CrossRef] [PubMed]
  55. Lee, C.M.; Chandler, J.E.; Seibel, E.J. Wide Field Fluorescence Imaging in Narrow Passageways Using Scanning Fiber Endoscope Technology. In Proceedings of the Endoscopic Microscopy V, Proc. of SPIE 7558, San Francisco, CA, USA, 18 February 2010. [Google Scholar] [CrossRef]
  56. Zhang, E.Z.; Beard, P.C. A miniature all-optical photoacoustic imaging probe. In Proceedings of the Photons Plus Ultrasound: Imaging and Sensing 2011, Proc. SPIE 7899, San Francisco, CA, USA, 10 February 2011. [Google Scholar] [CrossRef] [Green Version]
  57. Tearney, G.J.; Brezinski, M.E.; Bouma, B.E.; Boppart, S.A.; Pitris, C.; Southern, J.F.; Fujimoto, J.G. In Vivo Endoscopic Optical Biopsy with Optical Coherence Tomography. Science 1997, 276, 2037–2039. [Google Scholar] [CrossRef] [PubMed] [Green Version]
  58. Li, X.; Chudoba, C.; Ko, T.; Pitris, C.; Fujimoto, J.G. Imaging needle for optical coherence tomography. Opt. Lett. 2000, 25, 1520–1522. [Google Scholar] [CrossRef] [PubMed]
  59. Lorenser, D.; Yang, X.; Kirk, R.W.; Quirk, B.C.; McLaughlin, R.A.; Sampson, D.D. Ultrathin side-viewing needle probe for optical coherence tomography. Opt. Lett. 2011, 36, 3894–3896. [Google Scholar] [CrossRef] [PubMed]
  60. Yang, V.X.; Mao, Y.X.; Munce, N.; Standish, B.; Kucharczyk, W.; Marcon, N.E.; Wilson, B.C.; Vitkin, I.A. Interstitial Doppler optical coherence tomography. Opt. Lett. 2005, 30, 1791–1793. [Google Scholar] [CrossRef]
  61. Herz, P.R.; Chen, Y.; Aguirre, A.D.; Schneider, K.; Hsiung, P.; Fujimoto, J.G.; Madden, K.; Schmitt, J.; Goodnow, J.; Petersen, C. Micromotor endoscope catheter for in vivo, ultrahigh-resolution optical coherence tomography. Opt. Lett. 2004, 29, 2261–2263. [Google Scholar] [CrossRef]
  62. Paulson, B.; Lee, S.; Kim, Y.; Moon, Y.; Kim, J.K. Miniaturized omnidirectional flexible side-view endoscope for rapid monitoring of thin tubular biostructures. Biomed. Opt. Express 2019, 10, 2264–2274. [Google Scholar] [CrossRef]
  63. Park, H.-C.; Seo, Y.-H.; Jeong, K.-H. Lissajous fiber scanning for forward viewing optical endomicroscopy using asymmetric modulation. Opt. Express 2014, 22, 5818–5825. [Google Scholar] [CrossRef]
  64. Seibel, E.J.; Johnston, R.S.; Melville, C.D. A full-color scanning fiber endoscope. Opt. Fibers Sens. Med. Diag. Treat. Appl. 2006, 6083. [Google Scholar] [CrossRef]
  65. Kim, K.H.; Park, B.H.; Maguluri, G.N.; Lee, T.W.; Rogomentich, F.J.; Bancu, M.G.; Bouma, B.E.; de Boer, J.F.; Bernstein, J.J. Two-axis magnetically-driven MEMS scanning catheter for endoscopic high-speed optical coherence tomography. Opt. Express 2007, 15, 18130–18140. [Google Scholar] [CrossRef]
  66. Yao, J.; Peng, T.; Sun, B.; Zhang, H.; Zhao, M.; Dai, B.; Liu, H.; Ding, G.; Swada, R.; Yang, Z. A Single-Fiber Endoscope Scanner Probe Utilizing Two-Degrees-of-Freedom (2DOF) High-Order Resonance to Realize Larger Scanning Angle. IEEE Trans. Compon. Packag. Manuf. Technol. 2019, 9, 2332–2340. [Google Scholar] [CrossRef]
  67. Acemoglu, A.; Mattos, L.S. Magnetic Laser Scanner for Endoscopic Microsurgery. In Proceedings of the IEEE International Conference on Robotics and Automation, Singapore, 29 May–3 June 2017; pp. 4215–4220. [Google Scholar] [CrossRef]
  68. Seo, Y.-H.; Hwang, K.; Park, H.-C.; Jeong, K.-H. Electrothermal mems fiber scanner with lissajous patterns for endomicroscopic applications. Opt. Express 2016, 24, 3903–3909. [Google Scholar] [CrossRef] [PubMed]
  69. Seo, Y.-H.; Hwang, K.; Jeong, K.-H. 1.65 mm diameter forward-viewing confocal endomicroscopic catheter using a glip-chip bonded electrothermal MEMS fiber scanner. Opt. Express 2018, 26, 4780–4785. [Google Scholar] [CrossRef] [PubMed]
  70. Kobayashi, T.; Matsunaga, T.; Haga, Y. Active Bending Electric Endoscope Using Shape Memory Alloy wires. In New Trends in Medical and Service Robots: Assistive, Surgical and Educational Robotics; Bleuler, H., Bouri, M., Mondada, F., Pisla, D., Rodic, A., Helmer, P., Eds.; Springer: Cham, Switzerland, 2016; pp. 131–139. [Google Scholar]
  71. Wang, Y.; Bachman, M.; Li, G.P.; Guo, S.; Wong, B.J.; Chen, Z. Low-voltage polymer-based scanning cantilever for in vivo optical coherence tomography. Opt. Lett. 2005, 30, 53–55. [Google Scholar] [CrossRef] [PubMed]
  72. Zara, J.M.; Yazdanfar, S.; Rao, K.D.; Izatt, J.A.; Smith, S.W. Electrostatic micromachine scanning mirror for optical coherence tomography. Opt. Lett. 2003, 28, 628–630. [Google Scholar] [CrossRef] [Green Version]
  73. Pan, Y.; Xie, H.; Fedder, G.K. Endoscopic optical coherence tomography based on a microelectromechanical mirror. Opt. Lett. 2001, 26, 1966–1968. [Google Scholar] [CrossRef]
  74. Gilchrist, K.H.; McNabb, R.P.; Izatt, J.P.; Grego, S. Piezoelectric scanning mirrors for endoscopic optical coherence tomography. J. Micromech. Microeng. 2009, 19, 095012. [Google Scholar] [CrossRef]
  75. Pan, Y.; Li, Z.; Xie, T.; Chu, C.R. Hand-held arthroscopic optical coherence tomography for in vivo high-resolution imaging of articular cartilage. J. Biomed. Opt. 2003, 8, 648–654. [Google Scholar] [CrossRef]
  76. Göbel, W.; Kerr, J.N.; Nimmerjahn, A.; Helmchen, F. Miniaturized two-photon microscope based on a flexible coherent fiber bundle and a gradient-index lens objective. Opt. Lett. 2004, 29, 2521–2523. [Google Scholar] [CrossRef]
  77. Wu, J.; Conry, M.; Gu, C.; Wang, F.; Yaqoob, Z.; Yang, C. Paired-angle-rotation scanning optical coherence tomography forward-imaging probe. Opt. Lett. 2006, 31, 1265–1267. [Google Scholar] [CrossRef] [PubMed]
  78. Sarunic, M.V.; Han, S.; Wu, J.; Yaqoob, Z.; Humayun, M.; Yang, C. Endoscopic Optical Coherence Tomography of the Retina at 1310 nm Using Paired-Angle-Rotating Scanning. In Proceedings of the Coherence Domain Optical Methods and Optical Coherence Tomography in Biomedicine XI, Proc. of SPIE 6429, San Jose, CA, USA, 22–24 January 2007. [Google Scholar] [CrossRef]
  79. Wu, T.; Pan, R.; Cao, K.; Zhang, L.; Wang, J.; Lu, Y.; He, C.; Liu, Y. Side-viewing endoscopic imaging probe for swept source optical coherence. Opt. Commun. 2020, 467, 125596. [Google Scholar] [CrossRef]
  80. Inman, D.J. Engineering Vibrations; Pearson: Hoboken, NJ, USA, 2014. [Google Scholar]
  81. Holmstrom, S.T.S.; Baran, U.; Urey, H. Mems Laser Scanners: A Review. J. Microelectromech. Syst. 2014, 23, 259–275. [Google Scholar] [CrossRef]
  82. Haight, E.C.; King, W.W. stability of Nonlinear Oscillations of an elastic Rod. J. Acoust. Soc. Am. 1972, 52, 899–911. [Google Scholar] [CrossRef]
  83. Hyer, M.W. Whirling of a base-excited cantilever beam. J. Acoust. Soc. Am. 1979, 65, 931–939. [Google Scholar] [CrossRef] [Green Version]
  84. Kundrat, M.J.; Reinhall, P.G.; Lee, C.M.; Seibel, E.J. High Performance Open Loop Control of Scanning with a Small Cylindrical Cantilever Beam. J. Sound Vib. 2011, 330, 1762–1771. [Google Scholar] [CrossRef] [Green Version]
  85. Wu, L.; Ding, Z.; Huang, G. Realization of 2D scanning pattern of a fiber cantilever by nonlinear coupling. In Proceedings of the Fifth International Conference on Photonics and Imaging in Biology and Medicine, Proc. of SPIE 6534, Bellingham, WA, USA, 1 April 2007. [Google Scholar] [CrossRef]
  86. Rivera, D.R.; Brown, C.M.; Ouzounov, D.G.; Pavlova, I.; Kobat, D.; Webb, W.W.; Xu, C. Compact and flexible raster scanning multiphoton endoscope capable of imaging unstained tissue. Proc. Natl. Acad. Sci. USA 2011, 108, 17598–17603. [Google Scholar] [CrossRef] [Green Version]
  87. Hendriks, B.H.W.; Bierhoff, W.C.J.; Horikx, J.J.L.; Desjardins, A.E.; Hezemans, C.A.; Hooft, G.W.; Lucassen, G.W.; Mihajlovic, N. High-resolution resonant and nonresonant fiber-scanning confocal microscope. J. Biomed. Opt. 2011, 16, 026007. [Google Scholar] [CrossRef] [Green Version]
  88. Park, H.-C.; Zhang, X.; Yuan, W.; Zhou, L.; Xie, H.; Li, X. Ultralow-voltage electrothermal MEMS based fiber-optic scanning probe for forward-viewing endoscopic OCT. Opt. Lett. 2019, 44, 2232–2235. [Google Scholar] [CrossRef]
  89. Naono, T.; Fujii, T.; Esashi, M.; Tanaka, S. Non-resonant 2-D piezoelectric MEMS optical scanner actuated by Nb doped PZT thin film. Sens. Actuators A Phys. 2015, 233, 147–157. [Google Scholar] [CrossRef]
  90. Sawinski, J.; Denk, W. Miniature random-access fiber scanner for in vivo multiphoton imaging. J. Appl. Phys. 2007, 102, 034701. [Google Scholar] [CrossRef]
  91. Moon, S.; Lee, S.-W.; Rubinstein, M.; Wong, B.J.F.; Chen, Z. Semi-resonant operation of a fiber-cantilever piezotube scanner for stable optical coherence tomography endoscope imaging. Opt. Express 2010, 18, 21183–21197. [Google Scholar] [CrossRef] [PubMed] [Green Version]
  92. Bourouina, T.; Fujita, H.; Reyne, G.; Motamedi, M.E. Optical scanning. In MOEMS: Micro-Opto-Electro-Mechanical Systems; Motamedi, M.E., Ed.; SPIE: Bellingham, WA, USA, 2005; pp. 323–367. [Google Scholar]
  93. Pengwang, E.; Rabenorosoa, K.; Rakotondrabe, M.; Andreff, N. Scanning Micromirror Platform Based on MEMS Technology for Medical Application. Micromachines 2016, 7, 7020024. [Google Scholar] [CrossRef] [PubMed]
  94. Henri, C.; Franck, L. Fabrication, Simulation and experiment of a rotating electrostatic silicon mirror with large angular deflection. In Proceedings of the IEEE Thirteen Annual International Conference on Micro Electro Mechanical Systems, Miyazaki, Japan, 23–27 January 2000. [Google Scholar]
  95. Schenk, H.; Durr, P.; Kunze, D.; Lakner, H.; Kuck, H. A resonantly excited 2D-micro-scanning-mirror with large deflection. Sens. Actuators A Phys. 2001, 89, 104–111. [Google Scholar] [CrossRef]
  96. Aguirre, A.D.; Herz, P.R.; Chen, Y.; Fujimoto, J.G.; Piyawattanametha, W.; Fan, L.; Wu, M.C. Two-axis MEMS Scanning Catheter for Ultrahigh Resolution Three-dimensional and En Face Imaging. Opt. Express 2007, 15, 2445–2453. [Google Scholar] [CrossRef] [PubMed] [Green Version]
  97. Piyawattanametha, W.; Barretto, R.P.J.; Ko, T.H.; Flusberg, B.A.; Cocker, E.D.; Ra, H.; Lee, D.; Solgaard, O.; Schnitzer, M.J. Fast-scanning two-photon fluorescence imaging based on a microelectromechanical systems two-dimensional scanning mirror. Opt. Lett. 2006, 31, 2018–2020. [Google Scholar] [CrossRef]
  98. Yang, S.; Xu, Q. A review on actuation and sensing techniques for MEMS-based microgrippers. J. Micro Bio Robot. 2017, 13, 1–14. [Google Scholar] [CrossRef]
  99. Rahafrooz, A.; Hajjam, A.; Pourkamali, S. Thermal Actuation of High Frequency Micromechanical Resonators. In Proceedings of the 2009 IEEE International SOI Conference, Foster City, CA, USA, 5–8 October 2009. [Google Scholar] [CrossRef]
  100. Potekhina, A.; Wang, C. Review of Electrothermal Actuators and Applications. Actuators 2019, 8, 69. [Google Scholar] [CrossRef] [Green Version]
  101. Buser, R.A.; de Rooij, N.F.; Tischhauser, H.; Dommann, A.; Staufert, G. Biaxial scanning mirror activated by bimorph structures for medical applications. Sens. Actuators A Phys. 1992, 31, 29–34. [Google Scholar] [CrossRef]
  102. Schweizer, S.; Calmes, S.; Laudon, M.; Renaud, P. Thermally actuated optical microscanner with large angle and low consumption. Sens. Actuators A Phys. 1999, 76, 470–477. [Google Scholar] [CrossRef]
  103. Evstafyev, S.S.; Timoshenkov, S.P.; Britkov, I.M.; Samoilykov, V.K.; Tereshhenko, A.M. A bimorph electrothermal actuator for micromirror devices. In Proceedings of the Micro- and Nanotechnology Sensors, Systems, and Applications VII, Proc. of SPIE 9467, Baltimore, MD, USA, 22 April 2015. [Google Scholar] [CrossRef]
  104. Tanguy, Q.A.; Gaiffe, O.; Passilly, N.; Cote, J.-M.; Cabodevila, G.; Bargiel, S.; Lutz, P.; Xie, H.; Gorecki, C. Real-time Lissajous imaging with a low-voltage 2-axis MEMS scanner based on electro-thermal actuation. Opt. Express 2020, 28, 8512–8527. [Google Scholar] [CrossRef] [PubMed]
  105. Duan, C.; Tanguy, Q.; Pozzi, A.; Xie, H. Optical coherence tomography endoscopic probe based on a tilted MEMS mirror. Biomed. Opt. Express 2016, 7, 3345–3354. [Google Scholar] [CrossRef] [PubMed]
  106. Zhang, P. Advanced Industrial Control Technology; Elsevier: Oxford, UK, 2010; pp. 73–116. [Google Scholar]
  107. Mansoor, M.B.; Koble, S.; Wong, W.T.; Woias, P.; Goldschmidtboing, F. Design, Characterization and Sensitivity Analysis of a Piezoelectric Ceramic/Metal Composite Transducer. Micromachines 2017, 8, 271. [Google Scholar] [CrossRef] [PubMed]
  108. Myaing, M.T.; MacDonald, D.J.; Li, X. Fiber-optic scanning two-photon fluorescence endoscope. Opt. Lett. 2006, 31, 1076–1078. [Google Scholar] [CrossRef] [PubMed]
  109. Liu, X.; Cobb, M.J.; Chen, Y.; Kimmey, M.B.; Li, X. Rapid-scanning forward-imaging miniature endoscope for real-time optical coherence tomography. Opt. Lett. 2004, 29, 1763–1765. [Google Scholar] [CrossRef]
  110. Kretschmer, S.; Jager, J.; Vilches, S.; Ataman, C.; Zapper, H. A bimodal endoscopic imager in a glass package. J. Micromech. Microeng. 2018, 28, 105009. [Google Scholar] [CrossRef]
  111. Wu, T.; Ding, Z.; Wang, K.; Chen, M.; Wang, C. Two-dimensional scanning realized by an asymmetry fiber cantilever driven by single piezo bender actuator for optical coherence tomography. Opt. Lett. 2009, 17, 13819–13829. [Google Scholar] [CrossRef]
  112. Liu, Z.; Fu, L.; Gao, F.; Zhang, X. Design and implementation of 2-D endoscopic optical fiber scanner. In Proceedings of the Seventh International Conference on Photonics and Imaging in Biology and Medicine, Proc. of SPIE 7280, Wuhan, China, 6 March 2009. [Google Scholar] [CrossRef]
  113. Joos, K.M.; Shen, J.-H. Miniature real-time intraoperative forward imaging optical coherence tomography probe. Biomed. Opt. Express 2013, 4, 1342–1350. [Google Scholar] [CrossRef] [Green Version]
  114. Sun, B.; Sawada, R.; Yang, Z.; Zhang, Y.; Itoh, T.; Maeda, R. Design and Fabrication of Driving Microcoil with Large Tilt-Angle for Medical Scanner Application. In Proceedings of the 2014 Symposium on Design, Test, Integration and Packaging of MEMS/MOEMS (DTIP), Cote D’Azur, France, 1–4 April 2014; pp. 1–6. [Google Scholar]
  115. Sun, B.; Nogami, H.; Pen, Y.; Sawada, R. Microelectromagnetic actuator based on a 3D printing process for fiber scanner application. J. Micromech. Microengi. 2015, 25, 075014. [Google Scholar] [CrossRef]
  116. Barbaroto, P.R.; Ferreira, L.O.S.; Doi, I. Micromachined scanner actuated by electromagnetic induction. In Proceedings of the Optomechatronic Systems III, Proc. of SPIE 4902, Stuttgart, Germany, 18 October 2002. [Google Scholar] [CrossRef]
  117. Miyajima, H.; Asaoka, N.; Isokawa, T.; Ogata, M.; Aoki, Y.; Imai, M.; Fujimori, O.; Katashiro, M.; Matsumoto, K. A MEMS Electromagnetic Optical Scanner for a Commercial Confocal Laser Scanning Microscope. J. Microelectromech. Syst. 2003, 12, 243–251. [Google Scholar] [CrossRef]
  118. Miyajima, H. MEMS electromagnetic optical scanner for a commercial laser scanning microscope. In Proceedings of the MOEMS Display and Imaging Systems, Proc. of SPIE 4985, San Jose, CA, USA, 20 January 2003. [Google Scholar] [CrossRef]
  119. Mitsui, T.; Takahashi, Y.; Watanabe, Y. A 2-axis optical scanner driven nonresonantly by electromagnetic force for OCT imaging. J. Micromech. Microeng. 2006, 16, 2482–2487. [Google Scholar] [CrossRef]
  120. Yuan, S.; Wan, Y.; Mao, Y.; Song, S.; Meng, M.Q.-H. Design of a Novel Electromagnetic Actuation System for Actuating Magnetic Capsule Robot. In Proceedings of the 2019 IEEE International Conference on Robotics and Biomimetics (ROBIO), Dali, China, 6–8 December 2019; pp. 1513–1519. [Google Scholar] [CrossRef]
  121. Hoang, M.C.; Le, V.H.; Nguyen, K.T.; Nguyen, V.D.; Kim, J.; Choi, E.; Bang, S.; Kang, B.; Park, J.-O.; Kim, C.-S. A Robotic Biopsy Endoscope with Magnetic 5-DOF Locomotion and a Retractable Biopsy Punch. Micromachines 2020, 11, 98. [Google Scholar] [CrossRef] [PubMed] [Green Version]
  122. Cullity, B.D.; Graham, C.D. Introduction to Magnetic Materials, 2nd ed.; Wiley: Hoboken, NJ, USA, 2009; pp. 241–273. [Google Scholar]
  123. Bourouina, T.; Lebrasseur, E.; Reyne, G.; Debray, A.; Fujita, H.; Ludwig, A.; Quandt, E.; Muro, H.; Oki, T.; Asaoka, A. Integration of Two Degree-of-Freedom Magnetostrictive Actuation and Piezoresistive Detection: Application to a Two-Dimensional Optical scanner. J. Microelectromech. Syst. 2002, 11, 355–361. [Google Scholar] [CrossRef]
  124. Maeda, S.; Abe, K.; Yamamoto, K.; Tohyama, O.; Ito, H. Active endoscope with SMA (Shape Memory Alloy) coil springs. In Proceedings of the Ninth International Workshop on Micro Electromechanical Systems, San Diego, CA, USA, 11–15 February 1996; pp. 290–295. [Google Scholar] [CrossRef]
  125. Haga, Y.; Tanahashi, Y.; Esashi, M. Small diameter active catheter using shape memory alloy. In Proceedings of the IEEE. Eleventh Annual International Workshop on Micro Electro Mechanical Systems. An Investigation of Micro Structures, Sensors, Actuators, Machines and Systems. Proceedings MEMS 98, Heidelberg, Germany, 25–29 January 1998. [Google Scholar] [CrossRef]
  126. Makishi, W.; Matunaga, T.; Haga, Y.; Esashi, M. Active Bending Electric Endoscope Using Shape Memory Alloy Coil Actuators. In Proceedings of the First IEEE/RAS-EMBS International Conference on Biomedical Robotics and Biomechatronics, Pisa, Italy, 20–22 February 2006; pp. 217–219. [Google Scholar]
  127. Hofmann, U.; Janes, J.; Quenzer, H.J. High-Q MEMS Resonators for Laser Beam Scanning Displays. Micromachines 2012, 3, 509–528. [Google Scholar] [CrossRef]
  128. Vinegoni, C.; Lee, S.; Feruglio, P.F.; Weissleder, R. Advanced Motion Compensation Methods for Intravital Optical Microscopy. IEEE J. Sel. Top. Quantum Electron. 2014, 20, 83–91. [Google Scholar] [CrossRef]
  129. Duma, V.-F.; Lee, K.-S.; Meemon, P.; Rolland, J.P. Experimental investigations of the scanning functions of galvanometer-based scanners with applications in OCT. Appl. Opt. 2011, 50, 5735–5749. [Google Scholar] [CrossRef]
  130. Hwang, K.; Seo, Y.-H.; Ahn, J.; Kim, P.; Jeong, K.-H. Frequency selection rule for high definition and high frame rate Lissajous scanning. Sci. Rep. 2017, 7, 14075. [Google Scholar] [CrossRef]
  131. Kovács, A. Scanning strategies for imaging arrays. In Proceedings of the Millimeter and Submillimeter Detectors and Instrumentations for Astronomy IV, Proc. of SPIE 7020, Marseille, France, 18 July 2008. [Google Scholar] [CrossRef] [Green Version]
  132. Huang, G.; Ding, Z. Rapid two-dimensional transversal scanning fiber probe for optical coherence tomography. In Proceedings of the Coherence Domain Optical Methods and Optical Coherence Tomography in biomedicine XI, Proc. of SPIE 6429, California, CA, USA, 2 July 2007. [Google Scholar] [CrossRef]
  133. Tekpinar, M.; Khayatzadeh, R.; Ferhanoglu, O. Mutliple-pattern generating piezoelectric fiber scanner toward endoscopic applications. Opt. Eng. 2019, 58, 023101. [Google Scholar] [CrossRef]
  134. Ahrabi, A.A.; Kaur, M.; Li, Y.; Lane, P.; Menon, C. An Electro-Thermal Actuation Method for Resonance vibration of a Minaturized Optical-Fiber Scanner for Future Scanning Fiber Endoscope Design. Actuators 2019, 8, 21. [Google Scholar] [CrossRef] [Green Version]
  135. Bouma, B.E.; Tearney, G.J. Clinical Imaging with Optical Coherence Tomography. Acad. Radiol. 2002, 9, 942–953. [Google Scholar] [CrossRef]
  136. Glakova, N.D.; Petrova, G.A.; Nikulin, N.K.; Radenska-Lopovok, S.G.; Snopova, L.B.; Chumakov, Y.P.; Nasonova, V.A.; Gelikonov, V.M.; Gelikonov, G.V.; Kuranov, R.V.; et al. In vivo optical coherence tomography imaging of human skin: Norm and pathology. Skin Res. Technol. 2000, 6, 6–16. [Google Scholar] [CrossRef] [PubMed]
  137. Fried, D.; Xie, J.; Shafi, S.; Featherstone, J.D.B.; Breunig, T.M.; Le, C. Imaging caries lesions and lesion progression with polarization sensitive optical coherence tomography. J. Biomed. Opt. 2002, 7, 618–627. [Google Scholar] [CrossRef] [PubMed]
  138. Goetz, M. Confocal Laser Endomicroscopy: Applications in Clinical and Translational Science—A Comprehensive Review. Int. Sch. Res. Netw. ISRN Pathol. 2012, 2012, 1–13. [Google Scholar] [CrossRef] [Green Version]
  139. Adur, J.; Carvalho, H.F.; Cesar, C.L.; Casco, V.H. Nonlinear Microscopy Techniques: Principles and Biomedical Applications. In Microscopy and Analysis; Stanciu, S.G., Ed.; IntechOpen: London, UK, 2016. [Google Scholar] [CrossRef] [Green Version]
  140. Sun, J.; Guo, S.; Wu, L.; Liu, L.; Choe, S.-W.; Sorg, B.S.; Xie, H. 3D In Vivo optical coherence tomography based on a low-voltage, large-scan-range 2D MEMS mirror. Opt. Express 2010, 18, 12065–12075. [Google Scholar] [CrossRef]
  141. Akhoundi, F.; Qin, Y.; Peyghambarian, N.; Barton, J.K.; Kieu, K. Compact fiber-based multi-photon endoscope working at 1700nm. Biomed. Opt. Express 2018, 9, 2326–2335. [Google Scholar] [CrossRef] [Green Version]
  142. OmniVision. OVM6948. Available online: https://www.ovt.com/sensors/OVM6948 (accessed on 27 May 2020).
  143. Dickensheets, D.L.; Kino, G.S. Silicon-Micromachined Scanning Confocal Optical Microscope. J. Microelectromech. Syst. 1998, 7, 38–47. [Google Scholar] [CrossRef]
  144. Piyawattanametha, W.; Cocker, E.D.; Burns, L.D.; Barretto, R.P.J.; Jung, J.C.; Ra, H.; Solgaard, O.; Schnitzer, M.J. In vivo brain imaging using a portable 2.9 g two-photon microscope based on a microelectromechanical systems scanning mirror. Opt. Lett. 2009, 34, 2309–2311. [Google Scholar] [CrossRef] [Green Version]
Figure 1. The schematic diagram of an optical coherence tomography (OCT) scanner.
Applsci 10 06865 g001
Figure 2. OCT image of the human retina and comparison of macular thickness in a person without Alzheimer’s disease (AD), and patient with AD (taken with the permission of [14]).
Applsci 10 06865 g002
Figure 3. Schematic diagram of a confocal endoscope.
Applsci 10 06865 g003
Figure 4. In vivo confocal images: (a) reflectance image of tissue phantom with cervical cells and collagen (taken with permission of [20] © The Optical Society); (b) fluorescence image of an adenoma mucosa (taken with the permission of [24]); (c) fluorescence image of a normal mucosa (taken with the permission of [24]).
Applsci 10 06865 g004
Figure 5. Schematic diagram of a nonlinear endoscope.
Applsci 10 06865 g005
Figure 6. Two-photon exciting fluorescence (TPEF) image of ovarian cancer cells: (a) Fluorescence TPEF image using β-Galactosidase (β-gal) probe; (b) image using Lyso Tracker Red probe; (c) overlay of images a and b; (d) intensity profile (taken from [27] with permission).
Applsci 10 06865 g006
Figure 7. Second harmonic generation (SHG) and third harmonic generation (TPEF) images of differentiated neuroblastoma cells (taken with the permission of [31]).
Applsci 10 06865 g007
Figure 8. Images of brain metastasis of squamous cell carcinoma: (A) Hematoxylin and eosin-stained sample; (B) TPEF image; (C) Coherent anti-Stokes Raman scattering (CARS) image; (D) combining CARS and TPEF (used with the permission of [33]).
Applsci 10 06865 g008
Figure 9. Schematic diagram of a photoacoustic microscope (taken with the permission of [39]).
Applsci 10 06865 g009
Figure 10. Photoacoustic image of a mouse ear: (a) maximum amplitude image of 1 mm × 1 mm; (b) image of a small fragment of image a (taken with the permission of [44]).
Applsci 10 06865 g010
Figure 11. Schematic diagram: (a) side viewing probe; (b) forward viewing probe.
Applsci 10 06865 g011
Figure 12. Mode shapes of a cantilever beam describing the beam shape in vibration at resonance.
Applsci 10 06865 g012
Figure 13. Schematic diagram of electrostatic actuators: (a) linear comb-drives; (b) vertical comb drives; (c) rotary comb drives; (d) parallel-plate actuators (taken with the permission of [93]).
Applsci 10 06865 g013
Figure 14. Electrostatically driven micromirror: (A) SEM image; (B) electrical schematic (taken with the permission of [96] © The Optical Society).
Applsci 10 06865 g014
Figure 15. Schematic diagram of electrothermal actuator: (a) hot-and-cold arm actuator; (b) Chevron actuator; (c) bimorph actuator at initial state and under actuation (taken with the permission of [100]).
Applsci 10 06865 g015
Figure 16. Schematic diagram of a thermally driven micro-electro-mechanical systems (MEMS) scanner (used with the permission of [69] © The Optical Society).
Applsci 10 06865 g016
Figure 17. Schematic diagram of scanning fiber endoscope (SFE), and the schematic of the actuator used (taken with the permission of [3]).
Applsci 10 06865 g017
Figure 18. Electromagnetically driven OCT probe: (A) schematic; (B) developed probe; (C) test of probe through a 25-gauge port (taken with the permission of [113] © The Optical Society).
Applsci 10 06865 g018
Figure 19. Endoscope actuated using shape memory alloy wires: (a) actuator; (b) front-view of developed endoscope; (c) outer surface of the developed endoscope (taken with the permission from [70]).
Applsci 10 06865 g019
Table 1. Performance of different imaging applications.
OCTCMNonlinear MicroscopyPhotoacoustic Imaging
MultiphotonHarmonic GenerationRaman ScatteringOR-PAMAR-PAMPAT
Lateral resolution2–25 µm [2,10]1 µm [10,18]≈0.2 µm [47]4.9 µm [48]300 nm [49]~0.5–10 µm [44,45]45 µm [41,45] 70–720 µm [41,45]
Axial resolution1–15 µm [2,10]7 µm [18]≈0.6 µm [47]3.1 µm [48]1.6 µm [49]10 µm [44]15 µm [41,45]25–640 µm [41,45]
Penetration depth1–3 mm [2,3,10]>400 µm [18]>200 µm [47]100–300 µm [50]~130 µm [51]~1 mm [45]~3–5 mm [45]70 mm [45]
FOV2–5 mm [2]0.25–1 mm [2]200–500 µm [2]170 µm [50]205 µm × 205 µm [36]1–2 mm [2]upto 36 mm × 80 mm [52]~40 mm [52]
OrientationCross-section [10]en face [10]en face [10]Cross-section [41]
wavelengthNear IR Visible or Near IR Near IR Near IR or IR
SourceLow coherence [10]Continuous wave or pulsed [10]Pulsed [10]Pulsed [41]
Frame rate>60 Hz [2]>15 Hz [2]>5 Hz [2]~10 Hz (depends on scanning area) [2]
AdvantagesHigh sensitivity, high imaging speed, deep tissue penetration, independent of source spectrumHigh contrast due to rejection of out-of-focus scattered photons, isotropic and fine resolution, ability to control depth of field, ability to change magnification by changing the scanned areaLabel free technology, High spatial resolution, less phototoxicity, and photobleaching due to exciting event taking place at focus pointHigh spatial resolution, High contrast, High imaging speed, and deep tissue penetration
DisadvantagesExpensive detector, depth resolution dependent on NA, small dynamic rangeTwo or more nearby fluorescence signals can overlapExpensive laser source, needs dispersion compensationExpensive transducers required to detect the poor acoustic signal, Signal to noise ratio decreases with the tissue penetration
Table 2. Comparison between forward and side view scanners.
Forward ViewSide ViewReferences.
Probe diameter>250 µm (proximal scanning)
>1.65 mm (distal scanning)
>250 µm (proximal scanning)
>2.4 mm (distal scanning)
[54,56,77]
Rigid length>9 mm>11 mm[64,79]
FOV50–400 µm~3–4 mm[23,53,75]
Image orientationen facePeripherical surface
AdvantagesCan be used for image guidance to relocate and control the position of the medical devices, can directly image the extent of the malignancy and cancerous surfaceCan image the finer cavities of the body, gives information about the wall/section of tissue layer involved in the malignancy, higher field of view, less expensive
DisadvantagesLimited field of view, limitation of miniaturization limits the ability to image the narrower sectionsDifficult to guide the probe in the body due to lack of guidance
Table 3. Summary table for different scanners.
Resonant ScannerSemi-Resonant ScannerNon-Resonant Scanner
Scan area✓✓✓✓✓
Power consumption✓✓✓✓✓
Operating frequencyHighIntermediateLow
AdvantagesLarge displacement amplitude, low power consumptionLarge scanning amplitude than non-resonant scanners, variable imaging field, stable working conditionsOperable at very low frequencies, stable to small variations of operating conditions, image field is variable
DisadvantagesOffsetting the image field requires complex systems, Instability can lead to whirling motionPerformance highly depending on the working frequencySmall scanning amplitude, high power consumption
Table 4. The performance of different actuation methods.
ElectrostaticElectro-ThermalPiezoelectricElectromagneticShape Memory Alloy
Force✓✓✓✓✓✓✓✓
Displacement amplitude✓✓✓✓✓✓✓✓✓✓
Compactness✓✓✓✓✓✓✓✓✓✓
Working principleElectrostatic forceThermal expansionPiezoelectric effectMagnetization effectMaterial deformation
AdvantagesFast response, low voltage required, easy fabrication, and no hysteresisLarge displacement, low operating voltage, small dimensionsLarge force generated, wide operating frequency range, low power consumptionLarge displacement obtained, quick and linear response, easy to controlFlexibility, large frequency response
DisadvantagesLarge device dimensions, pull-in problem, complicated circuitHigh working temperature, not operable at very high frequenciesLimited displacementLarge device dimensions, difficult to manufactureLow displacement
Table 5. Comparison table for different scanning patterns.
RasterSpiralLissajousCircularPropeller
Scanning pattern Applsci 10 06865 i001 Applsci 10 06865 i002 Applsci 10 06865 i003 Applsci 10 06865 i004 Applsci 10 06865 i005
Actuation pattern Applsci 10 06865 i006 Applsci 10 06865 i007 Applsci 10 06865 i008 Applsci 10 06865 i009 Applsci 10 06865 i010
Y(t) constant rotation
AdvantagesUniform light intensityEasy to get, area is swept by changing the driving voltageUniform light intensity, most usedPossible to get circular pattern with 1D actuation, area is swept by changing the driving voltageEasy to generate
DisadvantagesPoints are scanned at different times can lead to motion artifactsLight intensity is higher in centerFill factor highly depends on the frequency ratio, quasi-random patternLight intensity is higher in centerNon uniform light intensity, the rotation of miniaturized structure requires complex and expensive devices
Table 6. Comparison of some advanced optical scanning devices.
Working PrincipleFrequencyFOVDrive VoltageScanner DimensionsScanning PatternReferences
OCT using rotational MEMS probeMicromotor1 kHz->1 V2.4 mm (in diameter)Radial[54]
MEMS fiber scanner for confocal microscopyElectrothermal actuation239 Hz (x-axis) 207 Hz (y-axis)378 µm × 439 µm16 Vpp
(duty cycle 13%)
Diameter (1.65 mm)
Rigid length (28 mm)
Lissajous scanning[69]
Fiber scanner for forward viewing endoscopePiezoelectric tube86 Hz (x-axis) 97 Hz (y-axis)732 µm × 591.7 µm40 VacDiameter (3.2 mm)
Rigid length (50 mm)
Lissajous scanning[63]
OCT based on 2D MEMS mirrorElectrothermal actuation1.25 Hz (fast scan actuator pair)
0.0125 Hz (longitudinal)
2.3 mm × 2.3 mm0–4 V ramp (fast scan)
0.5–3.5 V ramp (slow axis)
Diameter (5.8 mm)
Rigid length (12 mm)
Lissajous scanning[140]
Scanning fiber endoscope Piezoelectric tube5 kHz200 µm (in diameter)<20 VacDiameter (1.2 mm -1.7 mm)
Rigid length (9 mm)
Spiral scan pattern[55,64]
Multi-Photon Endoscope Piezoelectric tube35 Hz900 µm (in diameter)40 VacDiameter (5 mm) Rigid length (4 cm)Circular pattern[141]
OmniVision camera Chip on tip camera-364 µm × 364 µm3.3 Vac650 µm × 650 µm × 1158 µm-[142]
FCFM using CellvizioScanning mirrors at proximal end4 kHz160 µm × 120 µm ÷ 400 µm × 280 µm-350 µm ÷ 1.8 mm diameter 20 mm Rigid length-[23]
Scanning confocal microscopeElectrostatic torsional mirrors4.3 kHz (fast scan) 1.07 kHz (slow scan)100 µm (in diameter)20 V1.2 mm × 2.5 mm × 6.5 mmLissajous scanning[19,143]
Two-photon microscopeElectrostatically actuated mirrors1.08 kHz (fast scan) 0.65 kHz (slow scan)295 µm × 100 µm60 V2.0 cm × 1.9 cm × 1.1 cmRaster scanning[144]
Side view endomicroscopeElectrostatically driven mirror12 kHz (fast scan) 3 kHz (slow scan)350 µm × 350 µm60 Vpp2.4 mm (in diameter)Lissajous scanning[24]
Non-resonant MEMS scanner for OCTThin film piezoelectric50 Hz1 mm × 0.7 mm40 Vpp2.2 mm × 2.7 mmLissajous scanning[89]

