Abstract
The aerospace sector is one of the main economic drivers that strengthens our present, constitutes our future and is a source of competitiveness and innovation with great technological development capacity. In particular, the objective of manufacturers on assembly lines is to automate the entire process by using digital technologies as part of the transition toward Industry 4.0. In advanced manufacturing processes, artificial vision systems are interesting because their performance influences the liability and productivity of manufacturing processes. Therefore, developing and validating accurate, reliable and flexible vision systems in uncontrolled industrial environments is a critical issue. This research deals with the detection and classification of fasteners in a real, uncontrolled environment for an aeronautical manufacturing process, using machine learning techniques based on convolutional neural networks. Our system achieves 98.3% accuracy in a processing time of 0.8 ms per image. The results reveal that the machine learning paradigm based on a neural network in an industrial environment is capable of accurately and reliably estimating mechanical parameters to improve the performance and flexibility of advanced manufacturing processing of large parts with structural responsibility.
1. Introduction
Every day, the aerospace industry works on developing products with high added value that are subjected to the highest sustainability and efficiency demands in an increasingly demanding and competitive market [1,2,3,4].
During the transition toward Industry 4.0, digital technologies like artificial vision, augmented or virtual reality, big data and cybersecurity have aroused much interest in aeronautical manufacturing processes [4,5,6,7,8].
In the specific case of manufacturing and assembly lines for large structures, manufacturers aim to automate the entire process through adaptive robotic systems [9,10] which, together with vision and artificial intelligence systems, will make it possible to improve the plant’s efficiency and flexibility, and to reduce the associated cost per unit of aeronautical structures.
One fundamental part of referencing these processes is the detection and measurement of the parts in their real positions by artificial vision systems, which have been used in different industrial sectors [6,11,12,13,14,15]. Non-contact methods are being increasingly employed during aeronautical manufacturing processes as enabling technology in the fields of verification [6], metrology [7,10,13] and quality analysis [11] are implemented, both for their excellent inherent performance and the saved cost of accelerating production rates to meet production demands. However, their flexibility and reconfiguration must balance with accuracy and reliability to find suitable applications. Therefore, their use still remains a challenge for the aerospace industry.
In addition, another handicap of non-contact vision systems is that they work correctly under optimal and controlled operating conditions, but their performance decreases in the following scenarios: industrial environments with manufacturing and assembly processes, because of the diversity of objects used (drills, rivets, countersinks, etc.) and the acquisition of images in adverse environments, due to the presence of dirt (chips, oil drops, etc.) or incorrect lighting (shadows, changes in lighting, etc.). These problems entail image processing that can become computationally expensive, especially given the resolution required by images to obtain measurements with the best possible precision [13].
On the manufacturing and assembly lines of aircraft structures, non-contact vision systems are housed in the heads of machines and play a critical role in correct robot operation during inspections for roto-translation [16], inspection for redrilling [17] and for verifying inspections [18]. Our research used images of the vision systems of these three robot types.
Images obtained by vision systems can be identified and classified by disruptive technology, such as artificial intelligence [14,19,20,21], and machine-learning techniques specifically have been used widely in the industry to classify objects [6,7,8,13].
However, machine-learning systems are based on two different stages, in which users have to define the characteristics to be extracted. Thus, optimal network performance could be limited by the form of selection for characteristic vectors [22]. To overcome this difficulty, our study used convolutional neural networks (CNNs). Unlike conventional machine-learning systems, CNNs can perform feature extraction and recognition at the same time in a single network and, therefore, optimize the classifier’s performance [23].
CNNs have been applied to different sectors [24,25] and, although they have presented favorable results in the classification field, very few studies have been carried out in industrial applications for surface inspections [20] or for detecting defects [26]. To the best of the authors’ knowledge, artificial vision systems with CNNs have not been used to design or validate a classifier for aeronautical fastening elements on a manufacturing and assembly line of large parts with structural responsibility.
The objective of this study was to design and validate a neural network for the detection and classification of different referencing elements for aeronautical manufacturing processes in an industrial environment.
2. Materials and Methods
This section describes the dataset created and the convolutional network developed for classifying the referencing elements of an aeronautical manufacturing system.
In our research study, different languages and programming libraries were used to process images. The pre-processing of images and the generation of patches were carried out in C++ using the OpenCV computer vision library. This programming language was chosen for its efficiency and processing speed [27], given the large number of images to process.
The design of the neural networks, as well as their training and validation, was developed in Python, employing Keras and Tensorflow as frameworks, which are widely used libraries in the deep learning field [28]. Regarding the specific hardware, a GTX1070Ti GPU was utilized to accelerate the training and execution of neural networks. The entire system was implemented into robots as part of the aeronautical manufacturing process (Figure 1).
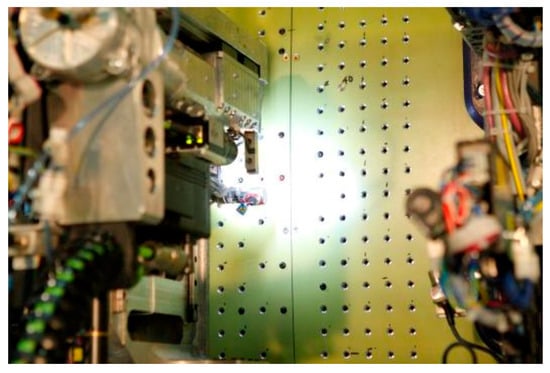
Figure 1.
Inspection system implemented into a robot of an aeronautical manufacturing line.
2.1. Preparing the Training Dataset
2.1.1. Raw Image Pre-Processing
Our study started with a set of 33,389 images captured by 12 different types of robotic machines, such as drilling, riveting and part position referencing machines. Given that the sets of images came from different machines, the condition and variability of the images, based on their typology and resolution, was not very homogeneous. Therefore, the first main challenge of this work was to convert this set of images into a structured and homogeneous dataset by a pre-processing stage (Figure 2).
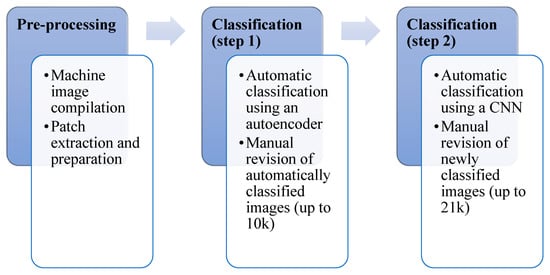
Figure 2.
Outline of the dataset preparation and revision process.
In the pre-processing stage (Figure 3), the set of images was processed by artificial vision algorithms, similar to those currently used in industrial applications. The detection and extraction of objects was carried out based on the following rules (defined according to the actual features of the referencing elements in the dataset):

Figure 3.
Pre-processing for patch extraction purposes.
- A thresholding operation was performed at 10 different gray levels to guarantee the extraction of all possible areas of interest.
- Next, an algorithm for extracting connected regions (blobs) was run on each binary image from the previous step.
- All the blobs with sizes less than 5% or bigger than 95% of the image were eliminated, as the referencing element would be the correct dimensions in the image. All those blobs whose aspect ratios (ratio between width and height, and their reciprocal) exceeded 1.20 were eliminated and, in turn, so were all the blobs contained in other blobs.
- Finally, the remaining blobs were analyzed by merging all those that overlapped one another. To determine if there was any overlapping between two blobs, the intersection on union value of their bounding boxes was calculated by merging all those blobs with an overlap value over 95%.
2.1.2. Defining Classification Categories
In aeronautical manufacturing, different types or classes of fixation and referencing elements can be used. These elements are defined by the manufacturing and assembly lines themselves. In our study, elements were categorized into eight different classes (Figure 4):
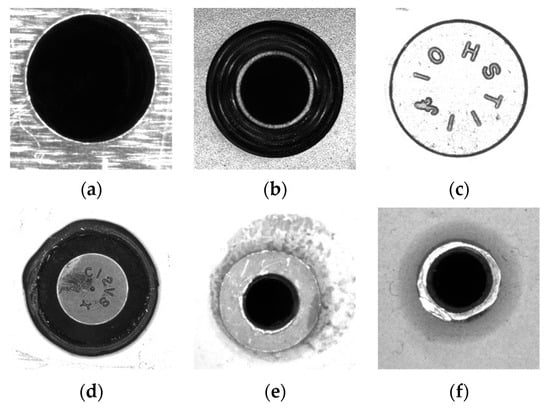
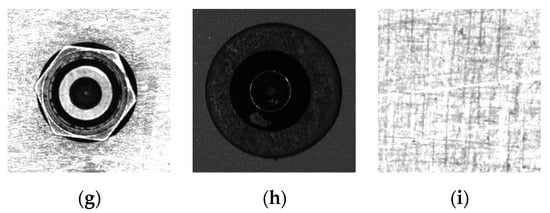
Figure 4.
Categories of referencing elements. (a) drill; (b) countersink; (c) rivet; (d) protruding rivet; (e) temporary fastener 1; (f) Temporary fastener 2; (g) hexagonal; (h) screw; and (i) background.
- Drill (D), which includes all the straight blind or through holes, with no countersink;
- Countersink (Cs), which includes holes with countersinks;
- Rivet (R), which includes rivets that are flush with the surface;
- Protruding rivet (PR), which includes rivets that protrude from the surface;
- Temporary fastener 1 (F1), the head of temporary fasteners, which will be drilled later to insert a rivet;
- Temporary fastener 2 (F2), the tip of temporary fasteners, which will be drilled later to insert a rivet;
- Hexagonal (Hx), a category that includes all objects that are hexagonal in shape;
- Screw (S), a category which includes screw images.
In addition to the eight categories defined by our process, an additional category, called the background (B), was defined to group the lack of referencing elements (Figure 4). This included all images corresponding to surface fragments, be they clean or stained with chips, oil or numbers.
2.1.3. Image Categorization and Dataset Construction
To construct the image library, it was necessary to categorize all the patches generated in the pre-processing stage. Manual sorting of such a large number of images can be time-consuming and tedious and, therefore, prone to possible human error. However, the scientific literature offers studies which have shown that validation or rejection through a binary option of a proposed classification is much faster and more reliable than conventionally assigning a category to the image [29]. To generate our classification, an automatic labeling algorithm based on an autoencoder-type neural network was designed, along with clustering algorithms [30].
The neural networks known as autoencoders are a type of neural network used in unsupervised training. The structure of the network resembles a double funnel in that, on the first network layers, information is compressed into layers of increasingly smaller sizes until a bottleneck is achieved, from which layers increase in size until they reach the original input size (encoder-decoder structure). This network is trained so that its output reconstructs the values entered in the input with the highest possible fidelity [31]. If the network has been successfully trained, we can deduce that it has been able to extract a series of main characteristics from the original image, with which it is able to reconstruct said image again at the output. By eliminating the decoder part of the network, a vector of characteristics is obtained for each image, which defines it with a much smaller number of dimensions than the original image.
Furthermore, the feature vectors extracted by the autoencoder were ordered with a clustering algorithm (k-means). This algorithm groups the vectors in a predetermined number of categories so that the variance of the points in the same category is minimized [32]. In our study, a set of points with 64 classes (k = 64) was analyzed, and they were subsequently and manually assigned to all of the nine previously defined categories. After assigning all of the images to categories, they were manually reviewed using a classification interface (Figure 4).
During a first iteration (Figure 2), 10,000 images were manually reviewed using the interface from this automatic labeling. The subsequent analysis of this iteration, based on the images whose categories were corrected during the manual review, revealed that the success rate of the automatic labeling was about 65%.
During a second iteration (Figure 2), the same images from the first iteration were used to train a generic CNN. This network was employed to generate new automatic labeling, with which 11,000 new images were manually reviewed. The subsequent review of this second labeling revealed a hit rate that came close to 90%.
Therefore, the total number of images reviewed and constituting our data set was 21,000.
2.1.4. Patch Classifier
The graphic interface for image classification, called Patch Classifier (Figure 5), was developed in HTML, PHP and JavaScript. The interface was designed following a responsive pattern for it to be accessed from all types of electronic devices.
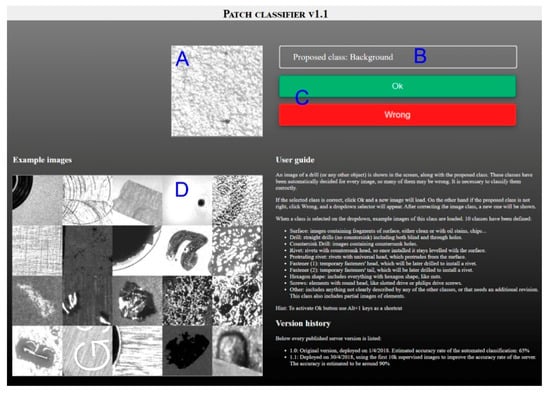
Figure 5.
Graphical interface for patch classification purposes. (A) the interface presented the patch image to be classified; (B) the category proposed by the automatic labeling algorithms; (C) it offered the user two options: accept the proposed label or reject it; (D) the application presented images of all the categories.
The interface presented the patch image to be classified (Figure 5A), together with the category proposed by the automatic labeling algorithms (Figure 5B). Then, it offered the user two options: accept the proposed label or reject it (Figure 5C). In addition, the application presented images of all the categories (Figure 5D) to help the user select the category that best fit the image to be classified (Figure 6). If the user selected the reject option, they could manually select the correct category. When the process finished, the interface automatically started labeling a new image.
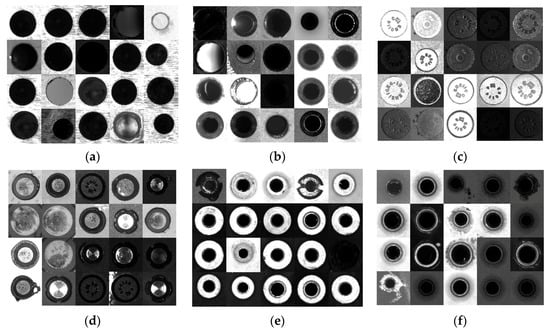

Figure 6.
Categorized images using the Patch Classifier interface, with (a) drill; (b) countersink; (c) rivet; (d) protruding rivet; (e) temporary fastener 1; (f) temporary fastener 2; (g) hexagonal; (h) screw; and (i) background categories.
2.1.5. Data Augmentation
From the created dataset, data augmentation techniques were applied to improve the training of the neural network by reinforcing its detection capacity and avoiding overtraining which, therefore, made the network capable of discerning between the spatial invariances and lighting inherent in the objects to be classified [33].
Regarding the spatial invariances of the objects to be classified, which had geometries of circular or hexagonal natures, it was possible to efficiently obtain several conceptually equivalent images from a single image; that is, it was possible with objects belonging to the same category, but completely different at the pixel level. Specifically, three rotations of 90°, 180° and 270° and two symmetries (vertical and horizontal) were applied to each original image. This process gave six samples. Therefore, the original 21,000 image dataset was extended to 126,000 images.
Regarding variations in the lighting conditions, such as by artificially modifying the brightness and contrast of the images, this data augmentation technique was not used because our set of images showed enough variability under these conditions.
2.2. Convolutional Neural Network
The classification neural network was designed and trained from scratch, following a convolutional network scheme with an architecture inspired by the LeNet family of neural models [34], known to achieve very good results during image classification tasks while maintaining a small network size. Our architecture design sought short execution times so they would have a minimum impact on the overall process time.
Our network (Figure 7) consisted of a 64 × 64 pixel input layer, which was connected to several stages of convolutional layers that were alternated with pooling layers. The output of the last convolutional processing stage was connected to a fully connected layer, which was directly connected with the nine outputs or categories of our system. These outputs were regularized following softmax distribution so that the output vector would resemble a probability distribution of belonging to each class (i.e., the sum of the nine outputs must always equal 1).

Figure 7.
Architecture of the developed neural network.
To improve the training results of the network and to avoid overfitting, the L2 regularization and dropout techniques were followed.
L2 regularization consists of a mathematical model, added in the training phase, that reduces overfitting by penalizing the appearance of high values in the weights of the neural network [21]. In our network, we applied a factor of 0.001 to convolutional layers.
Dropout is a technique based on omitting a certain percentage of the connections between layers during training to force the neural network to develop redundant connections by increasing robustness and reliability in the final classification [35,36]. In our network, we applied a factor of 10% on both the first and last layers.
Our dataset of 126,000 images was randomized and structured following a five-fold cross-validation scheme (Figure 8), where the set was split into five equal parts so that one of the portions would be used during each iteration to validate, and the remaining four would be used to train. Therefore, the training/test ratio was 80:20. This way, the category distribution influence on the training data could be analyzed.

Figure 8.
K-fold cross-validation.
The network was trained for 150 epochs using the Adadelta [37] optimizer and the categorical cross entropy loss function. Furthermore, class balancing weights were applied during training to reduce the differences between the number of images in each category.
3. Results
The training of our network showed a categorical accuracy for the validation set within the interval [94.5%, 96.5%] with an average of 95.7%. The accuracy, recall and F1-value were calculated on each defined category (Table 1). Moreover, the statistical distribution of the F1-values is shown in Figure 9. These values were averaged over the five iterations, and the confidence interval encompassed 95% of the samples (2-sigma).

Table 1.
Classification results over the validation set.
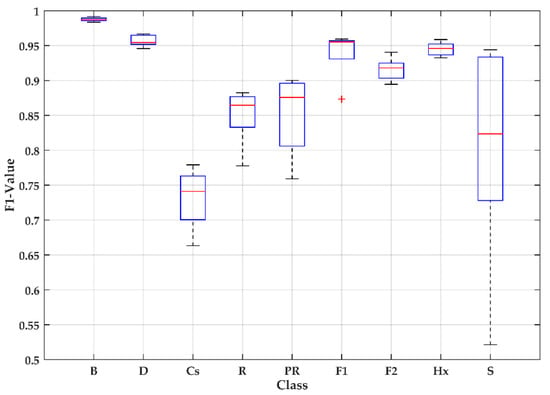
Figure 9.
F1-values for each category.
The confusion matrix, averaged across the five trials and normalized for each class (Table 2), presented a higher success rate for the background class (99.4%) and a lower success rate for the countersink class (62.9%). However, eight of the nine defined classes obtained success rates that came close to or above 70%.

Table 2.
Averaged and normalized confusion matrix.
The defined classes can be grouped into three more generic categories (Table 3). These categories are (1) background, (2) an empty hole including holes and countersinks, and (3) a filled hole encompassing the other referencing elements. With these classifications, success rates were obtained for the empty hole (98.3%) and full hole (88.5%) categories, and the success rate of the background class was maintained.

Table 3.
Confusion matrix for classifying empty and filled holes (normalized).
Finally, given that the main objective of our system was to detect the referencing elements of a manufacturing process, it was of interest to analyze the network’s effectiveness in the absolute terms of the detected objects without considering their category (Table 4), which obtained a success rate of 98.3% for the referencing items.

Table 4.
Global confusion matrix (normalized).
4. Discussion
The aerospace sector is one of the main technological and economic drivers that strengthens our present, constitutes our future and is a source of competitiveness and innovation with a huge capacity to catalyze talent, technological development and enormous power, transforming and generating new applications and services for our society’s welfare and progress. Specifically, the objective of manufacturers with manufacturing and assembly lines is to automate the entire process by using digital technologies as part of the transition toward Industry 4.0 [4,5,13,19].
Our research developed a detection neural network that analyzes and processes images in the most efficient way, simultaneously detecting and classifying all the fasteners that may be present during a manufacturing process in an industrial environment.
In the aerospace industry, artificial vision techniques, combined with machine learning, have been used to identify defects and problems associated with the wear of engine components [38], assess corrosion in metallic systems [39], measure large panels by 3D systems [8] and inspect automated wheels [4]. However, they have not been employed to classify fastening elements of large structures with structural responsibility because of the technological difficulties entailing their practical application to manufacturing processes in an industrial environment.
The results of this study suggest that the Patch Classifier software can successfully extract the characteristics of referencing elements. They also show that the convolutional neural network, programmed for classifying referencing elements, can obtain a success rate that comes close to or exceeds 70% in eight of the nine classes making up our network. If we consider the CNN in absolute element detection terms, the network’s accuracy is more than 98% in an industrial environment.
Our network presented sensitivities in all classes above 80%. In particular, it presented its best value (98.9 ± 1.6%) for the screws class (S) and its worst value (84 ± 14%) for the protruding rivet class (PR). The main differences between these two datasets are the geometry of the head of the fastening element and the proportion of both classes in relation to the total set of the validation sample. This suggests that these variables could influence sample specificity. However, our study did not exclude the possibility of other factors that could affect the network’s result, such as a certain degree of similarity between the classes of straight and countersink drills (Table 2).
The geometrical similarity in some of these classes was reflected in the network confusion matrix (Table 2). For the countersink and drill categories specifically, the matrix returned a value of 33.6%. Correspondingly, the matrix gave a confusion value of around 11% between the rivet and drill categories. This situation, however, did not occur between the hexagonal (Hx) category and other categories, as it presented a clearly different geometry. We believe that the poor accuracy in the countersink class (62.9 ± 15.5%) was due to these elements’ marked degree of similarity, particularly because of the circular shape. Therefore, this aspect could be considered a limitation of our study.
High confusion values were also present among the screw, drill, countersink and rivet classes. This was probably caused by fewer images being available in the dataset for this class. This situation did not occur after a category regrouping was proposed (Table 3 and Table 4), so we consider both these confusion values and the poor accuracy of this class (70.3 ± 44.2%) to have been caused by an imbalance in the dataset regarding this class. This could also be considered a limitation of our study.
In the aerospace industry, knowing if a hole is filled or empty based on subsequent machining operations during the manufacturing process is particularly interesting. This is why our classes were reorganized into three more generic categories (Table 3), with a success rate of 98.3% for the empty hole category and 88.5% for the filled hole category, respectively, while the success rate for the background class was maintained.
In absolute referencing terms, our results indicated high success rates, with a false-positive rate and a negative rate of 0.6% and 1.7%, respectively (Table 4). These results are similar to those presented by other authors who used CNNs for classifying defects in thermal images of carbon fiber [20,26]. To the best of our knowledge, this is the first time that a CNN has been used for the detection and classification of aeronautical fixation elements in an industrial environment in real time.
Finally, our development was integrated into the measurement software used on manufacturing and assembly lines, and it was carried out in such a way that it did not interfere with the current detection and measurement process. It was completed in an average classification time of 0.8 ms per patch and obtained an accuracy of 98.3%.
5. Conclusions
We have developed and validated a convolutional neural network for the detection and classification of fixation elements in a real, uncontrolled setting for an aerospace manufacturing process. Our system achieved a 98.3% accuracy rate.
Our results show that the machine-learning paradigm, based on neural networks and run in an industrial environment, is capable of accurately and reliably measuring fixation elements and thus improves the performance and flexibility of the advanced manufacturing process of large pieces with structural responsibility.
In future developments, the convolutional neural network architecture used herein will provide not only the categorization of referencing elements, but also be able to make decisions about aborting the manufacturing process if it locates an element that belongs to a category other than that specified during the process. Other applications of interest for this research in the aerospace sector entail the detection of defects on laminated carbon fiber parts in real time and in an industrial environment.
Author Contributions
Conceptualization L.R., M.T. and F.C.; methodology, L.R., S.D. and F.C.; software, L.R., A.G. and J.G.; validation, A.G., S.D. and J.M.G.; formal analysis, L.R. and F.C.; investigation, M.T., A.G. and J.M.G.; resources, M.T., A.G., S.D. and J.M.G.; data curation, L.R. and F.C.; writing—original draft preparation, L.R., S.D., M.T., A.G., J.M.G. and F.C.; writing—review and editing, F.C.; visualization, L.R. and F.C.; supervision, A.G., J.M.G. and F.C.; project administration, M.T., A.G., S.D. and J.M.G.; funding acquisition, M.T. All authors have read and agreed to the published version of the manuscript.
Funding
This publication was carried out as part of the project Nuevas Uniones de estructuras aeronáuticas reference number IDI-20180754. This project has been supported by the Spanish Ministry of Ciencia e Innovación and Centre for Industrial Technological Development (CDTI).
Conflicts of Interest
The authors declare no conflict of interest.
References
- Salomon, M.F.B.; Mello, C.H.P.; Salgado, E.G. Prioritization of product-service business model elements at aerospace industry using analytical hierarchy process. Acta Sci. Technol. 2019, 41. [Google Scholar] [CrossRef]
- Ibusuki, U.; Kaminski, P.C.; Bernardes, R.C. Evolution and maturity of Brazilian automotive and aeronautic industry innovation systems: A comparative study. Technol. Anal. Strateg. Manag. 2020, 32, 769–784. [Google Scholar] [CrossRef]
- Trancossi, M. Energetic, Environmental and Range Estimation of Hybrid and All-Electric Transformation of an Existing Light Utility Commuter Aircraft. SAE Tech. Pap. 2018. [Google Scholar] [CrossRef]
- Gramegna, N.; Corte, E.D.; Cocco, M.; Bonollo, F.; Grosselle, F. Innovative and integrated technologies for the development of aeronautic components. In Proceedings of TMS Annual Meeting; TMS: Seattle, WA, USA, 2010; pp. 275–286. [Google Scholar]
- Cavas-Martínez, F.; Fernández-Pacheco, D.G. Virtual Simulation: A technology to boost innovation and competitiveness in industry. Dyna (Spain) 2019, 94, 118–119. [Google Scholar] [CrossRef]
- Kupke, M.; Gerngross, T. Production technology in aeronautics: Upscaling technologies from lab to shop floor. In Comprehensive Composite Materials II; Elsevier: Amsterdam, Holland, 2018; Volume 3–8, pp. 214–237. [Google Scholar]
- Carmignato, S.; De Chiffre, L.; Bosse, H.; Leach, R.K.; Balsamo, A.; Estler, W.T. Dimensional artefacts to achieve metrological traceability in advanced manufacturing. Cirp Ann. 2020. [Google Scholar] [CrossRef]
- Bevilacqua, M.G.; Caroti, G.; Piemonte, A.; Terranova, A.A. Digital technology and mechatronic systems for the architectural 3D metric survey. In Intelligent Systems, Control and Automation: Science and Engineering; Springer: Cham, Switzerland, 2018; Volume 92, pp. 161–180. [Google Scholar]
- Gameros, A.; Lowth, S.; Axinte, D.; Nagy-Sochacki, A.; Craig, O.; Siller, H.R. State-of-the-art in fixture systems for the manufacture and assembly of rigid components: A review. Int. J. Mach. Tools Manuf. 2017, 123, 1–21. [Google Scholar] [CrossRef]
- Mei, Z.; Maropoulos, P.G. Review of the application of flexible, measurement-assisted assembly technology in aircraft manufacturing. Proc. Inst. Mech. Eng. Part B J. Eng. Manuf. 2014, 228, 1185–1197. [Google Scholar] [CrossRef]
- Wang, Z.; Zhou, Y.; Li, G. Anomaly detection for machinery by using Big Data Real-Time processing and clustering technique. In Proceedings of the 2019 3rd International Conference; ACM International Conference Proceeding Series (ICPS): New York, NY, USA, 2019; pp. 30–36. [Google Scholar]
- Rocha, L.; Bills, P.; Marxer, M.; Savio, E. Training in the aeronautic industry for geometrical quality control and large scale metrology. In Lecture Notes in Mechanical Engineering; Springer: Cham, Switzerland, 2019; pp. 162–169. [Google Scholar]
- Bauer, J.M.; Bas, G.; Durakbasa, N.M.; Kopacek, P. Development Trends in Automation and Metrology. IFAC Pap. 2015, 48, 168–172. [Google Scholar] [CrossRef]
- Elgeneidy, K.; Al-Yacoub, A.; Usman, Z.; Lohse, N.; Jackson, M.; Wright, I. Towards an automated masking process: A model-based approach. Proc. Inst. Mech. Eng. Part B J. Eng. Manuf. 2019, 233, 1923–1933. [Google Scholar] [CrossRef]
- Conesa, J.; Cavas-Martínez, F.; Fernández-Pacheco, D.G. An agent-based paradigm for detecting and acting on vehicles driving in the opposite direction on highways. Expert Syst. Appl. 2013, 40, 5113–5124. [Google Scholar] [CrossRef]
- Douglas, A.; Jarvis, P.; Beggs, K. Micropositioning System; Canadian Intellectual Property Office: Québec, QC, Canada, 2001. [Google Scholar]
- Baigorri Hermoso, J. Improved Automatic Riveting System; European Patent Office: Munich, Germany, 2005. [Google Scholar]
- Baigorri, H.J. System of Machining by Areas for Large Pieces; OEPM: Madrid, Spain, 2008. [Google Scholar]
- Wen, K.; Du, F. Key technologies for digital intelligent alignment of large-scale components. Jisuanji Jicheng Zhizao Xitong Comput. Integr. Manuf. Syst. C 2016, 22, 686–694. [Google Scholar] [CrossRef]
- Schmidt, C.; Hocke, T.; Denkena, B. Artificial intelligence for non-destructive testing of CFRP prepreg materials. Prod. Eng. 2019, 13, 617–626. [Google Scholar] [CrossRef]
- Schmidhuber, J. Deep learning in neural networks: An overview. Neural Netw. 2015, 61, 85–117. [Google Scholar] [CrossRef]
- Jordan, M.I.; Mitchell, T.M. Machine learning: Trends, perspectives, and prospects. Science 2015, 349, 255–260. [Google Scholar] [CrossRef]
- Lecun, Y.; Bengio, Y.; Hinton, G. Deep learning. Nature 2015, 521, 436–444. [Google Scholar] [CrossRef] [PubMed]
- Suzuki, K. Overview of deep learning in medical imaging. Radiol. Phys. Technol. 2017, 10, 257–273. [Google Scholar] [CrossRef]
- Pouyanfar, S.; Sadiq, S.; Yan, Y.; Tian, H.; Tao, Y.; Reyes, M.P.; Shyu, M.L.; Chen, S.C.; Iyengar, S.S. A survey on deep learning: Algorithms, techniques, and applications. Acm Comput. Surv. 2018. [Google Scholar] [CrossRef]
- Schmidt, C.; Hocke, T.; Denkena, B. Deep learning-based classification of production defects in automated-fiber-placement processes. Prod. Eng. 2019, 13, 501–509. [Google Scholar] [CrossRef]
- Prechelt, L. An empirical comparison of seven programming languages. Computer 2000, 33, 23–29. [Google Scholar] [CrossRef]
- Parvat, A.; Chavan, J.; Kadam, S.; Dev, S.; Pathak, V. A survey of deep-learning frameworks. In Proceedings of the 2017 International Conference on Inventive Systems and Control (ICISC), Coimbatore, India, 19–20 January 2017; pp. 1–7. [Google Scholar]
- Branson, S.; Wah, C.; Schroff, F.; Babenko, B.; Welinder, P.; Perona, P.; Belongie, S. Visual recognition with humans in the loop. In Lecture Notes in Computer Science (including subseries Lecture Notes in Artificial Intelligence and Lecture Notes in Bioinformatics); Springer: Cham, Switzerland, 2010; Volume 6314 LNCS, pp. 438–451. [Google Scholar]
- Song, C.; Huang, Y.; Liu, F.; Wang, Z.; Wang, L. Deep auto-encoder based clustering. Intell. Data Anal. 2014, 18, S65–S76. [Google Scholar] [CrossRef]
- Vincent, P.; Larochelle, H.; Bengio, Y.; Manzagol, P.-A. Extracting and composing robust features with denoising autoencoders. In Proceedings of the 25th International Conference on Machine Learning, Helsinki, Finland, 5–9 July 2008; pp. 1096–1103. [Google Scholar]
- MacQueen, J. Some methods for classification and analysis of multivariate observations. In Proceedings of the Fifth Berkeley Symposium on Mathematical Statistics and Probability, Statistics, Berkeley, CA, USA, 16 January 2008; Volume 1, pp. 281–297. [Google Scholar]
- Connor, S.; Taghi, M.K. A survey on Image Data Augmentation for Deep Learning. J. Big Data 2019, 6, 1–48. [Google Scholar] [CrossRef]
- Lecun, Y.; Bottou, L.; Bengio, Y.; Haffner, P. Gradient-based learning applied to document recognition. Proc. IEEE 1998, 86, 2278–2324. [Google Scholar] [CrossRef]
- Srivastava, N.; Hinton, G.; Krizhevsky, A.; Sutskever, I.; Salakhutdinov, R. Dropout: A simple way to prevent neural networks from overfitting. J. Mach. Learn. Res. 2014, 15, 1929–1958. [Google Scholar]
- Hinton, G.E.; Srivastava, N.; Krizhevsky, A.; Sutskever, I.; Salakhutdinov, R.R. Improving Neural Networks by Preventing Co-Adaptation of Feature Detectors; Cornell University: New York, NY, USA, 2012. [Google Scholar]
- Zeiler, M. ADADELTA: An adaptive learning rate method. arXiv 2012, arXiv:1212.5701. [Google Scholar]
- Lim, R.; Mba, D. Diagnosis and prognosis of AH64D tail rotor gearbox bearing degradation. In Proceedings of the ASME Design Engineering Technical Conference; The American Society of Mechanical Engineer (ASME): New York, NY, USA, 2013. [Google Scholar]
- Dursun, T.; Soutis, C. Recent developments in advanced aircraft aluminium alloys. Mater. Des. 2014, 56, 862–871. [Google Scholar] [CrossRef]
© 2020 by the authors. Licensee MDPI, Basel, Switzerland. This article is an open access article distributed under the terms and conditions of the Creative Commons Attribution (CC BY) license (http://creativecommons.org/licenses/by/4.0/).