Article

Analysis of Random Dynamics of Cell Segmented by a Modified Active Contour Method

1
Department of Biomedical Engineering, Yonsei University, Wonju, Kangwon 26427, Korea
2
Department of Biomedical Laboratory Science, Yonsei University, Wonju, Kangwon 26427, Korea
*
Authors to whom correspondence should be addressed.
Appl. Sci. 2020, 10(19), 6806; https://doi.org/10.3390/app10196806
Submission received: 3 September 2020 / Revised: 24 September 2020 / Accepted: 24 September 2020 / Published: 28 September 2020
(This article belongs to the Special Issue Biotechnology and Sports Engineering)

Abstract

:
To understand the dynamics of a living system, the analysis of particular and/or cellular dynamics has been performed based on shape-based center point detection. After collecting sequential time-lapse images of cellular dynamics, the trajectory of a moving object is determined from the set of center points of the cell analyzed from each image. The accuracy of trajectory is significant in understanding the stochastic nature of the dynamics of biological objects. In this study, to localize a cellular object in time-lapse images, three different localization methods, namely radial symmetry, circular Hough transform, and modified active contour, were considered. To analyze the accuracy of cellular dynamics, several statistical parameters such as mean square displacement and velocity autocorrelation function were employed, and localization error derived from these was reported for each localization method. In particular, through denoising using a Poisson noise filter, improved localization characteristics could be achieved. The modified active contour with denoising reduced localization error significantly, and thus allowed for accurate estimation of the statistical parameters of cellular dynamics.

1. Introduction

Recently, it has become an essential theme of biology to understand the dynamics of living systems, such as cell migration [1,2], embryogenesis [3,4], and transport of organelles within a cell [5]. Characterization of living organisms can be performed not only by measuring their biochemical properties, but also by analyzing their dynamic properties including trajectories, velocities, and diffusion coefficients. For example, cellular migration is caused by the dynamics of cytoskeletal proteins such as actin and microfilaments within the cell, which indicate that cellular biochemical properties can be correlated to dynamic properties of the cell [1]. Sometimes, the dynamics of intracellular organelles can be explained by analysis of deformation of a migrating cell [5]. However, since cells do not have ultrasmooth surfaces, and there is no ultrasensitive method to capture cell images, there always exist localization errors when analyzing cellular movement. Therefore, a highly sensitive method must be developed to remove unnecessary signals such as noise through advanced filtering or an advanced device to capture a spatiotemporally high-resolution image [6,7,8]. The spatiotemporal resolution of a dynamic target object is determined by its photo-physical properties, the signal to noise ratio, and the speeds of the moving objects [9].
Advancement of imaging techniques enables imaging of moving cells and macromolecules. Furthermore, with a live cell imaging system, which provides a controlled environment for cells under a microscope, it is possible to run a long-term experiment with living cells. The long-term recording of cell migration or macromolecules requires processing of a large number of time-lapse images. Tracking algorithms for analyzing such images have two types of errors, determinate (accuracy or bias error) and indeterminate (precision or standard deviation) [9,10,11]. Determinate errors are responsible for inaccuracies inherently caused by the algorithm, whereas indeterminate errors, which are caused by individual fluctuating random measurements, result from the noise of the image [9,12].
Single-particle tracking algorithms have been developed to localize particles with subpixel displacement [10,11,13]. A microscopic image of a point object appears as a diffraction pattern in that intensity distribution following the point spread function (PSF), which is radially symmetric and shows Gaussian distribution [12,14]. Direct Gaussian fitting of the intensity distribution is a superior algorithm in terms of both accuracy and precision [9]. First, the most common Gaussian fitting method for the measured PSF intensity profile is the nonlinear least squares algorithm [15,16]. The main principle of this algorithm is to search for parameters that minimize weighted squared errors between the fit and the data. Least squares fitting is accurate but is a very costly algorithm [17,18]. Second, while the maximum likelihood method is more accurate [19], Gaussian fitting requires much computational cost due to the large number of iterations and superfluous parameters like amplitude and width of the function necessary to locate the particle center [18,20]. Third, the radial symmetry method localizes the center of the PSF through only one linear matrix calculation. The radial symmetry method has been shown to be as accurate as Gaussian fitting and more rapidly calculable [18].
Alternatively, segmentation of the target image is also applicable to localize the cellular image. Edges of objects that have different intensities from the background can be detected using this method. Many different thresholding algorithms have been developed and applied to analyze the shapes of target images from grey scale images [21,22]. The simplest segmentation is intensity thresholding [23,24]. Despite its simplicity, intensity thresholding is difficult to apply to cell images due to poor contrast or the halo effect. Diverse segmentation approaches, such as template matching [25,26], watershed transformations [27,28], and deformable models [29,30], have been developed. However, to detect complex cell boundaries, several specific methods such as the level set method [31,32] and active contour [30] can be employed. Recently, time-lapse living cell data have been analyzed with deformable models considering the evolving contour of a cell from that in the previous frame [31,33].
The dynamics of cells or biological particles suspended in a solution are usually analyzed as a random process [2,31,32]. Based on accurate analysis of particle/cell trajectory, basic random process characteristics can be found using mean square displacement (MSD), which provides information regarding diffusion characteristics. It is well known that normal diffusion shows a linear relationship between MSD and time, and the slope of the linear fit is known as the diffusion coefficient (D). If linearity is disrupted, the process is called abnormal diffusion. When MSD tα and α > 1, the process is called superdiffusion. When MSD tα and α > 1, it is called subdiffusion [34]. The velocity autocorrelation function (VACF) can be employed to distinguish other mechanisms for abnormal diffusion [32,35].
To understand the random dynamic characteristics of particles or cells suspended in a solution, accurate localization of the object in a microscopic image is fundamental and significant. Clinically, it is important to discriminate the cellular type in diagnosis and therapeutics, since the therapeutic strategy and prognosis are strongly dependent on the cellular type [36]. In addition to this, ultimately, we are interested in the application of cellular dynamics to the discrimination of cell condition. For example, metastasis is known to be mediated by the circulating tumor cell (CTC) in the blood of the patient. Thus, it is important to find the specific cell type in the blood sample through simple method such as just observing the cellular dynamics to minimize the cost and time to detect. The method applied in this study could provide the accurate cellular trajectory so that it can be applied to the discrimination of different cellular types through the different cellular random dynamics. Specifically, the image of a cell is different from that of a particle in terms of appearance and intensity profile. Generally, the shape of a cell is more irregular and deformable than those of a particle, and the intensity distribution is noisier. The asymmetric shape and disturbed distribution of intensity might cause significant localization errors, which negatively impact analysis of the random variables estimated based on trajectory. Hence, in this study, we compared three localization methods, namely the radial symmetry algorithm, circular Hough transform method, and modified active contour method with denoising, to determine the most accurate way to localize cellular images. We employed stochastic parameters, such as MSD and VACF, to estimate the accuracy.

2. Materials and Methods

2.1. Cell Culture

MCF-7 cells were cultured in Dulbecco’s Modified Eagle Medium (DMEM, Lonza, Switzerland) supplemented with 10% (v/v) fetal bovine serum (FBS; Gibco, USA) and 1% (v/v) penicillin-streptomycin (Invitrogen, USA) and incubated at 37 °C and 5% CO2. For the Brownian motion experiment, cells were cultured in 6-well plates and, after 24 h, were detached by treatment with 0.25% trypsin EDTA (Gibco) for 5 min. After trypsinization, DMEM with 10% FBS inactivated the trypsin, and the cells were washed with experimental buffer (8.6% [w/w] sucrose, 0.3% [w/w] glucose, and 1.0 mg/mL bovine serum albumin) and re-suspended. Cells were diluted with buffer to 8 × 10⁴/mL to prevent interactions among them.

2.2. Measurement of Particle/Cell Random Motion

Diluted solutions containing 300 μL of particles or cells were dropped onto a sterile glass bottom chamber. On top of the dropped experimental solution, 1 mL of mineral oil was loaded to avoid vibrations from external effects and to prevent the solution from into the surroundings. Before capturing the Brownian motion, the cells suspended in the solution were stabilized for about 10 min, and the temperature was maintained at 22 °C to limit natural convection due to the temperature difference between the solution and the surrounding. The random motions of the cells were imaged at 40× magnification with a frame rate of 25 hz for 43.60 s, using a FASTCAM Mini UX 100 (Photron, Japan).

2.3. Particle/Cell Tracking and Random Dynamics Analysis

By cropping the image of 121 × 121 pixels, a single particle/cell trajectory was obtained for 43.6 s. To localize the center point of the particle/cell, three tracking algorithms were employed: the radial symmetric method [18], the circular Hough transformation method embedded in MATLAB 2017b [37], and the modified active contour method [38]. From the center point information obtained experimentally by the three localization methods, the two-dimensional MSD of the particle/cell was calculated as [34]
x 2 = 1 N τ t = 1 N τ ( x ( t + τ ) x ( t ) ) 2 = 4 D τ τ = 1 , ,   N 1
where r is the position vector of the cell at the ith time step, D is the diffusion coefficient, τ is the time lag, which is the time between two position vectors, from 1 to N 1 , and N is the total number of time steps. The experimentally measured trajectory possessed intrinsic noise, possibly originating from image noise. The measured position x ˜ ( t ) can be modelled as follows:
x ˜ ( t ) = x ( t ) + ε ( t )
where x ( t ) is the actual position, and ε ( t ) is the localization error caused by the noise, with ε ( t ) = 0 and ε 2 ( t ) = σ 2 . When Equation (2) is squared and ensemble-averaged,
x ˜ 2 ( t ) = x 2 ( t ) + σ 2 .
The experimentally determined MSD was fitted with Equation (3) using Origin Lab 9.0, and the localization errors were estimated for different particles/cells and different image localization methods, such as the radial symmetric method [18], circular Hough transform [36], and modified active contour.
The VACF, which represents the correlation of velocity vectors within one trajectory, was calculated for the velocity vectors obtained from the tracking methods as follows:
C δ ( τ ) = v ( t + τ ) · v ( t )
where v ¯ = 1 δ ( x ( t + δ ) x ( t ) ) is the cellular velocity, τ is the time between velocity vectors, and δ is the time between successive frames in the time-lapse images. Thus, multiple VACFs can be calculated according to δ value for a single-cell trajectory experiment.

2.4. Modified Active Contour

The active contour model is a method of detecting boundaries by expressing the properties of an image using the spline as an energy function with various forces governing the image and minimizing the energy function. As the function is minimized, it approaches the boundary line; thus, this method is widely used for detecting a boundary line of an image.
The energy of the active contour can be divided into internal energy, image energy, and external energy. The internal energy is that representing the characteristics related to the shape of the active contour and its fit to a smooth and gentle curve. Image energy is that of the image itself has and is the most important influence on internal movement of the active contour. Finally, external energy is related to external constraints, which allow the user to make subjective judgments and provides power to change the situation to move the active contour in the expected direction. The total energy of the active snake model is given by Equation (5) [30].
E T = 0 1 E i n t ( v ( s ) ) + E i m a g e ( v ( s ) ) + E c o n ( v ( s ) ) d s   , v ( s ) = ( x ( s ) , y ( s ) ) ,
where x and y are the coordinates of the two-dimensional curve, v is the spline parameter in the range 0~1, and s is a linear parameter [ 0 ,   1 ] .
During cell tracking, the parameters of the model obtained through analysis in the previous frame were used as the initial values for analysis of the current frame. Therefore, the setting of the initial mask has a crucial influence on boundary detection, and if an error occurs due to a change in a minor value, it is difficult to detect the desired boundary due to the large influence on the resultant image even if the error is small.
We present two methods to overcome the problems of the existing active contour model. The first is to automate the initial values of the active contour model. When the edge detection method is performed, the region where the change in brightness is large represents the boundary of the object, and the region where the brightness is not significant is the boundary surface. Therefore, if we detect only a region with large difference in brightness change value, the boundaries of the objects in the image can be extracted. The Sobel operation is one of the edge detection algorithms and uses a 3 × 3 size matrix [39]. In this method, the center of the matrix is set as a reference, and the center value of the image is compared to detect the change amount. The grayscale image is extracted by a 3 × 3 mask, and the result is computed horizontally and vertically to obtain the sum of the absolute values of the axes, finally recognizing the edges. Second, to improve the performance of boundary detection of the active contour, we adopt a method that ignores the difference in distance from the center of mass of the previous frame in the case of incorrect detection. Since the interval between frames is very short, there is no significant difference in the results of cell image tracking, even when ignoring the image in which the boundary detection is not performed.

3. Results & Discussion

3.1. Difference of Trajectory between cPMS Particles and MCF-7 Cells

Accurate measurement of the reference location of the targeted image is one of the most significant factors when analyzing random dynamics of nano/micro-sized objects. When the object is spherical and non-transparent, there are many traditional methods to find the center or reference point of the object. Unfortunately, our interest is not limited to a spherical hard sphere but is extended to cells or even proteins, which could have diverse irregular shapes and translucent features. Figure 1a,b illustrates representative two-dimensional intensity profiles of carboxylated polystyrene microspheres (cPMS, nominal dimeter 16.1 μm) and the MCF-7 breast cancer cell line, respectively. The diameters of cPMS and MCF-7 are estimated as 34.2 pixels and 32.8 pixels, corresponding to 15.39 μm and 14.76 μm, respectively. As shown in Figure 1a, at the center region of the particle, the intensity value reaches 255, which corresponds to the white center region of the particle image in the inset of Figure 1a, and the intensity sharply decreases like a Gaussian point spread function to below 50 as it extends to the edge of the particle. At the edge, a dark circle is formed. At the outside of the edge, a mildly bright circular band is shown, and the background noise around the particle is also observed in Figure 1a. On the other hand, as in Figure 1b, the intensity distribution of MCF-7 is quite different from that of cPMS. An irregular intensity distribution as well as the irregular shape of the cell are observed, even though an edge darker than the background intensity is also shown, like the intensity distribution of the particle edge. However, the intensity value is much higher than those of the cPMS edge, and the uniformity of the intensity along the cellular edge is much more irregular. At the outside of the cellular edge, a bright circular band and the background noise around the particle are also visible.
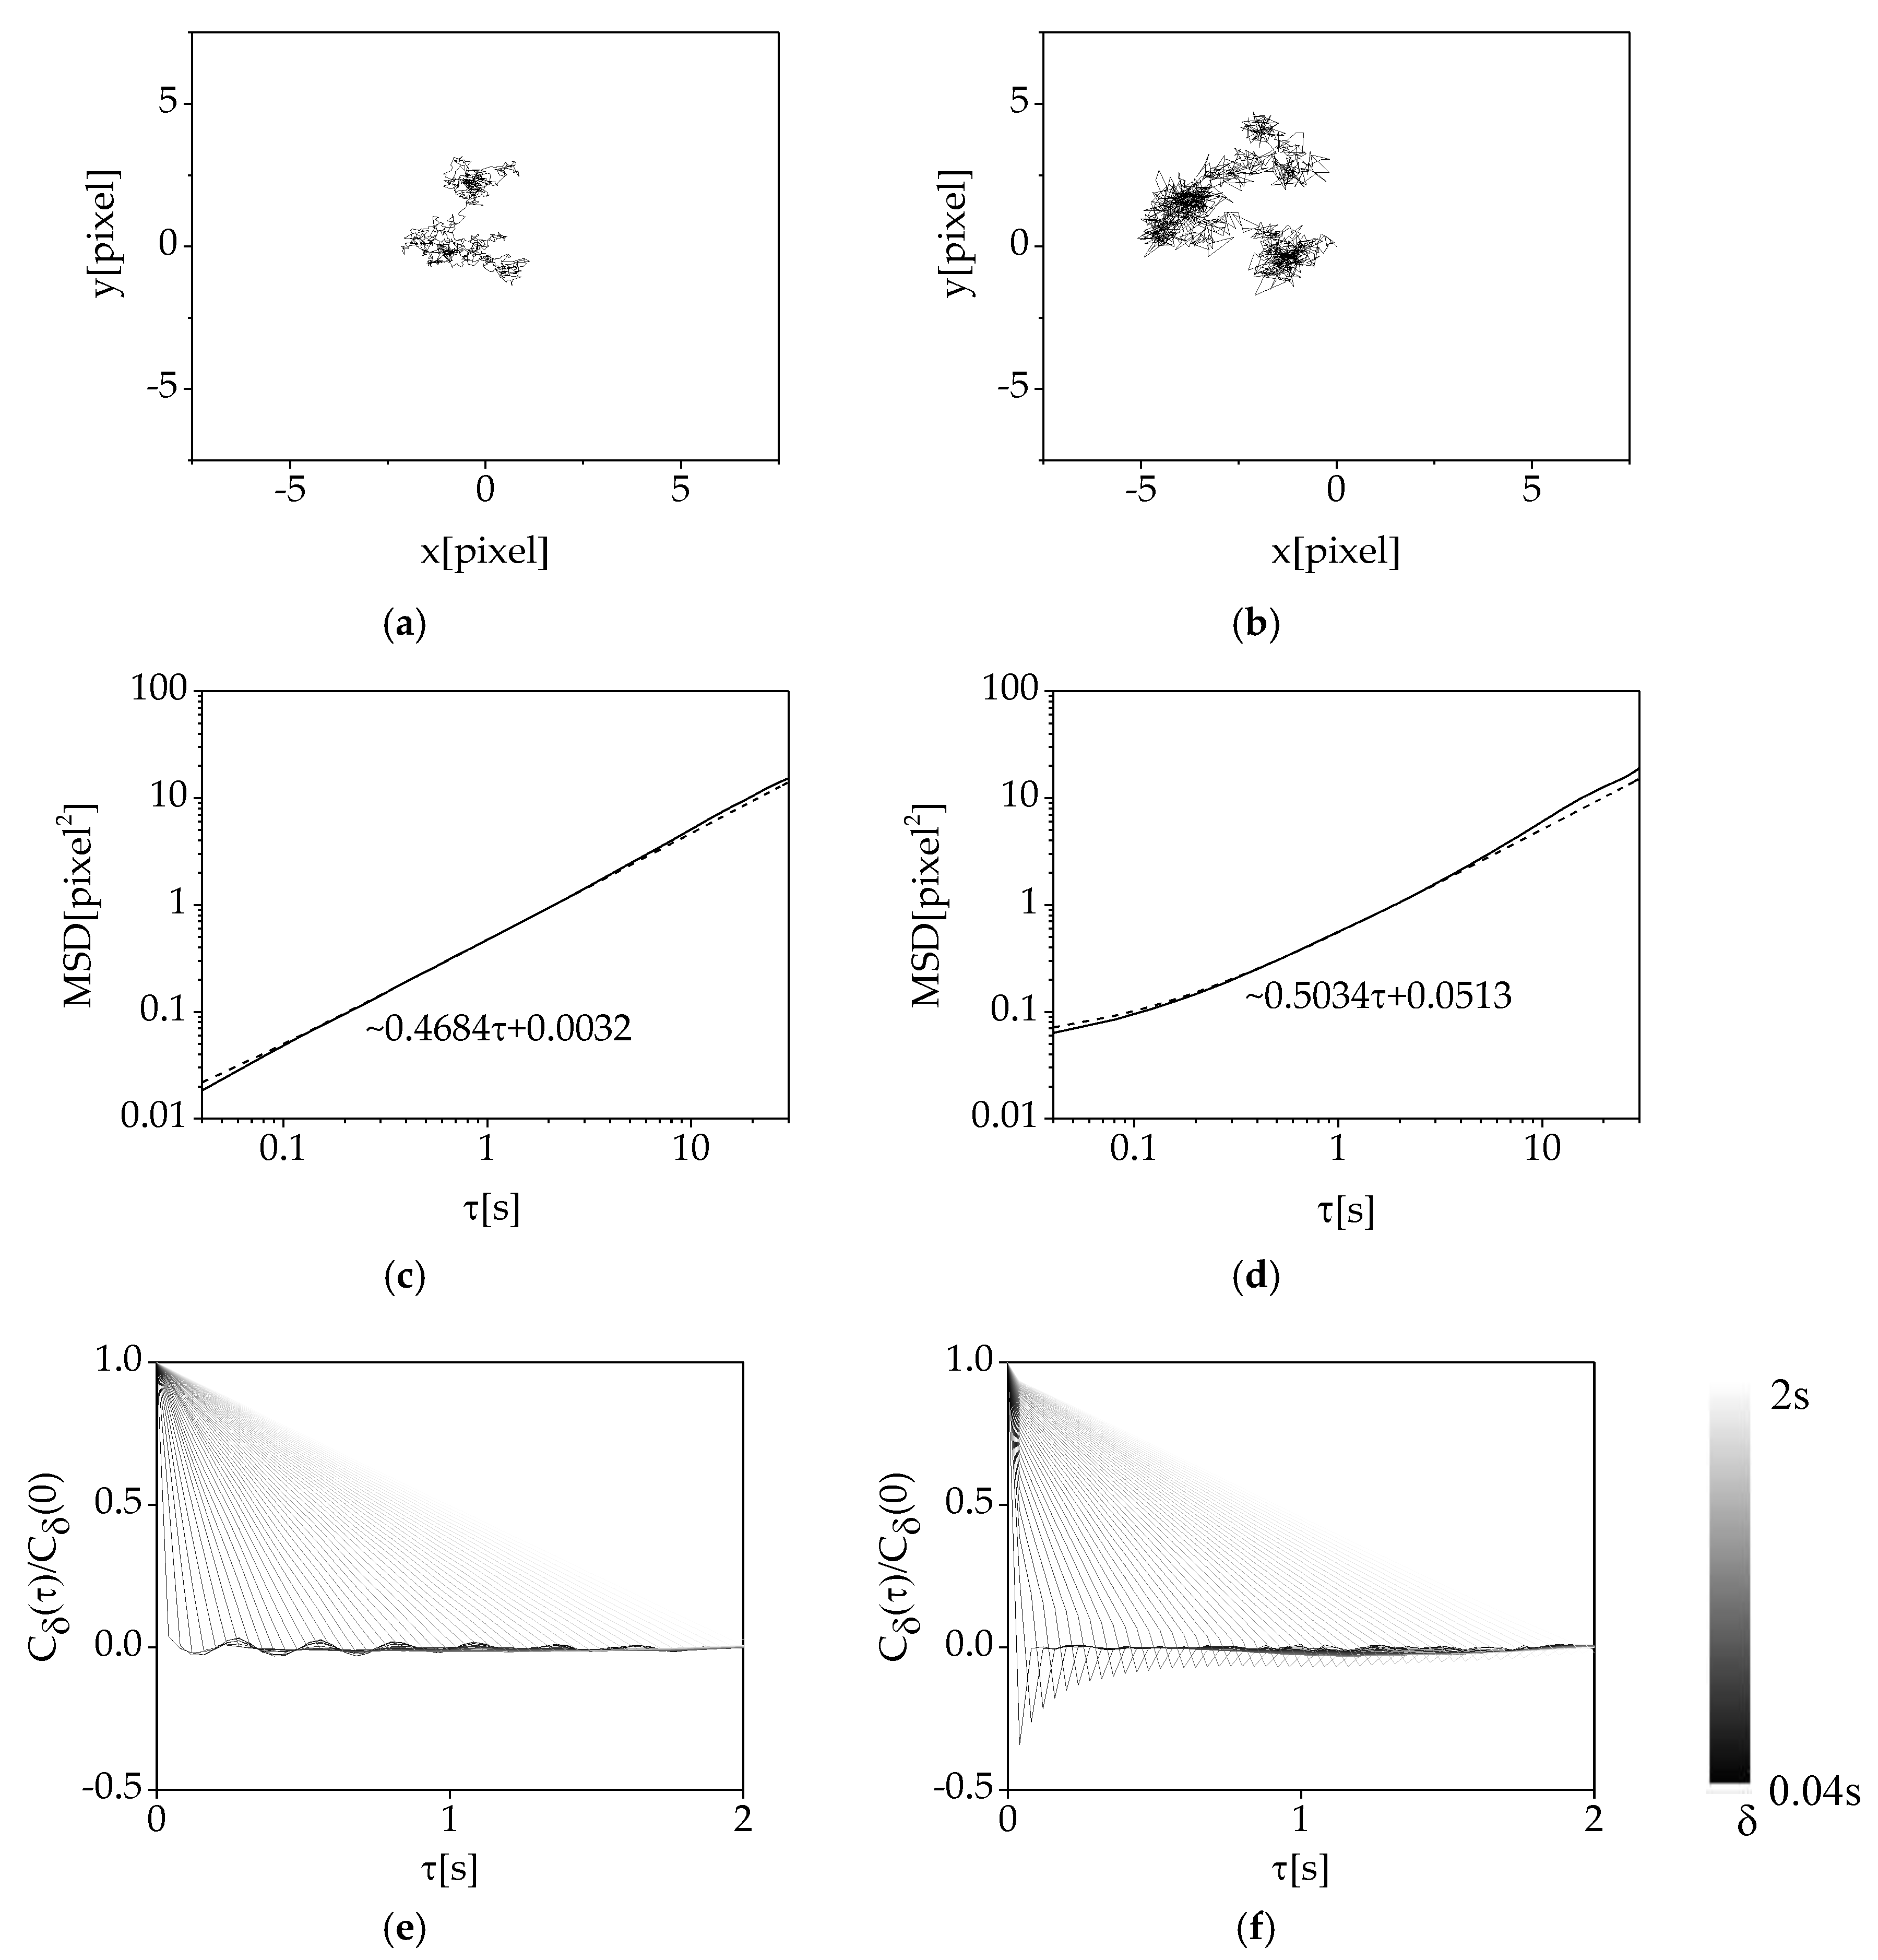
To understand the effect of intensity distribution and the uniformity of image, the comparison of random dynamics between cPMS and MCF-7 is performed. When particles or cells are suspended in a solution, they are continuously contacted by surrounding water molecules due to thermal energy. These interactions result in random motion of particles or cells, as shown in Figure 2a,b, which are the trajectories of cPMS and MCF-7, respectively, as analyzed by the radial symmetry localization method [18]. Both trajectories seem to be random, but there are definite differences between them. The MSD of cPMS in the log-log plot in Figure 2c is linear, while that of MCF-7 in Figure 2d shows nonlinear characteristics over a short time scale ( τ 1 s). Comparing the trajectories of cPMS and MCF-7 shows that overall displacement of the particle is much smaller than that of the MCF-7 cell in the experimentally smallest time scale ( Δ t = 0.04 s), and the movement of MCF-7 appears to change its direction sharply.
To characterize the differences in these two random processes, VACF-based analysis is performed, as shown in Figure 2e,f for cPMS and MCF-7, respectively. The VACFs are normalized to a value of τ = 0. A previous report showed that the VACF can provide useful information to distinguish effects on the random process, such as localization errors, confinement, and moderate elasticity. The VACF of the trajectory with localization error has a sharp negative peak over a short time scale, and the peak decays as time δ increases. In the case of confined conditions, the VACF decays quickly to zero after it reaches to −0.5 at τ = δ   [40]. The VACF of the cPMS is different from that of the MCF-7. The VACF of cPMS does not show a peak value for any δ , which indicates that the particle follows random dynamics. On the other hand, the VACF of the MCF-7 cell shows a peak distribution according to δ , which corresponds to the peak distribution with localization error, that is, a sharp leak over the short time scale and peaks decay as δ increases.
Following the error analysis in single-particle tracking [41], the MSD can be fitted using Equation (3) so that the mean localization error, σ = ε 2 ( t ) , can be estimated as a parameter of the degree of noise in position measurement. As shown in Figure 2c,d, σ c P M S 0.0566 and σ M C F 7 0.2265, which can be interpreted to signify that the analyzed trajectory of MCF-7 possesses approximately 5.4 times more localization error than that of cPMS. It also confirms that the VACF of cPMS follows random dynamics, whereas the VACF of MCF-7 shows a peculiar peak distribution depending on δ , possible evidence of localization error in the trajectory data. According to the results shown in Figure 2, localization of the cell requires a different approach to minimize localization error. Thus, in this study, a modified active contour method is introduced for analysis of cellular trajectory and random dynamics and is compared to other methods as follows.

3.2. Comparison of Image Analysis Methods

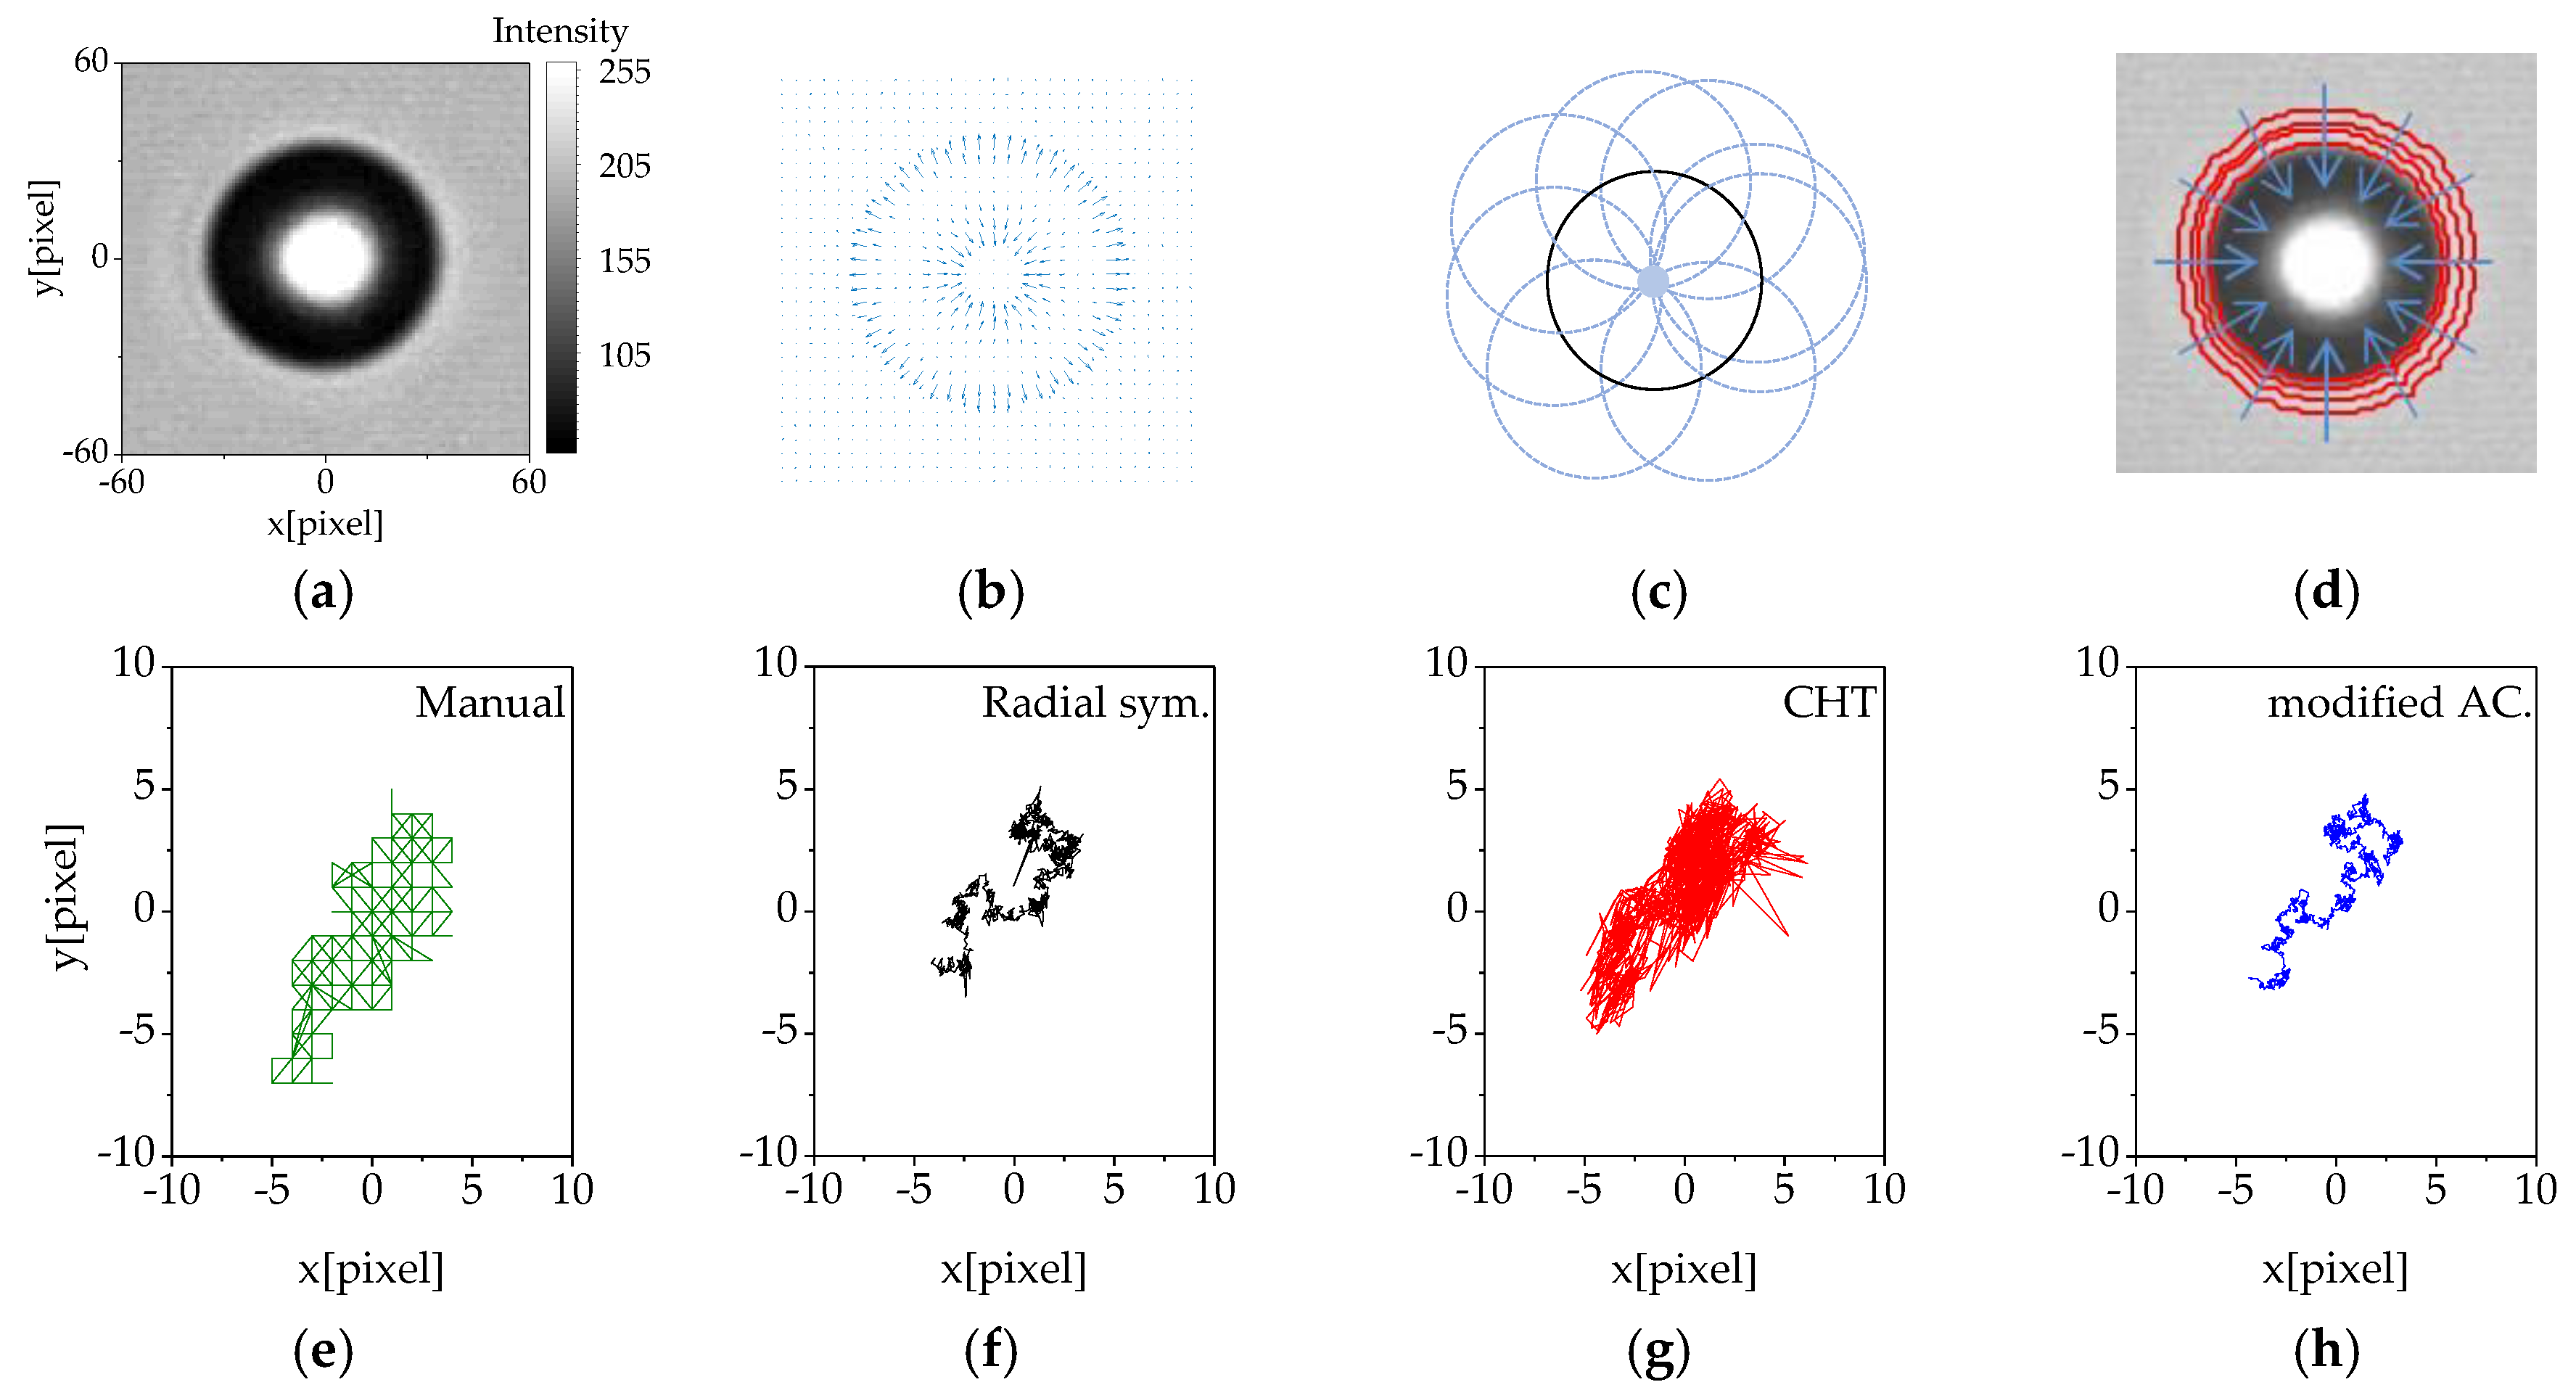
Before the discussion about random dynamics of particles and cells analyzed by the localization methods, we explain how each method detects the local point from the bright field microscopy image using the cPMS image. Figure 3a shows the intensity distribution of a cPMS image of 121 by 121 pixels, localized by three methods, namely radial symmetry [18], circular Hough transform [36], and modified active contour.
First, the radial symmetry method localizes the target image based on local intensity gradient. At the outset, it defines the midpoint of each grid in the entire image ( x k ,   y k )   [18]. At the defined midpoint, the intensity gradient across the grid is calculated. The whole intensity gradient of the cPMS image in Figure 3a is shown in Figure 3b. The intensity gradients have large magnitudes at the bright center region and at the boundary of the particle and point to the center point of the particle. The center point is that where the weighted sum of the distance to the lines of all midpoints is minimal. In the weighted sum process, the weighting factor is proportional to the magnitude of the intensity gradient, so that the longer vectors toward the center in Figure 3b have a greater effect in determining the center point than do the smaller ones. Radial symmetry is very useful when the resolution of the image is low or the target image is small. On the other hand, when the size of an image is so large that the intensity variation of the target image could possibly affect the overall intensity distribution, it could be treated as noise. Moreover, if the size of the target image was relatively so small that the background represents a large portion of the image, background noise could influence the overall intensity distribution.
Second, the circular Hough transform (CHT) embedded in MATLAB 2018b is used to characterize the center point of the circular particle. First, the peripheral edge of an object in the whole image is detected through an edge gradient threshold automatically chosen using the graythresh function, which determines the threshold that minimizes intraclass variance of the selected black and white pixels following Otsu’s method [42], embedded in MATLAB 2018b. On the determined edge in the image, the circular Hough transform considers and counts all circles on the expected circumference. Figure 3c shows possible candidates of the circle in the range of radii. The probable center point is the position of the maximum counting point. The circular Hough transform is simple in detecting circular objects with relatively strong edges. However, for a suspended cell, which is not perfectly circular and has an irregular shape, it is hard to automatically detect a strong edge.
Lastly, the modified active contour method is a segmentation technique with energy forces and constraints for discrimination of the pixels of interest from the image for further analysis. It does not depend on limited information because it considers the information obtained in the surrounding space as well as the brightness change in expressing the boundary part in the image, as shown in Figure 3d. This method considers the intensity of local edges obtained in the image to search for projected areas such as edges, lines, and subjective judgments in the image. In addition, it makes available a wider range of data by considering the internal relationship of the active contour. Since the conventional active contour method is sensitive to the initial boundary, we modified this method to overcome it. Thus, the proposed method is relatively robust in boundary conditions and performs cell tracking successfully.
To compare the effect on the trajectory of different localization methods, the representative MCF-7 cell trajectories of manual localization, radial symmetry, CHT and modified active contour are depicted in Figure 3e–h, respectively. When the manual localization is used, the position vector of cellular centroid is expressed only by integer number, since it comes from pixel of the image. Therefore, as shown in Figure 3e, the trajectory follows the integer point in the 2D plane. To accurately localize the position of cell, subpixel detection of particle/cell position is required. As shown in Figure 3f–h, it is possible to localize subpixel position using all of three different localization methods compared in this study. However, the resulting trajectory from three methods are quite different. It the next section, three different localization methods are compared through the analysis of random dynamics of MCF-7 cell.

3.3. Analysis of Cellular Random Motion by the Image Analysis Methods

By comparing the three methods, we concluded that the effect of localization error on particle position should be considered when the image of the cell is analyzed to localize the cellular position. Thus, to compare the effects of localization errors originating from the three image analysis methods, the trajectory of the MCF-7 cells and the MSD and VACF derived from that trajectory are depicted in Figure 4. Figure 4a–c are the trajectories of the MCF-7 cells (N = 36) analyzed by the radial symmetry method, circular Hough transform method, and modified active contour method, respectively. Comparing the three trajectories shows that, even though the trajectory computed by the radial symmetry method (Figure 4a) produces relatively decent trajectory results compared to that derived by the circular Hough transform method (Figure 4b), it still possesses a relatively large amount of localization error in comparison to the modified active contour method presented in Figure 4c.
To quantify localization errors associated with the three image analysis methods, log-log MSD plots of MCF-7 cells acquired by the radial symmetric method, circular Hough transform method, and modified active contour method are presented in Figure 4d–f, respectively, and the VACFs are shown in Figure 4g–i. Over a short timescale, a nonlinear MSD region is observed, and the time scale of nonlinear MSD is lengthened in the order of the modified active contour method, radial symmetry method, and circular Hough transform method. This is attributed to the characteristics shown in Figure 4a–c such that the trajectory analyzed by the circular Hough transform method is noisier than the other two methods, and the modified active contour method exhibits the least noise. In Figure 4d–f, the fitting results with Equation (3) are expressed along with the experimental results produced by the three methods. From the fitting results, the mean localization error, σ , associated with the radial symmetric method, circular Hough transform method, and modified active contour method is estimated as 0.2265, 0.7467, and 0.1153, respectively. As expected from the trajectory results in Figure 4a–c, the circular Hough transform has the largest mean localization error, the modified active contour has the lowest, and the radial symmetric method is in the middle. Figure 4d–f, which present the VACF results acquired by the three methods up to τ 2 s, show the same characteristics of the methods considered. For the radial symmetric method, the sharp negative peak appears at the smallest δ and decreases quickly. In contrast, for the circular Hough transform method, the diminishing rate of the peak value of VACF is much slower than that in the radial symmetric method. The modified active contour shows a very small negative peak relative to the other two methods, which indicates that it is associated with less noise than the others. To compare the trajectory difference according to the localization methods, the representative trajectories are presented in Figure 4j.

3.4. Effects of Denoising

Using the radial symmetric method, image analysis is performed not only for the cells themselves, but also for the background. To exclude the effects of the background noise in image analysis, a denoising process using a Poisson noise filter is applied before localization, as shown in Figure 5. After denoising, background noise is rarely seen, and the edge of the cell looks clear. Based on the denoised image, the trajectory, MSD, and VACF of an MCF-7 cell are acquired for the three localization methods, as shown in Figure 6. The effect of denoising is clearly seen in the trajectory calculated by the radial symmetric method when Figure 6a is compared to Figure 4a. Even though the circular Hough transform method depicted in Figure 6b and the modified active contour method in Figure 6c show differences from the trajectories in Figure 4b,c, the difference is not as large as that observed in the radial symmetric method. This can be quantitatively confirmed by the MSD data in Figure 6d–f. The curves are fitted using Equation (3), and the diffusion coefficient D and the mean localization error σ are shown in Table 1. From the diffusion coefficient of three methods, cells randomly move with 4D of ~0.5. The mean localization error of the radial symmetry method, circular Hough transform method, and modified active contour are reduced to 0.1292, 0.7117, and 0.1963, respectively. Specifically, the mean localization error by radial symmetry is reduced by 0.0973, from 0.2265 to 0.1292, while the circular Hough transform method and modified active contour method show a reduction in localization error by 0.0350 and 0.0090, respectively. As mentioned, the radial symmetric method considers the whole image including the noisy background, and the effect of background noise becomes significant when analyzing the intensity gradient. In other words, if denoising is applied to these images, the level of localization error caused by the radial symmetric method ( σ = 0.1292) can be reduced to the level of that caused by the modified active contour method without denoising ( σ = 0.1153). To compare the trajectory difference according to the localization methods after denoising, the representative trajectories are presented in Figure 6j.

4. Conclusions

The random dynamics of a cPMS particle and MCF-7 cell recorded at a frame rate of 25 hz were measured, and sub-pixel resolution analyses were performed using three localization methods, the radial symmetric method, circular Hough transform method, and modified active contour method. To understand the effects of different image analysis methods in localizing the position of a cell in an image for random dynamics analysis, the trajectory, MSD, and VACF of the measured objects were compared, and we found that the modified active contour method presented the smallest localization error compared to the other two methods considered. In addition, the effect of denoising on the stochastic dynamics of the MCF-7 cell was discussed for different image analysis methods.
An iterative fitting-based localization method has been used in single-particle tracking, where the considered particle size is on the order of a nanometer so that the image can be approximately modeled as a point spread function such as a Gaussian function. The radial symmetry method, however, determines a direction of center from every pixel by calculating the gradient of the point spread function at each pixel instead of using Gaussian fitting. When it is applied to the image of a nanosized object or of an object that is radially symmetric and has a clear gradient about the centroid, the radial symmetry method is appropriate for tracking. As shown in Figure 2 for cPMS, the radial symmetry method found the center of the cPMS and reported the MSD and VACF with little localization error, even though the size of the particle was on the micron scale. When studying cellular dynamics or migration, the size of the target object is on the micron scale; in our study, it was approximately 14.32 μm. Additionally, unlike a particle image, cellular images contain many irregular components such as non-circular shapes and small signal to noise ratios. Due to such weak radial symmetric properties, the radial symmetric method is not suitable for detecting the center point of a cellular image and has an enhanced likelihood of generating localization errors for algorithms detecting an object based on a circular shape. The localization error from the circular Hough transform method was the largest among the methods considered, as shown in Figure 4. The circular Hough transform method finds the center point, assuming that the object is circular. The non-circular shape of the cell and unclear edges of cell images can be major sources of localization errors. In addition to non-circularity, there are many dynamic noise sources in the interior of the cell. The morphology of the cell is inhomogeneous due to diverse cellular components such as the nucleus, ER, and mitochondria. As time elapses, these cellular components move freely within the cellular membrane. As discussed, both the radial symmetry method and the circular Hough transform method can be influenced by noise inside and/or outside of a cell; in particular, the radial symmetry method can be significantly influenced by background noise. Therefore, it could be useful to consider only the boundary of the cell for cellular localization in a dynamic cellular image. The modified active contour method employed in this study considers the boundary of the cell and calculates the center based on this boundary, decreasing the possibility of localization errors.
After the denoising process was applied to the bright field image, the boundaries of the cells became clear, and the cell outline detection was more effective than in the images without denoising. This preprocessing could reduce localization error through analysis of MSD and VACF, as shown in Figure 6. Thus, we conclude that it is helpful to employ a denoising process on a bright field image and/or to analyze the position using the modified active contour method to minimize the effects of localization error in cellular dynamics measurements.

Author Contributions

Conceptualization, S.Y.L.; methodology, J.Y.H., S.H., J.B., J.H., H.A., S.-H.W.; software, J.Y.H., S.H., J.B., J.H., H.A.; validation, J.Y.H. and S.Y.L.; formal analysis, J.Y.H. and S.Y.L.; investigation, J.Y.H. and S.Y.L.; resources, S.Y. and S.Y.L.; data curation, J.Y.H. and S.Y.L.; writing—original draft preparation, J.Y.H., S.Y. and S.Y.L.; writing—review and editing, S.W.L., Y.S.K., S.Y. and S.Y.L.; visualization, J.Y.H.; supervision, S.Y.L.; project administration, S.Y.L.; funding acquisition, S.Y.L. All authors have read and agreed to the published version of the manuscript.

Funding

This research was supported by the Basic Science Research Program through the National Research Foundation of Korea (NRF) funded by the Ministry of Education (NRF-2016R1D1A1A02937019), Republic of Korea.

Conflicts of Interest

The authors declare no conflict of interest.

References

  1. Gupton, S.L.; Anderson, K.L.; Kole, T.P.; Fischer, R.S.; Ponti, A.; Hitchcock-DeGregori, S.E.; Danuser, G.; Fowler, V.M.; Wirtz, D.; Hanein, D.; et al. Cell migration without a lamellipodium: Translation of actin dynamics into cell movement mediated by tropomyosin. J. Cell Biol. 2005, 168, 619–631. [Google Scholar] [CrossRef] [PubMed] [Green Version]
  2. Wu, P.-H.; Giri, A.; Sun, S.X.; Wirtz, D. Three-dimensional cell migration does not follow a random walk. Proc. Natl. Acad. Sci. USA 2014, 111, 3949–3954. [Google Scholar] [CrossRef] [PubMed] [Green Version]
  3. Hyman, A.A.; White, J.G. Determination of cell division axes in the early embryogenesis of Caenorhabditis elegans. J. Cell Biol. 1987, 105, 2123–2135. [Google Scholar] [CrossRef] [PubMed] [Green Version]
  4. Murray, J.I.; Bao, Z.; Boyle, T.J.; Waterston, R.H. The lineaging of fluorescently-labeled Caenorhabditis elegans embryos with StarryNite and AceTree. Nat. Protoc. 2006, 1, 1468–1476. [Google Scholar] [CrossRef] [PubMed]
  5. Koslover, E.F.; Chan, C.K.; Theriot, J.A. Cytoplasmic flow and mixing due to deformation of motile cells. Biophys. J. 2017, 113, 2077–2087. [Google Scholar] [CrossRef] [PubMed]
  6. Celebrano, M.; Kukura, P.; Renn, A.; Sandoghdar, V. Single-molecule imaging by optical absorption. Nat. Photonics 2011, 5, 95–98. [Google Scholar] [CrossRef]
  7. Kukura, P.; Celebrano, M.; Renn, A.; Sandoghdar, V. Single-molecule sensitivity in optical absorption at room temperature. J. Phys. Chem. Lett. 2010, 1, 3323–3327. [Google Scholar] [CrossRef]
  8. Wieser, S.; Schütz, G.J. Tracking single molecules in the live cell plasma membrane—Do’s and Don’t’s. Methods 2008, 46, 131–140. [Google Scholar] [CrossRef]
  9. Cheezum, M.K.; Walker, W.F.; Guilford, W.H. Quantitative comparison of algorithms for tracking single fluorescent particles. Biophys. J. 2001, 81, 2378–2388. [Google Scholar] [CrossRef] [Green Version]
  10. Rogers, S.S.; Waigh, T.A.; Zhao, X.; Lu, J.R. Precise particle tracking against a complicated background: Polynomial fitting with Gaussian weight. Phys. Biol. 2007, 4, 220–227. [Google Scholar] [CrossRef]
  11. Thompson, R.E.; Larson, D.R.; Webb, W.W. Precise nanometer localization analysis for individual fluorescent probes. Biophys. J. 2002, 82, 2775–2783. [Google Scholar] [CrossRef] [Green Version]
  12. Manzo, C.; Garcia-Parajo, M.F. A review of progress in single particle tracking: From methods to biophysical insights. Rep. Prog. Phys. 2015, 78, 124601. [Google Scholar] [CrossRef] [PubMed]
  13. Crocker, J.C.; Grier, D.G. Methods of digital video microscopy for colloidal studies. J. Colloid Interface Sci. 1996, 179, 298–310. [Google Scholar] [CrossRef] [Green Version]
  14. Liu, Z.; Lavis, L.D.; Betzig, E. Imaging live-cell dynamics and structure at the single-molecule level. Mol. Cell 2015, 58, 644–659. [Google Scholar] [CrossRef] [PubMed] [Green Version]
  15. Press, W.H.; Flannery, B.P.; Teukolsky, S.A.; Vetterling, W.T. Numerical Recipes; Cambridge University Press: Cambridge, UK, 1989. [Google Scholar]
  16. Shen, H.; Tauzin, L.J.; Baiyasi, R.; Wang, W.; Moringo, N.; Shuang, B.; Landes, C.F. Single particle tracking: From theory to biophysical applications. Chem. Rev. 2017, 117, 7331–7376. [Google Scholar] [CrossRef]
  17. Berglund, A.J.; McMahon, M.D.; McClelland, J.J.; Liddle, J.A. Fast, bias-free algorithm for tracking single particles with variable size and shape. Opt. Express 2008, 16, 14064–14075. [Google Scholar] [CrossRef]
  18. Parthasarathy, R. Rapid, accurate particle tracking by calculation of radial symmetry centers. Nat. Methods 2012, 9, 724–726. [Google Scholar] [CrossRef]
  19. Smith, C.S.; Joseph, N.; Rieger, B.; Lidke, K.A. Fast, single-molecule localization that achieves theoretically minimum uncertainty. Nat. Methods 2010, 7, 373–375. [Google Scholar] [CrossRef] [Green Version]
  20. Mashanov, G.; Molloy, J. Automatic detection of single fluorophores in live cells. Biophys. J. 2007, 92, 2199–2211. [Google Scholar] [CrossRef] [Green Version]
  21. Lee, S.U.; Chung, S.Y.; Park, R.H. A comparative performance study of several global thresholding techniques for segmentation. Comput. Vis. Graph. Image Process. 1990, 52, 171–190. [Google Scholar] [CrossRef]
  22. Sezgin, M.; Sankur, B. Survey over image thresholding techniques and quantitative performance evaluation. J. Electron. Imaging 2004, 13, 146–166. [Google Scholar]
  23. Demou, Z.N.; McIntire, L.V. Fully automated three-dimensional tracking of cancer cells in collagen gels: Determination of motility phenotypes at the cellular level. Cancer Res. 2002, 62, 5301–5307. [Google Scholar] [PubMed]
  24. Thurston, G.; Jaggi, B.; Palcic, B. Measurement of cell motility and morphology with an automated microscope system. Cytometry 1988, 9, 411–417. [Google Scholar] [CrossRef] [PubMed]
  25. Kachouie, N.N.; Fieguth, P.; Ramunas, J.; Jervis, E. Probabilistic model-based cell tracking. Int. J. Biomed. Imaging 2006, 2006, 012186. [Google Scholar] [CrossRef] [Green Version]
  26. Young, D.; Glasbey, C.; Gray, A.; Martin, N. Towards automatic cell identification in DIC microscopy. J. Microsc. 1998, 192, 186–193. [Google Scholar] [CrossRef] [Green Version]
  27. Nandy, K.; Gudla, P.R.; Amundsen, R.; Meaburn, K.J.; Misteli, T.; Lockett, S.J. Automatic segmentation and supervised learning-based selection of nuclei in cancer tissue images. Cytometry Part A 2012, 81, 743–754. [Google Scholar] [CrossRef]
  28. Wählby, C.; Sintorn, I.M.; Erlandsson, F.; Borgefors, G.; Bengtsson, E. Combining intensity, edge and shape information for 2D and 3D segmentation of cell nuclei in tissue sections. J. Microsc. 2004, 215, 67–76. [Google Scholar] [CrossRef]
  29. Delgado-Gonzalo, R.; Uhlmann, V.; Schmitter, D.; Unser, M. Snakes on a Plane: A perfect snap for bioimage analysis. IEEE Signal Process. Mag. 2015, 32, 41–48. [Google Scholar] [CrossRef] [Green Version]
  30. Kass, M.; Witkin, A.; Terzopoulos, D. Snakes: Active contour models. Int. J. Comput. Vis. 1988, 1, 321–331. [Google Scholar] [CrossRef]
  31. Dzyubachyk, O.; Van Cappellen, W.A.; Essers, J.; Niessen, W.J.; Meijering, E. Advanced level-set-based cell tracking in time-lapse fluorescence microscopy. IEEE Trans. Med. Imaging 2010, 29, 852–867. [Google Scholar] [CrossRef]
  32. Sethian, J.A. Level Set Methods and Fast Marching Methods: Evolving Interfaces in Computational Geometry, Fluid Mechanics, Computer Vision, and Materials Science; Cambridge University Press: Cambridge, UK, 1999; Volume 3. [Google Scholar]
  33. Yang, F.; Mackey, M.A.; Ianzini, F.; Gallardo, G.; Sonka, M. Cell segmentation, tracking, and mitosis detection using temporal context. In Proceedings of the International Conference on Medical Image Computing and Computer-Assisted Intervention, Palm Springs, CA, USA, 26–29 October 2005; pp. 302–309. [Google Scholar]
  34. Reif, F. Fundamentals of Statistical and Thermal Physics; Waveland Press: Long Grove, IL, USA, 2009. [Google Scholar]
  35. Saxton, M.J.; Jacobson, K. Single-particle tracking: Applications to membrane dynamics. Annu. Rev. Biophys. Biomol. Struct. 1997, 26, 373–399. [Google Scholar] [CrossRef]
  36. Hyun, J.; Kim, S.; Kim, D.; Choi, S.; Key, J.; Kim, Y.; Lee, S.; Lee, S. Comparison of the abnormal diffusion characteristics of tumor cells. Microfluid. Nanofluid. 2019, 23, 119. [Google Scholar] [CrossRef]
  37. Yuen, H.; Princen, J.; Illingworth, J.; Kittler, J. Comparative study of Hough transform methods for circle finding. Image Vis. Comput. 1990, 8, 71–77. [Google Scholar] [CrossRef] [Green Version]
  38. Xu, J.; Chutatape, O.; Chew, P. Automated optic disk boundary detection by modified active contour model. IEEE Trans. Biomed. Eng. 2007, 54, 473–482. [Google Scholar] [CrossRef] [PubMed]
  39. Kanopoulos, N.; Vasanthavada, N.; Baker, R.L. Design of an image edge detection filter using the Sobel operator. IEEE J. Solid State Circuits 1988, 23, 358–367. [Google Scholar] [CrossRef]
  40. Weber, S.C.; Thompson, M.A.; Moerner, W.; Spakowitz, A.J.; Theriot, J.A. Analytical tools to distinguish the effects of localization error, confinement, and medium elasticity on the velocity autocorrelation function. Biophys. J. 2012, 102, 2443–2450. [Google Scholar] [CrossRef] [Green Version]
  41. Savin, T.; Doyle, P.S. Static and dynamic errors in particle tracking microrheology. Biophys. J. 2005, 88, 623–638. [Google Scholar] [CrossRef] [Green Version]
  42. Otsu, N. A threshold selection method from gray-level histograms. IEEE Trans. Syst. Man Cybern. 1979, 9, 62–66. [Google Scholar] [CrossRef] [Green Version]
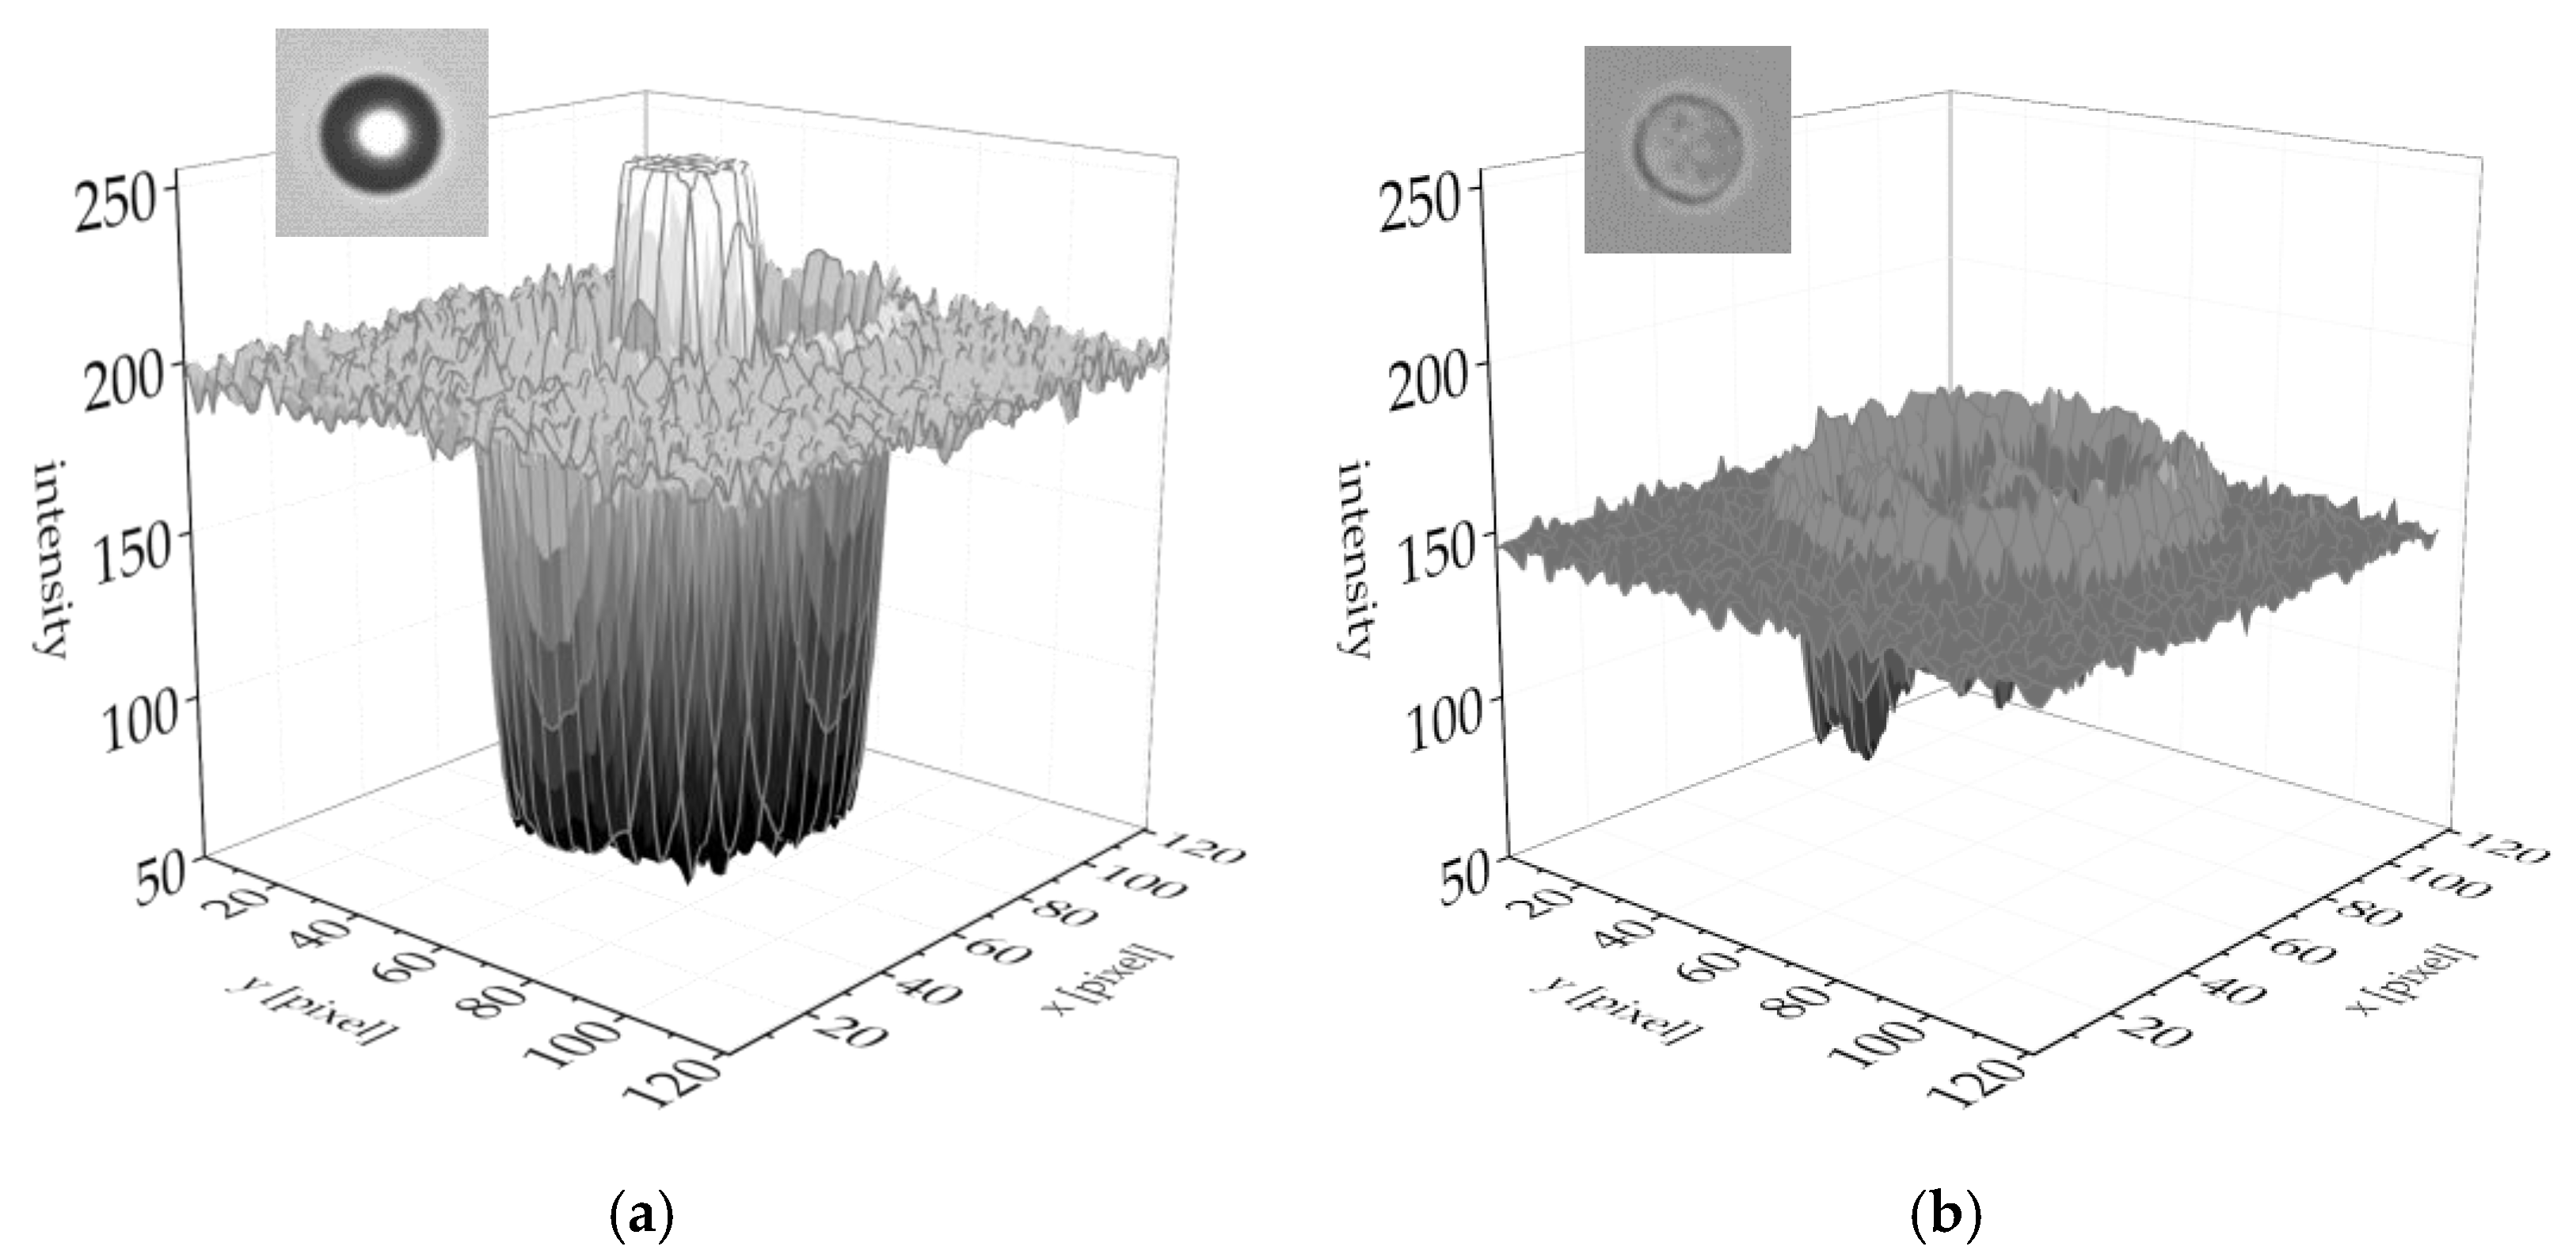
Figure 1. Intensity profiles of 2-dimensional bright field images of (a) carboxylated polystyrene microspheres and (b) the MCF-7 breast cancer cell line.
Applsci 10 06806 g001
Figure 2. Representative trajectories of random motion of (a) cPMS and (b) MCF-7 cells calculated using the radial symmetry method. The ensemble-averaged MSDs of (c) cPMS and (d) MCF-7 cells calculated from the trajectories and the VACFs of (e) cPMS and (f) MCF-7 cells, δ from 0.04 to 2 s (black to white).
Applsci 10 06806 g002
Figure 3. (a) The intensity distribution of a cPMS image. (bd) The illustration of the 3 different localization methods; (b) radial symmetry, (c) circular Hough transformation and (d) modified active contour method. (eh) The representative trajectory of MCF-7 cell using different localization method; (e) manual localization, (f) radial symmetry, (g) circular Hough transformation and (h) modified active contour method.
Applsci 10 06806 g003
Figure 4. Random dynamics of MCF-7 cells analyzed by the tracking methods. The (ac) trajectories, (df) MSDs, and (gi) VACFs δ from 0.04 to 2 s calculated by the radial symmetry, circular Hough transform, and modified active contour methods (N = 36). (j) The comparison of the representative trajectory achieved from 3 different localization methods.
Applsci 10 06806 g004
Figure 5. (a) A bright field image of MCF-7 cells and (b) the image after denoising.
Applsci 10 06806 g005
Figure 6. Random dynamics of MCF-7 cells analyzed by the tracking methods after denoising. The (ac) trajectories, (df) (dashed line) MSD for raw image and (solid line) MSD for denoised image, and (gi) VACFs (δ from 0.04 to 2s) calculated by the radial symmetry, circular Hough transform, and modified active contour methods (N = 36) (j) The comparison of the representative trajectory achieved from 3 different localization methods.
Applsci 10 06806 g006
Table 1. The diffusion coefficient D and the square of mean localization error σ 2 for the 3 different tracking method.
MethodRadial sym.CHTModified AC
RawDenoisedRawDenoisedRawDenoised
4D0.5030.5550.5540.5680.5450.550
σ20.0510.0170.5580.5070.0130.011