Abstract
(1) Background: The general use of food-processing facilities in the agro-food industry has increased the risk of unexpected material contamination. For instance, grain flours have similar colors and shapes, making their detection and isolation from each other difficult. Therefore, this study is aimed at verifying the feasibility of detecting and isolating grain flours by using hyperspectral imaging technology and developing a classification model of grain flours. (2) Methods: Multiple hyperspectral images were acquired through line scanning methods from reflectance of visible and near-infrared wavelength (400–1000 nm), reflectance of shortwave infrared wavelength (900–1700 nm), and fluorescence (400–700 nm) by 365 nm ultraviolet (UV) excitation. Eight varieties of grain flours were prepared (rice: 4, starch: 4), and the particle size and starch damage content were measured. To develop the classification model, four multivariate analysis methods (linear discriminant analysis (LDA), partial least-square discriminant analysis, support vector machine, and classification and regression tree) were implemented with several pre-processing methods, and their classification results were compared with respect to accuracy and Cohen’s kappa coefficient obtained from confusion matrices. (3) Results: The highest accuracy was achieved as 97.43% through short-wavelength infrared with normalization in the spectral domain. The submission of the developed classification model to the hyperspectral images showed that the fluorescence method achieves the highest accuracy of 81% using LDA. (4) Conclusions: In this study, the potential of non-destructive classification of rice and starch flours using multiple hyperspectral modalities and chemometric methods were demonstrated.
1. Introduction
Rice (Oryza sativa L.) is one of the staple food crops across the world, particularly in Asia. The steaming of the rice grain itself is a traditional cooking method in Korea; however, recently, various processed products using rice flour, such as cookies, breads, and noodles, have been gaining more interest among the population. To produce commercial-scale rice products, automatic quality and quantity evaluation systems are necessary. To evaluate the quality of rice products, determining the internal and external trait indices is very important. The internal trait indices include starch, protein, amino acid, and fat, and the external traits include shape, color, and defects in the grains. In particular, trait changes, such as shape, are bound to occur when the grains are ground, and even starch damage depends on the milling methods [1].
Optical-sensing techniques, including spectroscopic and imagery methods, have been applied to evaluate the quality of whole grains or their milled status [2,3,4,5]; this provides a fast, low-cost, and non-destructive alternative to the conventional methods. In addition, near-infrared (NIR) spectroscopy has been used as a convenient method for evaluating indices of rice traits, in particular, the protein and moisture contents. Furthermore, the near infrared (NIR) transmittance method, with wavelengths of 825–1075 nm, was applied to develop a rice-quality-assessment system for determining the average protein, moisture, and ratio of the sound kernel from the whole samples. The prediction accuracy for protein content in brown rice was calculated according to the coefficient of determination, R2 = 0.70, and standard error of prediction, SEP = 0.24%. Moreover, for rice flour, the prediction accuracy was calculated as R2 = 0.76 and SEP = 0.22% [5]. An image-processing method can detect and identify mixed samples based on their color and shape. However, as some flours are similar in color, their rapid identification and classification using color image-processing methods are difficult. Spectroscopic methods also have the potential to demonstrate quantitative and qualitative analyses of flour products; for example, insect-fragments detection is conducted in wheat flour by using NIR spectroscopic (NIRS) absorption in the wavelength range of 550–1700 nm [6]; protein content, such as gliadins and glutenins, in flours is measured using NIRS and predicted using partial least-square (PLS) method [7]. IR and NIR spectroscopies based on Fourier transform have also been used for chemical analysis of grain flours [8].
Hyperspectral imaging (HSI) is a non-destructive hybrid image-spectroscopic method, in which a line-scan or area-scan camera and a spectrometer are simultaneously used to acquire surface information of the target materials and spectral information, respectively. The HSI system obtains a 3D hypercube that consists of spatial and spectral data [9]. It is convenient to extract spectral data from the region of interest (ROI) in the image. Moreover, the model for classification using the pixels in the ROI can be applied to the measured hypercube to visualize the classified results. The HSI technology was introduced in 1985 and has been used for several decades in remote sensing for large-scale land-information measurement [10]. In the field of agro-food research, the HSI technology was adopted 20 years ago and consisted of a line-scan camera with a reflectance and fluorescence lighting system [11]. The HSI system has also been used for the detection and identification of flour adulteration [12], and examination of toxicity of aflatoxin B1 for corn [13], fungal growth on brown rice [14], seed viability, and classification of wheat kernels visibly damaged by insects [15]. Bardedo et al. (2018) successfully applied classification methods to detect and discriminate sprout damage in wheat kernels using NIR-HSI and the selected wavelengths (918 and 1411 nm) [16]. Gorretta et al. (2006) used NIR hyperspectral reflectance imaging (650–1100 nm) to determine the quality of durum-wheat kernels based on PLS discriminant analysis (PLS-DA) and reported 94% classification rate [17]. Mo et al. (2017) classified the geographical origin of white rice (Korea and China) by using visible and NIR (VNIR) HSI technology (400–1000 nm) and PLS-DA with several pre-processing methods as well as first and second derivatives [4]. Baek et al. (2019) selected discolored and visually diseased rice seeds through HSI within the 400–1000 nm wavelength range, and they applied several multivariate analysis methods, such as support vector machine (SVM), linear discriminant analysis (LDA), and quadratic discriminant analysis (QDA) methods. They reported that each prediction model shows over 92% accuracy according to the five pre-processing methods with respect to standard normal variate (SNV), normalization, and smoothing [18].
The objective of this study is to develop a classification model for multiple grain flours using multiple HSI modalities (VNIR, fluorescence, and short-wavelength infrared (SWIR)) in the ranges of 400–1000 and 900–1700 nm. The specific objectives of this study are as follows: (1) collect the multimodal hyperspectral images of grain flours by using three line-scan HSI modalities, and (2) develop a classification model for multiple grain flours using spectral data and apply the model to the hyperspectral images to differentiate grain flours.
2. Materials and Methods
2.1. Sample Preparation
In this study, eight grain flours (rice: 4, starch: 4) were purchased from a local commercial market in Korea, among which two (Mimyeon) were provided by the National Institute of Crop Sciences (Southern branch, Miryang, Korea). Three replicas were prepared of all the samples, and their particle sizes (μm) and the constituting damaged starch content (%) were measured using a laser-diffraction particle-size analyzer (LS13320, Beckman-Coulter, Inc. Brea, CA, U.S.A) and spectrophotometer (HALO XB-10, Dynamica Scientific Ltd. Livingston, UK), respectively (Table 1). The damaged starch content was measured according to method 76-31 by the American Association of Cereal Chemists and was calculated as follows: damaged starch content (%) = A510 × (150/AGS)/W × 8.1, where A510 is the absorbance at 510 nm, AGS is absorbance of glucose standard, and W is sample weight (mg). The damaged starch content is in the range of 0.3–7.4%, where the damaged content of rice flour accounts for more than 2.3%, whereas that for starch flours accounts for less than 2.1%. Most rice flours have 100% rice as their main ingredient; however, strong rice flours comprise rice content of 75.6% along with gluten, dextrin, and glucose. In this study, the starch samples were extracted from the original materials, with tapioca and sweat potato starch comprising maltodextrin and guar gum. The samples comprised weak rice flour (particle size: 54.44 ± 0.62 μm), Mimyeon (Milyang260), strong rice flour (63.12 ± 0.17 μm), tapioca starch flour (27.33 ± 0.24 μm), sweat-potato starch flour (16.79 ± 0.75 μm), chestnut starch flour (26.34 ± 0.25 μm), and mungbean starch flour (514.2 ± 12.89 μm). Among them, Mimyeon (Milyang260) was harvested in September 2018 from the rice pads of the National Institute of Agricultural Sciences (Jeonju, Korea). The harvested paddy rice was stored at 4 ℃ for 5 months, and then ground into powder using a grinder (NIAS, in-house manufactured). Mimyeon has two different particle sizes (128.3 ± 0.61 μm and 76.33 ± 1.02 μm), and thus two sample containers were used for their separate measurements.

Table 1.
Flour items attribute and particle size.
The sample flours were filled in the sample containers with dimensions of 5 cm × 5 cm × 2.5 cm (W × L × H) and then flattened. Three sample plates with the eight flours were prepared. The names of all the eight sample items are displayed beside each sample image. Each sample was named according to the column number from left, weak rice flour (WF, No.1), Mimyeon1 (MF1, No.2, 128 μm), Mimyeon2 (MF2, No.3, 76 μm), strong rice flour (SF, No.4), tapioca starch flour (TS, No.5), sweat potato starch flour (SS, No.6), chestnut starch flour (CS, No.7), and mungbean starch flour (MS, No.8), respectively.
2.2. Hyperspectral Imaging (HSI) Systems
To acquire HSI data, we used three modalities in the reflectance mode: fluorescence (420–730 nm at 365 nm excitation), VNIR (400–1000 nm), and SWIR (900–1700 nm). The method of acquiring fluorescence and VNIR hyperspectral data from the same imaging system is described as follows. For VNIR and fluorescence data, a line-scan camera creates an image of size, 310 × 502 pixels (MegaLuca, Andor Technology, Belfast, Northern Ireland), a hyperspectral imager with CMOS focal-plane array for VNIR wavelengths (VNIR Hyperspec, Headwall Photonics, Fitchburg, MA, USA) and linear motorized sample carrier (XSlide, Velmax, Bloomfield, NY, USA). The fluorescence HSI system comprises a UV-A (365 nm) LED lightning system (in-house product) for radiation emission (Figure 1a). The SWIR HSI system consists of an imaging spectrograph (HyperspecTM NIR, Headwall Photonics, MA, USA) covering a spectral range of 900–1700 nm (spectral resolution of 3.2 nm); an InGaAs focal-plane-array camera (640 × 512 pixels, Xeva-1.7-320, Xenics Infrared Solutions, Inc.; Leuven, Belgium), and a 25-mm zoom lens (OB-SWIR25/2, Optec SpA.; Parabiago, Italy). Figure 1b presents the images obtained through the HSI system.
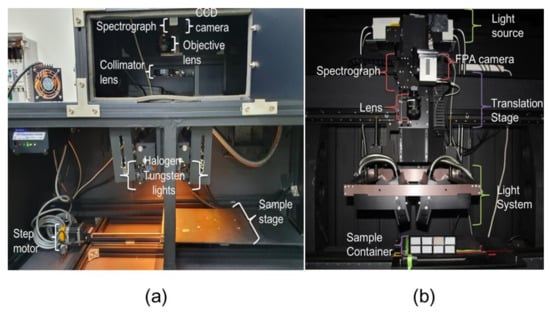
Figure 1.
Hyperspectral imaging system (a) visible and near-infrared (VNIR) and (b) short-wavelength infrared (SWIR) range. Camera system is stationary and sample holders move.
2.3. Data Acquisition and Calibration.
Multimode HSI systems are used to acquire continuous spectral images of the grain flours. In this present study, all imaging systems adopted the line-scan mode and the moving sample stage. The HSI data contain the spectral and spatial information of the target material. In addition, the acquired data are prone to noise from the environment and facility, and thus data classification was performed using dark and white references.
To calibrate reflectance images for robustness of image processing, the acquired original image (RO) must be corrected using dark and white references. The dark image (RD) with block reflectance was acquired with its opaque cap, whereas a Teflon plate (SRT-151, Labsphere, NH, USA) was used to acquire the white reference (RW) images. The calibrated image (RC) can be calculated as follows:
2.4. Region of Interest (ROI) Selection and Extraction of Average Spectrum
To build up a mask image, the calibrated image was used to find an optimal single band. The dimension can be reduced and data redundancy can be removed from the calibrated data to present suitable HSI and spectral data. Principal component analysis (PCA) is an unsupervised, linear data-reduction algorithm that can yield characteristic features by using score (scattering) and loading (coefficient) vectors. A line plot of the PCA coefficients represents the optimal bands of the molecular functional group [19].
By using the calibrated image, spectrum data of the flour samples were selected and extracted. Each modality image has a different size and spectral bands. The dimensions of VNIR, fluorescence, and SWIR images were 502 horizontal pixels × 520 vertical pixels × 125 bands, 502 × 520 × 65, and 640 × 520 × 224, respectively. The spectrum data were analyzed using PCA, and the loading and score vectors were plotted in the 2D space.
Figure 2 illustrates the ROI segmentation using SWIR hyperspectral images. Figure 2a presents the PCA score images, and Figure 2b,c present the line plots of the loading vectors (coefficient) of PC1 and PC2 and their corresponding peak images, respectively. A mask image was constructed using the histogram method, which implements the flour portion as one and background as zero (Figure 2d). The 10th band image (1016 nm) was selected to determine the optimal threshold to separate the ROI from the background (Figure 2e). The black and white mask images were constructed (Figure 2f), and they visually present the eight selected ROI regions as red rectangles (Figure 2g). The VNIR and fluorescence images also used the same procedure of mask construction by using the 10th band image (465 nm), and their threshold values from the histogram were calculated as 5000 and 120, respectively. By using the mask image, all images were segmented and the average spectrum of the identified flour regions was identified using the extracted spectral data as a representative of each modality. A total of 93,118 SWIR data were used for the development of the classification model; these were divided into training (N = 46,559) and testing (N = 46,559) data for calibrating and validating the model. The developed model was compared to accuracy (A) and Cohen’s kappa coefficient (K) based on confusion matrix [3]. Cohen’s kappa coefficient ranges from 0 to 1; the closer it is to 1, the better is the classification result based on the following calculation: , where is the observed accuracy and is the chance agreement. Figure 3 depicts the flowchart of the development of the data processing and prediction model. Finally, we obtained a full spectra matrix comprising VNIR, fluorescence, and SWIR images of 75,308 samples × 125 bands, 76,886 samples × 65 bands, and 93,118 samples × 224 bands, respectively.
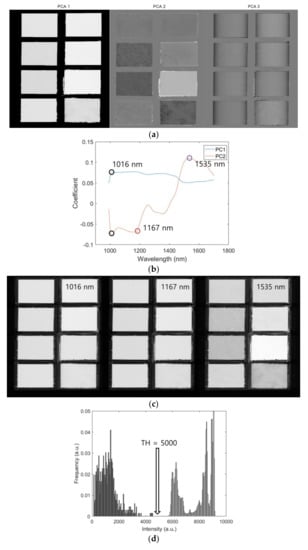
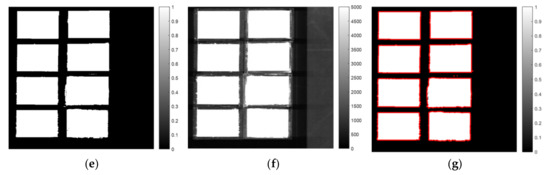
Figure 2.
SWIR range mask making schematic based on principal component analysis (PCA) loading vector. Three PC images from PC1 to PC3 (a), loading vectors of PC1 and PC2 (b), peak images of 1016 nm (10th), 1167 nm (57th) and 1535 nm (172th), respectively (c). The threshold value of 5000 was selected based on 1016 nm image (d) and mask (e) from 1016 nm image (f) and boundary as red line (g).
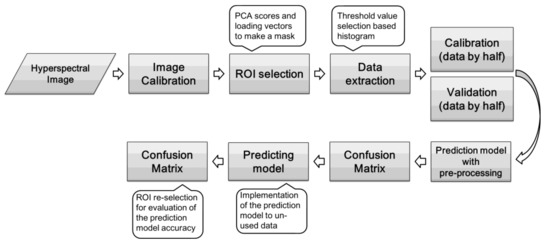
Figure 3.
Schematic flowchart of data processing.
The PCA allowed us to obtain the representation of the multivariate information, and it was used for dimensional reduction without supervision. In this study, PCA was used for selecting an optimal wavelength for classification of the grain flour samples. By using the extracted full spectra matrix of each modality, we could obtain the PCA results, as shown in Figure 4. The PCA results of VNIR and SWIR indicated that mungbean starch (MS, gray color) covered other samples on each PC combination (Figure 4a,c). In contrast, the fluorescence images of the two PC spaces showed distinguishable clusters (Figure 4b). In the space of PC1 and PC2 for fluorescence range, the grain flour sample clusters were observed to be separate from each other; the proportion of the variance explains by the PC1was 71% and PC2 was 26%. VNIR and SWIR demonstrated the proportion of the variance from PC1 and PC2 as 91%, 8% and 65%, 19%, respectively.
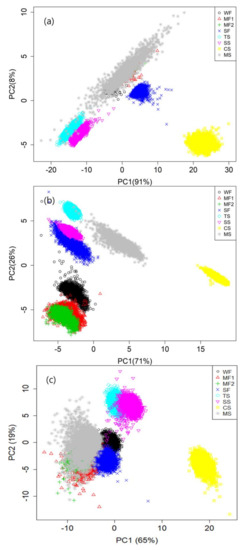
Figure 4.
Eight flour items on PC1 and PC2 space of VNIR (a), fluorescence (b), and SWIR (c). As an example, fluorescence spectral data (b) performs PC1 has 71% proportion of the variance explanation power and PC2 has 26%.
2.5. Spectral Data Analysis
The line-scan hyperspectral images could contain noises due to the electromagnetic spectrum characteristics, and these are generally caused by environmental interferences, such as defects in the camera or the spectrograph itself or due to mechanical attributes. To remove redundant noise and suitably perform HSI on the data, a noise detection and removal algorithm was implemented. In this study, the authors used several preprocessing methods, such as normal scattering correction (MSC), normalization (between −1 and 1), first and second derivative algorithm (D1 and D2), and moving average (MA) [20]. MSC is based on the distance between ideal and measured spectra, where the mean spectrum is usually used as the ideal spectrum. The D1 and D2 methods based on the Savitzky–Golay algorithm use the window size of 11 and a quadratic filter. MA is a standardization method that uses the average value of the mean and left and right values. Normalization performs data normalization based on (Xi-M)/sqrt(sum(Xi-M)2), where, Xi means input data and M is mean of the data. More details about the preprocessing methods and their application can be referred from the article by [21]. Furthermore, multivariate analysis methods, such as LDA, PLS-DA, SVM, and classification and regression tree (CART), along with several of the preprocessing methods were used to develop a classification model, and their classification results were compared. The accuracy of the developed prediction model was measured and compared with that of the confusion matrix method based on accuracy (A) and kappa coefficient (K). The whole image-processing procedure was performed in Matlab (R2016a, The MathWorks Inc.; Natick, MS, USA) and spectral data analysis was performed using free software for statistics, R (ver. 3.6.2, R Foundation for Statistical Computing, Vienna, Austria)
3. Results
3.1. Reflectance Spectral Characteristic
As shown in Figure 5, the three single-band images display the peak band of three modalities to generate patterns of a grain flour image based on each imaging type. Single-band images of the peak wavelength obtained from the multimode HSI system show color (Figure 5a), SWIR, VNIR, and fluorescence, images in the 1060 nm (Figure 5b), 959 nm (Figure 5c), and 518 nm ranges (Figure 5d) according to loading vectors, respectively. The eight grain flours show similar surface colors except No. 7 (CS) in VNIR and SWIR, whereas fluorescence images show more dynamic and significant surface colors according to rice or starch flours.
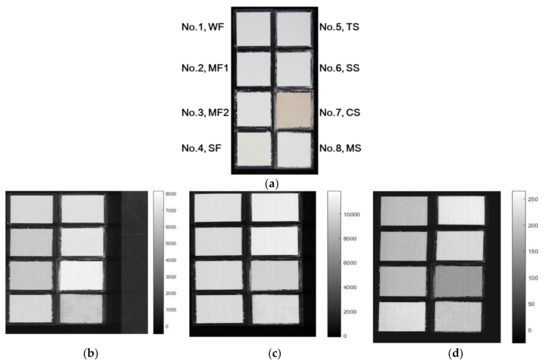
Figure 5.
Three mean spectra of hyperspectral imaging modalities and its peak wavelength images. Color image of one of samples (a), SWIR is at 1061 nm (b), VNIR at 959 nm (c) and fluorescence at 518 nm (d).
3.1.1. Visible and Near-Infrared (VNIR) HSI
The mean VNIR reflectance spectra of eight grain flours were obtained from the calibrated hyperspectral images, as shown in Figure 6a. The figure shows that the overall trends of the reflectance spectra of the selected flour samples. Among them, the chestnut starch (CS, yellow line) shows relatively broad and strong absorption curves between 400 and 700 nm and peaks at approximately 525 and 551 nm. The maximum peak was observed at approximately 550 nm, and visible bands were observed in the ranges of 500–565 nm, 565–590 nm, and 620–740 nm related with the green, yellow, and red absorption wavelengths, respectively. The absorptions at wavelengths of 617, 656, and 681 nm show the presence of anthocyanin and carotenoids pigments [22,23]. As observed in Figure 6a, the CS flour shows more dark than other items, and two peaks were measured around 500–600 nm. The bands between 500 and 600 nm indicate different peaks for different grain types, i.e.; peaks can be observed for strong flour (SF) at 496 nm, and for tapioca starch (TS) and sweat-potato starch (SS) at 520 nm. Absorptions were also measured around 760 nm and between 900 and 1000 nm. In the range of VNIR bands (400–1000 nm), we observed the spectra of the chemical information of rice ingredients, such as carbohydrate, protein, amylose, and moisture, which are related to the third overtone absorption of C–H (880 nm) and second overtone absorption of O–H (750–900 nm) and N–H (962–1000 nm) [24,25].
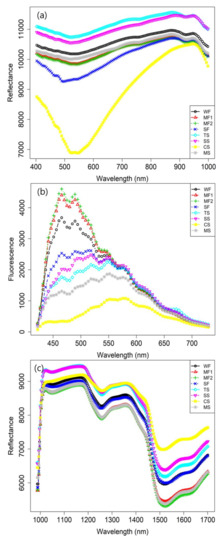
Figure 6.
Mean spectra of VNIR (a), fluorescence (b) and SWIR range (c) of eight grain flours’ data.
3.1.2. Fluorescence HSI
The fluorescence HSI system was used to obtain the fluorescence images for the eight flours (400–700 nm), and its mean spectrum is shown in Figure 6b. Through the wavelength range of the fluorescence excitation, several peaks were measured at approximately 446, 465, 489, 518, 547, 580, 623, 671, and 714 nm. Among them, the peaks at 465 and 489 nm predominantly comprised information of rice flours (WF, MF1, and MF2), whereas starch flours showed relatively strong excitations at approximately 465, 489, 518, and 547 nm. Chestnut starch showed relatively low excitation intensity than the other flour samples.
3.1.3. Short-Wavelength Infrared (SWIR) HSI
Figure 6c illustrates the SWIR image (1000–1700 nm) used for the classification of multiple flours along with its mean plot. In the 1500–1700 nm range, strong absorptions were observed, along with peaks at approximately 1520 and 1640 nm, particularly for the rice flours. Starch is a major carbohydrate reserve and a homopolysaccharide made up of glucose, and mainly consists of amylose (20–30%) and amylopectin (70–80%) [26]. The spectral data between 1400 and 1600 nm, particularly at 1414 nm, is related to the first overtone of water and the following hydroxyl groups: O–H stretching vibrations; O–H and H–O–H combinations of the starch; C–H stretching bond (1338 nm); and C–H stretching, the second overtone of which is related to anthocyanin content (1292 nm) [23,27]. The content of amylose in starch is within the range of 1700 and 1800 nm, and the absorption peaks provide chemical information about the third overtone of O–H stretching vibration (964 nm), first overtone of O–H stretching band (1414 nm), and O–H stretching and deformation with respect to water content [28].
3.2. Grain-Flour Classification
The classification of the spectral data of multiple grain flours was performed using linear and non-linear multivariate analysis methods and preprocessing methods. Table 2 shows the results of the four classification models and six preprocessing methods, including no-preprocessing (NoP) based on SWIR. The accuracy of the proposed classification model over all previous models was 71–97%; the LDA with normalization proved to be the best combination for classifying the eight grain flours with an accuracy of 97.43% and kappa coefficient of 0.97. The LDA showed an overall accuracy of 94% over all the prediction models used in the comparison, whereas PLS-DA showed 87% accuracy. Among the classification models, PLS-DA with D1 showed 96.4% accuracy, SVM with NoP showed 96.28% accuracy, and CART with D1 showed 95.87% accuracy.
Table 2.
Result of SWIR discriminant accuracy and kappa coefficient of eight samples.
Table 3 and Table 4 present the accuracy of the two multimodal HSI data according to the four classification methods. Each accuracy result presents VNIR (Table 3), and fluorescence (Table 4) data. In the case of VNIR, the use of SVM with D2 achieved the most efficient accuracy and kappa coefficient of 92.37% and 0.91, respectively. In Table 4, LDA with data normalization showed the best accuracy (A = 92.28%, K = 0.91), whereas, PLSDA with normalization showed higher accuracy (A = 93.22%) and lower kappa (K = 0.86) than LDA. Although, PLSDA showed higher accuracy than LDA, as shown Table 3, PLSDA could not classify MF1 (A = 0.09).
Table 3.
Result of VNIR discriminant accuracy and kappa coefficient of eight samples.
Table 4.
Result of fluorescence discriminant accuracy and kappa coefficient of eight samples.
Note that in the classification result of the eight grain flours, the result of classification between MF1 and MF2, which are the same variety, showed different particle sizes of the rice flours. The VNIR and fluorescence imaging achieved average results of 71.53% and 75.54% based on SVM with D2, respectively. In the case of SWIR, LDA with normalization achieved an average accuracy of 91.73%. Furthermore, discriminant analysis was performed for samples MF1 and MF2, and the use of LDA with normalization achieved an accuracy of 94.18% along with 0.88 kappa coefficient. According to the result of classification using the multivariate analysis method, SWIR (1000–1700 nm) showed the potential to detect and classify different particle sizes for the same flour type compared to other multivariate data-analysis methods [29].
Figure 7 shows the classification result of the three multimode HSI data based on LDA with normalization. VNIR (Figure 7a) shows 87% and 8.7% of the classification potential of LD1 and LD2, respectively, while fluorescence imaging shows the potential of 62% and 25% in 2D space (Figure 7b) and 3D space (Figure 7d), respectively. SWIR using LDA with normalization shows that LD1 and LD2 depict interpretation potentials of 63% and 20%, respectively (Figure 7c). In the figure, on the bottom right, the gray asterisk represents the data of mungbean starch (MS), which makes difficult to separate all rice flour samples (WF ○, MF1 △, MF2 +, SF ×) in the 2D space.
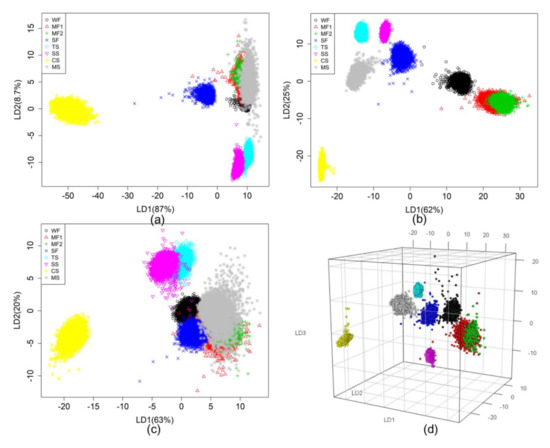
Figure 7.
LDA results of eight grain flours according to VNIR (a), fluorescence (b) and SWIR (c). LDA in 3D space is fluorescence range (d).
4. Conclusions
The study presented the use of multiple HSI modalities and multivariate analysis methods for the detection and classification of grain flours. Three types of optical spectra (i.e.; reflectances of VNIR, SWIR and fluorescence) were obtained from the acquired HSI 3D data cube of the eight grain flours. PCA was applied to reduce the data dimension and select the optimal wavelength for ROI extraction. Four chemometric methods, LDA, PLSDA, SVM and CART, were demonstrated and compared with accuracy (A) and kappa coefficient (K). The reflectance of the VNIR, SWIR and fluorescence HSI demonstrated the model’s potential for classification of multiple grain flours. Among them, LDA showed the best classification accuracy (A = 97%, K = 0.97) with normalization preprocessing in SWIR modality. VNIR showed the best accuracy (A = 92.37%, K = 0.91) with SVM and fluorescence showed the best accuracy (A = 92.28%, K = 0.91) with LDA. Furthermore, the LDA model with SWIR can distinguish grains of the same type (MF1 and MF2) but different particle sizes through spectral analysis (A = 91%, K = 0.88). This aspect can be studied in a future work to improve the accuracy of quality control in the agro-food industry. Moreover, alternative machine-learning methods and feature-selection methods will be studied in the future by using a big dataset.
Author Contributions
Conceptualization, Y.S.; methodology, Y.S., J.L.; software, A.L., B.K.; investigation, J.L., B.K.; data curation, B.K., A.L.; writing—review and editing, Y.S. All authors have read and agreed to the published version of the manuscript.
Funding
This work was supported by the agenda research project (No. PJ01350301), National Institute of Agricultural Sciences, Rural Development Administration, Republic of Korea.
Acknowledgments
We would like to thanks to Y.J. Kim, E.M. Lee, and J.S. Kang in Department of Agricultural Engineering who prepared the samples and supported experiments.
Conflicts of Interest
The authors declare no conflict of interest.
References
- Heo, S.; Lee, S.M.; Shim, J.-H.; Yoo, S.-H.; Lee, S. Effect of Dry- and Wet-Milled Rice Flours on the Quality Attributes of Gluten-Free Dough and Noodles. J. Food Eng. 2013, 116, 213–217. [Google Scholar] [CrossRef]
- Caporaso, N.; Whitworth, M.B.; Fisk, I.D. Near-Infrared Spectroscopy and Hyperspectral Imaging for Non-Destructive Quality Assessment of Cereal Grains. Appl. Spectrosc. Rev. 2018, 53, 667–687. [Google Scholar] [CrossRef]
- Yu, Y.; Yu, H.; Guo, L.; Li, J.; Chu, Y.; Tang, Y.; Tang, S.; Wang, F. Accuracy and Stableility Improvement in Detecting Wuchang Rice Adulteration by Piece-Wise Multiplicative Scatter Correction in the Hyperspectral Imaging System. Anal. Methods 2018, 10, 3224–3231. [Google Scholar] [CrossRef]
- Mo, C.; Lim, J.; Kwon, S.W.; Lim, D.K.; Kim, M.S.; Kim, G.; Kang, J.; Kwon, K.-D.; Cho, B.-K. Hyperspectral Imaging and Partial Least Square Discriminant Analysis for Geographical Origin Discrimination of White Rice. J. Biosyst. Eng. 2017, 42, 293–300. [Google Scholar] [CrossRef]
- Kawamura, S.; Natsuga, M.; Takekura, K.; Itoh, K. Development of an Automatic Rice-Quality Inspection System. Comput. Electron. Agric. 2003, 40, 115–126. [Google Scholar] [CrossRef]
- Perez-Mendoza, J.; Throne, J.E.; Dowell, F.E.; Baker, J.E. Detection of Insect Fragments in Wheat Flour by Near-Infrared Spectroscopy. J. Stored Prod. Res. 2003, 39, 305–312. [Google Scholar] [CrossRef]
- Wesley, I.J.; Larroque, O.; Osborne, B.G.; Azudin, N.; Allen, H.; Skerritt, J.H. Measurement of Gliadin and Glutenin Content of Flour by NIR Spectroscopy. J. Cereal Sci. 2001, 34, 125–133. [Google Scholar] [CrossRef]
- Lohumi, S.; Lee, H.; Kim, M.S.; Qin, J.; Cho, B.-K. Raman Hyperspectral Imaging and Spectral Similarity Analysis for Quantitative Detection of Multiple Adulterants in Wheat Flour. Biosyst. Eng. 2019, 181, 103–113. [Google Scholar] [CrossRef]
- Kamruzzaman, M.; Sun, D.-W. Chapter 5—Introduction to Hyperspectral Imaging Technology. In Computer Vision Technology for Food Quality Evaluation, 2nd ed.; Sun, D.-W., Ed.; Academic Press: Cambridge, UK, 2016; pp. 111–139. [Google Scholar] [CrossRef]
- Goetz, A.F.H. Three Decades of Hyperspectral Remote Sensing of the Earth: A Personal View. Remote. Sens. Environ. 2009, 113, S5–S16. [Google Scholar] [CrossRef]
- Kim, M.S.; Chen, Y.R.; Mehl, P.M. Hyperspectral Reflectance and Fluorescence Imaging System for Food Quality and Safety. Trans. ASAE 2001, 44, 721. [Google Scholar] [CrossRef]
- Mishra, P.; Cordella, C.B.Y.; Rutledge, D.N.; Barreiro, P.; Roger, J.M.; Diezma, B. Application of Independent Components Analysis with the JADE Algorithm and NIR Hyperspectral Imaging for Revealing Food Adulteration. J. Food Eng. 2016, 168, 7–15. [Google Scholar] [CrossRef]
- Kandpal, L.M.; Lee, S.; Kim, M.S.; Bae, H.; Cho, B.-K. Short Wave Infrared (SWIR) Hyperspectral Imaging Technique for Examination of Aflatoxin B1 (AFB1) on Corn Kernels. Food Control. 2015, 51, 171–176. [Google Scholar] [CrossRef]
- Siripatrawan, U.; Makino, Y. Monitoring Fungal Growth on Brown Rice Grains Using Rapid and Non-Destructive Hyperspectral Imaging. Int. J. Food Microbiol. 2015, 199, 93–100. [Google Scholar] [CrossRef]
- Singh, C.B.; Jayas, D.S.; Paliwal, J.; White, N.D.G. Detection of Insect-Damaged Wheat Kernels Using Near-Infrared Hyperspectral Imaging. J. Stored Prod. Res. 2009, 45, 151–158. [Google Scholar] [CrossRef]
- Bardedo, J.G.A.; Guarienti, E.M.; Tibola, C.S. Detection of sprout damage in wheat kernels using NIR hyperspectral imaging. Biosyst. Eng. 2018, 175, 124–132. [Google Scholar] [CrossRef]
- Gorretta, N.; Roger, J.M.; Aubert, M.; Bellon-Maurel, V.; Campan, F.; Roumet, P. Determining Vitreousness of Durum Wheat Kernels Using Near Infrared Hyperspectral Imaging. J. Near Infrared Spectrosc. 2006, 14, 231–239. [Google Scholar] [CrossRef]
- Baek, I.; Kim, M.S.; Cho, B.-K.; Mo, C.; Barnaby, J.Y.; McClung, A.M.; Oh, M. Selection of Optimal Hyperspectral Wavebands for Detection of Discolored, Diseased Rice Seeds. Appl. Sci. 2019, 9, 1027. [Google Scholar] [CrossRef]
- Manley, M.; du Toit, G.; Geladi, P. Tracking Diffusion of Conditioning Water in Single Wheat Kernels of Different Hardnesses by Near Infrared Hyperspectral Imaging. Anal. Chim. Acta. 2011, 686, 64–75. [Google Scholar] [CrossRef]
- Yang, X.; Hong, H.; You, Z.; Cheng, F. Spectral and Image Integrated Analysis of Hyperspectral Data for Waxy Corn Seed Variety Classification. Sensors 2015, 15, 15578–15594. [Google Scholar] [CrossRef]
- Rinnan, A.; Berg, F.W.J.V.D.; Engelsen, S.B. Review of the Most Common Pre-Processing Techniques for Near-Infrared Spectra. TrAC Trend. Anal. Chem. 2009, 28, 1201–1222. [Google Scholar] [CrossRef]
- Merzlyak, M.N.; Chivkunova, O.B. Light-Stress-Induced Pigment Changes and Evidence for Anthocyanin Photoprotection in Apples. J. Photoch. B 2000, 55, 155–163. [Google Scholar] [CrossRef]
- Siedliska, A.; Baranowski, P.; Zubik, M.; Mazurek, W.; Sosnowska, B. Detection of Fungal Infections in Strawberry Fruit by VNIR/SWIR Hyperspectral Imaging. Postharvest Biol. Tec. 2018, 139, 115–126. [Google Scholar] [CrossRef]
- Weng, S.; Tang, P.; Yuan, H.; Guo, B.; Yu, S.; Huang, L.; Xu, C. Hyperspectral Imaging for Accurate Determination of Rice Variety Using A Deep Learning Network with Multi-Feature Fusion. Spectrochim. Acta A 2020, 234, 118237. [Google Scholar] [CrossRef] [PubMed]
- Ma, L.; Peng, Y.; Pei, Y.; Zeng, J.; Shen, H.; Cao, J.; Qiao, Y.; Wu, Z. Systematic Discovery about NIR Spectral Assignment from Chemical Structural Property to Natural Chemical Compounds. Sci. Rep. 2019, 9, 9503. [Google Scholar] [CrossRef] [PubMed]
- Egharevba, H.O. Chemical Properties of Starch and Its Application in the Food Industry. In Chemical Properties of Starch; IntechOpen: London, UK, 2019. [Google Scholar] [CrossRef]
- López, M.G. Carbohydrate Analysis by NIRS-Chemometrics. In Developments in Near-Infrared Spectroscopy; García-González, A.S., Ed.; IntechOpen: London, UK, 2017. [Google Scholar] [CrossRef]
- Fertig, C.C.; Podczeck, F.; Jee, R.D.; Smith, M.R. Feasibility Study for the Rapid Determination of the Amylose Content in Starch by Near-Infrared Spectroscopy. Eur. J. Pharm. Sci. 2004, 21, 155–159. [Google Scholar] [CrossRef]
- Bittner, L.K.H.; Heigl, N.; Petter, C.H.; Noisternig, M.F.; Griesser, U.J.; Bonn, G.K.; Huck, C.W. Near-Infrared Reflection Spectroscopy (NIRS) As A Successful Tool for Simultaneous Identification and Particle Size Determination of Amoxicillin Trihydrate. J. Pharm. Biomed. 2011, 54, 1059–1064. [Google Scholar] [CrossRef]
© 2020 by the authors. Licensee MDPI, Basel, Switzerland. This article is an open access article distributed under the terms and conditions of the Creative Commons Attribution (CC BY) license (http://creativecommons.org/licenses/by/4.0/).