Data-Driven Real-Time Online Taxi-Hailing Demand Forecasting Based on Machine Learning Method
Abstract
Featured Application
Abstract
1. Introduction
2. Related Work
3. Data Description
3.1. Taxi GPS Data
3.2. Online Taxi-Hailing GPS Data
3.3. Environmental Data
4. Methods
4.1. Feature Selection
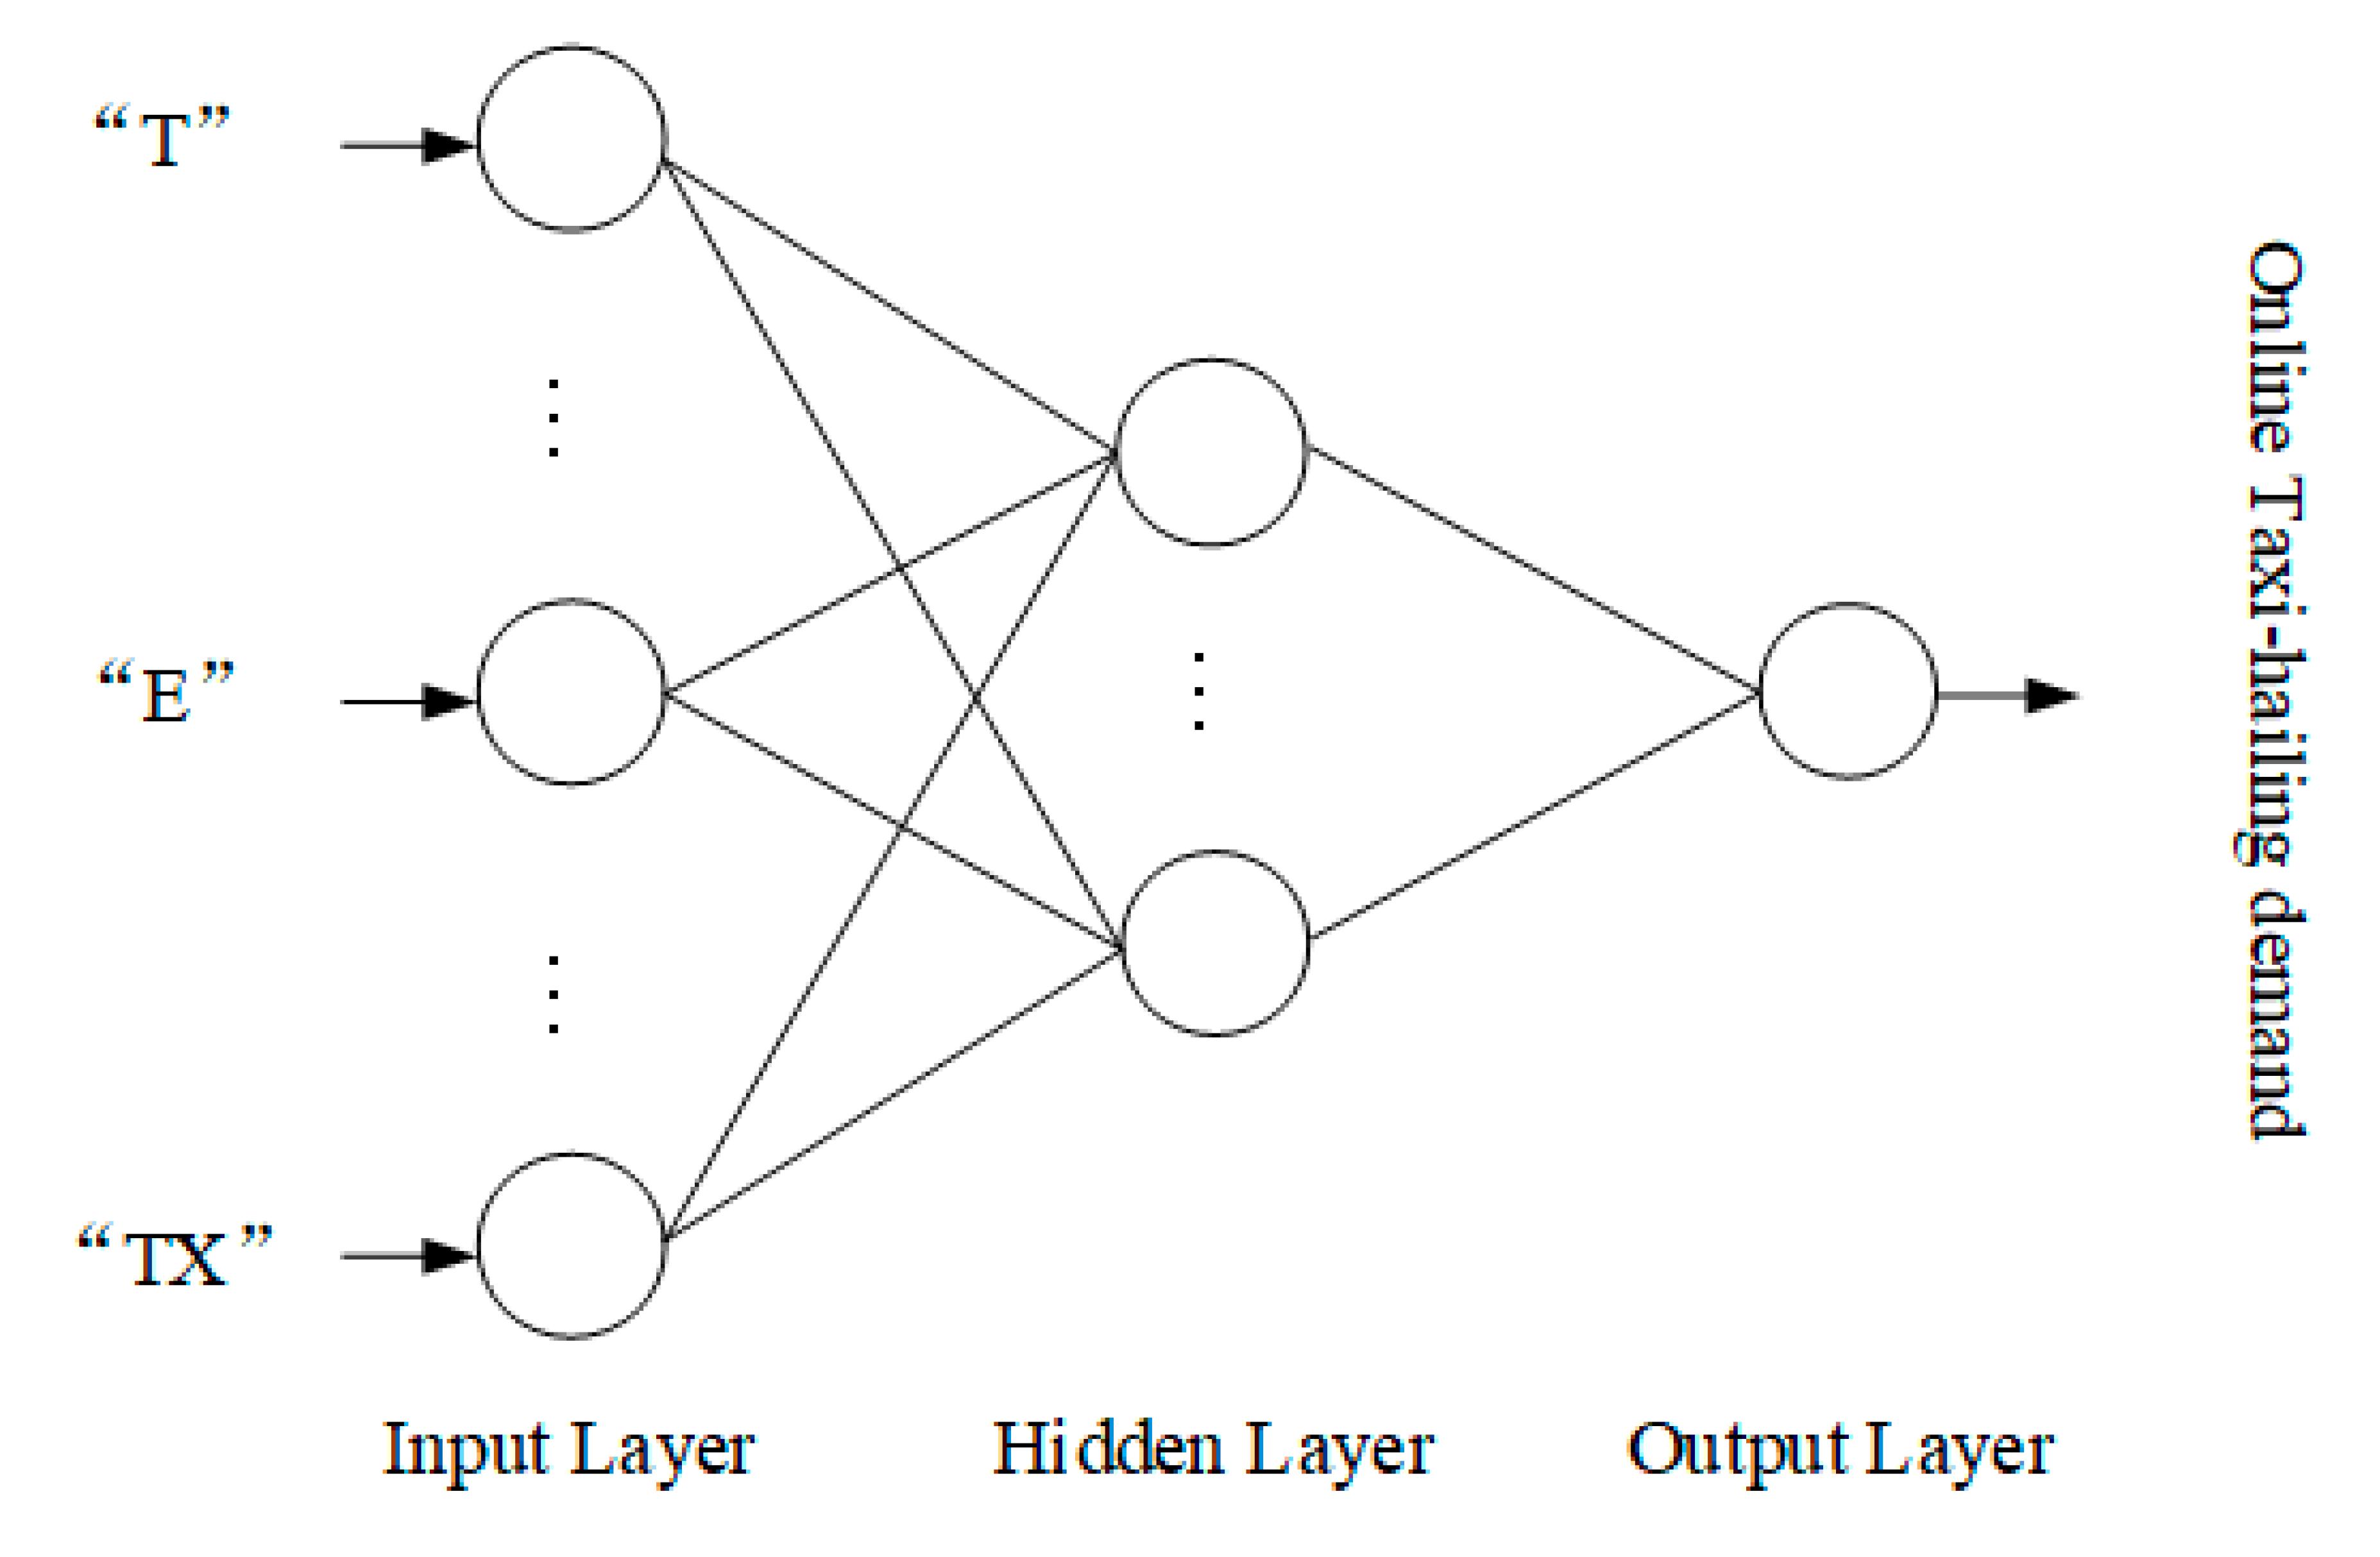
4.2. BPNN
4.3. XGB
4.4. Evaluation Criteria
5. Results
5.1. Feature Selection
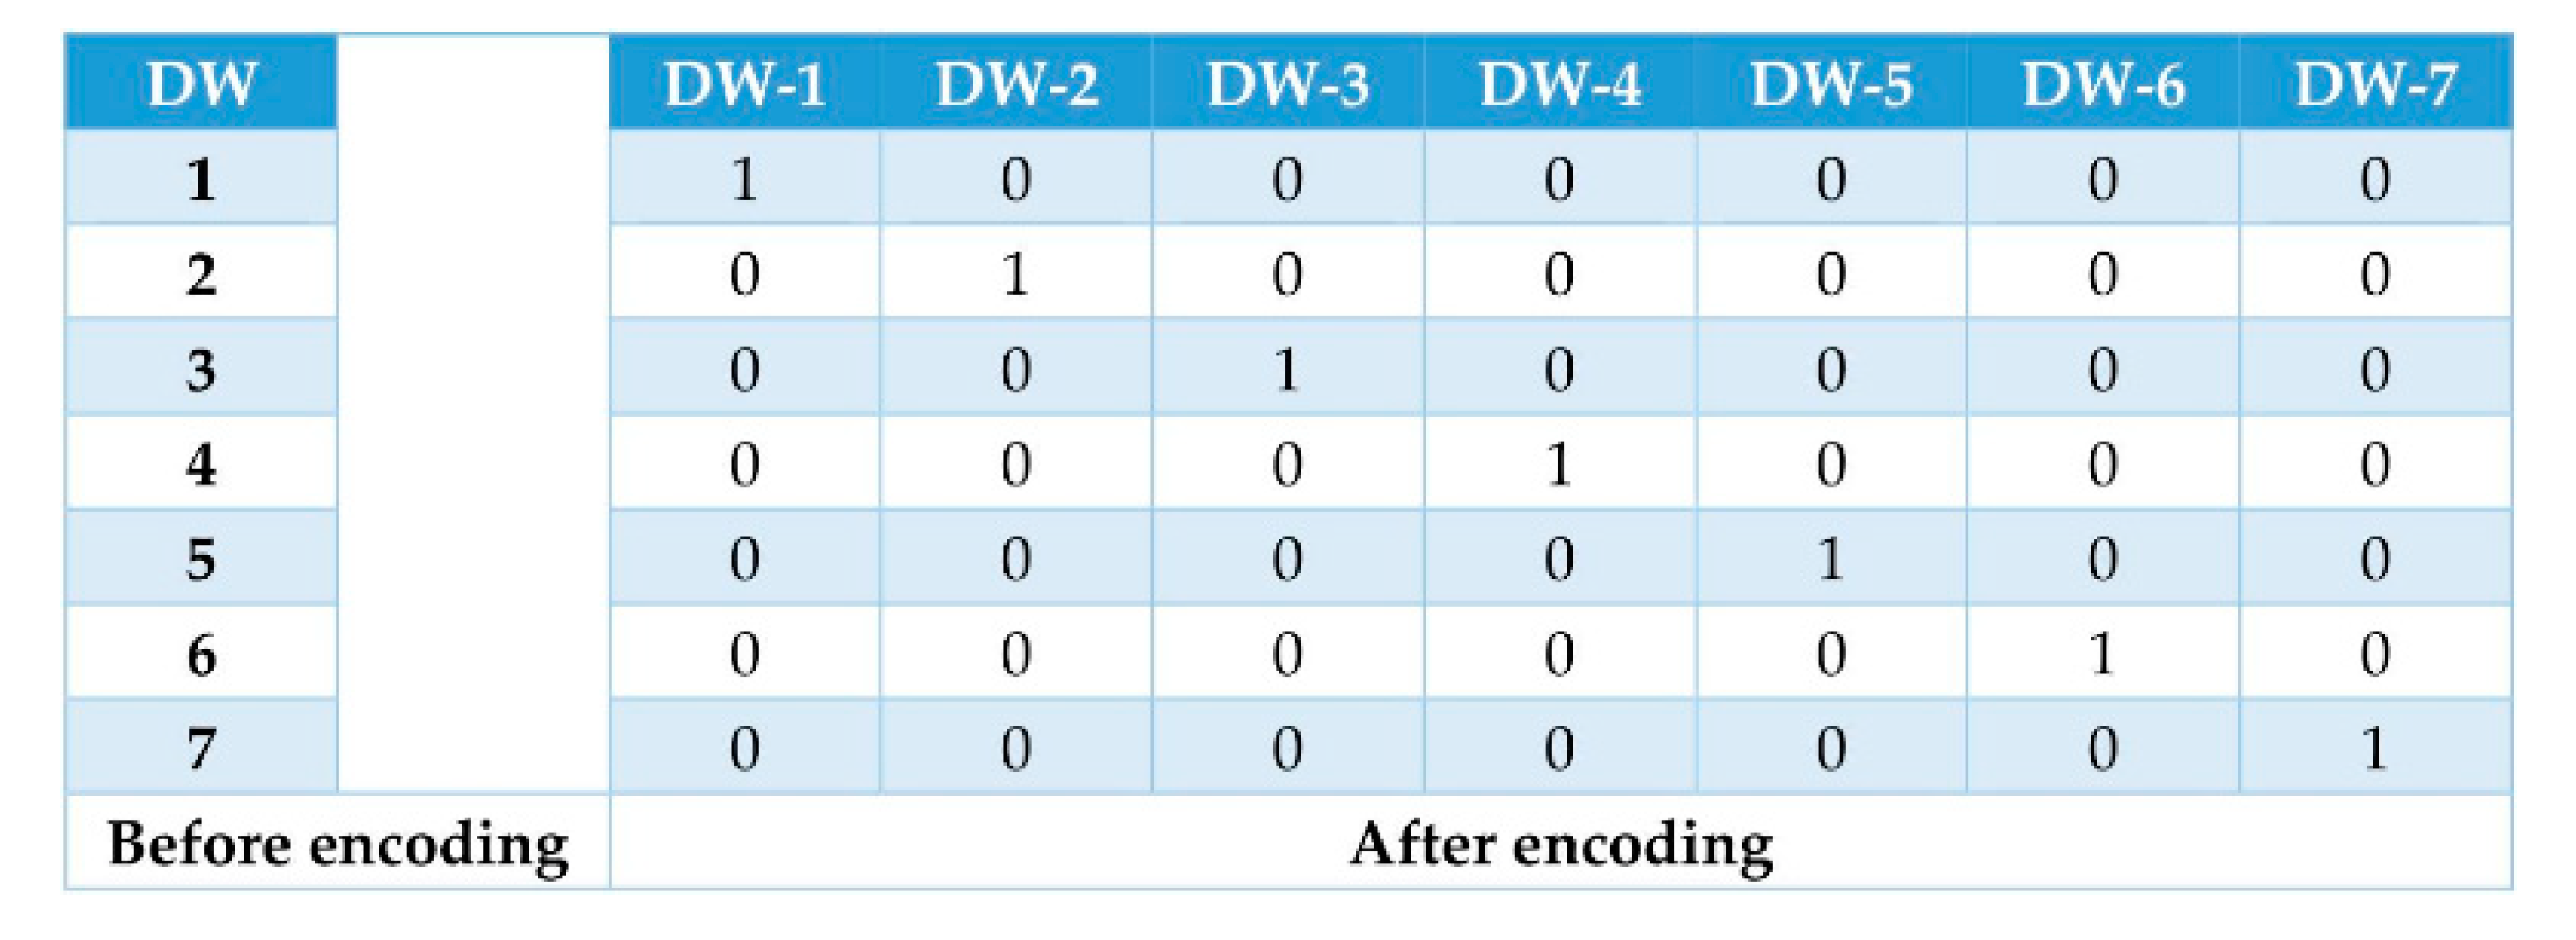
5.2. Data Preprocessing
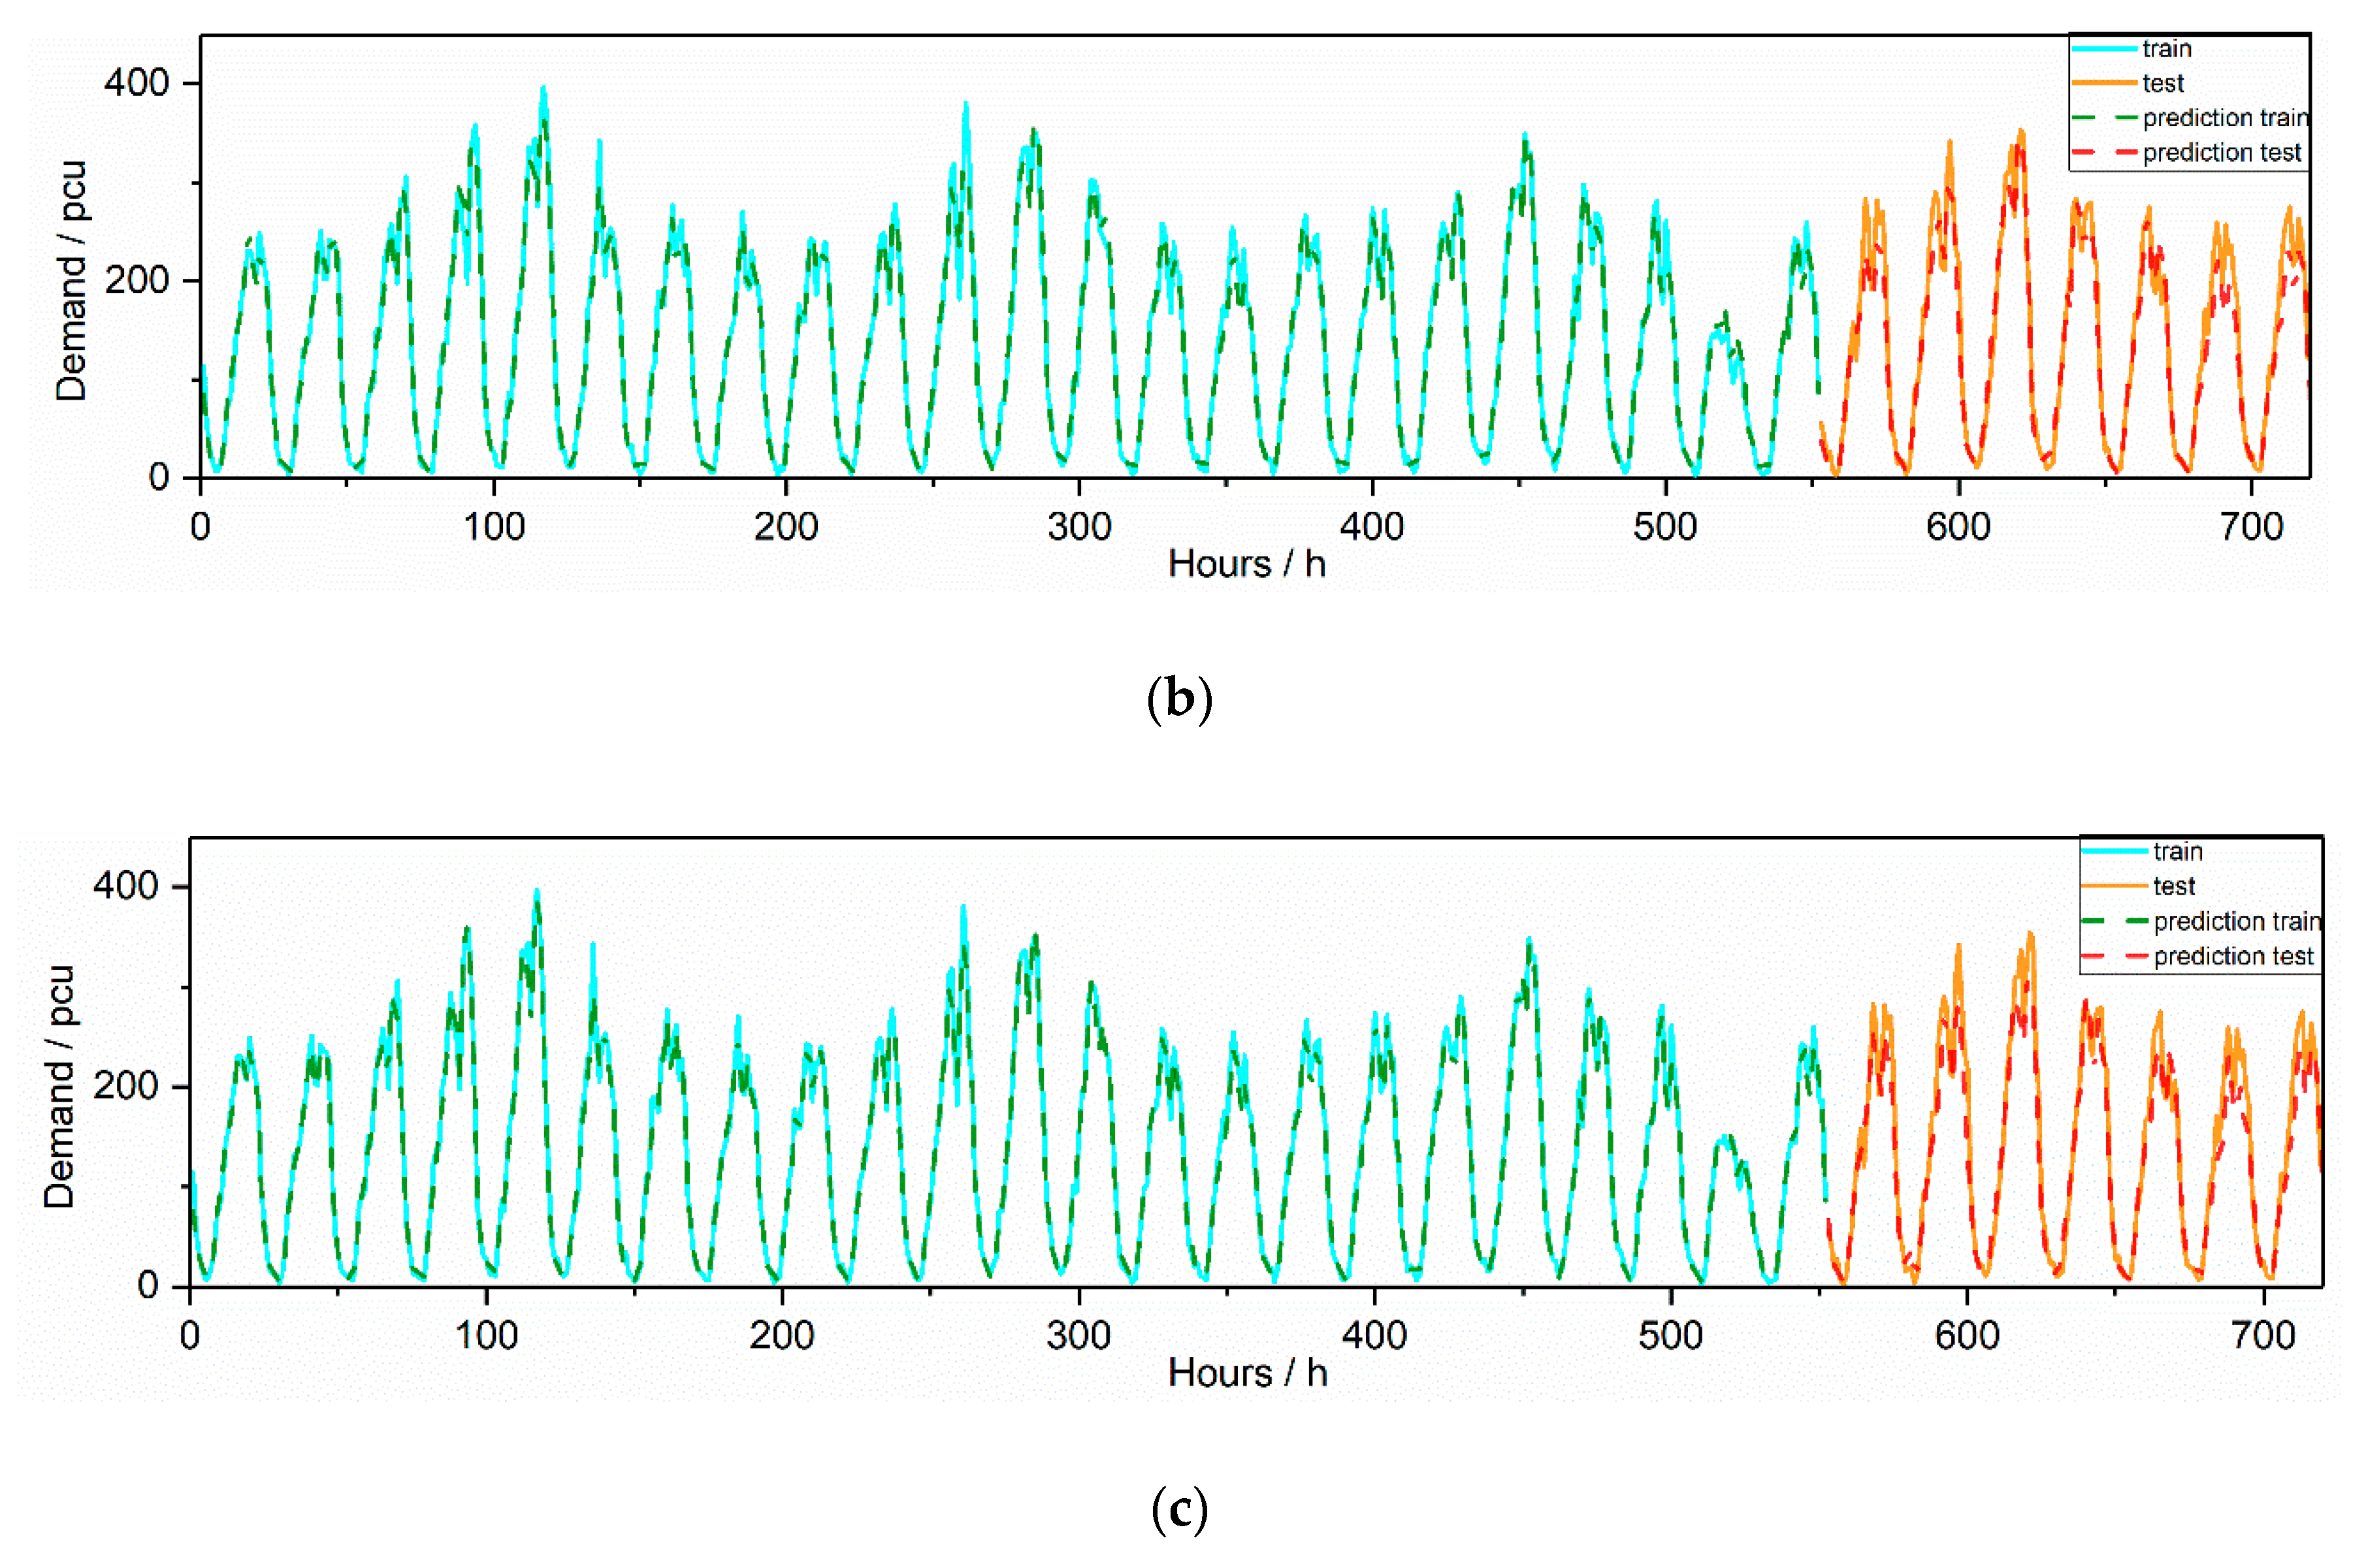
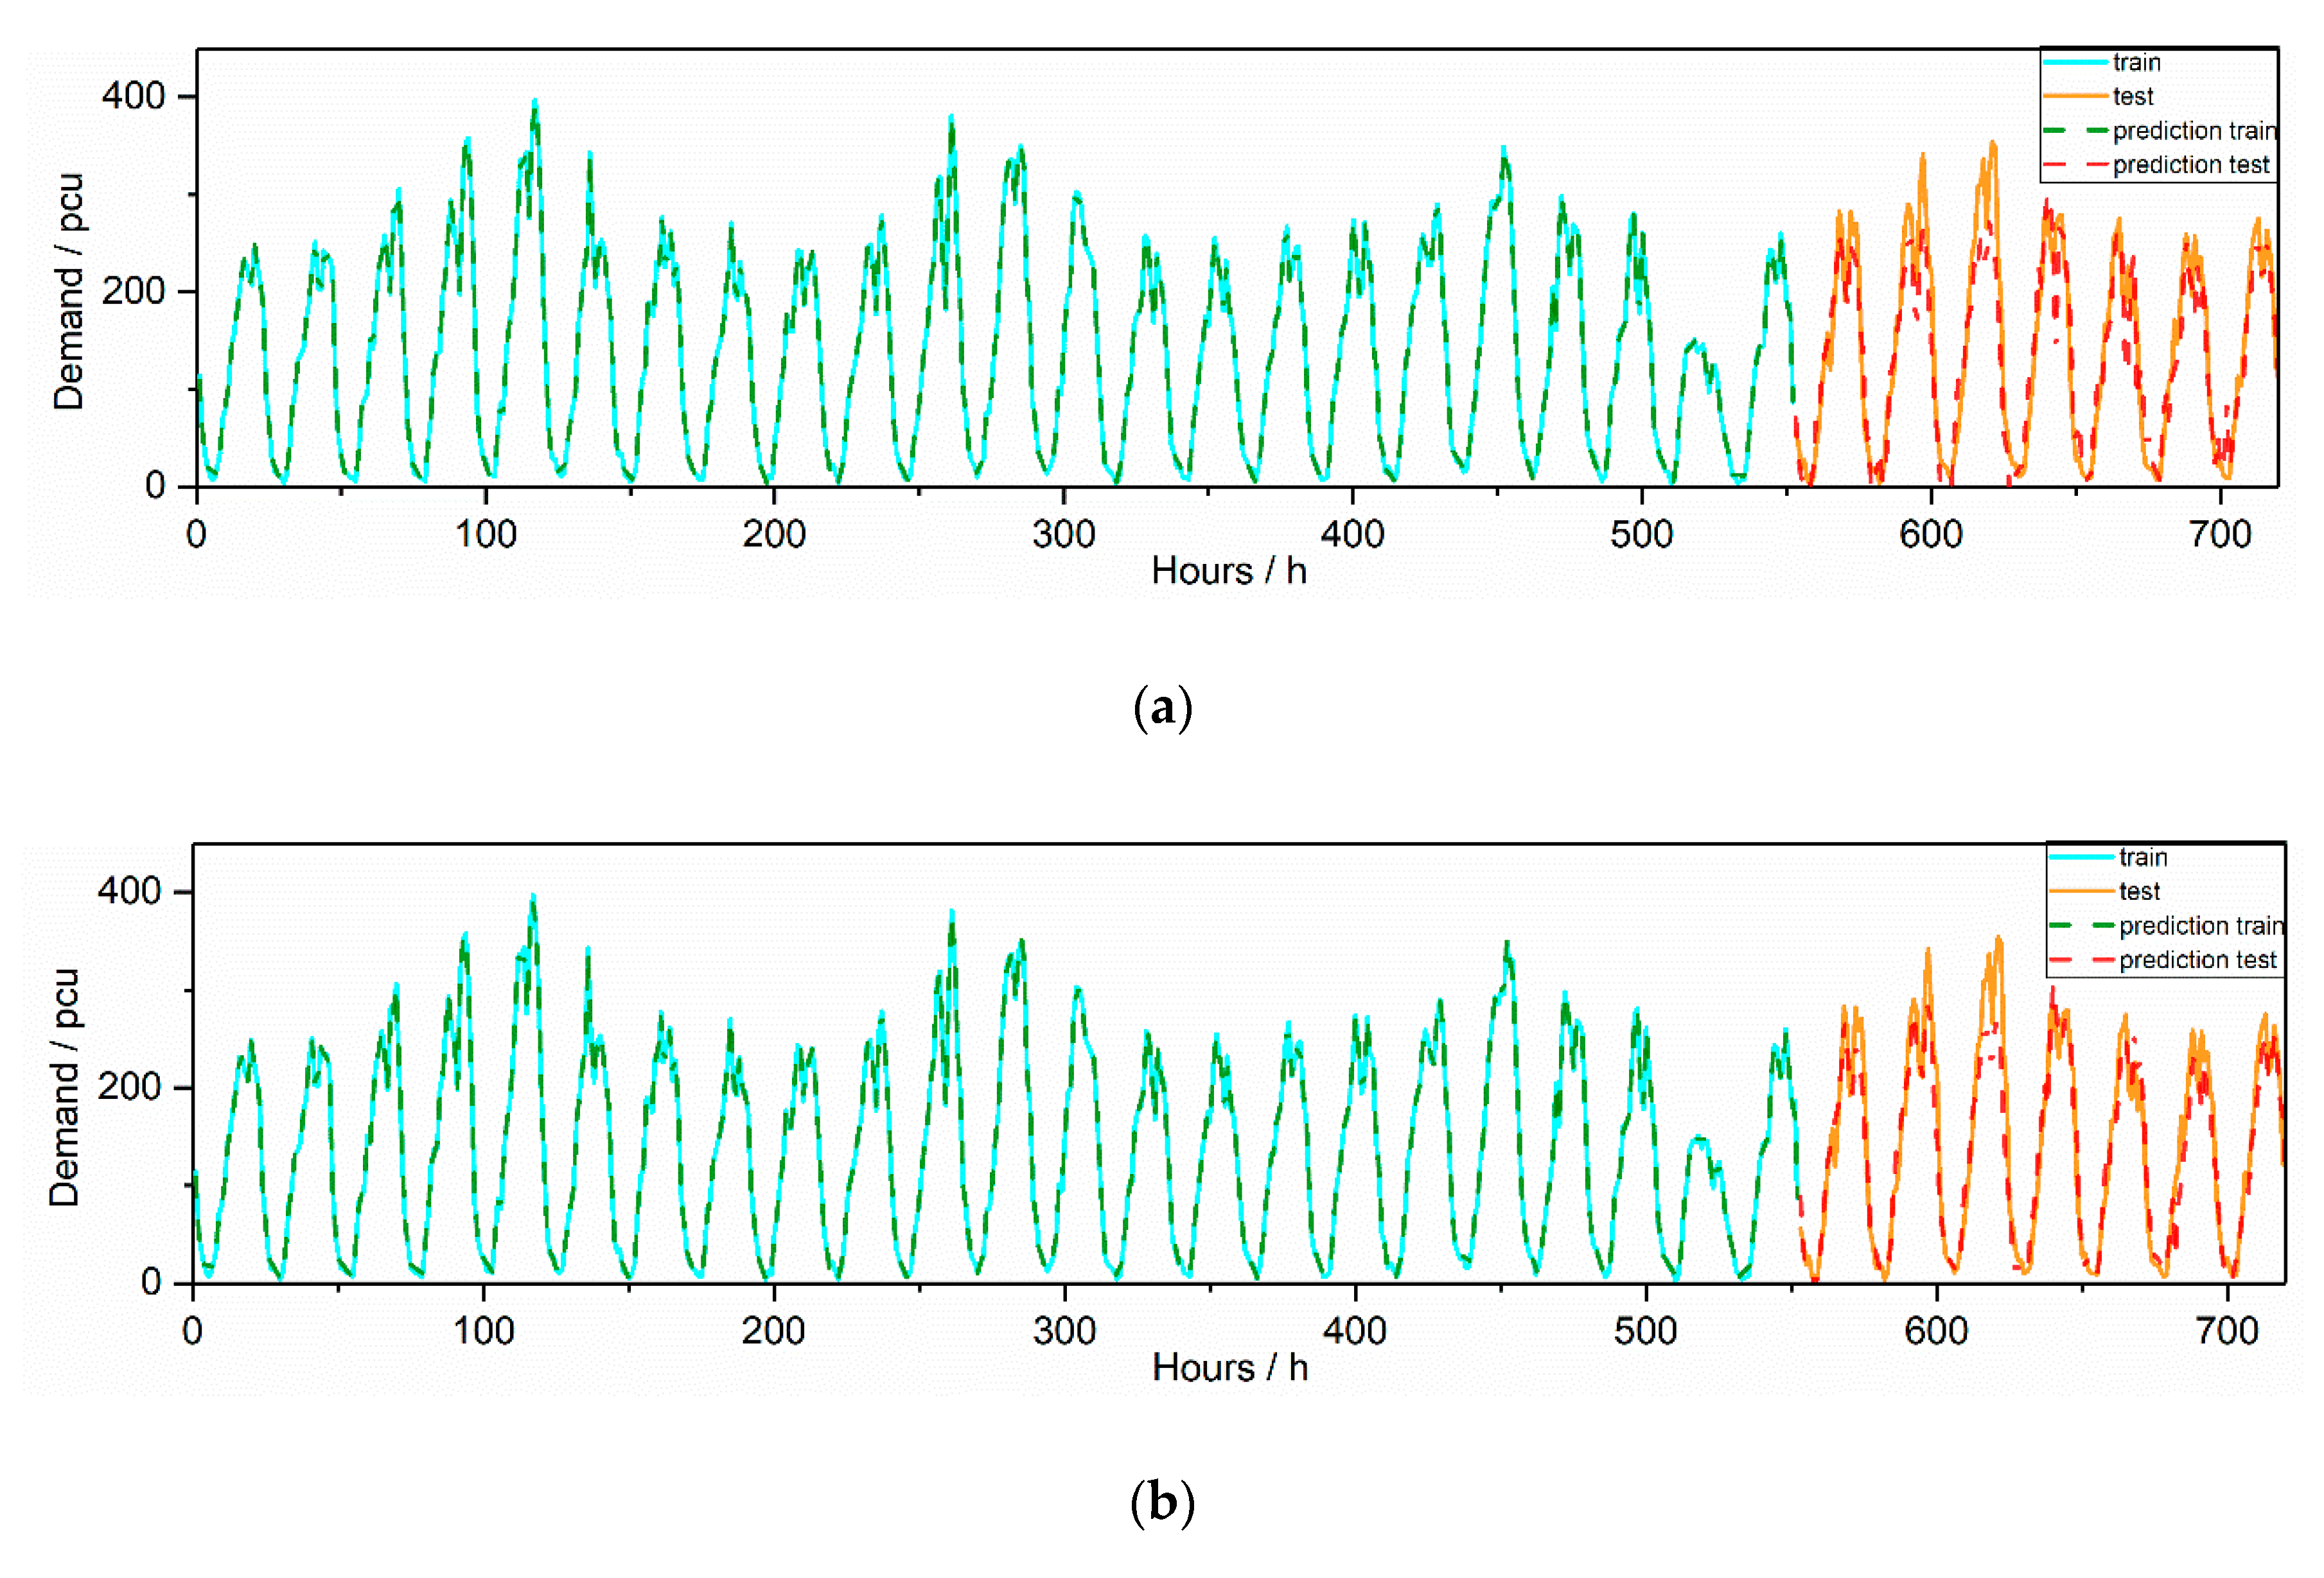
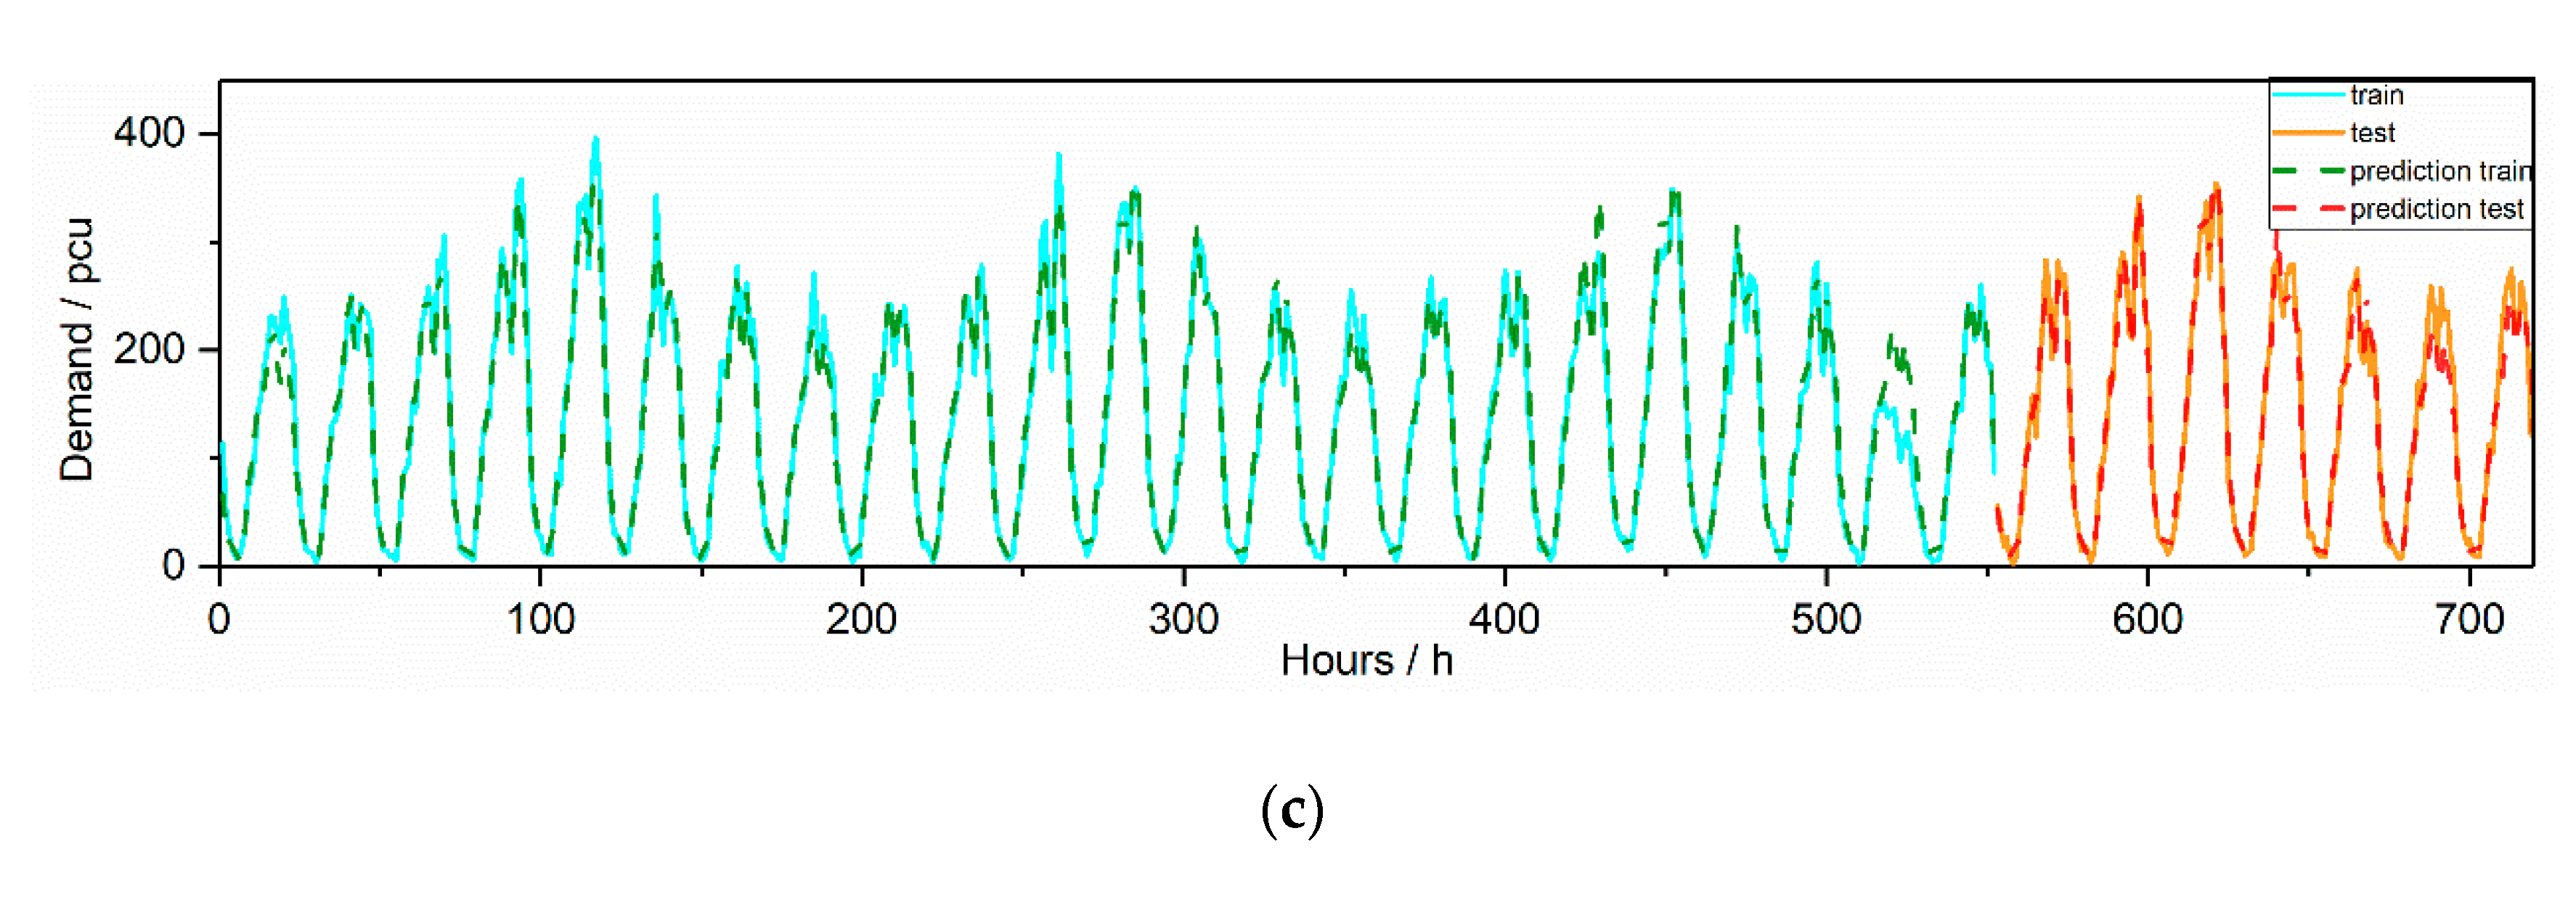
5.3. Online Taxi-Hailing Demand Forecasting
5.4. Real-Time Online Taxi-Hailing Demand
6. Discussion and Conclusions
6.1. Discussion
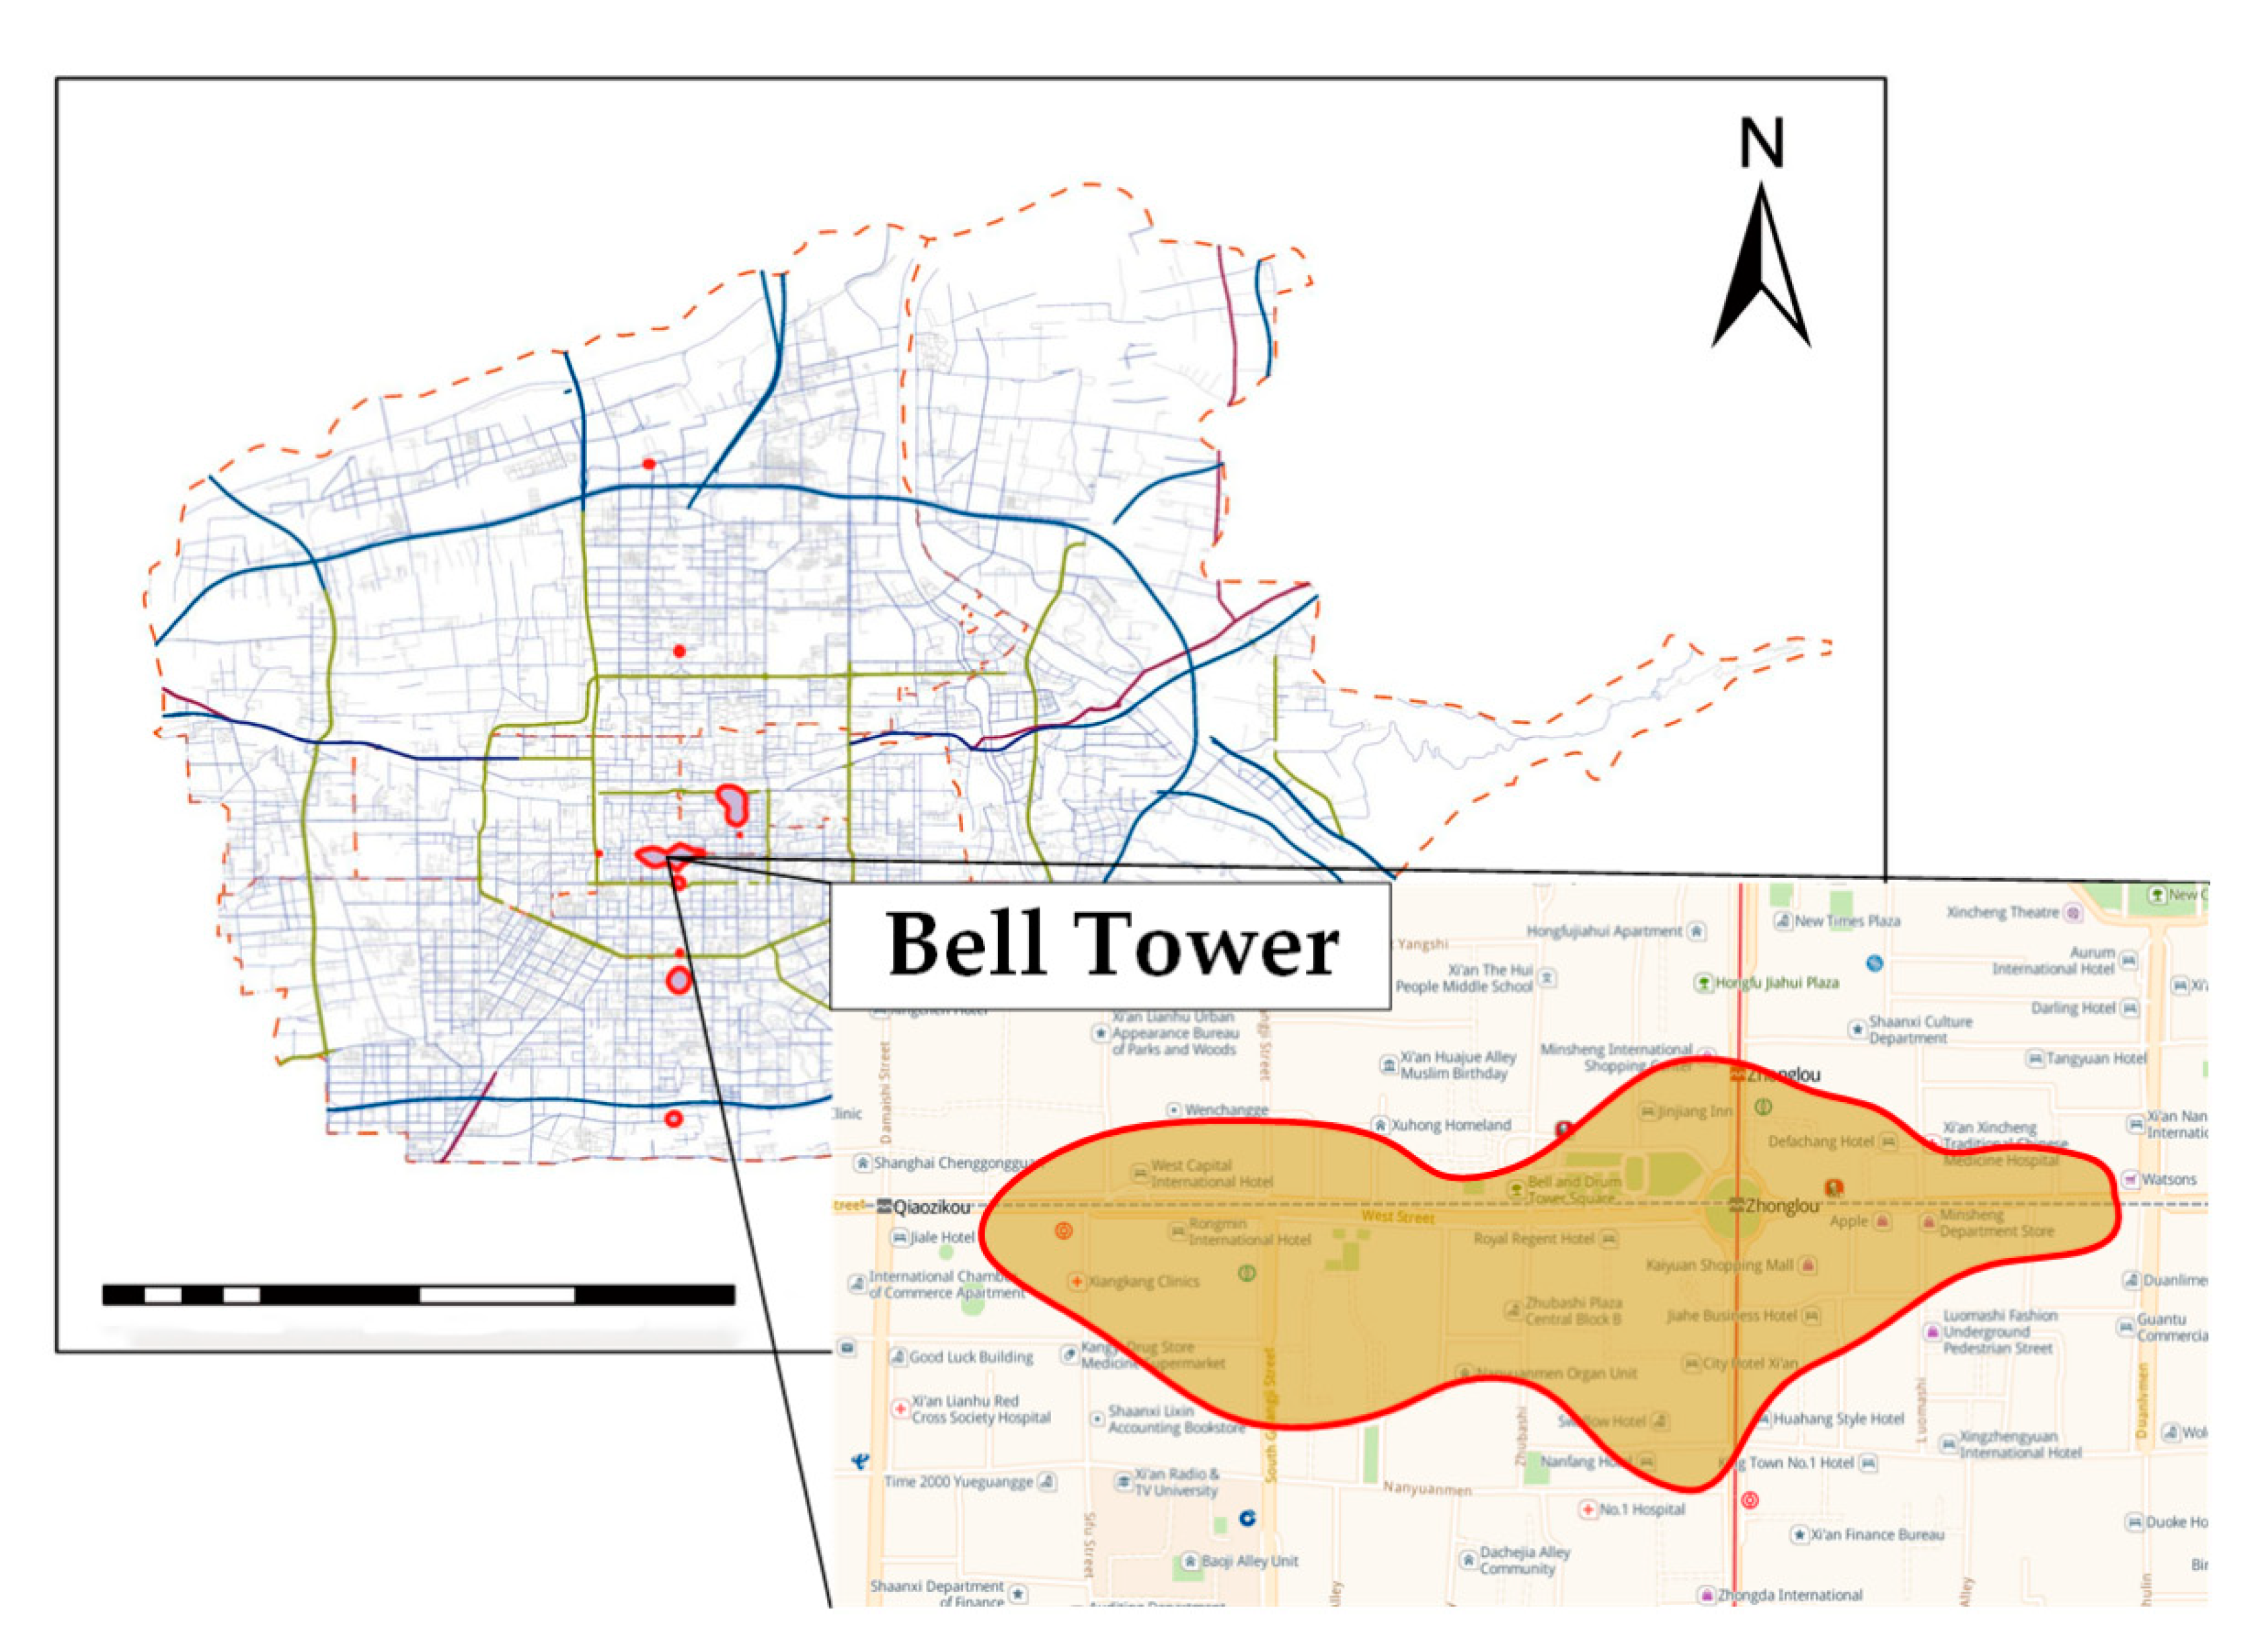
- The demand for taxi and online taxi-hailing is regular in the Bell Tower area, and taxi demand decreases while the online taxi-hailing demand increases in peak hours. This is because online taxi-hailing is more convenient to obtain than taxis in peak hours;
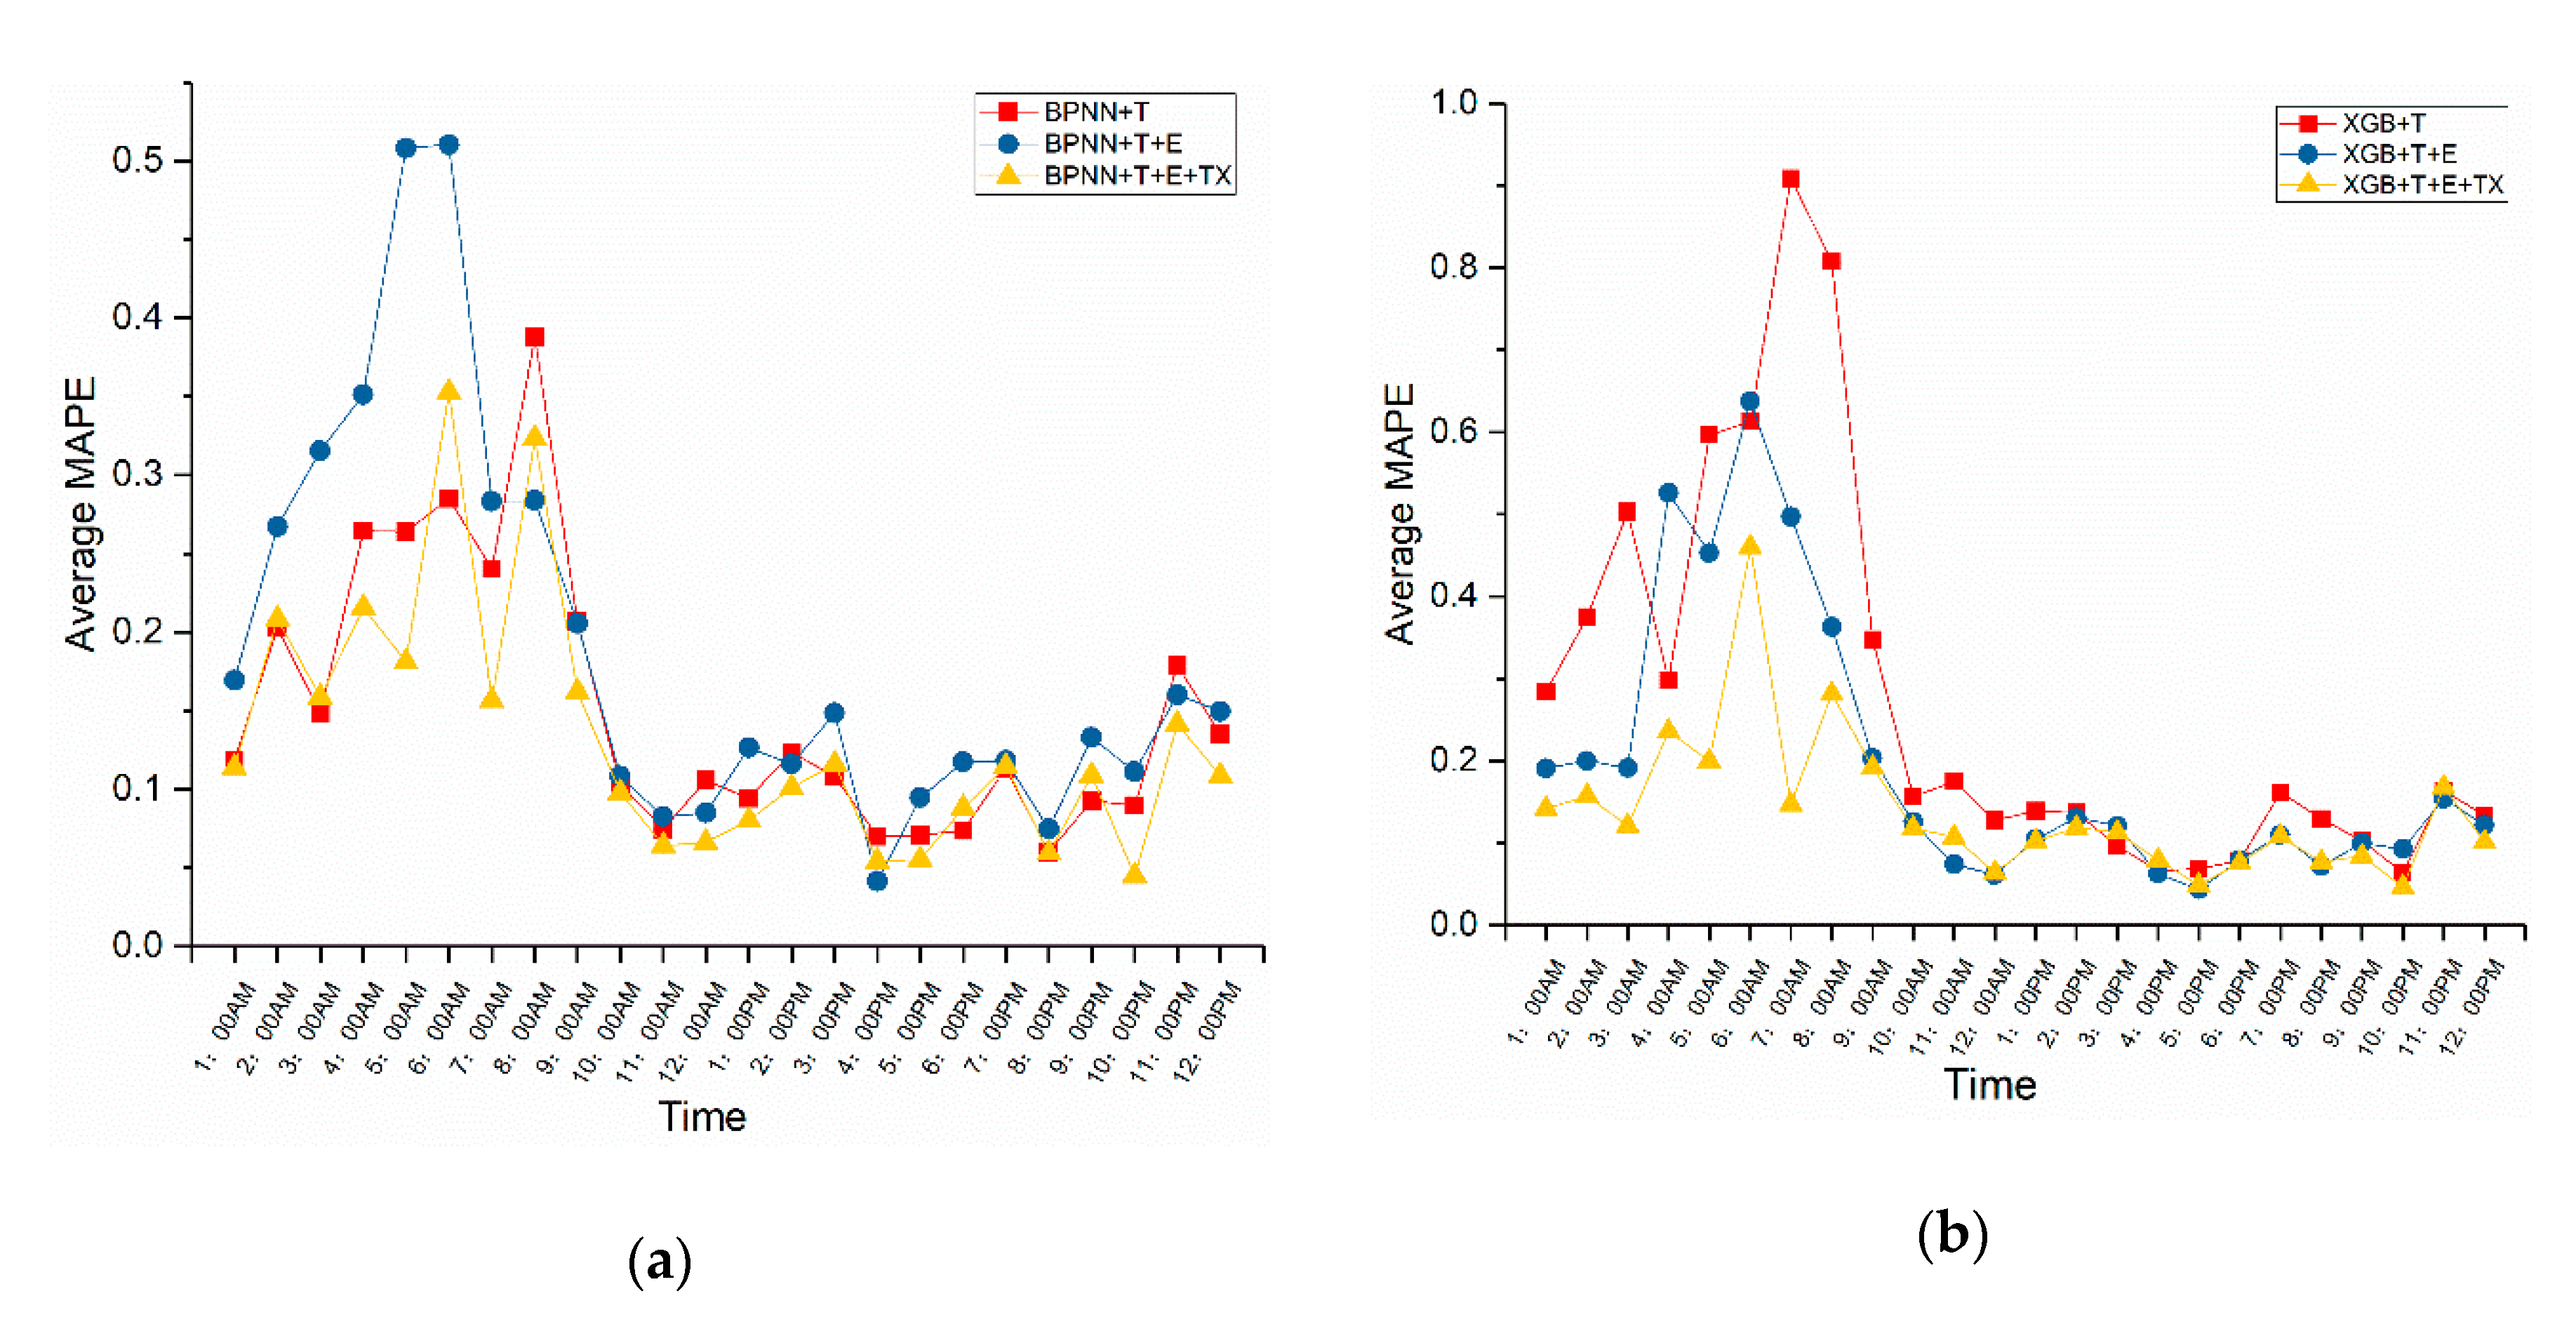
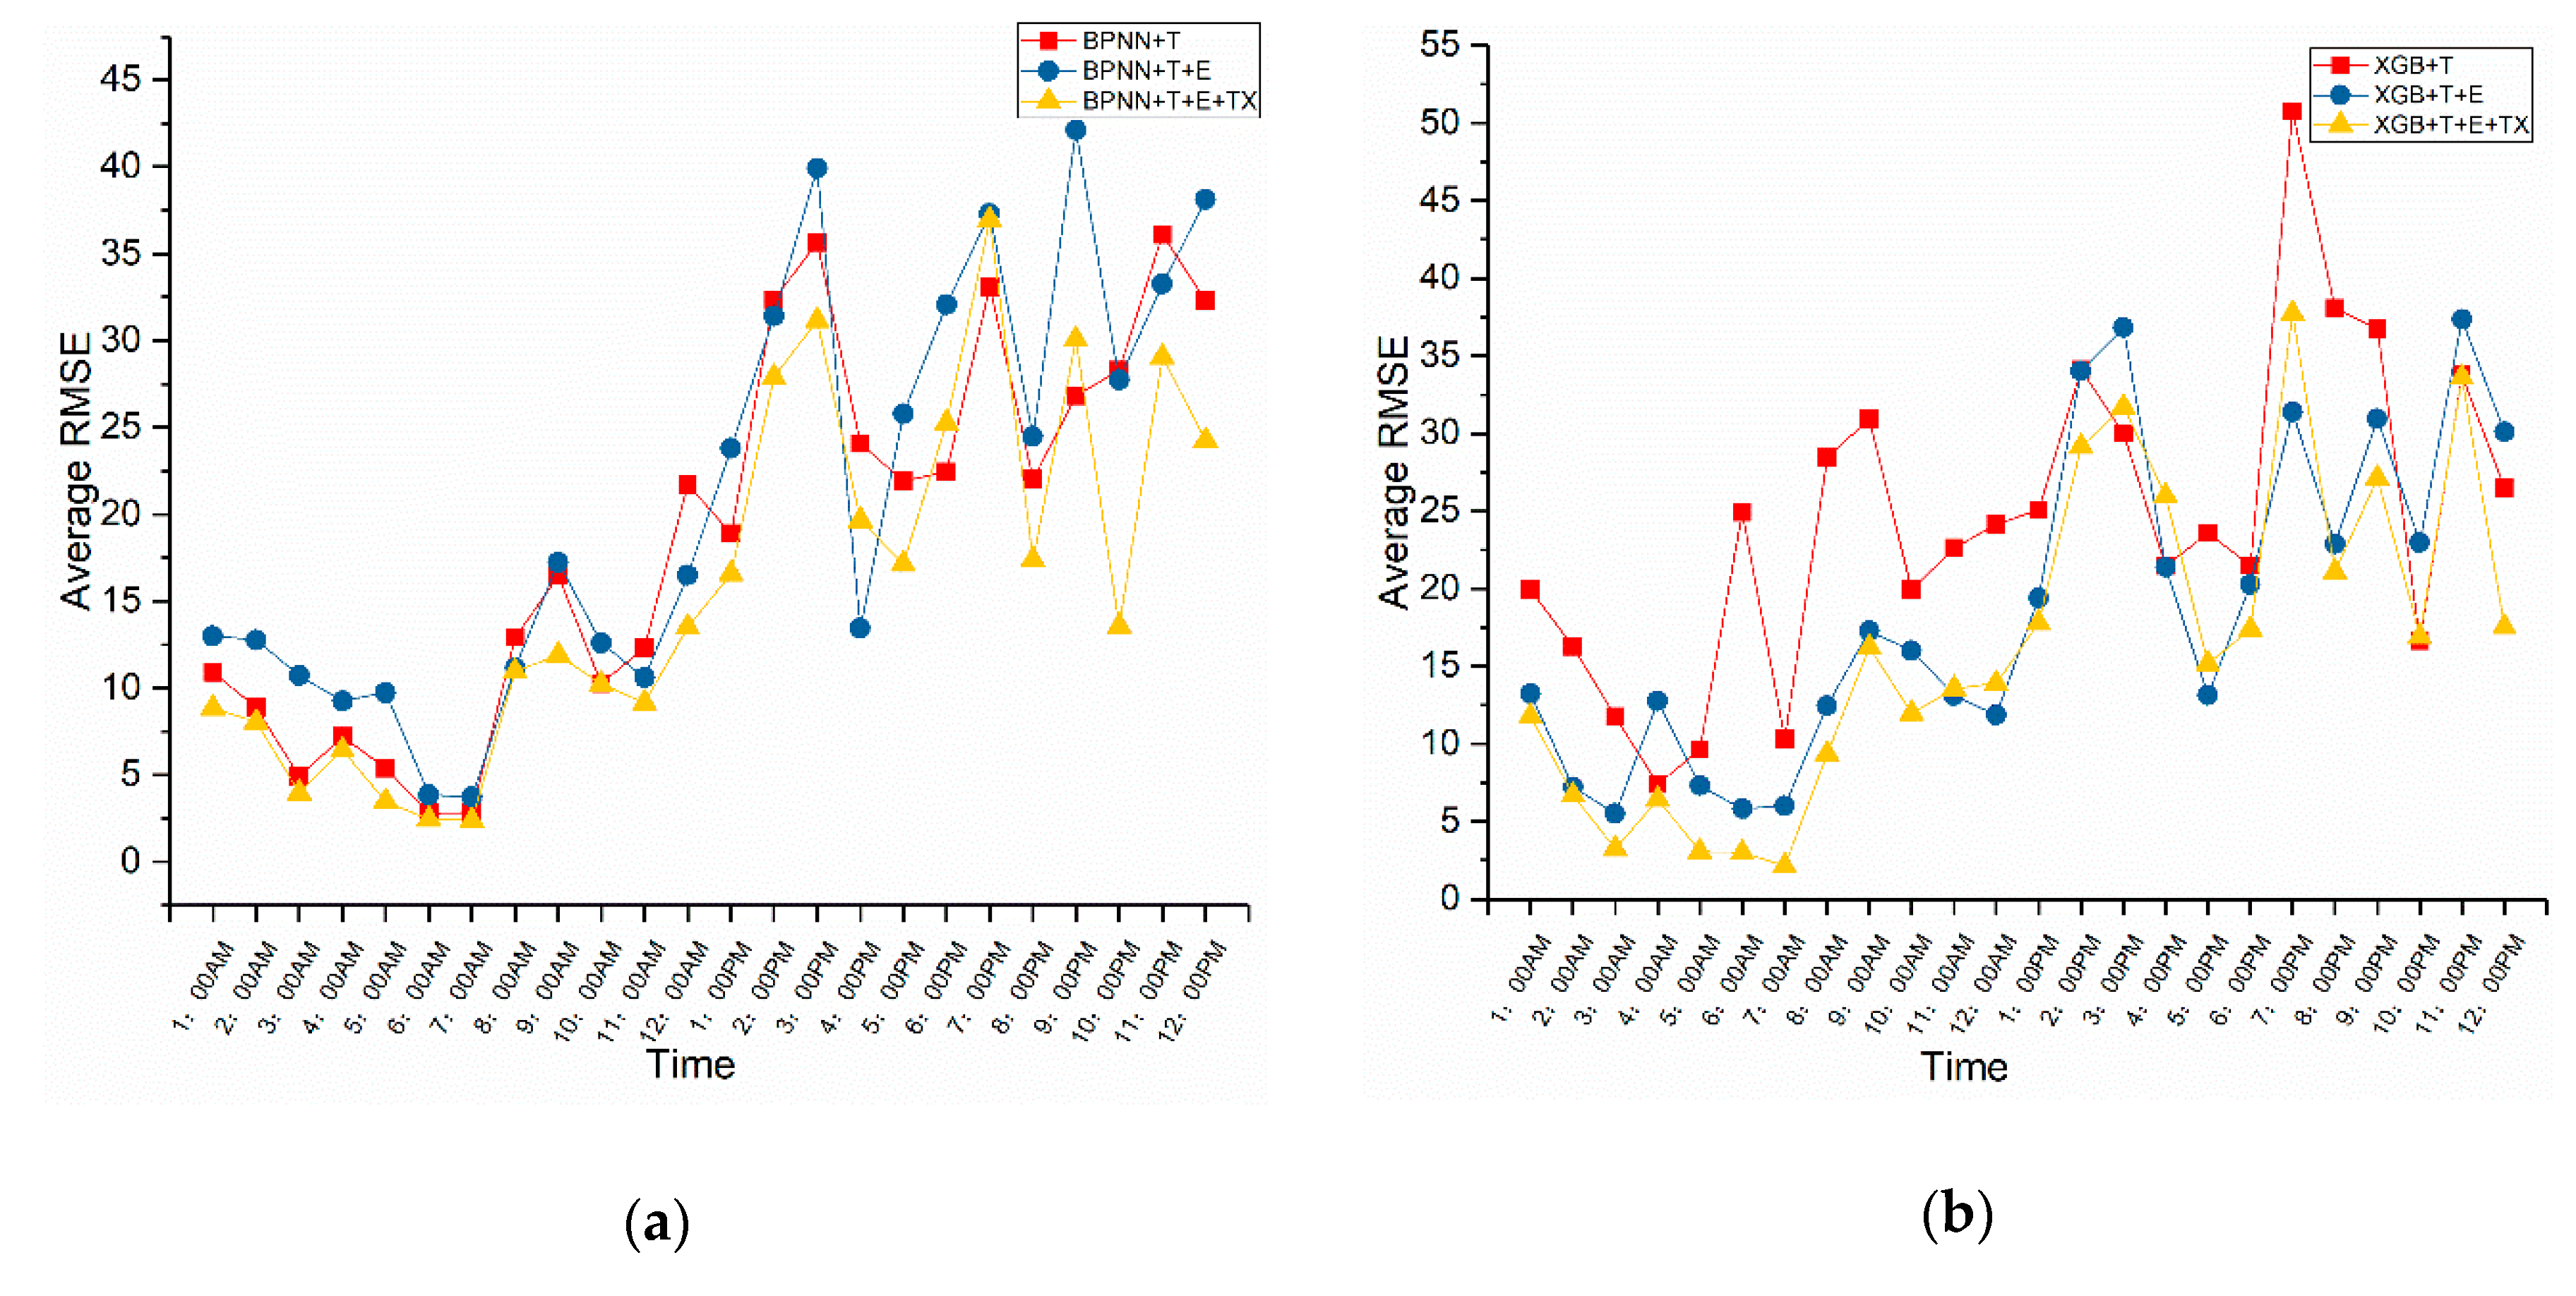
- Based on the BPNN methods, including information “E” leads to an MAPE reduction from 0.224 to 0.190 while it decreases RMSE from 28.576 to 23.921, and it increases the from 0.819 to 0.845. Likewise, including information “TX” leads to an MAPE reduction from 0.190 to 0.132, and it increases the from 0.845 to 0.866. Figure 7a shows that model “BPNN + T + E + TX” obtains the lowest MAPE among three predictions except at 6 a.m., 8 a.m. and 9 p.m., and from Figure 8, we know that model “BPNN + T + E + TX” obtains the lowest RMSE among three predictions except at 4, 7, and 9 p.m.;
- Based on the XGB methods, including information “E” leads to an MAPE reduction from 0.333 to 0.197 while it reduces RMSE from 26.296 to 21.206, and it increases the from 0.833 to 0.857. And including information “TX” leads to an MAPE reduction from 0.197 to 0.139, and it increases the from 0.857 to 0.865. Figure 7b indicates that the performance of the model “XGB + T + E + TX” is the best, except at 11 a.m. and 5 p.m., and from Figure 8 we know that performance of model “XGB + T + E + TX” is the best except at 11 a.m., 12 a.m., 4 p.m. and 5 p.m.;
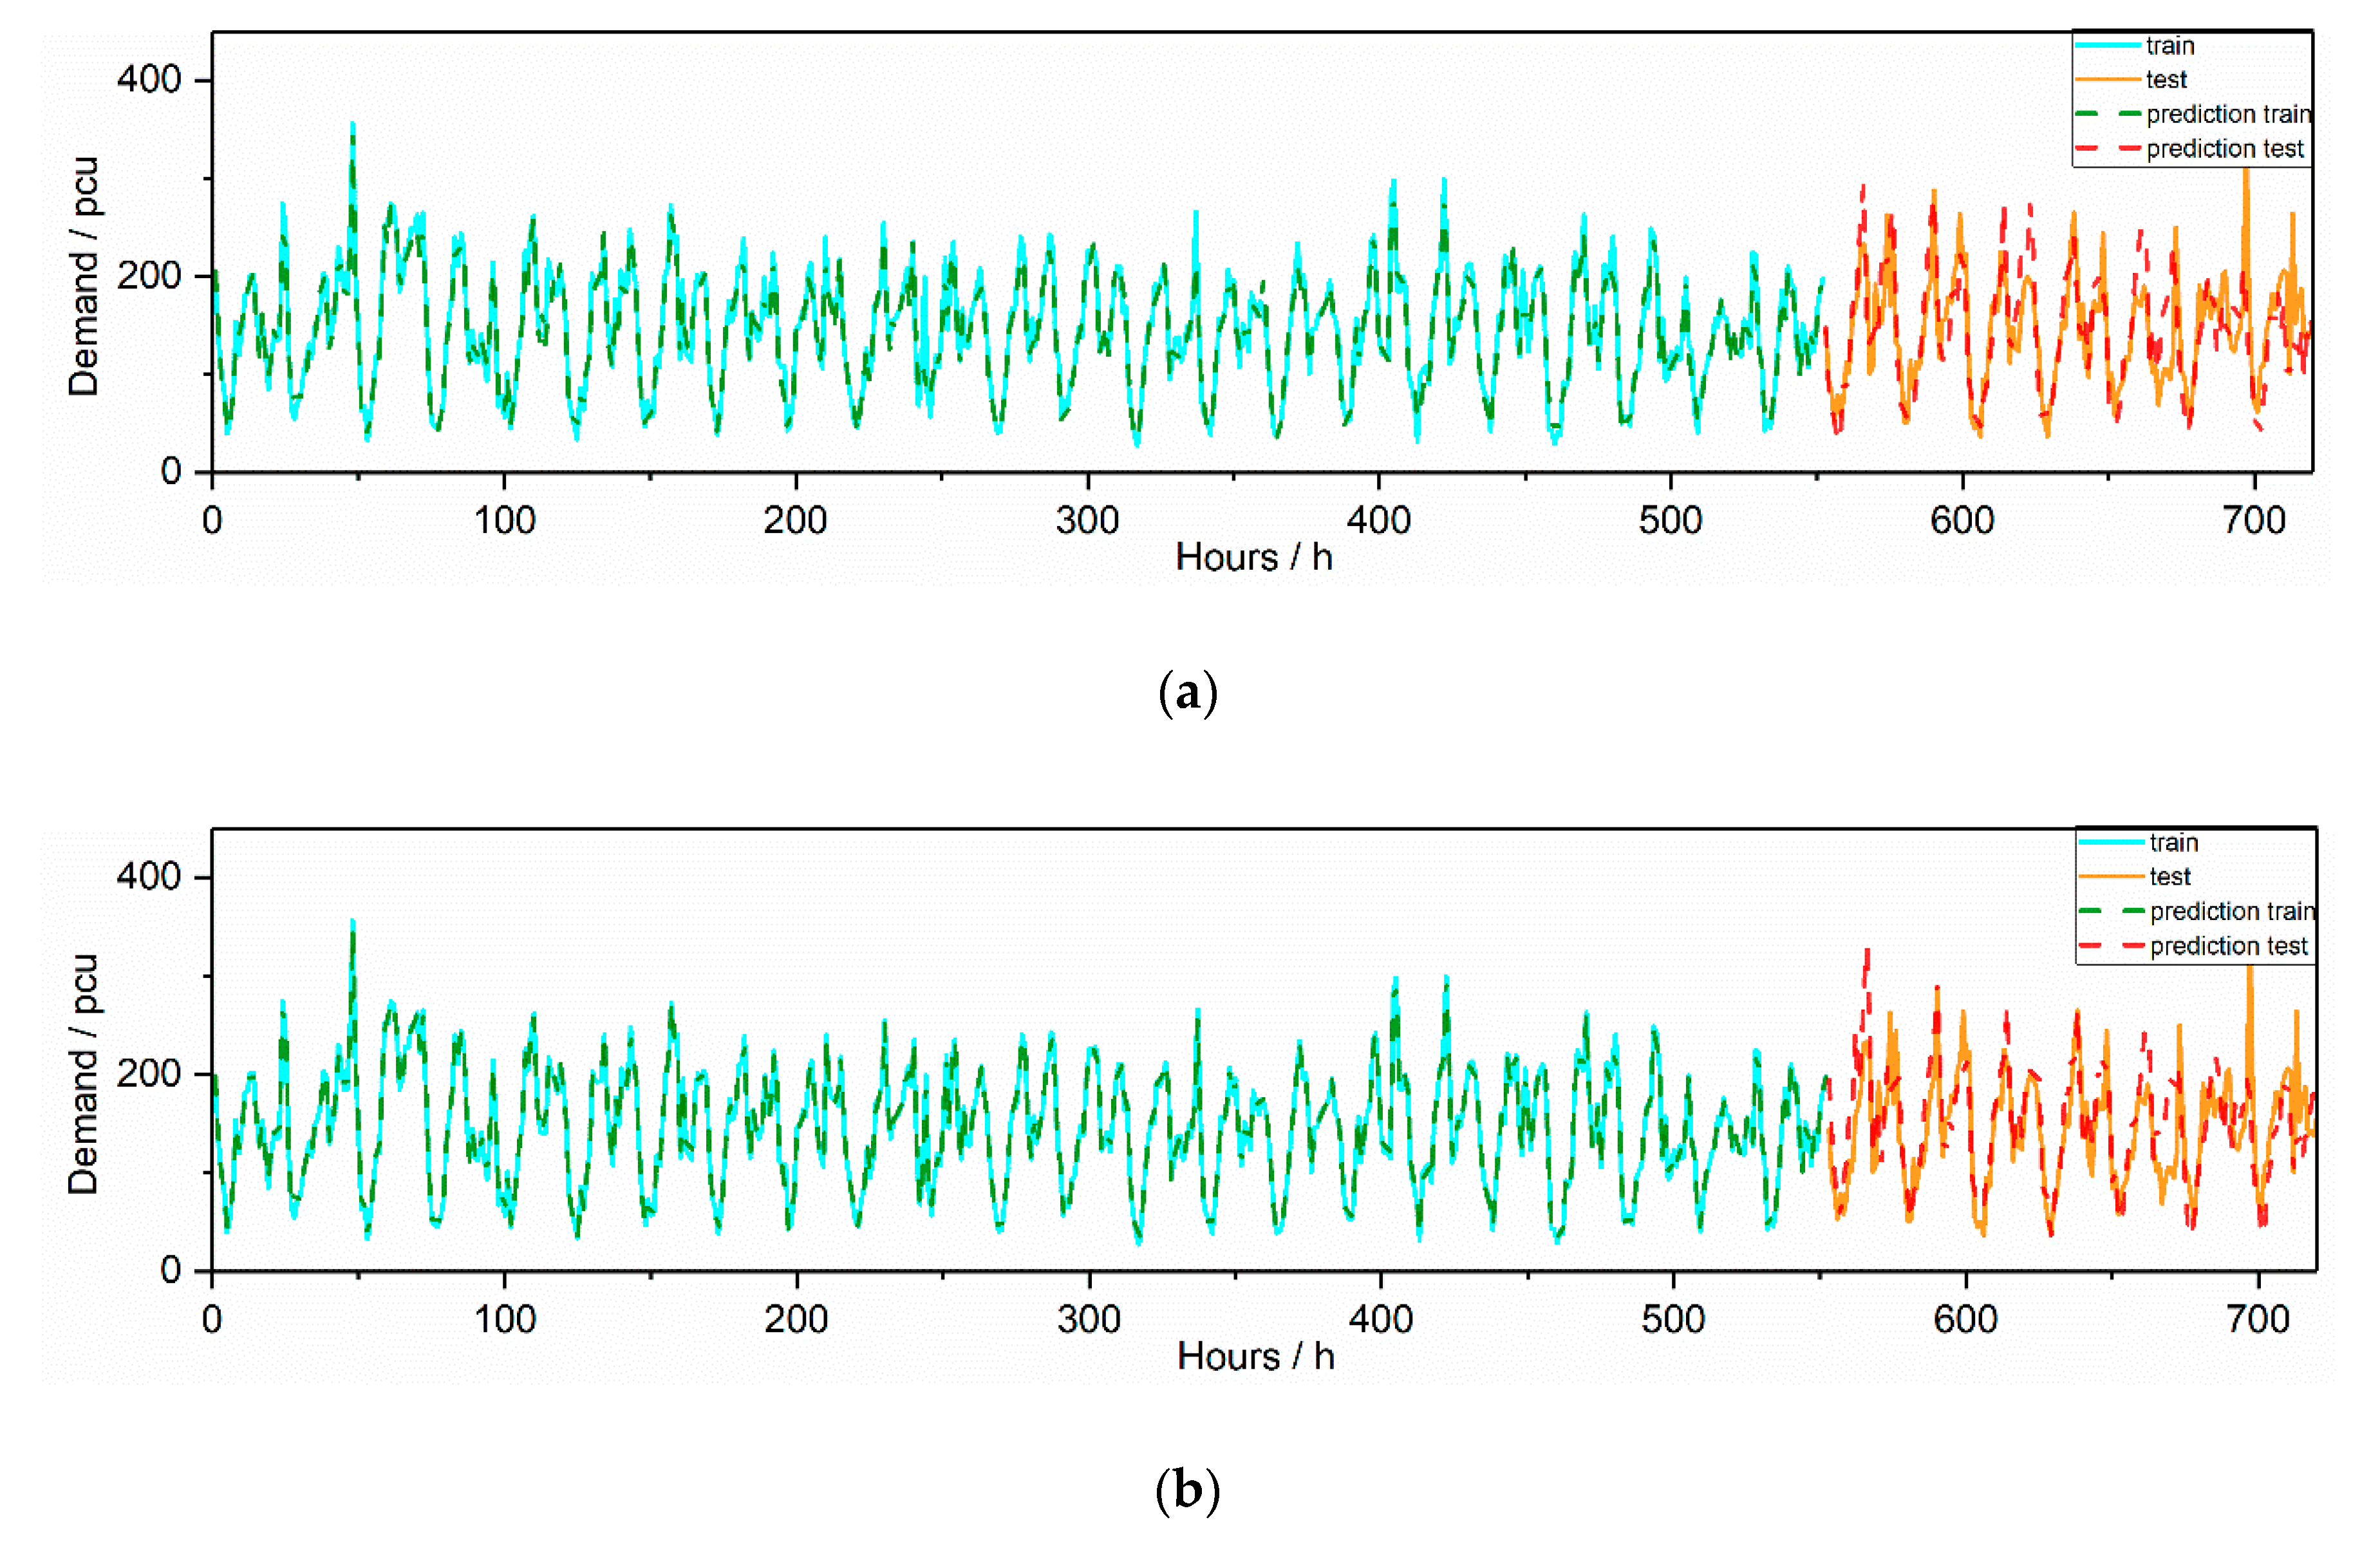
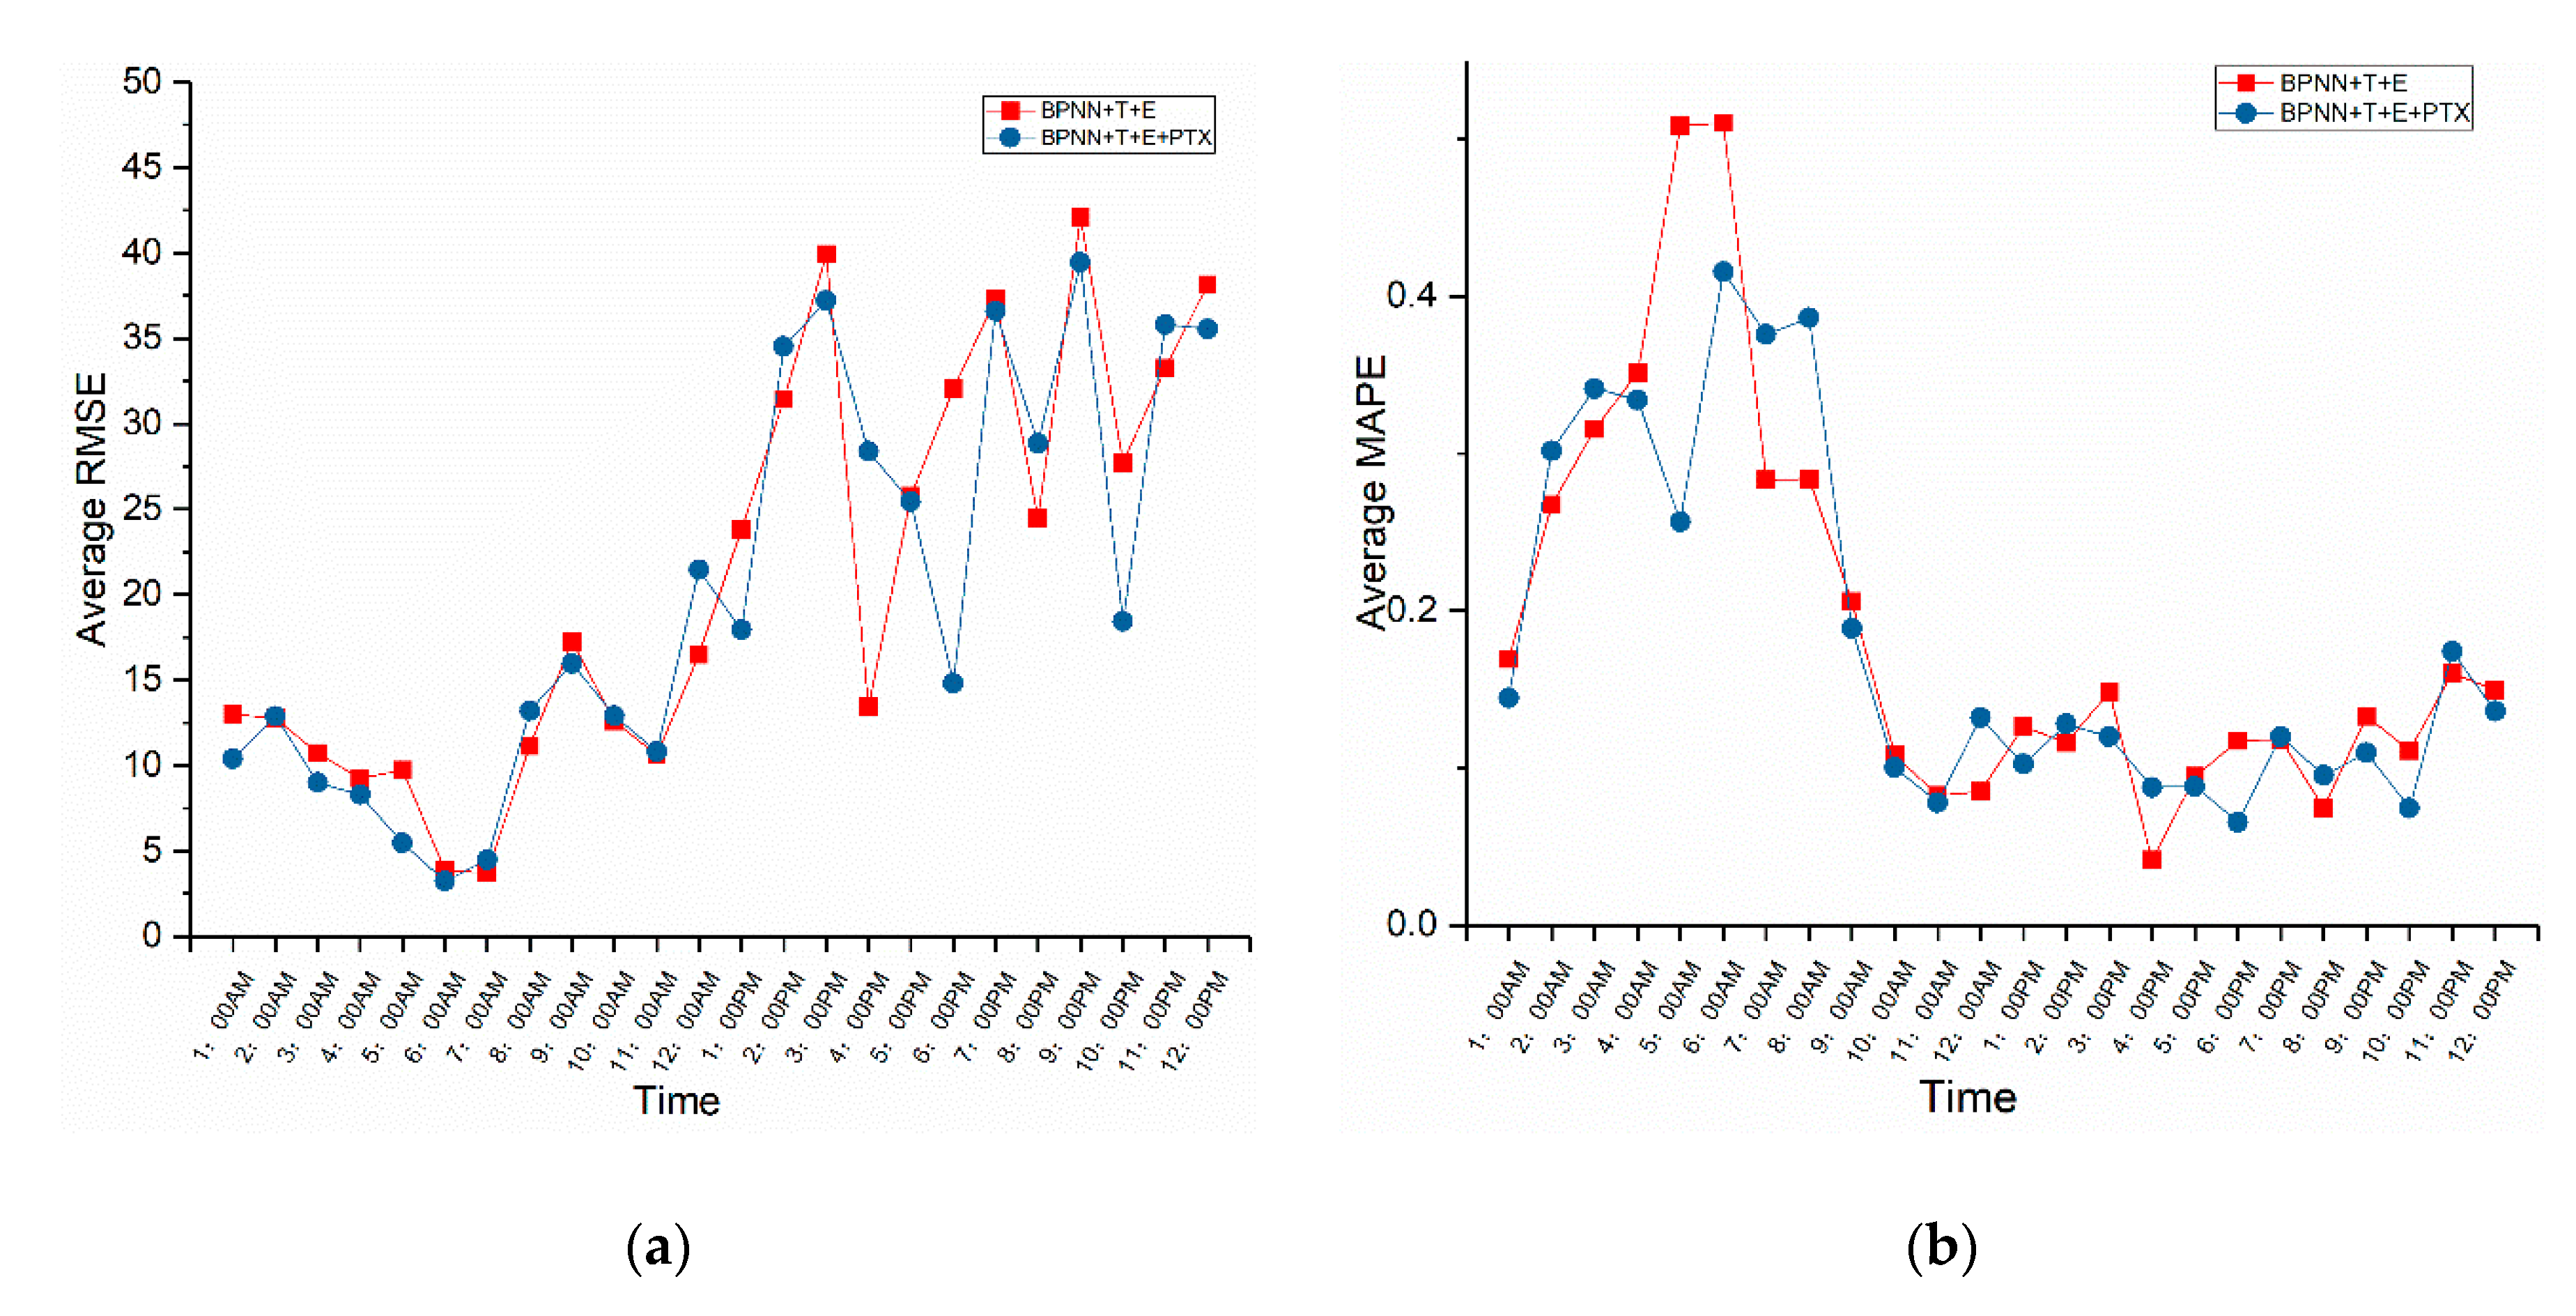
- We found that the model “BPNN + T + E + TX” is available for forecasting online taxi-hailing demand. The performance of the model, which includes information of “PTX”, is better than the model “BPNN + T + E”, but its accuracy is lower than the model “BPNN + T + E + TX”. Compared with the model “BPNN + T + E”, including the information of “PTX” leads to a reduction of MAPE from 0.190 to 0.183 and an RMSE reduction from 23.921 to 21.050, and it increases from 0.845 to 0.853. This indicates that considering the information of “PTX” improves the predictability of online taxi-hailing demand. However, due to a reduction in the accuracy of “PTX”, the performance of the model “BPNN + T + E + TX” is better than the model “BPNN + T + E + PTX”.
6.2. Conclusions
Author Contributions
Funding
Acknowledgments
Conflicts of Interest
References
- Chang, H.-W.; Tai, Y.-C.; Hsu, J.Y.-J. Context-aware taxi demand hotspots prediction. Int. J. Bus. Intell. Data Min. 2010, 5, 3–18. [Google Scholar] [CrossRef]
- Moreira-Matias, L.; Gama, J.; Ferreira, M.; Damas, L. A predictive model for the passenger demand on a taxi network. In Proceedings of the 2012 15th International IEEE Conference on Intelligent Transportation Systems, Anchorage, AK, USA, 16–19 September 2012; pp. 1014–1019. [Google Scholar]
- Moreira-Matias, L.; Gama, J.; Ferreira, M.; Mendes-Moreira, J.; Damas, L. On Predicting the Taxi-Passenger Demand: A Real-Time Approach. In Portuguese Conference on Artificial Intelligence; Springer: Berlin/Heidelberg, Germany, 2013; pp. 54–65. [Google Scholar]
- Moreira-Matias, L.; Gama, J.; Ferreira, M.; Mendes-Moreira, J.; Damas, L. Predicting Taxi–Passenger Demand Using Streaming Data. IEEE Trans. Intell. Trans. Syst. 2013, 14, 1393–1402. [Google Scholar] [CrossRef]
- Zhang, K.; Feng, Z.; Chen, S.; Huang, K.; Wang, G. A Framework for Passengers Demand Prediction and Recommendation. In Proceedings of the 2016 IEEE International Conference on Services Computing (SCC), San Francisco, CA, USA, 27 June–2 July 2016; pp. 340–347. [Google Scholar]
- Jagannathan, N.D.G.R.K. A Multi-Level Clustering Approach for Forecasting Taxi Trip demand. In Proceedings of the IEEE 19th International Conference on Intelligent Transportation Systems (ITSC), Rio de Janeiro, Brazil, 1–4 November 2016; pp. 223–228. [Google Scholar]
- Peng, X.; Pan, Y.; Luo, J. Predicting high taxi demand regions using social media check-ins. In Proceedings of the 2017 IEEE International Conference on Big Data (Big Data), Boston, MA, USA, 11–14 December 2017; pp. 2066–2075. [Google Scholar]
- Zhao, K.; Khryashchev, D.; Freire, J.; Silva, C.; Vo, H. Predicting taxi demand at high spatial resolution: Approaching the limit of predictability. In Proceedings of the 2016 IEEE International Conference on Big Data (Big Data), Washington, DC, USA, 5–8 December 2016; pp. 833–842. [Google Scholar]
- Xu, J.; Rahmatizadeh, R.; Boloni, L.; Turgut, D. A Sequence Learning Model with Recurrent Neural Networks for Taxi Demand Prediction. In Proceedings of the 2017 IEEE 42nd Conference on Local Computer Networks (LCN), Singapore, 9-12 October 2017; pp. 261–268. [Google Scholar]
- Zhang, D.; He, T.; Lin, S.; Munir, S.; Stankovic, J.A. Taxi-Passenger-Demand Modeling Based on Big Data from a Roving Sensor Network. IEEE Trans. Big Data 2017, 3, 362–374. [Google Scholar] [CrossRef]
- Bao, Y.; Sun, Y.-E.; Bu, X.; Du, Y.; Wu, X.; Huang, H.; Luo, Y.; Huang, L. How Do Metro Station Crowd Flows Influence the Taxi Demand Based on Deep Spatial-Temporal Network? In Proceedings of the 2018 14th International Conference on Mobile Ad-Hoc and Sensor Networks (MSN), Shenyang, China, 6–8 December 2018; pp. 188–192. [Google Scholar]
- Davis, N.; Raina, G.; Jagannathan, K. Taxi Demand Forecasting: A HEDGE-Based Tessellation Strategy for Improved Accuracy. IEEE Trans. Intell. Transp. Syst. 2018, 19, 3686–3697. [Google Scholar] [CrossRef]
- Markou, I.; Rodrigues, F.; Pereira, F.C. Real-Time Taxi Demand Prediction using data from the web. In Proceedings of the 2018 21st International Conference on Intelligent Transportation Systems (ITSC), Maui, HI, USA, 4–7 November 2018; pp. 1664–1671. [Google Scholar]
- Ishiguro, S.; Kawasaki, S.; Fukazawa, Y. Taxi Demand Forecast Using Real-Time Population Generated from Cellular Networks. In Proceedings of the 2018 ACM International Joint Conference and 2018 International Symposium on Pervasive and Ubiquitous Computing and Wearable Computers—UbiComp ’18, Singapore, 8–12 October 2018; pp. 1024–1032. [Google Scholar]
- Liao, S.; Zhou, L.; Di, X.; Yuan, B.; Xiong, J. Large-scale short-term urban taxi demand forecasting using deep learning. In Proceedings of the 2018 23rd Asia and South Pacific Design Automation Conference (ASP-DAC), Jeju, Korea, 22–25 January 2018; pp. 428–433. [Google Scholar]
- Vanichrujee, U.; Horanont, T.; Pattara-Atikom, W.; Theeramunkong, T.; Shinozaki, T. Taxi Demand Prediction using Ensemble Model Based on RNNs and XGBOOST. In Proceedings of the 2018 International Conference on Embedded Systems and Intelligent Technology & International Conference on Information and Communication Technology for Embedded Systems (ICESIT-ICICTES), Khon Kaen, Thailand, 7–9 May 2018; pp. 1–6. [Google Scholar]
- Xu, J.; Rahmatizadeh, R.; Boloni, L.; Turgut, D. Real-Time Prediction of Taxi Demand Using Recurrent Neural Networks. IEEE Trans. Intell. Transp. Syst. 2018, 19, 2572–2581. [Google Scholar] [CrossRef]
- Yao, H.; Wu, F.; Ke, J.; Tang, X.; Jia, Y.; Lu, S.; Gong, P.; Ye, J.; Chuxing, D.; Li, Z. Deep Multi-View Spatial-Temporal Network for Taxi Demand Prediction. In Proceedings of the Thirty-Second AAAI Conference on Artificial Intelligence, New Orleans, LA, USA, 2–7 February 2018; pp. 2588–2595. [Google Scholar]
- Zhang, W.; Ukkusuri, S.; Yang, C. Modeling the Taxi Drivers’ Customer-Searching Behaviors outside Downtown Areas. Sustainability 2018, 10, 3003. [Google Scholar] [CrossRef]
- Yan, H.; Zhang, Z.; Zou, J. An online spatio-temporal model for inference and predictions of taxi demand. In Proceedings of the 2017 IEEE International Conference on Big Data (Big Data), Boston, MA, USA, 11–14 December 2017; pp. 3550–3557. [Google Scholar]
- Kuang, L.; Yan, X.; Tan, X.; Li, S.; Yang, X. Predicting Taxi Demand Based on 3D Convolutional Neural Network and Multi-task Learning. Remote Sens. 2019, 11, 1265. [Google Scholar] [CrossRef]
- Liu, L.; Qiu, Z.; Li, G.; Wang, Q.; Ouyang, W.; Lin, L. Contextualized Spatial–Temporal Network for Taxi Origin-Destination Demand Prediction. IEEE Trans. Intell. Transp. Syst. 2019, 20, 3875–3887. [Google Scholar] [CrossRef]
- Markou, I.; Kaiser, K.; Pereira, F.C. Predicting taxi demand hotspots using automated Internet Search Queries. Transp. Res. Part C Emerg. Technol. 2019, 102, 73–86. [Google Scholar] [CrossRef]
- Qiu, Z.; Liu, L.; Li, G.; Wang, Q.; Xiao, N.; Lin, L. Taxi Origin-Destination Demand Prediction with Contextualized Spatial-Temporal Network. In Proceedings of the 2019 IEEE International Conference on Multimedia and Expo (ICME), Shanghai, China, 8–12 July 2019; pp. 760–765. [Google Scholar]
- Rodrigues, F.; Markou, I.; Pereira, F.C. Combining time-series and textual data for taxi demand prediction in event areas: A deep learning approach. Inf. Fusion 2019, 49, 120–129. [Google Scholar] [CrossRef]
- Terroso-Saenz, F.; Munoz, A.; Cecilia, J.M. QUADRIVEN: A Framework for Qualitative Taxi Demand Prediction Based on Time-Variant Online Social Network Data Analysis. Sensors 2019, 19, 4882. [Google Scholar] [CrossRef] [PubMed]
- Xu, Y.; Li, D. Incorporating Graph Attention and Recurrent Architectures for City-Wide Taxi Demand Prediction. ISPRS Int. J. Geo-Inf. 2019, 8, 414. [Google Scholar] [CrossRef]
- Yu, H.; Chen, X.; Li, Z.; Zhang, G.; Liu, P.; Yang, J.; Yang, Y. Taxi-Based Mobility Demand Formulation and Prediction Using Conditional Generative Adversarial Network-Driven Learning Approaches. IEEE Trans. Intell. Transp. Syst. 2019, 20, 3888–3899. [Google Scholar] [CrossRef]
- Liu, X.; Sun, L.; Sun, Q.; Gao, G. Spatial Variation of Taxi Demand Using GPS Trajectories and POI Data. J. Adv. Trans. 2020, 2020, 7621576. [Google Scholar] [CrossRef]
- Saadallah, A.; Moreira-Matias, L.; Sousa, R.; Khiari, J.; Jenelius, E.; Gama, J. BRIGHT—Drift-Aware Demand Predictions for Taxi Networks. IEEE Trans. Knowl. Data Eng. 2020, 32, 234–245. [Google Scholar] [CrossRef]
- Safikhani, A.; Kamga, C.; Mudigonda, S.; Faghih, S.S.; Moghimi, B. Spatio-temporal modeling of yellow taxi demands in New York City using generalized STAR models. Int. J. Forecast. 2020, 36, 1138–1148. [Google Scholar] [CrossRef]
- Liu, Z.; Chen, H.; Li, Y.; Zhang, Q. Taxi Demand Prediction Based on a Combination Forecasting Model in Hotspots. J. Adv. Trans. 2020, 2020, 1302586. [Google Scholar] [CrossRef]
- Wang, Z.; Luo, P.; Cheng, L.; Zhang, S.; Shen, J. Hapten-antibody recognition studies in competitive immunoassay of alpha-zearalanol analogs by computational chemistry and Pearson Correlation analysis. J. Mol. Recognit. 2011, 24, 815–823. [Google Scholar] [CrossRef]
- Rajabi-Kiasari, S.; Hasanlou, M. An efficient model for the prediction of SMAP sea surface salinity using machine learning approaches in the Persian Gulf. Int. J. Remote Sens. 2020, 41, 3221–3242. [Google Scholar] [CrossRef]
- Wang, J.-Z.; Wang, J.-J.; Zhang, Z.-G.; Guo, S.-P. Forecasting stock indices with back propagation neural network. Expert Syst. Appl. 2011, 38, 14346–14355. [Google Scholar] [CrossRef]
- Selbesoglu, M.O. Spatial Interpolation of GNSS Troposphere Wet Delay by a Newly Designed Artificial Neural Network Model. Appl. Sci. 2019, 9, 4688. [Google Scholar] [CrossRef]
- Karsoliya, S. Approximating Number of Hidden layer neurons in Multiple Hidden Layer BPNN Architecture. Int. J. Eng. Trends Technol. 2012, 3, 714–717. [Google Scholar]
- Liu, Y.; Jiang, W.; Zhang, X. Research on Optimized Energy Scheduling of Rural Microgrid. Appl. Sci. 2019, 9, 4641. [Google Scholar] [CrossRef]



| Field | Type | Sample | Comment |
|---|---|---|---|
| License plate number | String | BMvCh8nxqktd xniovIFuns | Anonymized |
| Time | String | 1 November 2016 00:01:35 | Time |
| Longitude | String | 108.908109 | WGS84 Coordinate System |
| Latitude | String | 34.235744 | WGS84 Coordinate System |
| Vehicle state | String | 1 | 0: Without passenger 1: With passenger |
| Field | Type | Sample | Comment |
|---|---|---|---|
| Driver ID | String | glox.jrrlltBMvCh8n xqktdr2dtopmlH | Anonymized |
| Order ID | String | jkkt8kxniovIFuns9q rrlvst@iqnpkwz | Anonymized |
| Time Stamp | String | 1478223613 (4 November 2016 09:40:13) | Unix timestamp, in seconds |
| Longitude | String | 104.04392 | GCJ-02 Coordinate System |
| Latitude | String | 34.04392 | GCJ-02 Coordinate System |
| Data | Indicators | Description |
|---|---|---|
| Air quality data | AQI | Air Quality Index |
| CO | The concentration of CO (μg/m3) | |
| NO2 | The concentration of NO2 (μg/m3) | |
| O3 | The concentration of O3 (μg/m3) | |
| PM2.5 | The concentration of PM2.5 (μg/m3) | |
| PM10 | The concentration of PM10 (μg/m3) | |
| SO2 | The concentration of SO2 (μg/m3) | |
| Meteorological data | W | Weather. 1: Sunny 2: Cloudy 3: Raining 4: Haze |
| WS | Wind speed (m/s) | |
| TEM | Temperature (°C) | |
| SSD | Sunshine duration (h) | |
| PRE | Precipitation (mm) | |
| TG | Sensible temperature (°C) | |
| VIS | Horizontal visibility (m) |
| OT | DW | HD | WON | AQI | PM2.5 | PM10 | SO2 | NO2 | CO | |
|---|---|---|---|---|---|---|---|---|---|---|
| OT | 1 | 0.23 | 0.79 | 0.22 | 0.06 | 0.06 | 0.07 | 0.02 | 0.08 | 0.08 |
| DW | 0.23 | 1 | 0 | 0.79 | 0.29 | 0.28 | 0.34 | 0.13 | 0.36 | 0.4 |
| HD | 0.79 | 0 | 1 | 0.11 | 0.05 | 0.07 | 0.09 | 0.05 | 0.14 | 0.12 |
| WON | 0.22 | 0.79 | 0.11 | 1 | 0.13 | 0.2 | 0.25 | 0.19 | 0.25 | 0.35 |
| AQI | 0.06 | 0.29 | 0.05 | 0.13 | 1 | 0.79 | 0.95 | 0.3 | 0.69 | 0.8 |
| PM2.5 | 0.06 | 0.28 | 0.07 | 0.2 | 0.79 | 1 | 0.7 | 0.46 | 0.8 | 0.88 |
| PM10 | 0.07 | 0.34 | 0.09 | 0.25 | 0.95 | 0.7 | 1 | 0.37 | 0.67 | 0.8 |
| SO2 | 0.02 | 0.13 | 0.05 | 0.19 | 0.3 | 0.46 | 0.37 | 1 | 0.46 | 0.5 |
| NO2 | 0.08 | 0.36 | 0.14 | 0.25 | 0.69 | 0.8 | 0.67 | 0.46 | 1 | 0.91 |
| CO | 0.08 | 0.4 | 0.12 | 0.35 | 0.8 | 0.88 | 0.8 | 0.5 | 0.91 | 1 |
| O3 | −0.18 | −0.25 | 0.07 | −0.15 | −0.35 | −0.53 | −0.35 | −0.34 | −0.36 | −0.47 |
| W | −0.02 | −0.17 | 0 | −0.2 | 0.31 | 0.51 | 0.16 | 0.15 | 0.23 | 0.3 |
| WS | 0.11 | −0.04 | 0.1 | 0.02 | −0.02 | 0.13 | −0.01 | 0.48 | 0.04 | 0 |
| TEM | −0.39 | −0.07 | −0.38 | −0.06 | 0.01 | 0.02 | −0.06 | −0.36 | 0 | 0.04 |
| RHU | 0.41 | 0.13 | 0.34 | 0.19 | 0.08 | 0.15 | 0.11 | −0.11 | 0.18 | 0.2 |
| PRE | 0.02 | −0.02 | 0 | −0.02 | −0.04 | −0.03 | −0.05 | −0.05 | −0.06 | −0.03 |
| SSD | 0.06 | 0.22 | 0 | 0.18 | −0.09 | −0.29 | 0.07 | 0 | 0.19 | 0.03 |
| TG | −0.23 | −0.03 | −0.13 | −0.04 | −0.09 | −0.14 | −0.14 | −0.56 | −0.11 | −0.07 |
| VIS | −0.27 | −0.18 | −0.17 | −0.28 | −0.04 | −0.29 | −0.06 | −0.24 | −0.35 | −0.34 |
| TX | 0.52 | 0.06 | 0.5 | 0.01 | 0.01 | 0.02 | 0 | −0.04 | 0.04 | 0.02 |
| O3 | W | WS | TEM | RHU | PRE | SSD | TG | VIS | TX | |
| OT | −0.18 | −0.02 | 0.11 | −0.39 | 0.41 | 0.02 | 0.06 | −0.23 | −0.27 | 0.52 |
| DW | −0.25 | −0.17 | −0.04 | −0.07 | 0.13 | −0.02 | 0.22 | −0.03 | −0.18 | 0.06 |
| HD | 0.07 | 0 | 0.1 | −0.38 | 0.34 | 0 | 0 | −0.13 | −0.17 | 0.5 |
| WON | −0.15 | −0.2 | 0.02 | −0.06 | 0.19 | −0.02 | 0.18 | −0.04 | −0.28 | 0.01 |
| AQI | −0.35 | 0.31 | −0.02 | 0.01 | 0.08 | −0.04 | −0.09 | −0.09 | −0.04 | 0.01 |
| PM2.5 | −0.53 | 0.51 | 0.13 | 0.02 | 0.15 | −0.03 | −0.29 | −0.14 | −0.29 | 0.02 |
| PM10 | −0.35 | 0.16 | −0.01 | −0.06 | 0.11 | −0.05 | 0.07 | −0.14 | −0.06 | 0 |
| SO2 | −0.34 | 0.15 | 0.48 | −0.36 | −0.11 | −0.05 | 0 | −0.56 | −0.24 | −0.04 |
| NO2 | −0.36 | 0.23 | 0.04 | 0 | 0.18 | −0.06 | 0.19 | −0.11 | −0.35 | 0.04 |
| CO | −0.47 | 0.3 | 0 | 0.04 | 0.2 | −0.03 | 0.03 | −0.07 | −0.34 | 0.02 |
| O3 | 1 | −0.02 | 0.02 | −0.06 | −0.13 | −0.08 | 0.27 | −0.02 | 0.17 | −0.02 |
| W | −0.02 | 1 | 0.06 | 0.04 | 0.08 | −0.03 | −0.51 | −0.07 | −0.19 | −0.05 |
| WS | 0.02 | 0.06 | 1 | −0.53 | −0.2 | −0.07 | −0.14 | −0.68 | −0.02 | 0.01 |
| TEM | −0.06 | 0.04 | −0.53 | 1 | −0.22 | 0.03 | −0.08 | 0.8 | 0.13 | −0.2 |
| RHU | −0.13 | 0.08 | −0.2 | −0.22 | 1 | 0.11 | 0.09 | 0.12 | −0.72 | 0.27 |
| PRE | −0.08 | −0.03 | −0.07 | 0.03 | 0.11 | 1 | −0.03 | 0.07 | −0.01 | 0.05 |
| SSD | 0.27 | −0.51 | −0.14 | −0.08 | 0.09 | −0.03 | 1 | 0.05 | −0.05 | 0.03 |
| TG | −0.02 | −0.07 | −0.68 | 0.8 | 0.12 | 0.07 | 0.05 | 1 | 0.01 | −0.13 |
| VIS | 0.17 | −0.19 | −0.02 | 0.13 | −0.72 | −0.01 | −0.05 | 0.01 | 1 | −0.16 |
| TX | −0.02 | −0.05 | 0.01 | −0.2 | 0.27 | 0.05 | 0.03 | −0.13 | −0.16 | 1 |
| Information | Indicators | Description |
|---|---|---|
| T | DW | Day of the week. DW is in (1, 7). |
| HD | Hour of day. HD is in (1, 24). | |
| WON | Workday or non-workday. Workday: 0; Non-workday: 1. | |
| E | WS | Wind speed (m/s). |
| TEM | Temperature (°C). | |
| RHU | Relative humidity (%). | |
| TG | Sensible temperature (°C). | |
| VIS | Horizontal visibility (m). | |
| TX | TX | Taxi demand (pcu). |
| Model | Model Input | Model Output |
|---|---|---|
| Model BPNN + T | Time data | Next week’s demand |
| Model BPNN + T + E | Time data + Environmental data | Next week’s demand |
| Model BPNN + T + TX | Time data + Environmental data + Taxi data | Next week’s demand |
| Model XGB + T | Time data | Next week’s demand |
| Model XGB + T + E | Time data + Environmental data | Next week’s demand |
| Model XGB + T + TX | Time data + Environmental data + Taxi data | Next week’s demand |
| Model | Hyperparameters | Value | Optimal Value |
|---|---|---|---|
| Model BPNN + T | m (hidden neurons) | {1, 2, …, 100} | 67 |
| n (hidden layers) | {1, 2, 3, 4} | 3 | |
| activation | {‘identity’, ‘logistic’, ‘tanh’, ‘relu’} | ‘relu’ | |
| Model BPNN + T + E | m (hidden neurons) | {1, 2, …, 100} | 89 |
| n (hidden layers) | {1, 2, 3, 4} | 3 | |
| activation | {‘identity’, ‘logistic’, ‘tanh’, ‘relu’} | ‘relu’ | |
| Model BPNN + T + TX | m (hidden neurons) | {1, 2, …, 100} | 88 |
| n (hidden layers) | {1, 2, 3, 4} | 3 | |
| activation | {‘identity’, ‘logistic’, ‘tanh’, ‘relu’} | ‘relu’ | |
| Model XGB + T | gamma | {0.1, 0.2, 0.3, 0.4, 0.5, 0.6} | 0.4 |
| learning_rate | {0.1, 0.2, 0.3, 0.4, 0.5, 0.6} | 0.4 | |
| max_depth | {1, 2, …, 50} | 13 | |
| min_child_weight | {1, 2, …, 50} | 12 | |
| n_estimators | {1, 2, …, 100} | 48 | |
| Model XGB + T + E | gamma | {0.1, 0.2, 0.3, 0.4, 0.5, 0.6} | 0.4 |
| learning_rate | {0.1, 0.2, 0.3, 0.4, 0.5, 0.6} | 0.3 | |
| max_depth | {1, 2, …, 50} | 11 | |
| min_child_weight | {1, 2, …, 50} | 12 | |
| n_estimators | {1, 2, …, 100} | 38 | |
| Model XGB + T + TX | gamma | {0.1, 0.2, 0.3, 0.4, 0.5, 0.6} | 0.4 |
| learning_rate | {0.1, 0.2, 0.3, 0.4, 0.5, 0.6} | 0.3 | |
| max_depth | {1, 2, …, 50} | 11 | |
| min_child_weight | {1, 2, …, 50} | 11 | |
| n_estimators | {1, 2, …, 100} | 45 |
| Models | Training Set | Testing Set | ||||
|---|---|---|---|---|---|---|
| MAPE | RMSE | MAPE | RMSE | |||
| BPNN + T | 0.213 | 26.972 | 0.842 | 0.224 | 28.576 | 0.819 |
| BPNN + T + E | 0.178 | 23.692 | 0.851 | 0.190 | 23.921 | 0.845 |
| BPNN + T + E + TX | 0.127 | 18.632 | 0.893 | 0.132 | 18.696 | 0.866 |
| XGB + T | 0.302 | 24.701 | 0.836 | 0.333 | 26.296 | 0.833 |
| XGB + T + E | 0.188 | 19.718 | 0.872 | 0.197 | 21.206 | 0.857 |
| XGB + T + E + TX | 0.129 | 17.797 | 0.887 | 0.139 | 19.193 | 0.865 |
| Models | Training Set | Testing Set | ||||
|---|---|---|---|---|---|---|
| MAPE | RMSE | MAPE | RMSE | |||
| BPNN + T + E | 0.177 | 31.812 | 0.874 | 0.185 | 32.860 | 0.851 |
| XGB + T + E | 0.204 | 37.625 | 0.747 | 0.213 | 37.754 | 0.713 |
| Models | Training Set | Testing Set | ||||
|---|---|---|---|---|---|---|
| MAPE | RMSE | MAPE | RMSE | |||
| BPNN + T + E | 0.178 | 23.692 | 0.851 | 0.190 | 23.921 | 0.845 |
| BPNN + T + E + PTX | 0.169 | 19.325 | 0.869 | 0.183 | 21.050 | 0.853 |
| BPNN + T + E + TX | 0.127 | 18.632 | 0.893 | 0.132 | 18.696 | 0.866 |
© 2020 by the authors. Licensee MDPI, Basel, Switzerland. This article is an open access article distributed under the terms and conditions of the Creative Commons Attribution (CC BY) license (http://creativecommons.org/licenses/by/4.0/).
Share and Cite
Liu, Z.; Chen, H.; Sun, X.; Chen, H. Data-Driven Real-Time Online Taxi-Hailing Demand Forecasting Based on Machine Learning Method. Appl. Sci. 2020, 10, 6681. https://doi.org/10.3390/app10196681
Liu Z, Chen H, Sun X, Chen H. Data-Driven Real-Time Online Taxi-Hailing Demand Forecasting Based on Machine Learning Method. Applied Sciences. 2020; 10(19):6681. https://doi.org/10.3390/app10196681
Chicago/Turabian StyleLiu, Zhizhen, Hong Chen, Xiaoke Sun, and Hengrui Chen. 2020. "Data-Driven Real-Time Online Taxi-Hailing Demand Forecasting Based on Machine Learning Method" Applied Sciences 10, no. 19: 6681. https://doi.org/10.3390/app10196681
APA StyleLiu, Z., Chen, H., Sun, X., & Chen, H. (2020). Data-Driven Real-Time Online Taxi-Hailing Demand Forecasting Based on Machine Learning Method. Applied Sciences, 10(19), 6681. https://doi.org/10.3390/app10196681


