Abstract
Almonds are nutrient-rich nuts. Due to their high level of consumption and relatively high price, their production is targeted for illegal practices, with the intention of earning more profit. The most common adulterants are based on superficial matching, and as an adulterant, the apricot kernel is comparatively inexpensive and almost identical in color, texture, odor, and other physicochemical characteristics to almonds. In this study, a near-infrared hyperspectral imaging (NIR-HSI) system in the wavelength range of 900–1700 nm synchronized with a conveyor belt was used for the online detection of added apricot kernels in almonds. A total of 448 samples from different varieties of almonds and apricot kernels (112 × 4) were scanned while the samples moved on the conveyor belt. The spectral data were extracted from each imaged nut and used to develop a partial least square discrimination analysis (PLS-DA) model coupled with different preprocessing techniques. The PLS-DA model displayed over a 97% accuracy for the validation set. Additionally, the beta coefficient obtained from the developed model was used for pixel-based classification. An image processing algorithm was developed for the chemical mapping of almonds and apricot kernels. Consequently, the obtained model was transferred for the online sorting of seeds. The online classification system feedback had an overall accuracy of 85% for the classification of nuts. However, the model presented a relatively low accuracy when evaluated in real-time for online application, which might be due to the rough distribution of samples on the conveyor belt, high speed, delaying time in suction, and lighting variations. Nevertheless, the developed online prototype (NIR-HSI) system combined with multivariate analysis exhibits strong potential for the classification of adulterated almonds, and the results indicate that the system can be effectively used for the high-throughput screening of adulterated almond nuts in an industrial environment.
1. Introduction
The almond (Prunus dulcis, Syn.) originated in Central Asia. It was later cultivated in a variety of countries and regions, such as the Mediterranean Basin, a large area of the Middle East, Southwestern Asia, and the USA, as well as in Australia [1]. According to reports in the years of 2014–2015, the total almond production based on kernels was 1077.00 metric tons (MT) worldwide, with 77.43% of almonds being produced in the USA, followed by Australia with 7.8% and Spain with 4.4%, as reported by the International Nut and Dried Fruit Council [2]. Among the nut species, almonds are the most widely produced [3]. Almonds are used for different purposes across the world, for instance, as a snack food, in milk production, in bakeries, and as a diet supplement [4].
Almonds have high prices, and the increase of these prices each year leads to the illegal adulteration of almonds with cheap nuts for profit. The most common adulterants of commercial ground almonds are apricot kernels, and the physical and other characteristics of almond and apricot kernel oils are so similar that it is difficult to detect adulteration, unless it is of a gross nature [5]. The adulteration of almond oil with apricot oil was detected through the determination of tocopherols using Gas Chromatography [6], and chromatographic fingerprinting with multivariate data analysis was used for the detection and quantification of apricot kernels in almond powder [7]. Recent sources have indicated the adulteration of almonds with apricot kernels, which were then sold at almond prices. However, there is no study in the academic area investigating the adulteration of almonds with apricot kernels. Global News was published in 2017 with the title of “Health Canada: Apricot kernels look like almonds, but can cause cyanide poisoning”. Canadians eat the seeds as snacks and are warned in the article about the use of apricot kernels to adulterate almonds. It is also explained that apricot kernels are more commonly sold at Asian grocery stores, and consumers should take care to identify products if the labeling is in another language. The possibility exists for apricot kernels to be labeled as almonds or dried almonds [8]. The other source, which is named My Own Chinese Brocade [9], with the title of “My Life in China” and published in 2017, illustrates that peeled almond kernels are usually not almonds, but rather apricot kernels that look like almonds. As reported in Germany [10], apricots are used as substitutes in almonds due to the two having similar flavors. Recent reports indicate that the Canadian government [11] reminded Canadians to limit their consumption of apricot kernels because of the risk of cyanide poisoning and indicated the resemblances between apricots and almonds, including that they both have the same taste. This report also mentioned that the seeds are typically sold in Asian grocery stores, making it difficult for consumers to identify them if they are not labeled.
Apricot kernels contain a significant amount of amygdalin, which is a naturally occurring compound that is converted to highly toxic cyanide during digestion. Therefore, ANSES (Agency for Food, Environmental and Occupational Health and Safety) reminds consumers that the quantities of kernels not to be exceeded per day, as set by the European Food Safety Authority (EFSA), is equal to around 1–3 kernels for adults and half a small kernel for young children [12]. Additionally, ANSES points out that apricot kernels are marketed as a cancer-fighting food. However, there is no scientific evidence of their value in curative or preventive cancer treatment. Moreover, consuming high doses of these kernels can lead to symptoms of acute poisoning, such as convulsions, respiratory problems, a decreased heart rate, a loss of consciousness, and even coma. Some high-profile incidents have been reported to have been caused by apricot seeds, such as severe cyanide poisoning from an alternative medicine treatment with amygdalin and apricot kernels in a 4-year-old child [13]. Another study reported that multiple cases of cyanide poisoning threatened several children’s lives in Gaza after they consumed apricot kernels [14]. This study reports that the first incident involved eight children, who exhibited typical signs and symptoms of cyanide poisoning two hours after having ingested a large number of apricot kernels. Seven children recovered and one died soon after admission. The second incident involved 16 children who had eaten a sweet prepared from such kernels. Thirteen children recovered, two died shortly after admission, and a third child died two hours later. Therefore, it is essential to classify adulterated nuts from almond kernels postharvest and before processing for markets.
As there are no online application systems available for the inspection of adulterated nuts in almonds, the aim of this study was to develop an online application based on hyperspectral imaging (HSI). Hyperspectral imaging is one of the most feasible methods that can be employed for the discrimination of seeds based on their internal factors on a large scale. It integrates the power of spectroscopy and digital imaging by simultaneously acquiring the spectral and spatial information from a sample scene and producing integrated chemical/physical data, as well as the spatial distribution [15]. Consequently, it is considered to be the most practical and relevant industrial detection method that can offer the fast, real-time, and non-destructive inspection of individual seeds. Previous studies have shown the potential of using HSI coupled with multivariate data analysis techniques for the quality analysis of agriculture products with different concepts, including the rapid assessment of corn seed viability using shortwave infrared line-scan hyperspectral imaging and chemometrics reported by [16], the total nitrogen concentration in almonds using HSI studied by [17], the rapid measurement of soybean seed viability using kernel-based multispectral image analysis reported by [18], the quality analysis of bell peppers based on HSI [19], and the prediction of the viability and vigor in muskmelon seeds [20]. Based on the above reports, HSI has a high potential for industrial application and the rapid real-time quality analysis of products. To the best of our knowledge, no study has reported using HSI for the rapid classification of adulterated almonds.
The aim of this study was to develop an industrial or large-scale application of HSI technology combined with multivariate classification partial least square discrimination analysis (PLS-DA) to distinguish between almond and apricot kernels based on NIR hyperspectral imaging in a real-time sorting system.
2. Materials and Methods
2.1. Sample Preparation
The experimental samples consisted of two varieties of almond kernels and two varieties of apricot seeds purchased from an authorized commercial food production company from Kabul, Afghanistan. Initially, the damaged kernels and foreign materials were removed from the samples. The first variety of almond kernels was named Qaharbai, and the second variety was named Kaf Samangan. Their chemical and physical characteristics were reported by [21], who reported the common adulterants with almost the same appearance and size of almond varieties (Agha Khani and Jangalaki). The detailed information was reported by the Perennial Horticulture Development Project [22], and these varieties were prepared for data collection. When the samples were imaged, each variety of adulterated almond could not be easily differentiated by the naked eye.
2.2. System Components and Data Acquisition
A line-scan (NIR) hyperspectral imaging system was used for the purpose of the fast and non-destructive screening of almond samples. All of the images acquired by the system were obtained by a line-scan push-broom hyperspectral camera (Pika NIR-640, Resonon, Bozeman, MT) equipped with a Near Infrared (NIR) imager covering the 900–1700 nm spectral range with a 2.5 nm resolution. A spectral channel of 328 and a spatial channel of 640 were covered by the camera. The system lighting consisted of two 100 W tungsten–halogen light sources (LS-F100HS, Seokwang optical, Korea) through optical fibers to line fittings (G(P)L30 × 1.0-1000F). Figure 1 displays the system components and data acquisition with a 10 rpm conveyor belt speed.
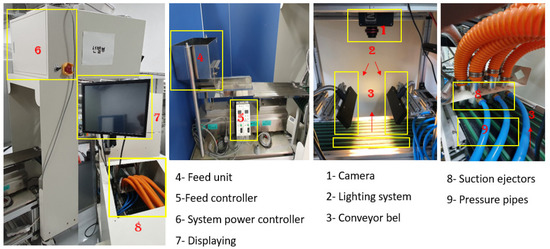
Figure 1.
The hyperspectral imaging prototype used for collecting data.
A graphical user interface was developed to control the prototype systems for data collection using MATLAB software. The system components are illustrated in Figure 1, in which the system’s conveyor belt consists of seven vertical lines that seeds pass through. These vertical lines correspond to each connected ejector nozzle of the system. The camera was installed at a distance covering these seven lines 55 cm from the samples. Seeds were imaged under the above-displayed system by placing kernels on the conveyor belt. Each batch of kernels consisted of 28 seeds in every single capture conducted by the system. The seeds were arranged in alternating rows; the first row was used for almonds and the second row was used for apricot kernels.
To transform the raw hyperspectral images into reflectance images, Equation (1) was used in a sequence to remove the noise generated by the device and the unwanted light intensity, in order to correct the non-uniform light of the images and produce images with an actual reflectance scale. The white reference was measured using a white Teflon tile with ~99% reflectance before imaging the sample with the same illumination configuration. The same standard was obtained for the dark (covered lens) reference (~0% reflectance) data with the light sources turned off. The calibration image Xcal was calculated by using the raw hyperspectral image Xraw, white reference image Xref, and dark reference image Xdark using the equation.
The calibrated hyperspectral image was segmented from the background using the average value of background and seed pixels to remove the non-uniform illumination or variation in the pixel-wise sensitivity of the background and fair reflection of the sample. The dead pixels generated by the camera detector were removed by applying a filter for individual samples. The full spectra were based on the total region of interest (ROI) from each sample and averaged before further analysis. The mean spectrum of each kernel was extracted from two varieties of almonds and two varieties of apricot kernels. Each variety had 112 kernels. Therefore, a total of 448 spectra were collected and used for the analysis. The total data were divided for each variety; 70% of spectral data were used for model building and 30% of spectral data were divided for model testing—the complete process of which is illustrated in Figure 2. The entire process was conducted using MATLAB software (version 8, the Math Works Inc. Natick, MA, USA).
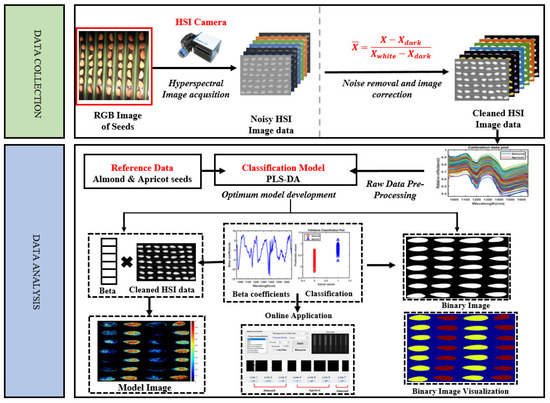
Figure 2.
A schematic flow from data collection to the final online sorting application.
3. Data Analysis
3.1. Spectral Pre-Processing
The objective of the preprocessing of spectral data is to remove phenomena in the spectra, in order to improve subsequent multivariate classification. The general purpose of spectral preprocessing is to correct random noise in the spectra, length variation of the light direction, and light scattering generated by instruments. The pre-treatment of obtained data by appropriate mathematical analysis is important for enhancing crucial information from the sample and removing unwanted variations from the spectral data. Therefore, to obtain smoothing without artifacts or physical variations, pre-processing of the spectral data is required [23]. In this study, normalization, smoothing, multiplicative scatter correction (MSC), the standard normal variate (SNV), and the Savitzky-Golay first and second derivative preprocessing methods were used to eliminate noise and undesired elements from the seeds’ spectral data. Figure 3 shows the spectral data before and after pre-processing treatments, where the red color represents the almonds and blue represents the apricots. These pre-treatment techniques were utilized to improve the spectral data by removing irrelevant information and retaining valuable spectra, in order to provide a better performance for the multivariate classification model that was developed in this study.
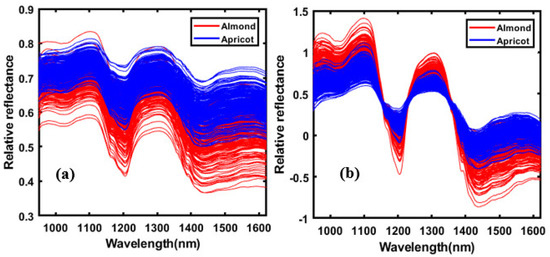
Figure 3.
The raw and pre-processed spectral data of almond and apricot kernels. (a) The pure spectral data and (b) the standard normal variate (SNV) pre-processed spectra in the spectral region between 950 and 1622 nm.
3.2. Development of the Calibration Model
In this study, a PLS-DA model, which is a predictive and descriptive modeling technique, was built to discriminate between normal almond kernels and those adulterated with apricot kernels. PLS-DA has been successfully demonstrated in modeling high-dimensional datasets for diverse purposes, e.g., product authentication in food analysis, disease classification in medical diagnosis, and evidence analysis in forensic science [24]. This supervised classification analysis technique initially classifies the calibration and validation sets as known classes based on the measured feature [16].
PLS-DA has been used for evaluations of various food products’ quality and has been proven to be a powerful technique for this purpose [18,25,26]. There are many articles giving detailed descriptions of the basic theory of PLS-DA [24], which is well-expressed by [27], which explains that PLS-DA is a robust method for classification models, commonly used for model classification. PLS-DA is a modified form of partial least square regression (PLS-R). It is expressed as
where X is an n × p matrix that holds the spectral values of each class, b is the regression coefficient, and E is the error term. In the matrix, n indicates the number of samples and p represents the number of spectral variables. To develop a PLS-DA model, the total pre-processed full pixel-based spectral data from almond and apricot kernels were arranged in the independent (X) variable matrix, while the dependent variable matrix (Y) was grouped and consisted of given artificial values of (0) for almond kernels and (1) for apricot kernels. To classify each group of kernels into its own category, a threshold value of 0.5 was set between both groups to distinguish them from each other.
Y = X × b + E,
To build a linear relationship between the predictors and response variables, both X and Y values were changed by latent variables (LVs).
According to the model, X and Y are the independent and independent variables, respectively; T and U indicate the score matrices; and are the X and Y variable loading in matrices; and Ex and Ey represent the error of the matrices. The X-axis indicates the spectral data extracted from almond kernels, and the Y-axis represents the spectral data extracted from apricot kernel samples.
3.3. Image Processing and Visualization of Chemical Composition Mapping
In this study, we evaluated the efficiency performance of the PLS-DA model for the classification of adulterated almonds. According to the above illustration, the visualization mapping of hyperspectral images was conducted by multiplying the beta coefficient values obtained by the PLS-DA model by each pixel of the corrected processed image. Firstly, a threshold of 0.5 was used to remove the background before visualizing the chemical map. Next, the PLS-DA image with the eliminated background was converted into a binary image (as previously modeled with PLS-DA, with the value of ‘1’ for apricot kernels and ‘0’ for almonds). In the binary images, an intensity over 0.5 was considered for every single seed. Accordingly, the model classified the seeds as almond or apricot seeds, depending on the intensity. The detection rate counting considered pixels’ intensity reflection, and a pixel intensity greater than 50% from the total number of pixels was considered to indicate almonds, while the seeds with less than a 50% pixel intensity were counted as apricot seeds.
One major advantage of hyperspectral imaging is its ability to create a chemical image of the component distribution from the simultaneous measurement of spectral and spatial data. The novel benefit of the chemical image is the inclusion of a measurement of different parameters of the chemical component sample to sample, even with the same sample at each pixel location [28]. The PLS-DA model was used to visualize and map the quality attributes of kernels in every pixel of the hyperspectral image based on the results of the calibration model. The hyperspectral image was advanced into a 2D matrix and multiplied by PLS-DA classification. The obtained vector folded back into the 2D image, and this 2D image showed the visualization of different chemical parameters in the nut samples. The final chemical images were obtained by applying Equation (5):
where Ii is the image of a non-reflectance spectral image and Ri is the beta coefficient derived from the PLS regression model.
4. Result and Discussion
4.1. The Spectral Profile of Almond and Apricot Kernels
Figure 4a presents the raw spectral data and mean raw data, and b presents the SNV pre-processed spectral data obtained from the kernels in the range of 950–1622 nm based on the ROI selection. The spectral data before 950 nm and after 1622 nm were omitted due to the high noise level, which was mainly caused by the low signal response of the camera. Based on the mean of spectral data, the apricot kernel reflectance spectral pattern seems to be higher than that of the almond kernels. This is because of the chemical composition content in both kernels. Both patterns are the same, but the almonds show a different reflectance due to their high amounts of proteins and amino acids, saturated fatty acid, and carbohydrates compared to apricot kernels, based on a nutritional comparison of almonds and apricot kernels [29]. Therefore, more light is absorbed by the almond kernels, and more light is reflected by the apricot kernels.
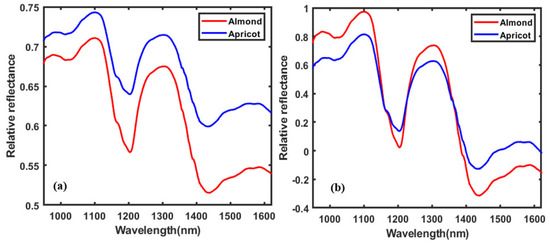
Figure 4.
The plots present (a) mean data obtained before treatment and (b) the SNV preprocessing mean data plot in the range of 950–1622 nm.
The differences in chemical composition in both seed kernels can be observed in the spectral regions representing the lipid, protein, and carbohydrates [30,31,32]. The SNV preprocessed spectra of two different kernels in Figure 4b showed distinctive spectral differences at four different wavebands: 950–1120, 1180–1220, 1260–1340, and 1400–1500 nm. The range between 950 and 1220 nm and the peak of 995 nm were caused by the N–H second overtone associated with peptides and proteins [33]. The range between 1180 and 1220 nm is repressing two significant peaks—1165 and 1200 nm associated with lipids [34] and proteins [35], respectively. The spectral range 1260–1340 nm is related to the combination of C–H stretching in the peak 1335 nm, which is representative of the starch content [36]. The spectral range between 1400 and 1500 nm corresponds to the first overtone of the hydroxyl group representing the hydrogen bonding in the starch molecules [37].
The spectral patterns based on the SNV (b) pre-processed mean data show the important bands between 1435 and 1450 nm, corresponding to the first O−H stretching overtone, which can also be assigned to the starch. The spectral fluctuations from 1400 to 1600 nm correspond to the first overtone of the hydroxyl group. The precise position of these bands is very sensitive to hydrogen bonding in the starch molecule [36]. The absorption bands between 1165 and 1238 nm are associated with lipids, which shows the main differences between almonds and apricot seeds, and the bands include the C−H (−CH) second overtone stretching band (1200−1214 nm) [38].
4.2. PLS-DA Model Result
PLS-DA was used to develop a model for the classification of almonds adulterated with apricot kernels. This method was applied because of its high potential for the classification of seeds based on previous reports. Additionally, it was employed because of its simplicity and high accuracy. The seeds were divided into calibration and validation sets [16,39,40]. A high accuracy was obtained using the method and is thus recommended for classification. PLS-DA has been used with different purposes for the classification of seeds, for example, Raman hyperspectral imaging has been used for the classification of watermelon seeds infected with Acidovorax citrulli [41], which presented a high accuracy. In another study, hyperspectral imaging was used for the classification of Arabic and Robusta green coffee based on PLS-DA [42]. All of the studies mentioned above reported a good performance for the PLS-DA model. Moreover, the model’s performance for the classification of kernels exhibits varying inaccuracies that depend on the preprocessing method with a comparison of the lowest root mean square error of cross validation (RMECV) captured by the PLS-DA based on each preprocessing technique. Therefore, the desirable preprocessing techniques used based on the optimum latent variable (LV) number corresponded to the minimum RMSECV. The number of LVs was investigated with the RMSE of the model using the 10-fold cross-validation method. In Figure 5, exhibiting a knee point, the first minimal of the error rate was found at seven latent variables, which can be considered as the optimal number of LVs.
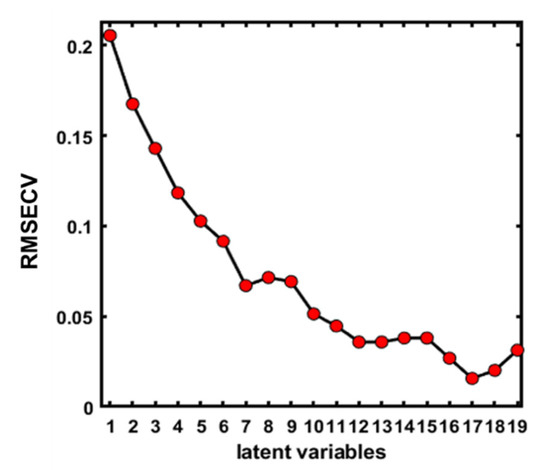
Figure 5.
The optimal number of latent variables (LVs) for the full spectral data.
The exploratory PLS-DA was performed with a total of 448 samples, which were divided into two groups: The calibration set (n = 310) and the validation set (n = 138). The discriminating ability of PLS-DA combined with raw preprocessing was near-perfectly accurate (97%) for adulterated almonds. Therefore, the accuracies obtained by calibration and prediction within raw preprocessing indicate the method’s suitability for discriminating between almond and apricot kernels. The resultant classification model based on each technique obtained based on each preprocessing method is summarized in Table 1.

Table 1.
The partial least square discrimination analysis (PLS-DA) analysis results were obtained for the classification of adulterated almonds.
Based on the results displayed in Table 1, it can be seen that all high-potential preprocessing methods have similar degrees of accuracy. The obtained PLS-DA plots based on the raw preprocessing presented in Figure 6 provide a clear classification of these two seeds.
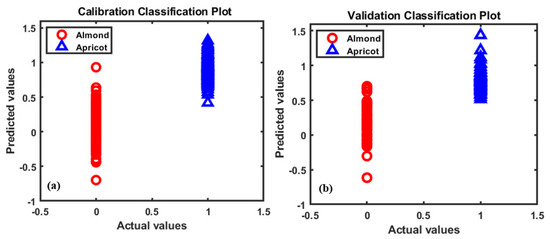
Figure 6.
The partial least square discrimination analysis (PLS-DA) classification plots for almonds and apricot seeds based on the raw preprocessing.
According to the previously discussed strategy, the classification model developed pixel-based data on the spectral features of each pixel. Figure 7 shows the pixel-based classification of seeds as almonds or apricot kernels, based on the number of pixels in the binary images of the PLS-DA model, which calculated the pixels of the image based on the optimal detection rate of each seed using the reflectance intensity of the seeds. Generally, a 50% detection rate was considered for the classification of both groups, similar to the 0.5 threshold value used for the classification of seeds. The accuracy increases significantly when an optimum detection-rate method is used along with kernel-based image classification [18]. Figure 7 presents the 98% pixel-based classification of seeds for four tested images of both varieties of seeds. There may be some inaccuracy due to applying the total number of images from each group.
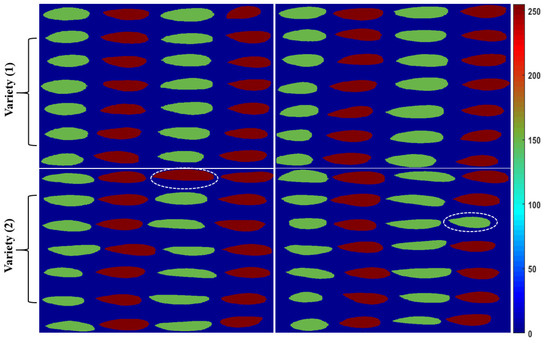
Figure 7.
The resultant images of the PLS-DA model from raw data in the first and second variety with 50% detection (red indicates apricot seeds and green indicates almonds), presenting a total image-based classification accuracy of 98%.
4.3. Visualization Mapping of Adulterated Almonds
The beta coefficient plotted in Figure 8 displays a valley of information used to identify the wavelengths carrying the vital information about the chemical composition features of kernels. The beta coefficient evaluates the relationship between the spectrum as dependent and independent variables of seeds.
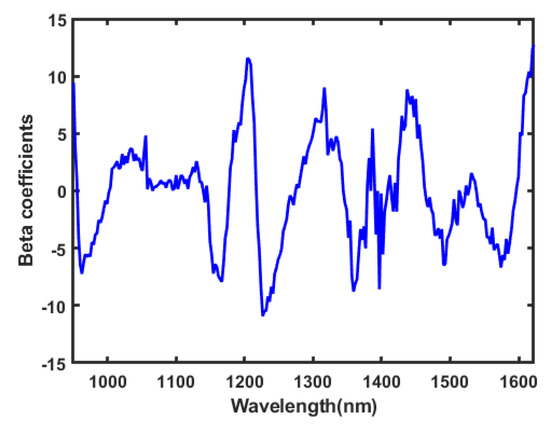
Figure 8.
The obtained beta coefficient based on the raw preprocessing.
The peaks carrying the beta coefficient showed some specific bands of energy absorption between the almonds and apricot seeds. The absorption bands between 1165–1238 and 1692–1740 nm are associated with lipids. These include the C–H (–CH) second overtone stretching band (1200–1214 nm) [43]. The absorption bands between 1408–1462 and 1902–1959 nm are associated with the H–OH second overtone of water [44]. The absorption bands at 1432, 1457, 1505, and 1513 nm correspond to proteins [45]. These bands correlate with the major constituents of raw almonds: Lipids (50%), carbohydrates (∼22%), and proteins (∼21%) [38]. The spectrum in both kernels is dominated by water absorption bands with overtone bands of the OH-bonds at 970 nm, 1190 nm, and 1450 nm [46].
The developed model’s results are based on the averaged spectral data of each individual sample of hyperspectral image, in which the beta coefficient was obtained based on the above analysis and the full wavelength was used and applied to each pixel of the imaged seeds to visualize the chemical composition map of adulterated kernels. Before the development of spatial distribution mapped images, the background was eliminated from the samples using a simple threshold method. Further composition visualization mapped using the beta coefficient obtained from the PLS-DA model used raw pre-processing techniques to gain the total information from the samples in Figure 9. These images not only provided the spatial distribution of adulterations on the surface of samples, but were also useful for identifying the specific adulteration mixed with almond samples. The color scale from blue to red presents the differences in the chemical compositions of both kernels arranged in two rows of seven, in which the first row presents the almonds with a bluer color due to their high chemical content compared to the apricot kernels. Therefore, the almond kernels, due to absorbing more light because of their chemical composition and higher lipid content, absorbed the exposed light more than apricot kernels. According to the color bar, which presents the intensity of reflected light from the surface of seeds, the almonds appear bluer compared to the apricot kernels, which reflected more light than almonds.
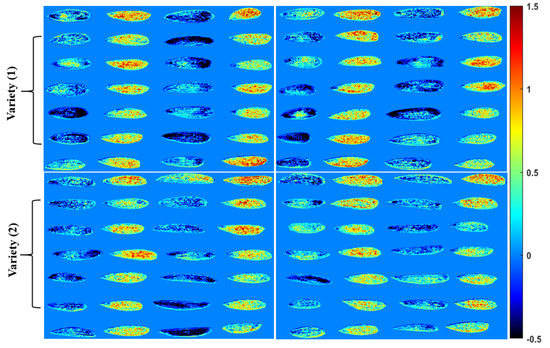
Figure 9.
Discrimination mapped images of the PLS-DA model, easily visualizing the chemical composition of adulterated seeds of both seed varieties.
The hyperspectral imaging technique has been widely used for various purposes in seed inspection, such as in the detection of seed diseases, seed viability measurement, foreign material detection, chemical composition analysis, etc. Recent studies on the purity assessment of maize seed varieties [47], detection of bacterially contaminated watermelon seeds [48], and internally damaged almond nuts [49] can be considered as successful applications of the hyperspectral imaging technique. Although the aforementioned studies have produced significant contributions for seed inspection, the results have rarely been used in the field. In this study, the developed hyperspectral imaging algorithm was used for the real-time discrimination of adulterated almond seeds with an online seed sorting system, in order to investigate its feasibility for further industrial application.
4.4. Performance of the Developed Model Based on the Online Prototype System
The binary classification results of the detected moving seeds on the conveyer belt were transferred to an Arduino system, used for switching ejector solenoids on and off according to the transferred signal received from the classification results. Initially, the ejector was trained so that seeds detected from the apricot kernels would send a “yes” signal to Arduino to open the ejector valves and suck the seeds out using pressure, while a “no” signal would close the valve. Figure 10 presents the graphical user interface (GUI) used for visualizing the online classification process and optimizing the parameters. Firstly, the threshold cut-off point was determined based on the intensity value reflected from the surface of the seeds on the conveyor belt in the seven-line valley space, according to Figure 11. Secondly, the loaded beta coefficient resulted from raw preprocessing observed for visualizing the seeds perfectly in each line and assigning the background cut-off ratio. Figure 10 shows the moving seeds on the conveyor belt with a 0.5 threshold, which is the optimized discrimination threshold value used to distinguish almonds from apricot kernels and was adjusted according to PLS-DA model classification.
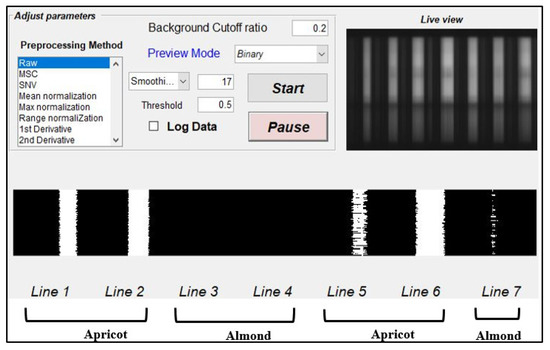
Figure 10.
The moving seeds on the conveyor belt after the optimized threshold (0.5) was used to distinguish between the almonds and apricot kernels.
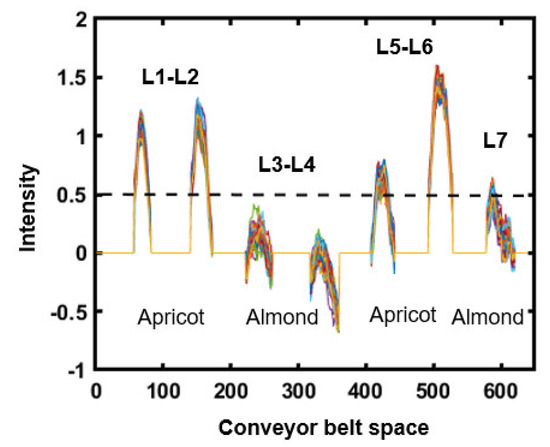
Figure 11.
The determination of the threshold point for seed discrimination in lines.
Figure 11 shows the optimized threshold discrimination between almonds and apricot kernel varieties on the conveyor belt according to the reflected light intensity. The optimized threshold shows a good discrimination of seeds with the assigned value of the threshold cut-off point against the valley space position of the conveyor belt. However, the L7 almond sample shows a misclassification, displaying a slightly higher intensity compared to the other lines of almonds, which might be due to light variations and camera sensitivity.
Figure 10 shows the optimized threshold point for the classification of apricot kernels from almonds, which is 0.5, while it was running using the raw preprocessing with 17 smoothing points and a discrimination threshold of 0.2 to remove the background. Once the system was optimized based on the small number of seeds, we then randomly selected 50 samples from each variety of both groups. The total numbers of samples used for the online application assessments were 100 almonds and 100 apricot seeds, which were mixed. The systems classified 90/100 of the almonds with a 90% accuracy and 80/100 of the apricot seeds with an 80% accuracy. The overall accuracy in both groups was 85% for the discrimination of seeds. The online application shows a slightly lower accuracy, which might be due to lighting optimization and movement on the conveyor belt with higher speeds. Based on the obtained result, the online application of NIR-HSI shows high potential for the industrial application of high-quantity seed discrimination.
5. Conclusions
The industrial application of the NIR-HSI system combined with multivariate analysis demonstrated the classification of almonds adulterated with apricot kernels. The experimental result of this study shows that PLS-DA combined with raw preprocessing can discriminate the almonds from apricot kernels with an accuracy of more than 97% in the validation set. Additionally, a visualized chemical content map was developed using the resultant beta coefficient, clearly discriminating based on the mapped colors. Furthermore, the resultant model beta coefficient was applied in a prototype NIR-HSI system with a GUI controller, displaying initial steps towards industrial application of the system for the high-scale, non-destructive, and rapid measurement of adulterated almonds in a high throughput process. The tested result based on this prototype system is promising, exhibiting a 90% accuracy for classifying almonds and 80% for apricot seeds. The prototype NIR-HSI online application showed a high potential for the classification of adulterated seeds, with a total accuracy of 85% in both groups. The obtained accuracy is promising for the classification of adulterated seeds in large-scale industrial applications.
Author Contributions
Conceptualization, S.L., H.L., G.K., B.-K.C.; Handling experimental for data collection M.A.F., M.P., R.J.; Data analysis and model development M.A.F., H.L., C.W., S.L. Manuscript writing and editing M.A.F., B.-K.C. All authors have read and agreed to the published version of the manuscript.
Funding
This research received no external funding.
Conflicts of Interest
The authors declare no conflict of interest.
Abbreviations
| NIR-HIS | (near-infrared hyperspectral imaging) |
| PLS-DA | (partial least square discrimination analysis) |
| EFSA | (European Food Safety Authority) |
| ROI | (region of interest) |
| SNV | (standard normal variate) |
| ROC | (receiver operating characteristic) |
| GUI | (graphical user interface) |
| Latent Variables | (LVs) |
| Cross-Validation | (cv) |
References
- I Martí, A.F.; I Forcada, C.F.; Kamali, K.; Rubio-Cabetas, M.J.; Wirthensohn, M.G.; I Company, R.S. Molecular analyses of evolution and population structure in a worldwide almond [Prunus dulcis (Mill.) D.A. Webb syn. P. amygdalus Batsch] pool assessed by microsatellite markers. Genet. Resour. Crop. Evol. 2014, 62, 205–219. [Google Scholar] [CrossRef]
- INC. Nuts and Dried Fruits Global Statistical Review. 2015. Available online: https://www.nutfruit.org/files/tech/Global-Statistical-Review-2015-2016.pdf (accessed on 18 September 2020).
- Dourado, F.; Barros, A.; Mota, M.; Coimbra, M.A.; Gama, F.M. Anatomy and Cell Wall Polysaccharides of Almond (Prunus dulcis D. A. Webb) Seeds. J. Agric. Food Chem. 2004, 52, 1364–1370. [Google Scholar] [CrossRef] [PubMed]
- Hollingworth, S.; Dalton, M.; Blundell, J.; Finlayson, G. Evaluation of the Influence of Raw Almonds on Appetite Control: Satiation, Satiety, Hedonics and Consumer Perceptions. Nutr. 2019, 11, 2030. [Google Scholar] [CrossRef] [PubMed]
- Grinling, G.N. Commercial ground almonds and their adulteration. Anal. 1935, 60, 461–463. [Google Scholar] [CrossRef]
- Gurfinger, T.; Letan, A. Detection of adulteration of almond oil with apricot oil through determination of tocopherols. J. Agric. Food Chem. 1973, 21, 1120–1123. [Google Scholar] [CrossRef]
- Esteki, M.; Farajmand, B.; Kolahderazi, Y.; Simal-Gandara, J. Chromatographic Fingerprinting with Multivariate Data Analysis for Detection and Quantification of Apricot Kernel in Almond Powder. Food Anal. Methods 2017, 10, 3312–3320. [Google Scholar] [CrossRef]
- Abedi, M. Health Canada: Apricot Kernels Look Like Almonds, but Can Cause Cyanide Poisoning. Global News 2017. Available online: https://globalnews.ca/news/3899719/health-canada-apricot-kernels-warning-cyanide/ (accessed on 18 September 2020).
- Bracoda Almond or Apricot Kernels? 2017. Almond or Apricot? Available online: http://www.myownchinesebrocade.com/picture-a-day-1/2017/5/17/almonds-or-apricot-kernels (accessed on 18 September 2020).
- CBI. Apricot Kernels in Germany. 2014. Available online: https://www.cbi.eu/about (accessed on 8 September 2020).
- Health Canda. Health Canada reminds Canadians about the risks of consuming apricot kernels. 2019. Available online: https://www.healthycanadians.gc.ca/recall-alert-rappel-avis/hc-sc/2019/70545a-eng.php (accessed on 8 September 2020).
- EFSA European Food Safety Authority. Apricot Kernels Pose Risk of Cyanide Poisoning. 2016. Available online: https://www.efsa.europa.eu/en/press/news/160427 (accessed on 19 September 2020).
- Sauer, H.; Wollny, C.; Oster, I.; Tutdibi, E.; Gortner, L.; Gottschling, S.; Meyer, S. Schwere Zyanidvergiftung im Rahmen einer alternativmedizinischen Behandlung mit Amydalin und Aprikosenkernen bei einem 4-jährigen Jungen. Wiener Medizinische Wochenschrift 2015, 165, 185–188. (In German) [Google Scholar] [CrossRef]
- Lasch, E.; Shawa, E. Multiple cases of cyanide poisoning by apricot kernels in children from Gaza. Pediatrics 1981, 68, 5–7. [Google Scholar]
- Ahmed, M.R.; Yasmin, J.; Lee, W.-H.; Mo, C.; Cho, B.-K. Imaging Technologies for Nondestructive Measurement of Internal Properties of Agricultural Products: A Review. J. Biosyst. Eng. 2017, 42, 199–216. [Google Scholar] [CrossRef]
- Wakholi, C.; Kandpal, L.M.; Lee, H.; Bae, H.; Park, E.; Kim, M.S.; Mo, C.; Lee, W.-H.; Cho, B.-K. Rapid assessment of corn seed viability using short wave infrared line-scan hyperspectral imaging and chemometrics. Sensors Actuators B Chem. 2018, 255, 498–507. [Google Scholar] [CrossRef]
- Gama, T.; Wallace, H.M.; Trueman, S.J.; Tahmasbian, I.; Bai, S.H. Hyperspectral imaging for non-destructive prediction of total nitrogen concentration in almond kernels. Acta Hortic. 2018, 1219, 259–264. [Google Scholar] [CrossRef]
- Baek, I.; Kusumaningrum, D.; Kandpal, L.M.; Lohumi, S.; Mo, C.; Kim, M.S.; Cho, B.-K. Rapid Measurement of Soybean Seed Viability Using Kernel-Based Multispectral Image Analysis. Sensors 2019, 19, 271. [Google Scholar] [CrossRef] [PubMed]
- Rahman, A.; Hyungjin, B.; Cho, B.-K.; Park, E.; Bae, H. Hyperspectral imaging technique to evaluate the firmness and the sweetness index of tomatoes. Agrcultural Sci. Korean J. Agric. Sci. 2018, 45, 823–837. [Google Scholar] [CrossRef]
- Kandpal, L.M.; Lohumi, S.; Kim, M.S.; Kang, J.-S.; Cho, B.-K. Near-infrared hyperspectral imaging system coupled with multivariate methods to predict viability and vigor in muskmelon seeds. Sensors Actuators B Chem. 2016, 229, 534–544. [Google Scholar] [CrossRef]
- Zamany, A.J.; Samadi, G.R.; Kim, D.H.; Keum, Y.-S.; Saini, R.K. Comparative Study of Tocopherol Contents and Fatty Acids Composition in Twenty Almond Cultivars of Afghanistan. J. Am. Oil Chem. Soc. 2017, 94, 805–817. [Google Scholar] [CrossRef]
- PHDP. The National Collection of Varieties of Fruits and Nuts of Afghanistan Volume II; Pernial Horticulture Development Project; ANDOH.: Kabul Afghanistan, 2015; Available online: https://www.scribd.com/document/434776093/Almond-National-Register (accessed on 12 September 2020).
- Rinnan, Å.; Berg, F.W.J.V.D.; Engelsen, S.B. Review of the most common pre-processing techniques for near-infrared spectra. TrAC Trends Anal. Chem. 2009, 28, 1201–1222. [Google Scholar] [CrossRef]
- Lee, L.C.; Liong, C.-Y.; Jemain, A.A. Partial least squares-discriminant analysis (PLS-DA) for classification of high-dimensional (HD) data: A review of contemporary practice strategies and knowledge gaps. Analyst 2018, 143, 3526–3539. [Google Scholar] [CrossRef]
- Seo, Y.; Lee, H.; Mo, C.; Kim, M.S.; Baek, I.; Lee, J.; Cho, B.-K. Multispectral Fluorescence Imaging Technique for On-Line Inspection of Fecal Residues on Poultry Carcasses. Sensors 2019, 19, 3483. [Google Scholar] [CrossRef]
- Kusumaningrum, D.; Lee, H.; Lohumi, S.; Mo, C.; Kim, M.S.; Cho, B.-K. Non-destructive technique for determining the viability of soybean (Glycine max) seeds using FT-NIR spectroscopy. J. Sci. Food Agric. 2017, 98, 1734–1742. [Google Scholar] [CrossRef]
- Yasmin, J.; Ahmed, M.R.; Lohumi, S.; Wakholi, C.; Kim, M.S.; Cho, B.-K. Classification Method for Viability Screening of Naturally Aged Watermelon Seeds Using FT-NIR Spectroscopy. Sensors 2019, 19, 1190. [Google Scholar] [CrossRef]
- Rahman, A.; Kandpal, L.; Lohumi, S.; Kim, M.; Lee, H.; Mo, C.; Cho, B. Nondestructive Estimation of Moisture Content, pH and Soluble Solid Contents in Intact Tomatoes Using Hyperspectral Imaging. Appl. Sci. 2017, 7, 109. [Google Scholar] [CrossRef]
- Carughi, A.; Feeney, M.J.; Kris-Etherton, P.M.; Fulgoni, V.L.; Kendall, C.W.C.; Bulló, M.; Webb, D. Pairing nuts and dried fruit for cardiometabolic health. Nutr. J. 2015, 15, 23. [Google Scholar] [CrossRef] [PubMed]
- Bonku, R.; Yu, J. Health aspects of peanuts as an outcome of its chemical composition. Food Sci. Hum. Wellness 2020, 9, 21–30. [Google Scholar] [CrossRef]
- Alpaslan, M.; Hayta, M. Apricot kernel: Physical and chemical properties. J. Am. Oil Chem. Soc. 2006, 83, 469–471. [Google Scholar] [CrossRef]
- Venkatachalam, M.; Sathe, S.K. Chemical Composition of Selected Edible Nut Seeds. J. Agric. Food Chem. 2006, 54, 4705–4714. [Google Scholar] [CrossRef]
- Zhao, H.; Guo, B.; Wei, Y.; Zhang, B. Near infrared reflectance spectroscopy for determination of the geographical origin of wheat. Food Chem. 2013, 138, 1902–1907. [Google Scholar] [CrossRef]
- Kays, S.E.; Archibald, D.D.; Sohn, M. Prediction of fat in intact cereal food products using near-infrared reflectance spectroscopy. J. Sci. Food Agric. 2005, 85, 1596–1602. [Google Scholar] [CrossRef]
- Nascimento, J.F.D.; Hein, P.R.G.; Davide, A.C.; De Melo, L.A.; Trugilho, P.F. Essential Oil Content inEremanthus ErythropappusWood Powder Can Be Estimated Using near Infrared Spectroscopy. J. Near Infrared Spectrosc. 2015, 23, 33–39. [Google Scholar] [CrossRef]
- Wang, D.; Dowell, F.E.; Ram, M.S.; Schapaugh, W.T. Classification of Fungal-Damaged Soybean Seeds Using Near-Infrared Spectroscopy. Int. J. Food Prop. 2004, 7, 75–82. [Google Scholar] [CrossRef]
- Noah, L.; Robert, P.; Millar, S.; Champ, M. Near-Infrared Spectroscopy As Applied to Starch Analysis of Digestive Contents. J. Agric. Food Chem. 1997, 45, 2593–2597. [Google Scholar] [CrossRef]
- USDA United States Department of Agriculture Agricultural Research Service 2015. National Nutrient Database for Standard Reference, Release 27. Retrieved August 26, 2015 312 from: Nutrient Data Laboratory. Available online: http://ndb.nal.usda.gov/ndb/search (accessed on 15 September 2020).
- Mukasa, P.; Wakholi, C.; Mohammad, A.F.; Park, E.; Lee, J.; Suh, H.K.; Mo, C.; Lee, H.; Baek, I.; Kim, M.S.; et al. Determination of the viability of retinispora (Hinoki cypress) seeds using shortwave infrared hyperspectral imaging spectroscopy. J. Near Infrared Spectrosc. 2020, 28, 70–80. [Google Scholar] [CrossRef]
- Joshi, R.; Lohumi, S.; Joshi, R.; Kim, M.S.; Qin, J.; Baek, I.; Cho, B.-K. Raman spectral analysis for non-invasive detection of external and internal parameters of fake eggs. Sensors Actuators B Chem. 2020, 303, 127243. [Google Scholar] [CrossRef]
- Lee, H.; Kim, M.S.; Qin, J.; Park, E.; Song, Y.-R.; Oh, C.-S.; Cho, B.-K. Raman Hyperspectral Imaging for Detection of Watermelon Seeds Infected with Acidovorax citrulli. Sensors 2017, 17, 2188. [Google Scholar] [CrossRef]
- Calvini, R.; Amigo, J.M.; Ulrici, A. Transferring results from NIR-hyperspectral to NIR-multispectral imaging systems: A filter-based simulation applied to the classification of Arabica and Robusta green coffee. Anal. Chim. Acta 2017, 967, 33–41. [Google Scholar] [CrossRef]
- Sathe, S.K.; Seeram, N.; Kshirsagar, H.; Heber, D.; Lapsley, K. Fatty Acid Composition of California Grown Almonds. J. Food Sci. 2008, 73, C607–C614. [Google Scholar] [CrossRef] [PubMed]
- Davrieux, F.; Allal, F.; Piombo, G.; Kelly, B.; Okulo, J.B.; Thiam, M.; Diallo, O.B.; Bouvet, J.-M. Near Infrared Spectroscopy for High-Throughput Characterization of Shea Tree (Vitellaria paradoxa) Nut Fat Profiles. J. Agric. Food Chem. 2010, 58, 7811–7819. [Google Scholar] [CrossRef]
- Workman, J.J.; Lois, W. Practical Guide and Spectral ATLAS for interpretive Near-Inferared Spectroscopy; CRC Press: Boca Raton, FL, USA, 2012; ISBN 1420018310. [Google Scholar]
- Nicolai, B.; Beullens, K.; Bobelyn, E.; Peirs, A.; Saeys, W.; Theron, K.I.; Lammertyn, J. Nondestructive measurement of fruit and vegetable quality by means of NIR spectroscopy: A review. Postharvest Boil. Technol. 2007, 46, 99–118. [Google Scholar] [CrossRef]
- Zhao, Y.; Zhu, S.; Zhang, C.; Feng, X.; Feng, L.; He, Y. Application of hyperspectral imaging and chemometrics for variety classification of maize seeds. RSC Adv. 2018, 8, 1337–1345. [Google Scholar] [CrossRef]
- Lee, H.; Kim, M.S.; Song, Y.-R.; Oh, C.-S.; Lim, H.-S.; Lee, W.-H.; Kang, J.-S.; Cho, B.-K. Non-destructive evaluation of bacteria-infected watermelon seeds using visible/near-infrared hyperspectral imaging. J. Sci. Food Agric. 2016, 97, 1084–1092. [Google Scholar] [CrossRef]
- Nakariyakul, S.; Casasent, D.P. Classification of internally damaged almond nuts using hyperspectral imagery. J. Food Eng. 2011, 103, 62–67. [Google Scholar] [CrossRef]
© 2020 by the authors. Licensee MDPI, Basel, Switzerland. This article is an open access article distributed under the terms and conditions of the Creative Commons Attribution (CC BY) license (http://creativecommons.org/licenses/by/4.0/).