Article

Geographical Origin Discrimination of White Rice Based on Image Pixel Size Using Hyperspectral Fluorescence Imaging Analysis

1
Department of Biosystems Engineering, Kangwon National University, Chuncheon 24314, Korea
2
National Institute of Agricultural Sciences, Rural Development Administration, Jeonju-si 54875, Korea
3
Research Institute of Pharmaceutical Sciences, College of Pharmacy, Seoul National University, Seoul 08826, Korea
4
USDA-ARS Environmental Microbial and Food Safety Laboratory, Henry A. Wallace Beltsville Agricultural Research Center, Beltsville, MD 20705, USA
5
Department of Biosystems Machinery Engineering, College of Agricultural and Life Science, Chungnam National University, Daejeon 34134, Korea
*
Authors to whom correspondence should be addressed.
Appl. Sci. 2020, 10(17), 5794; https://doi.org/10.3390/app10175794
Submission received: 6 August 2020 / Revised: 18 August 2020 / Accepted: 19 August 2020 / Published: 21 August 2020

Abstract

:
Geographical origin discrimination of white rice is an important endeavor in preventing illegal distribution of white rice and regulating and standardizing food safety and quality assurance. The aim of this study was to develop a method for geographical origin discrimination between South Korean and Chinese rice using a hyperspectral fluorescence imaging technique and multivariate analysis. Hyperspectral fluorescence images of South Korean and Chinese rice samples were obtained in the wavelength range of 420 nm to 780 nm with intervals of 4.8 nm using 365 nm wavelength ultraviolet-A excitation light. Partial least squares discriminant analysis models were developed and applied to the acquired image to determine the geographical origins of the rice samples. In addition, various pre-processing techniques were applied to improve the discrimination accuracy. Accordingly, the pixel size of the hyperspectral image was determined. The results revealed that the optimum pixel size of the hyperspectral image that was above 7 mm × 7 mm showed a high discrimination accuracy. Moreover, the geographical origin discrimination model that applied the first-order derivative achieved a high discrimination accuracy of 98.89%. The results of this study showed that hyperspectral fluorescence imaging technology can be used to quickly and accurately discriminate the geographical origins of white rice.

1. Introduction

In South Korea, the geographic origin of food has been used for marketing to establish a fair distribution order and trust between producers and consumers in accordance with agricultural trade liberalization. However, a significant price difference exists between imported agricultural products and those from South Korea. In general, agricultural products from South Korean are more expensive, so instances of false representations from imported agricultural products continue to increase. Consequently, false representations of the geographic origins have proliferated as a means to increase commercial profits [1]. False representations of geographic origins can result in decreased consumer confidence in product distribution and adversely affect the distribution order. Along with wheat and corn, rice is one of the world’s major crops and is grown in many countries [2]. It is classified as ‘long grain’ or ‘short grain’ depending on the grain shape and size. The quality and composition of rice varies depending on the geographic origin. Chinese short-grain rice varieties are similar in appearance to South Korean rice. Consequently, it is challenging to distinguish them by visual inspection [3]. Therefore, geographical origin discrimination of white rice is an important endeavor in preventing the illegal distribution of white rice and in standardizing and regulating food safety and quality assurance [4].
The techniques of high-performance liquid chromatography, inductively coupled plasma mass spectrometry (ICP-MS), and deoxyribonucleic acid analysis can be employed to determine the geographical origin [1,5,6]. These methods have high accuracy, but require pre-treatment of the sample. They are therefore time intensive and require experts in the given field to perform the experiments and analyses. To overcome these problems, the technique of spectroscopy has been increasingly applied to rapidly identify the geographical origins of agricultural products [7,8,9,10]. Spectroscopy is an informative nondestructive technique. It has been employed with multivariate analysis, such as partial least squares regression (PLSR), partial least squares discriminant analysis (PLS-DA), and principal component analysis (PCA), to determine the geographical origins of agricultural products [11].
Near-infrared (NIR), mid-infrared (MIR), and fluorescence spectroscopy are commonly used to evaluate the agricultural product quality and determine the geographical origin [12,13,14,15,16]. These techniques are simple to employ for data collection and can avoid the physical and chemical pre-treatment of the sample [3]. Several studies have been performed for identification of the geographical origin of beans and walnuts using NIR spectroscopy [7,9]. Meanwhile, MIR and fluorescence spectroscopy exploits the inherent properties of the product components. They have thus been used to distinguish the geographical origins of Emmental cheeses and green coffee beans [17,18]. However, in cases of hybrid agricultural products, spectroscopy cannot determine which parts have different geographical origins or the extent of hybridization because this technique analyzes all spaces of the samples.
Hyperspectral reflectance and fluorescence imaging is a relatively new technique for measuring the quality and safety of agricultural and other food products and investigating their geographical origins [19,20]. This image processing technique uses the specific fluorescence characteristics of the sample to enable acquisition of both spectral and spatial information. It thus provides certain advantages over conventional spectroscopy techniques in detecting the geographical origins of these products [21]. Furthermore, by employing the spectral information of each pixel, it is possible to discriminate other sample properties and to measure them, such as the sample components. Accordingly, this method can be applied to determine the geographical origin of agricultural and other food products [1]. For example, recent research has shown that hyperspectral imaging (HSI) combined with fluorescence imaging is useful for detecting the geographical origin of honey. Moreover, the model accuracy is higher than that of NIR spectroscopy [22].
Given the above background, the objective of this study was to develop a method for geographical origin discrimination between South Korean and Chinese rice using an HSI technique and multivariate analysis. Specifically, PLS-DA and PLSR were performed on fluorescence spectral data sets to develop white-rice discriminating models based on the two different geographical origins. Furthermore, the optimal pixel size and spectral pre-processing of the HSI were determined to improve the discrimination accuracy.

2. Materials and Methods

2.1. Materials

Samples of white rice (Oryza sativa L. subsp. Japonica) cultivated in 2014 to 2016 were collected from South Korea (n = 159) and China (n = 182). Table 1 shows the cultivation regions of the samples. The South Korean rice samples were cultivated in Gyonggi-do, Gangwon-do, Chungcheongbuk-do, Chungcheongnam-do, Jeollabuk-do, Jeiollanam-do, Gyeongsangbuk-do, and Gyeongsangnam-do. The Chinese rice samples were cultivated in Heilongjiang, Jilin, Liaoning, and Jiangsu, all in Northeast China. The cultivation regions of the South Korean rice samples were in the 34~37° N latitude and an accumulated temperature range of 2500~4000 °C. The cultivation regions of the Chinese rice samples were in continental climates with the latitude of 33~47° N and an accumulated temperature range of 1700~2900 °C.
All rice samples were stored in a −80 °C ultra-low temperature freezer until completely used during the experiment to prevent quality deterioration caused by temperature and humidity changes. The experiment was carried out in 2017. Two days before the experiment, the samples were tempered by maintaining a −20 °C storage temperature for 24 h, and then stored at 5 °C for an additional 24 h. The temperature was stabilized for 2 h at room temperature (20 °C) before acquisition of the hyperspectral fluorescence images. Approximately 50 g of rice was used as the samples in the experiment. Based on the results of previous experiments [23], a black acrylic rectangular sample cell with dimensions of 50 mm × 50 mm × 5 mm, which did not express fluorescence, was used to obtain the hyperspectral fluorescence images (Figure 1).

2.2. Hyperspectral Imaging System

In this study, a hyperspectral fluorescence imaging system was used to acquire the HSIs of the rice samples. It consisted of two UV-A excitation lights, a sample translation stage, and the acquisition part of the hyperspectral fluorescence image (Figure 2). The latter was equipped with a slit for the line scan, a high-sensitivity electron multiplying charge coupled device (EMCCD; MegaLuca R, ANDOR Technology, South Windsor, CT, USA) with 1004 × 1002 pixels, an image spectrograph, and a C-mount lens (F1.9 35 mm compact lens, Schneider Optics, Hauppauge, NY, USA). EMCCD has a pixel size of 8 × 8 μm, is cooled down to −20 °C via thermoelectric cooling and can capture 14-bit images at a frequency of 12.5 MHz. The image spectrograph and C-mount lens were fixed in front of the EMCCD. The UV-A excitation lights were vertically tilted at 15° to excite the samples. The HSI was captured in the spectral range of 420–780 nm, with intervals of 4.8 nm. The image field-of-view was determined using a 25 µm × 18 mm (width × length) slit size. The line scan image, acquired through the slit, was spectrally irradiated on the EMCCD surface through a diffraction grating to generate a spectral image for each wavelength band. The horizontal and vertical axes of each line scan image included the respective spatial and spectral information.
In this experiment, an image was obtained three times for each sample using an exposure time of 0.02 s, an amplification value of ten, and a step of 0.5 mm line scan images. Since HSIs are affected by sample conditions such as degree of milling, experiments were performed under the same conditions in this study to minimize these effects. The HSIs of the rice samples were adjusted by using dark reference images to correct for the device noise as well as fluorescent reference images. The fluorescence reference plate was white inkjet paper that exhibited uniform blue fluorescence [13]. The dark reference images were obtained without light source exposure. The HSIs of the rice samples were corrected according to Equation (1).
I ( i ) = ( I s ( i ) D ( i ) ) / ( I r ( i ) D ( i ) )
where I is the corrected relative hyperspectral fluorescence image, Is denotes the sample hyperspectral fluorescence image, Ir represents the hyperspectral fluorescence image of the fluorescent reference plate, and D is the hyperspectral image of the dark reference plate, all at the ith wavelength.
The average spectrum and pixel spectrum of the rice samples were extracted from the calibrated HSIs of the rice samples, excluding the container. Then, multivariate analysis was performed using the extracted HSI data [13].

2.3. Multivariate Data Analysis

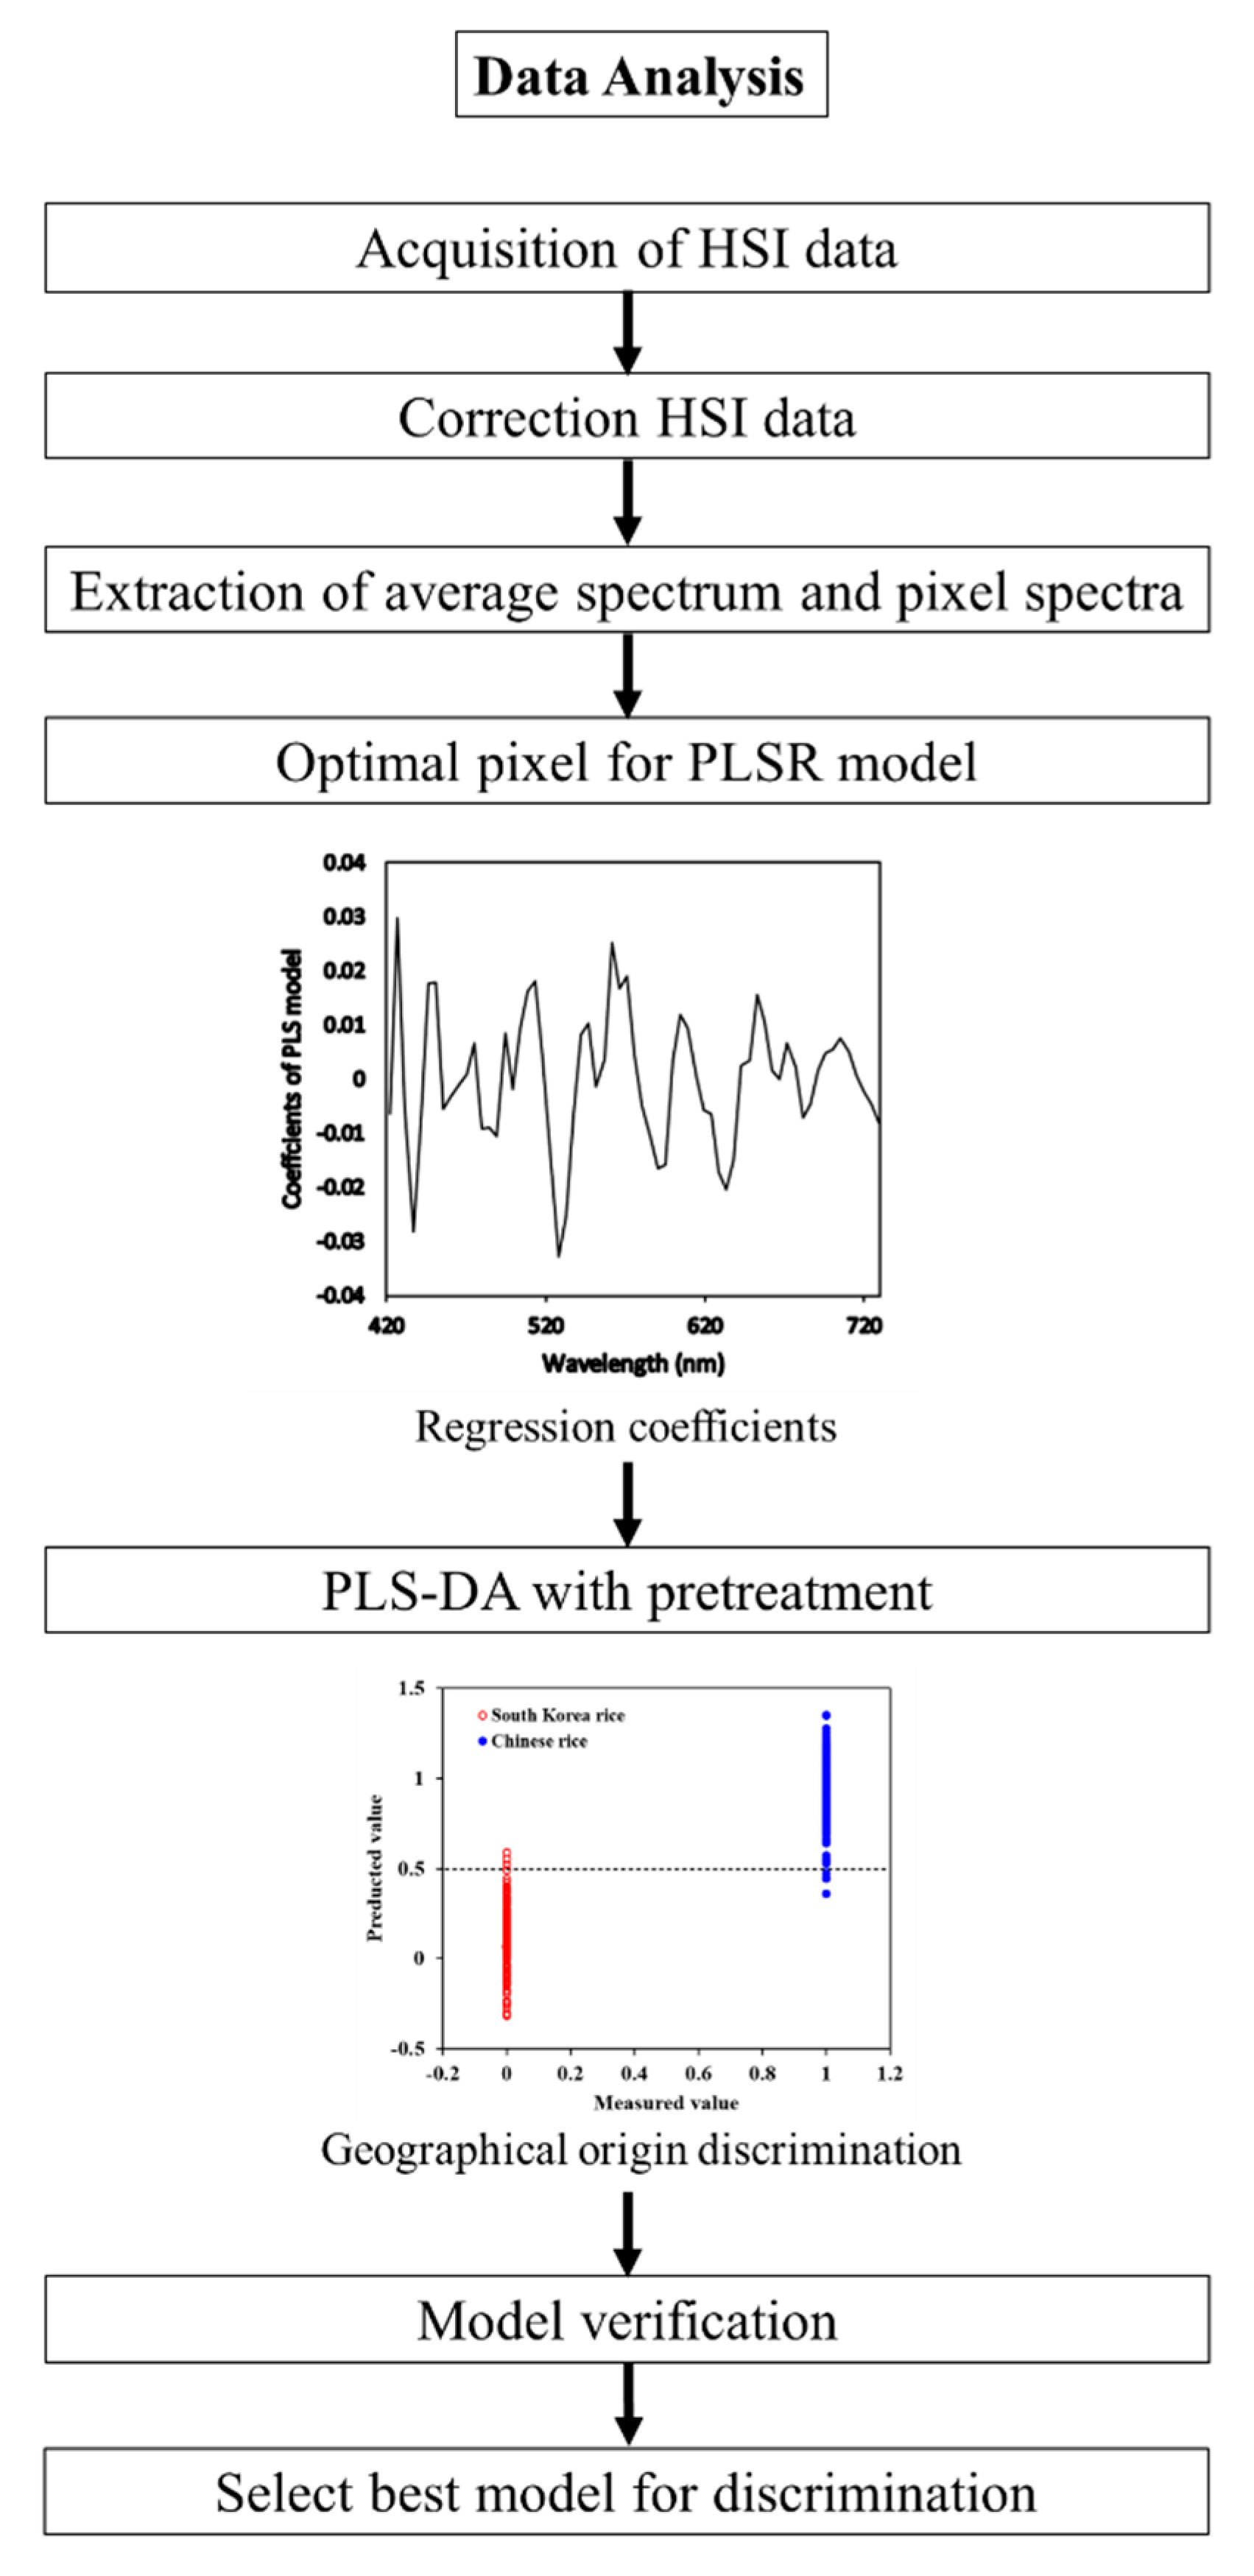
A flowchart of the experiment is shown in Figure 3. To discriminate between the South Korean and Chinese rice, the HSI was analyzed by PLS-DA and PLSR. These are statistical mathematical operations that are used to develop a regression model between the measured spectrum and the dependent variable. In this study, PLS-DA and PLSR were developed using the mean value spectrum and the pixel spectrum of the rice samples, respectively. The values of the South Korean and Chinese rice groups were respectively set to ‘0’ and ‘1’. The basic model of multivariate PLS-DA and PLSR is shown in Equations (2) and (3) [11].
X = T P T + E
Y = T Q T + F
where X is an n × m predictor matrix, Y is an n × p response matrix, T is an n × 1 score matrix for n observations, p is an m × 1 spectrum-data loading matrix, Q is a p × 1 spectrum-data loading matrix, and E and F are matrices of random errors.

2.3.1. Image Post-Processing

Several previous studies reported that image noise caused by overlapping of samples affects the regression model development. A method for quantifying the accuracy of each pixel was recommended to improve the detection accuracy of the samples [24,25,26]. Therefore, the reflection spectrum of each rice sample was measured. Moreover, the effect of discriminating the geographic origin of the rice according to the HSI pixel size was investigated based on the average value of the raw data. The initial raw data had a pixel size of 30 × 30 mm. The size was downgraded to the level of six pixels (2 × 2 mm, 3 × 3 mm, 4 × 4 mm, 5 × 5 mm, 6 × 6 mm, and 7 × 7 mm) to obtain a spectrum for each pixel size. Using the acquired spectrum, a PLSR model for determining the geographic origin of the rice samples according to pixel size was developed.

2.3.2. Spectrum Pre-Treatment

Various image spectrum pre-treatments were evaluated to improve the discrimination model performance. These pre-treatments were used to correct the distortion due to the spectrum, light scattering, and the noise components that may occur from the external environment. These pre-treatments were applied using the average spectrum of the sample to determine the optimal conditions for discriminating the geographic origin. The spectrum pre-treatments that were applied included smoothing, first-order and second-order derivatives, maximum normalization, mean normalization, range normalization, baseline, multiplicative scatter correction (MSC), and the standard normal variate (SNV). The performances of the PLS-DA models for each pre-treatment were compared and evaluated.

2.3.3. Model Validation

Table 2 shows the number of data sets used for the model development and verification. The accuracy of each developed PLS model was evaluated by means of the coefficient of determination for calibration (Rc2), root mean square error of calibration (RMSEC), coefficient of determination for validation (Rv2), root mean square error of validation (RMSEV), and optimal factor (F). RMSE was calculated according to Equations (4)–(6) [27]. The overall predictive accuracy was determined based on the total accuracy of the respective South Korean and Chinese rice predictions. The sensitivity and specificity were calculated using the predictive accuracy results for each rice sample.
RMSEC = i = 1 I c ( y ^ i y i ) 2 I c 1
RMSEV = i = 1 I p ( y ^ i y i b i a s ) 2 I p 1
bias = i = 1 I p ( y ^ i y i ) I p
where y ^ i and y i denote the predicted and measured value of the Ith sample, I c is the number of samples in the calibration set, and   I v represents the number of samples in the prediction set.
Unscrambler X (v.10.4, CAMO Software, Oslo, Norway) was used for the PLS model development, validation, and spectrum pre-treatment. MATLAB (Ver. 2020, MathWorks, Natick, MA, USA) was used to obtain the PLS image and extract the spectrum data from the acquired HSIs.

2.4. PLS Image Analysis

The algorithm of the PLS image obtained by using the HSI was developed by applying the regression coefficients of the developed PLS-DA model for discriminating the geographic origin of rice.

3. Results and Discussion

3.1. Spectral Characteristics of South Korean and Chinese Rice

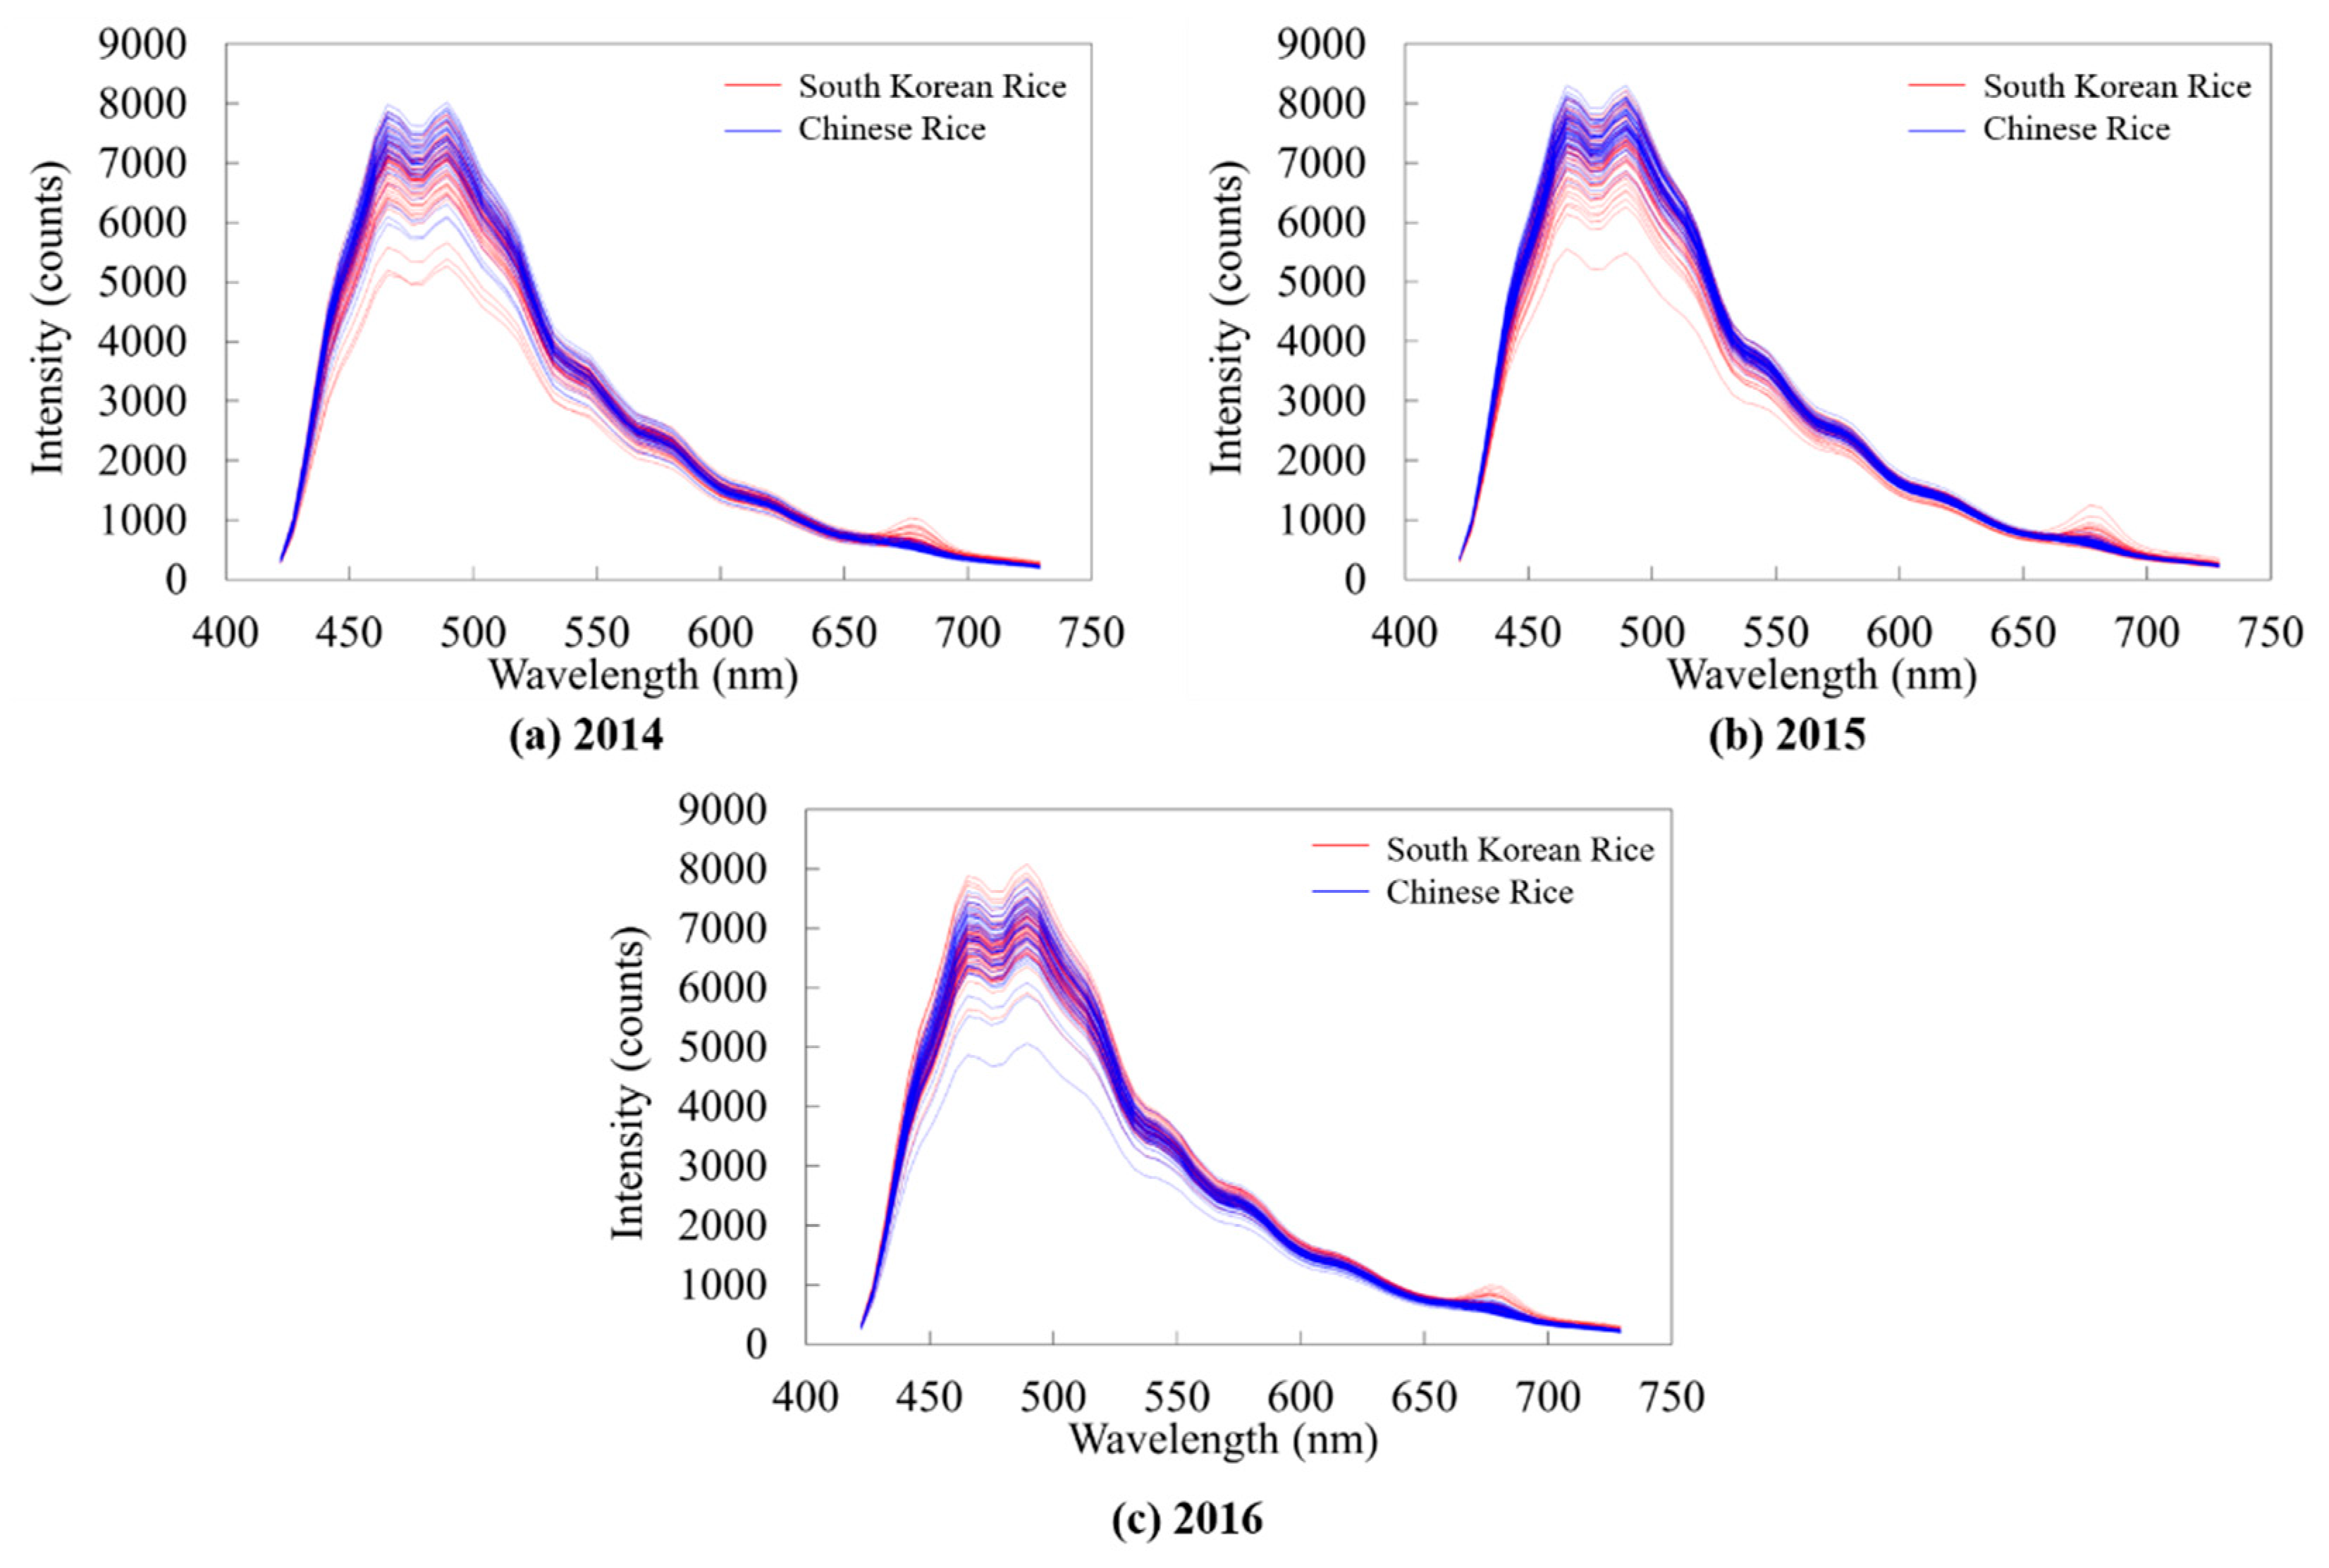
Figure 4 shows the fluorescence spectra of the South Korean and Chinese rice samples by year. The spectra of the rice samples from 2014 to 2016 show a similar trend in the entire wavelength range of 420 to 780 nm. The Chinese rice samples exhibit a higher reflectance than the South Korean rice samples at the overall spectral wavelength. Previous studies reported that the geographical origin can be discriminated by using the difference in the ratio of amylopectin to amylose in rice [23]. Generally, it has been reported that branched-chain amylopectin is identified by the crystallinity of the samples and is attenuated by the amount of amylose present [28]. In addition, a spectral difference appears owing to the apparent transparency and internal heterogeneity of the sample [29].
For the above reason, the South Korean rice samples had a higher amount of amylose compared to the Chinese rice samples, which had relatively low crystallinity; thus, the fluorescent intensity of the latter was low. The raw spectra revealed fluorescence peaks at 465 nm and 489 nm, along with the relatively higher reflectance of the Chinese rice samples compared to the South Korean rice samples. The main component that is used for discriminating Chinese and South Korean rice is a saturated fatty acid that shows a fluorescence peak from 450 nm to 500 nm [30]. This main component is influenced by the lipid constituent and acetic acid (CH3COOH) containing hydroxyl (-OH), stearic acid reacting with -OH, glycine, l-aspartic acid, and l-glutamic acid monosodium salt monohydrate. The latter constituent is a type of amino acid.
These components are factors that affect the rice quality and are influenced by nitrogen fertilization, the production environment, and the cultivation environment (temperature) [31]. Chinese rice is cultivated at a higher latitude (33~47° N) than South Korean rice, which is grown in colder regions. Therefore, it is believed that this study identified the spectral differences between the South Korean and Chinese rice samples. Chlorophyll a appeared mainly at 681 nm, and the higher reflectance of the South Korean rice samples was associated with the 681 nm peak [32,33].

3.2. Performances of the Geographical Origin Discrimination Models for South Korean and Chinese Rice by Pixel Dimensions

Various pixel dimensions were applied in the geographical origin discrimination models to determine the hyperspectral image pixel dimensions that could most effectively discriminate the geographical origin of the rice samples. Table 3 shows the performance of the developed PLSR model with pixel dimensions up to 30 mm × 30 mm. At 30 mm × 30 mm, RV2, RMSEV, and F of the discrimination model are 0.7601, 0.2456, and 9, respectively. The HSI pixel dimensions of 30 mm × 30 mm produced the highest discrimination accuracy. For the pixel dimensions of 2 mm × 2 mm, RV2, RMSEV, and F are 0.5752, 0.3247, and 10, respectively. The discriminative performance is not excellent when the pixel dimensions are low. Moreover, as the pixel dimensions increase, RMSE and R2 tend to increase, and optimal factor F decreases, which confirms that the model performance improved.
The predictive accuracies according to the various pixel dimensions are presented in Table 4. The discrimination accuracies increase proportionally when the pixel dimensions increase. The discrimination accuracies are above 90% when the pixel dimensions are over 3 mm × 3 mm. The discrimination accuracies of the South Korean and Chinese rice samples at pixel dimensions of 30 mm × 30 mm with a classification value of 0.60 are above 99.9 and 97.78%, respectively.
The results show that the hyperspectral image pixel dimensions of 30 mm × 30 mm obtain the highest discrimination accuracy. In general, the length and width of rice (Oryza sativa L. subsp. Japonica) are 5.0–6.4 mm and 2.5–3.0 mm, respectively. Thus, development of a discrimination model with pixel dimensions over 7 mm × 7 mm, which can measure the overall rice sample spectrum with consideration of all the external characteristics of a rice grain, can improve the discrimination performance [34,35].

3.3. Discrimination Models for South Korean and Chinese Rice Using Pre-Treatments

Various pre-treatment methods were applied to develop the geographical origin discrimination models using the hyperspectral image pixel dimensions of 30 mm × 30 mm. The performances of the developed PLS-DA model are shown in Table 5. RV2 and RMSEV of the discrimination model with no applied pre-treatment are 0.7601 and 0.2456, respectively. When the Savizky–Golay first-order derivative with the gap of 43.2 nm is applied, RV2 and RMSEV of the discrimination model are 0.7684 and 0.2416, respectively. When the Savizky–Golay second-order derivative with the gap of 52.8 is applied, RV2, RMSEV, and optimal factor F are 0.7621, 0.2435, and 8, respectively. Optimal factor F is lower than that of the discrimination model with no applied pre-treatment. These results show that the discrimination model performance using the pre-treatment is improved compared to the models using no pre-treatment.
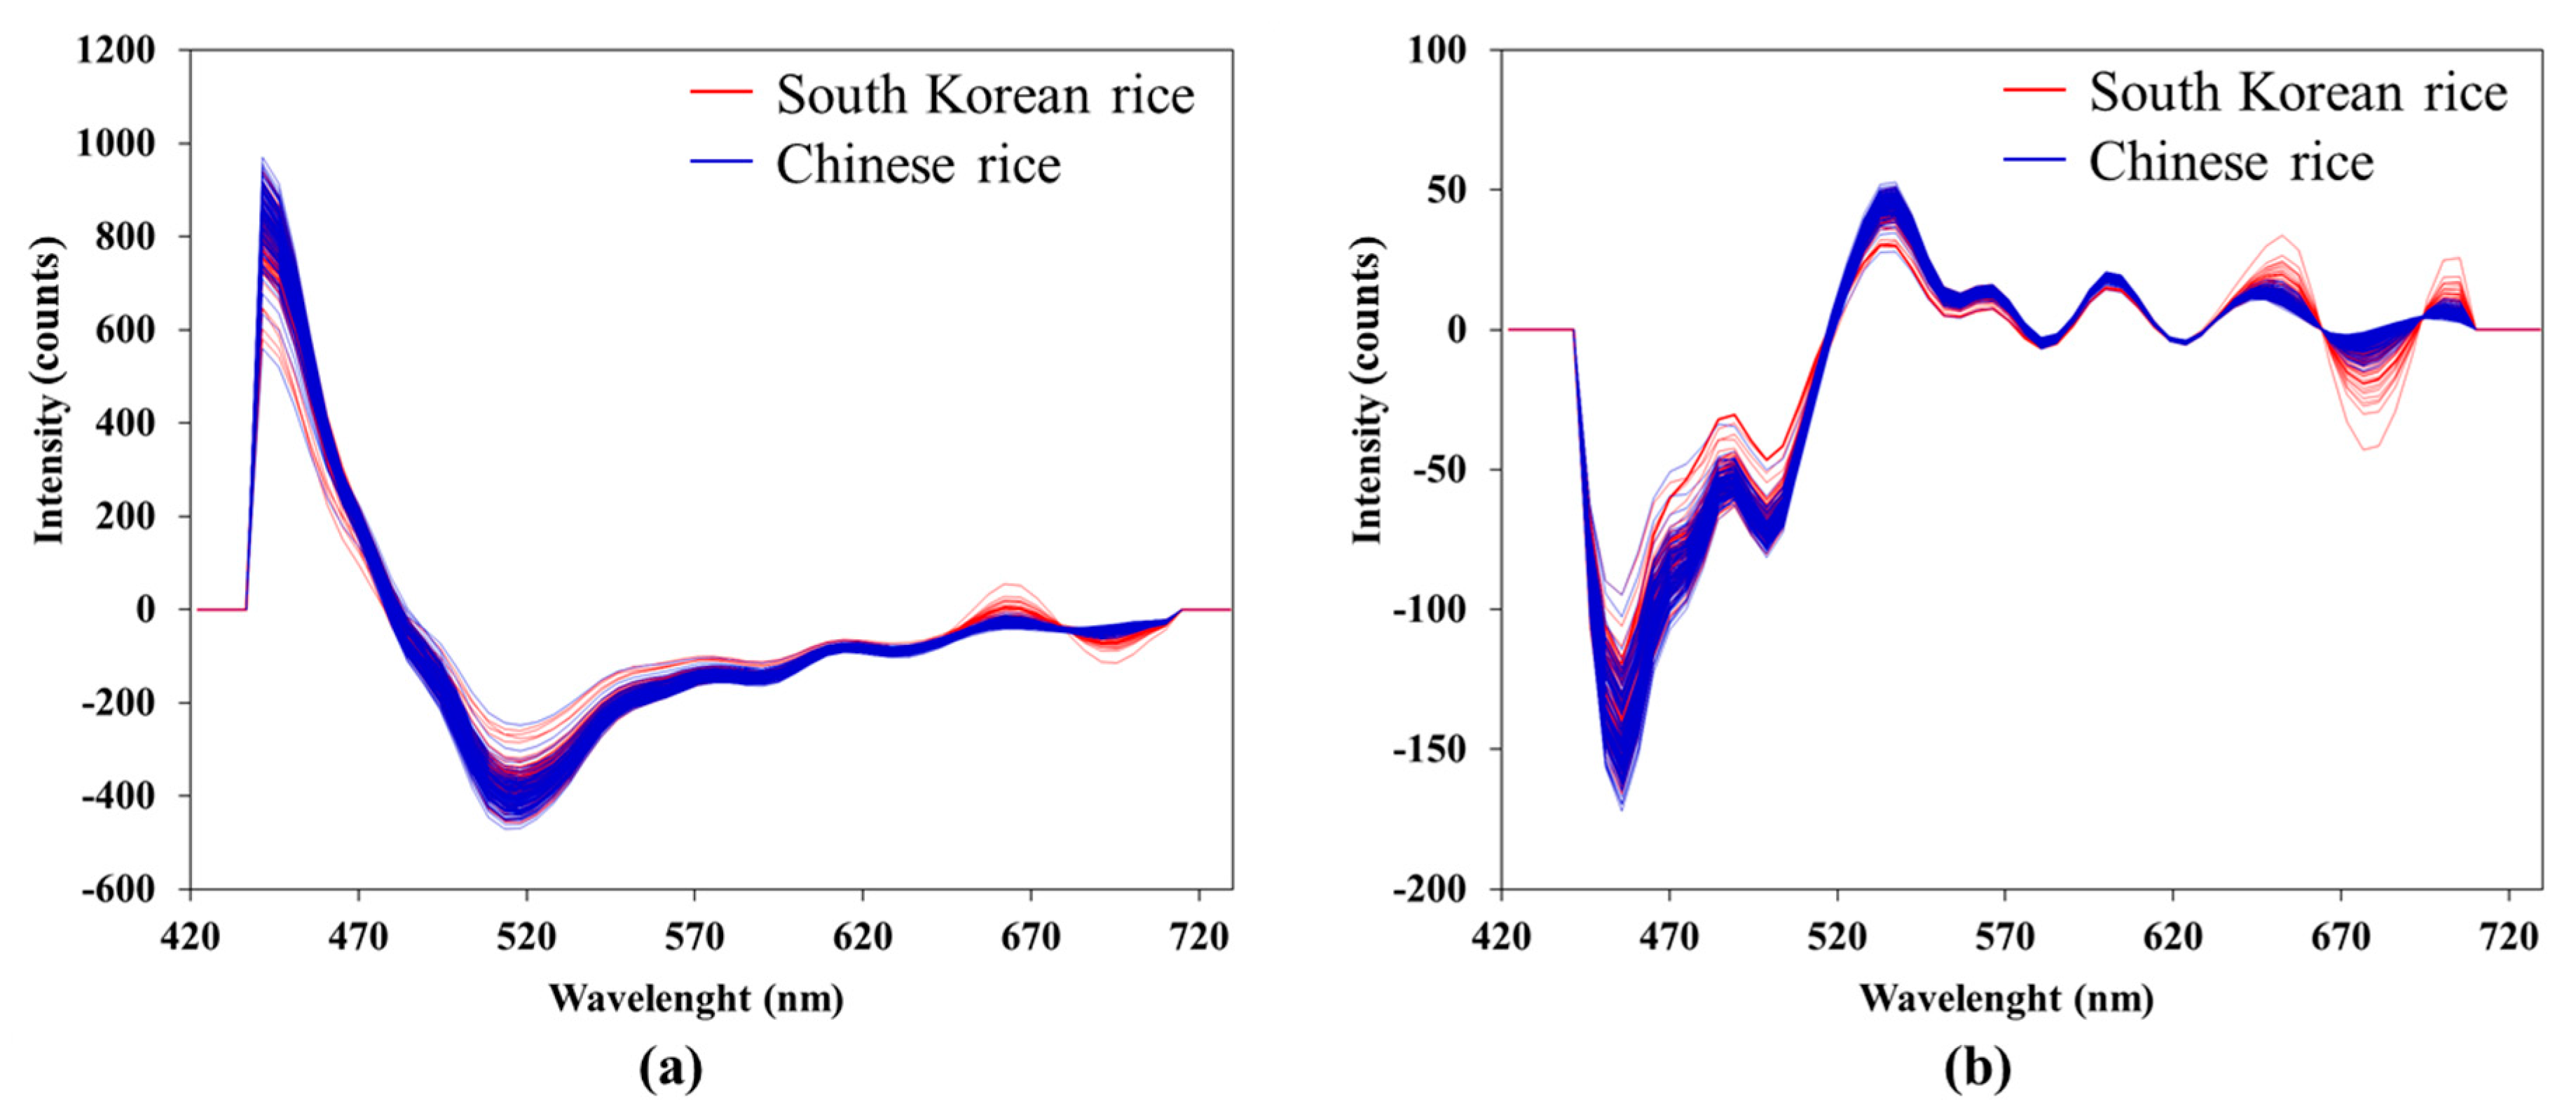
The average spectrum of the South Korean and Chinese rice samples pre-treated by the Savizky–Golay first-order and second-order derivatives are shown in Figure 5. The first-order derivative spectrum reveals peaks at 660 nm and 695 nm, which is related to the amount of nitrogen fertilizer. This is associated with the relatively higher reflectance of the South Korean rice samples [36]. In the first-order derivative spectrum, the peaks at 660 nm to 695 nm can be clearly distinguished in the South Korean and Chinese rice samples compared to the non-treatment spectrum (Figure 4 and Figure 5a). As shown in Figure 5b, the spectrum after application of the Savizky–Golay second-order derivative reveals lower reflectance peaks at 456, 533, 566, 605, and 624 nm for the South Korean rice samples, and higher reflectance peaks at 653, 681, and 706 nm compared to the peaks of the Chinese rice samples. The spectrum that was pretreated by a Savizky–Golay second-order derivative occurred in various wavelength bands compared to the non-treatment spectrum.
The threshold values and discrimination accuracies of the South Korean and Chinese rice samples for the PLS-DA model using various pre-treatment methods are shown in Table 6. The discrimination accuracies with application of SNV, MSC, mean normalization, and range normalization are relatively lower than the discrimination model with no applied pre-treatment. However, the discrimination accuracies of these pre-treatment methods are very high (over 95%).
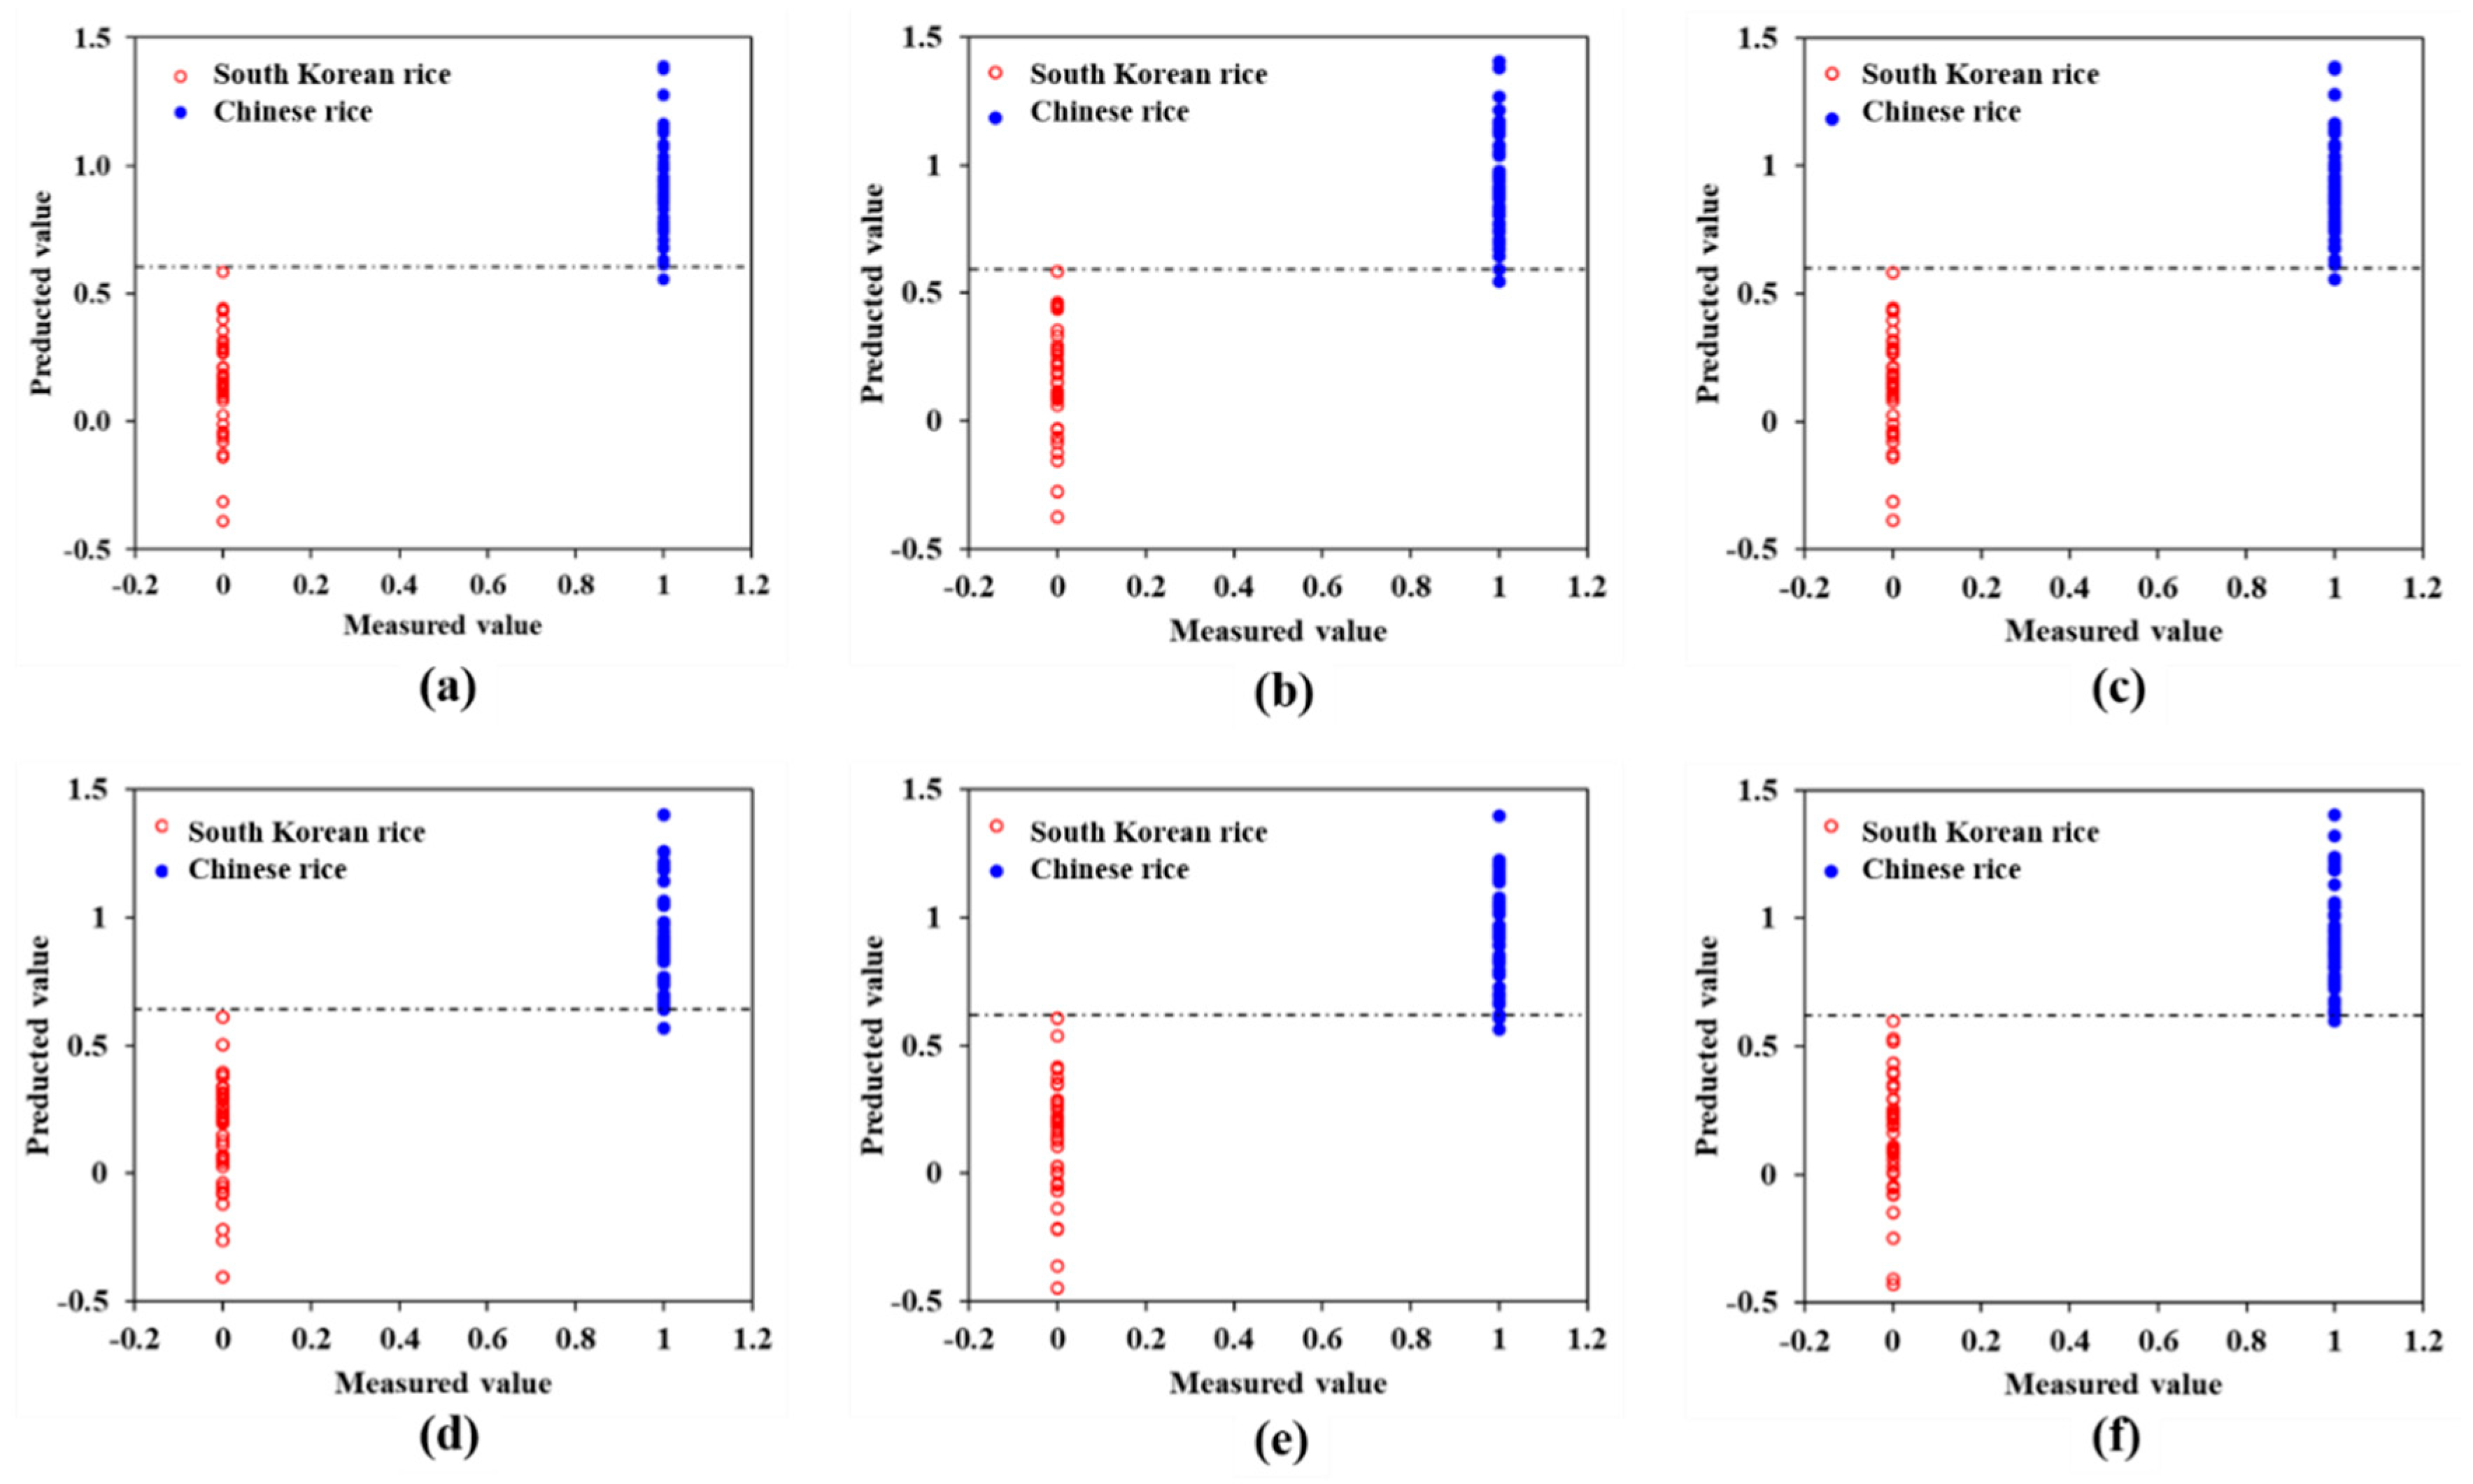
The geographical discrimination models that included baseline pre-treatment, maximum normalization, smoothing pre-treatment, and Savizky–Golay first-order and second-order derivatives yielded a total accuracy of 98.89% (Figure 6). Among these pre-treatment methods, when the Savizky–Golay first-order and second-order derivative were applied together, the discrimination model yielded a low optimal factor and high Rv2. Therefore, it is apparently the most efficient pre-treatment method in this model (Table 5).
According to a previous study [1], the discrimination accuracies of a rice geographical origin model developed using one year of data (2016) were all above 99.99% for the South Korean rice samples. The discrimination accuracies of the PLS models developed in this study, which applied three years of data, were relatively low compared to those previous results [1]. This may be because rice samples harvested for three years included more cultivation environment differences, such as cultivation temperature, climate, and soil conditions, than the samples harvested for one year.
Considering these differences, the results show that the proposed models with pre-treatment provide excellent performance for geographical origin discrimination. Furthermore, the discrimination accuracies of these models are outstanding compared to those of another previous study [37], which showed 93.5% rice geographical origin discrimination accuracy by using an electronic nose combined with ICP-MS by PCA and linear discriminant analysis (LDA).

3.4. Results of PLS Image Discrimination of South Korean and Chinese Rice

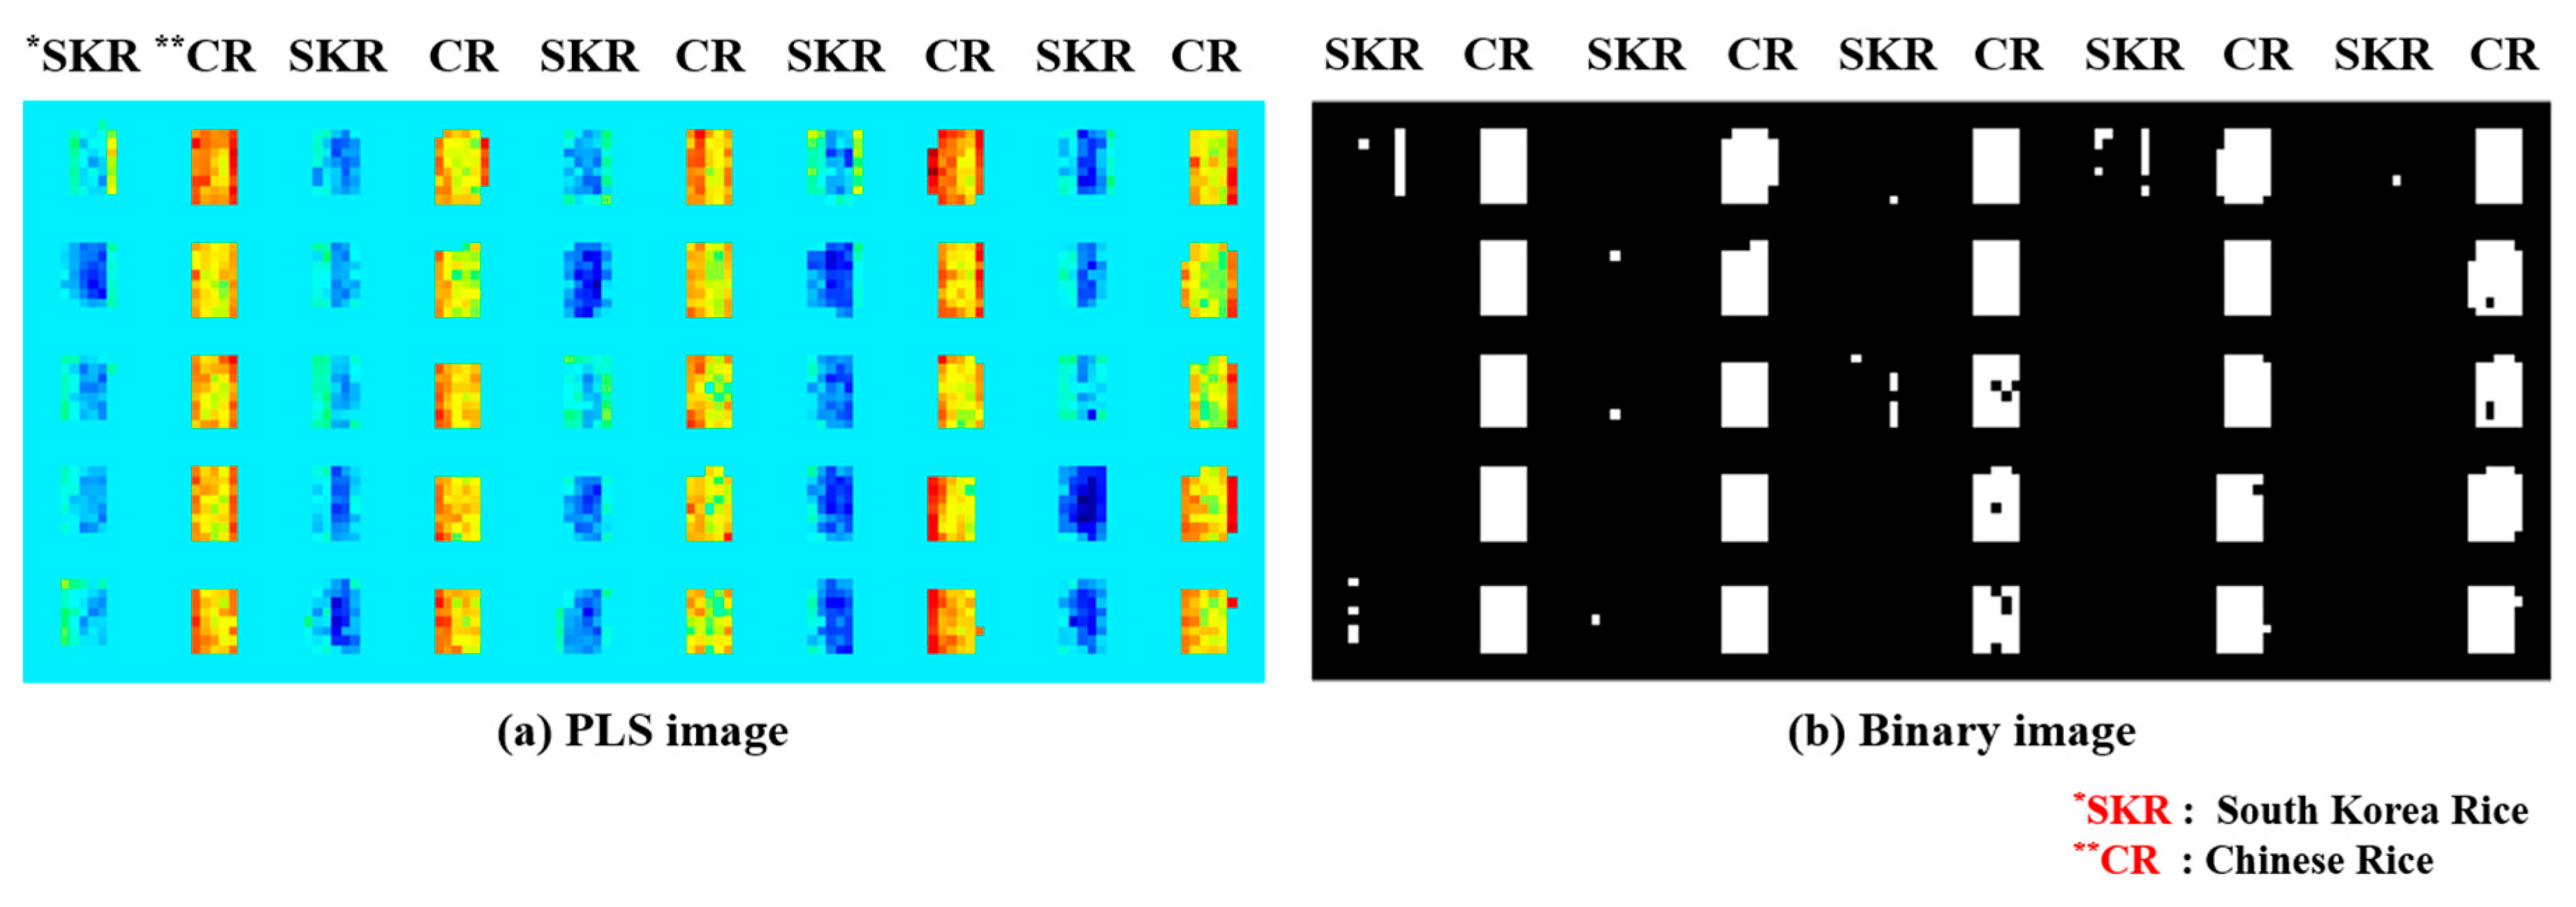
A PLS image algorithm for geographical origin discrimination was developed. The development process of the image processing algorithm is shown in Figure 7. Binarized images were obtained to remove the background of the HSI at a 489.4 nm wavelength. From that point, the images of all wavelength bands were masked for feature extraction of the rice samples. Regression coefficients of the PLS model were applied to all wavelength band images, followed by acquisition of the PLS images. The South Korean and Chinese rice samples were discriminated from the obtained binary image by applying a threshold value to the PLS image.
Figure 8 illustrates the PLS image of geographical origin discrimination between the South Korean and Chinese rice samples using the Savitzky–Golay first-order derivative at a pixel dimension of 30 mm × 30 mm. As shown in Figure 8, the PLS image is a potential technology for discriminating the South Korean and Chinese rice origins. The edge of the rice sample—the boundary between the sample cell and the rice sample—shows a higher pixel value. This may be because the edge portion of the rice in the sample cell has less overlap than the inside portion. Moreover, the fluorescence signal of the sample cell and the fluorescence signal of the rice are simultaneously affected. As shown in Figure 8b, the white value of the South Korean sample shows the effect of the sample cell; thus, it may be appropriate to exclude the edge value to avoid the effect of the cell on the geographical origin discrimination.

4. Conclusions

In this study, PLS models of geographical origin discrimination using hyperspectral fluorescence imaging were developed. A pre-treatment was applied to improve the model accuracy and minimize discrimination errors due to spectral overlap. In addition, the effect of the HSI pixel dimensions on the models was evaluated to determine the geographical origins of the South Korean and Chinese rice samples. Various HSI pixel dimensions were implemented in the PLS models, and the optimal pixel dimensions (over 7 mm × 7 mm) were determined. Moreover, the PLS models that applied a pre-treatment, such as a baseline pre-treatment, maximum normalization, smoothing, and Savizky–Golay first-order and second-order derivatives revealed a discrimination accuracy of 98.89%, independently.
These results are considered noteworthy because the hyperspectral fluorescence image spectrum can be applied to effectively and accurately discriminate the geographical origin of rice. Nevertheless, comprehensive studies should be developed to obtain more accurate and extensive methods, because only South Korean and Chinese rice can be discriminated in the results of this study. In future studies, a rice geographical origin discrimination model will be developed for various other geographical origins, such as Thailand, Vietnam, and the United States. In addition, in this study, quality factors such as moisture and protein content were not used as major factors in discriminate the geographical origin of rice because generally the contents of the quality factors were different for each variety of rice. In a future study, we plan to conduct a study to identify by integrating the part, which is the component of rice and the discriminant the geographical origin of rice.

Author Contributions

M.-J.K., J.L., and C.M. conceived the structure of the paper and wrote the original paper with all authors contributing to the subsequent version. M.-J.K., I.B., Y.S. and S.H.L. analyzed the data; S.W.K., G.K., and J.L. performed the experiments; M.S.K., B.-K.C. and C.M. collected the references and contributed to the design of experiments. All authors have read and agreed to the published version of the manuscript.

Funding

This work was supported by the National Institute of Agricultural Sciences, Rural Development Administration, Republic of Korea [Research Program for Agricultural Science & Technology Development, Project No. PJ0135032020]; and Kangwon National University, Republic of Korea [2019 Research grant of Kangwon National University, 520190071].

Acknowledgments

The authors would like to thank Jungsuk Kang of the National Institute of Agricultural Sciences, RDA for preparing the samples.

Conflicts of Interest

The authors declare no conflict of interest.

References

  1. Mo, C.; Lim, J.; Kwon, S.W.; Lim, D.K.; Kim, M.S.; Kim, G.; Kang, J.; Kwon, K.D.; Cho, B.K. Hyperspectral imaging and partial least square discriminant analysis for geographical origin discrimination of white rice. J. Biosyst. Eng. 2017, 42, 293–300. [Google Scholar]
  2. Suzuki, Y.; Chikaraishi, Y.; Ogawa, N.O.; Ohkouchi, N.; Korenaga, T. Geographical origin of polished rice based on multiple element and stable isotope analyses. Food Chem. 2008, 109, 470–475. [Google Scholar] [CrossRef] [PubMed]
  3. Lim, D.K.; Mo, C.; Lee, D.K.; Long, N.P.; Lim, J.; Kwon, S.W. Non-destructive profiling of volatile organic compounds using HS-SPME/GC–MS and its application for the geographical discrimination of white rice. J. Food Drug Anal. 2018, 26, 260–267. [Google Scholar] [CrossRef] [PubMed]
  4. Wang, J.; Chen, T.; Zhang, W.; Zhao, Y.; Yang, S.; Chen, A. Tracing the geographical origin of rice by stable isotopic analyses combined with chemometrics. Food Chem. 2020, 313, 126093. [Google Scholar] [CrossRef]
  5. Cheajesadagul, P.; Arnaudguilhem, C.; Shiowatana, J.; Siripinyanond, A.; Szpunar, J. Discrimination of geographical origin of rice based on multi-element fingerprinting by high resolution inductively coupled plasma mass spectrometry. Food Chem. 2013, 141, 3504–3509. [Google Scholar] [CrossRef]
  6. Sabir, A.; Rafi, M.; Darusman, L.K. Discrimination of red and white rice bran from Indonesia using HPLC fingerprint analysis combined with chemometrics. Food Chem. 2017, 221, 1717–1722. [Google Scholar] [CrossRef]
  7. Ahn, H.G.; Kim, Y.H. Discrimination of korean domestic and foreign soybeans using near infrared reflectance spectroscopy. Korean J. Crop. Sci. 2012, 57, 296–300. [Google Scholar] [CrossRef]
  8. Huo, Y.; Kamal, G.M.; Wang, J.; Liu, H.; Zhang, G.; Hu, Z.; Anwar, F.; Du, H. 1H NMR-based metabolomics for discrimination of rice from different geographical origins of China. J. Cereal Sci. 2017, 76, 243–252. [Google Scholar] [CrossRef]
  9. Nogales-Bueno, J.; Feliz, L.; Baca-Bocanegra, B.; Hernández-Hierro, J.M.; Heredia, F.J.; Barroso, J.M.; Rato, A.E. Comparative study on the use of three different near infrared spectroscopy recording methodologies for varietal discrimination of walnuts. Talanta 2020, 206, 120189. [Google Scholar] [CrossRef]
  10. Emwas, A.H.M. The strengths and weaknesses of NMR spectroscopy and mass spectrometry with particular focus on metabolomics research. In Metabonomics: Methods and Protocols; Bjerrum, J.T., Ed.; Springer: New York, NY, USA, 2015; pp. 161–193. ISBN 978-1-4939-2377-9. [Google Scholar]
  11. Kim, W.K.; Hong, S.J.; Cui, J.; Kim, H.J.; Park, J.; Yang, S.H.; Kim, G. Application of NIR spectroscopy and artificial neural network techniques for real-time discrimination of soil categories. J. Korean Soc. Nondestruct. Test. 2017, 37, 148–157. [Google Scholar] [CrossRef]
  12. Mo, C.; Kim, M.S.; Lim, J.; Lee, K.; Kim, G.; Cho, B.K. Multispectral Fluorescence Imaging Technique for for discrimination of cucumber seed viability. Trans. ASABE 2015, 58, 959–968. [Google Scholar]
  13. Mo, C.; Kim, M.S.; Kim, G.; Cheong, E.J.; Yang, J.; Lim, J. Detecting drought stress in soybean plants using hyperspectral fluorescence imaging. J. Biosyst. Eng. 2015, 40, 335–344. [Google Scholar] [CrossRef] [Green Version]
  14. Mo, C.; Kim, G.; Kim, M.S.; Lim, J.; Cho, H.; Barnaby, J.Y.; Cho, B.K. Fluorescence hyperspectral imaging technique for foreign substance detection on fresh-cut lettuce. J. Sci. Food Agric. 2017, 97, 3985–3993. [Google Scholar] [CrossRef] [PubMed]
  15. Mo, C.; Hasegawa, M.; Lee, K.; Lim, J.G.; Kim, M.S.; Kang, S.; Lee, H.D.; Bae, H.; Kim, D.Y.; Cho, B.K. Development of a non-destructive on-line pungency measurement system for red-pepper powder. J. Fac. Agric. Kyushu Univ. 2013, 58, 137–144. [Google Scholar]
  16. Hong, S.J.; Lee, A.Y.; Han, Y.; Park, J.; So, J.D.; Kim, G. Rancidity prediction of soybean oil by using near-infrared spectroscopy techniques. J. Biosyst. Eng. 2018, 43, 219–228. [Google Scholar]
  17. Karoui, R.; Dufour, É.; Pillonel, L.; Picque, D.; Cattenoz, T. Determining the geographic origin of Emmental cheeses produced during winter and summer using a technique based on the concatenation of MIR and fluorescence spectroscopic data. Eur. Food Res. Technol. 2004, 219, 184–189. [Google Scholar] [CrossRef]
  18. Botelho, B.G.; Oliveira, L.S.; Franca, A.S. Fluorescence spectroscopy as tool for the geographical discrimination of coffees produced in different regions of Minas Gerais State in Brazil. Food Control 2017, 77, 25–31. [Google Scholar] [CrossRef]
  19. Yoon, S.C.; Shin, T.S.; Heitschmidt, G.W.; Lawrence, K.C.; Park, B.; Gamble, G. hyperspectral image recovery using a color camera for detecting colonies of foodborne pathogens on agar plate. J. Biosyst. Eng. 2019, 44, 169–185. [Google Scholar] [CrossRef]
  20. Ning, X.F.; Gong, Y.J.; Chen, Y.L.; Li, H. Construction of a ginsenoside content-predicting model based on hyperspectral imaging. J. Biosyst. Eng. 2018, 43, 369–378. [Google Scholar]
  21. Noh, H.K.; Lu, R. Hyperspectral laser-induced fluorescence imaging for assessing apple fruit quality. Postharvest Biol. Technol. 2007, 43, 193–201. [Google Scholar] [CrossRef]
  22. Tahir, H.E.; Arslan, M.; Mahunu, G.K.; Mariod, A.A.; Wen, Z.; Xiaobo, Z.; Xiaowei, H.; Jiyong, S.; El-Seedi, H. Authentication of the geographical origin of Roselle (Hibiscus sabdariffa L) using various spectroscopies: NIR, low-field NMR and fluorescence. Food Control. 2020, 114, 107231. [Google Scholar] [CrossRef]
  23. Hwang, J.; Kang, S.; Lee, K.; Chung, H. Enhanced Raman spectroscopic discrimination of the geographical origins of rice samples via transmission spectral collection through packed grains. Talanta 2012, 101, 488–494. [Google Scholar] [CrossRef] [PubMed]
  24. Chan, H.P.; Vyborny, C.J.; MacMahon, H.; Metz, C.E.; Doi, K.; Sickles, E.A. Digital mammography. ROC studies of the effects of pixel size and unsharp-mask filtering on the detection of subtle microcalcifications. Investig. Radiol. 1987, 22, 581–589. [Google Scholar] [CrossRef]
  25. Boellaard, R.; Krak, N.C.; Hoekstra, O.S.; Lammertsma, A.A. Effects of noise, image resolution, and ROI definition on the accuracy of standard uptake values: A simulation study. J. Nucl. Med. 2004, 45, 1519–1527. [Google Scholar] [PubMed]
  26. Chan, L.H.; Law, N.F.; Siu, W.C. A confidence map and pixel-based weighted correlation for PRNU-based camera identification. Digit. Investig. 2013, 10, 215–225. [Google Scholar] [CrossRef]
  27. Roger, J.M.; Chauchard, F.; Bellon-Maurel, V. EPO-PLS external parameter orthogonalisation of PLS application to temperature-independent measurement of sugar content of intact fruits. Chemom. Intell. Lab. Syst. 2003, 66, 191–204. [Google Scholar] [CrossRef] [Green Version]
  28. Cheetham, N.W.; Tao, L. Variation in crystalline type with amylose content in maize starch granules: An X-ray powder diffraction study. Carbohydr. Polym. 1998, 36, 277–284. [Google Scholar] [CrossRef]
  29. Cano, A.; Jiménez, A.; Cháfer, M.; Gónzalez, C.; Chiralt, A. Effect of amylose:amylopectin ratio and rice bran addition on starch films properties. Carbohydr. Polym. 2014, 111, 543–555. [Google Scholar] [CrossRef] [Green Version]
  30. Li, D.; Wang, X.; Han, C. Study on the fluorescence spectra characteristics of vinegar-water solutions. J. Spectrosc. 2016, 2016. [Google Scholar] [CrossRef] [Green Version]
  31. Moon, Y.H.; Kwon, Y.R.; Ahn, B.K.; Lee, J.H.; Choi, D.C. Determination of nitrogen fertilizer recommendation rates estimated by soil-testing for different types of paddy soils. Korean J. Environ. Agric. 2010, 29, 33–38. [Google Scholar] [CrossRef] [Green Version]
  32. Sinha, R.P.; Sinha, J.P.; Gröniger, A.; Häder, D.P. Polychromatic action spectrum for the induction of a mycosporine-like amino acid in a rice-field cyanobacterium, Anabaena sp. J. Photochem. Photobiol. B Biol. 2002, 66, 47–53. [Google Scholar] [CrossRef]
  33. Singh, S.P.; Sinha, R.P.; Klisch, M.; Häder, D.P. Mycosporine-like amino acids (MAAs) profile of a rice-field cyanobacterium Anabaena doliolum as influenced by PAR and UVR. Planta 2008, 229, 225–233. [Google Scholar] [CrossRef]
  34. Wang, Z.H.; Wang, Y.; Cui, H.R.; Xia, Y.W.; Altosaar, I.; Shu, Q.Y. Factor analysis of physicochemical properties of 63 rice varieties. J. Sci. Food Agric. 2002, 82, 745–752. [Google Scholar]
  35. Song, J.; Kim, J.; Kim, D.; Lee, C.; Youn, J.; Kim, S.; Suh, S. Physicochemical properties of starches in japonica rices of differenct amylose content. Korean J. Crop. Sci. 2008, 53, 285–291. [Google Scholar]
  36. Özyigit, Y.; Bilgen, M. Use of spectral reflectance values for determining nitrogen, phosphorus, and potassium contents of rangeland plants. J. Agric. Sci. Technol. 2013, 15, 1537–1545. [Google Scholar]
  37. Du, M.; Fang, Y.; Shen, F.; Mao, B.; Zou, Y.; Li, P.; Pei, F.; Hu, Q. Multiangle discrimination of geographical origin of rice based on analysis of mineral elements and characteristic volatile components. Int. J. Food Sci. Technol. 2018, 53, 2088–2096. [Google Scholar] [CrossRef]
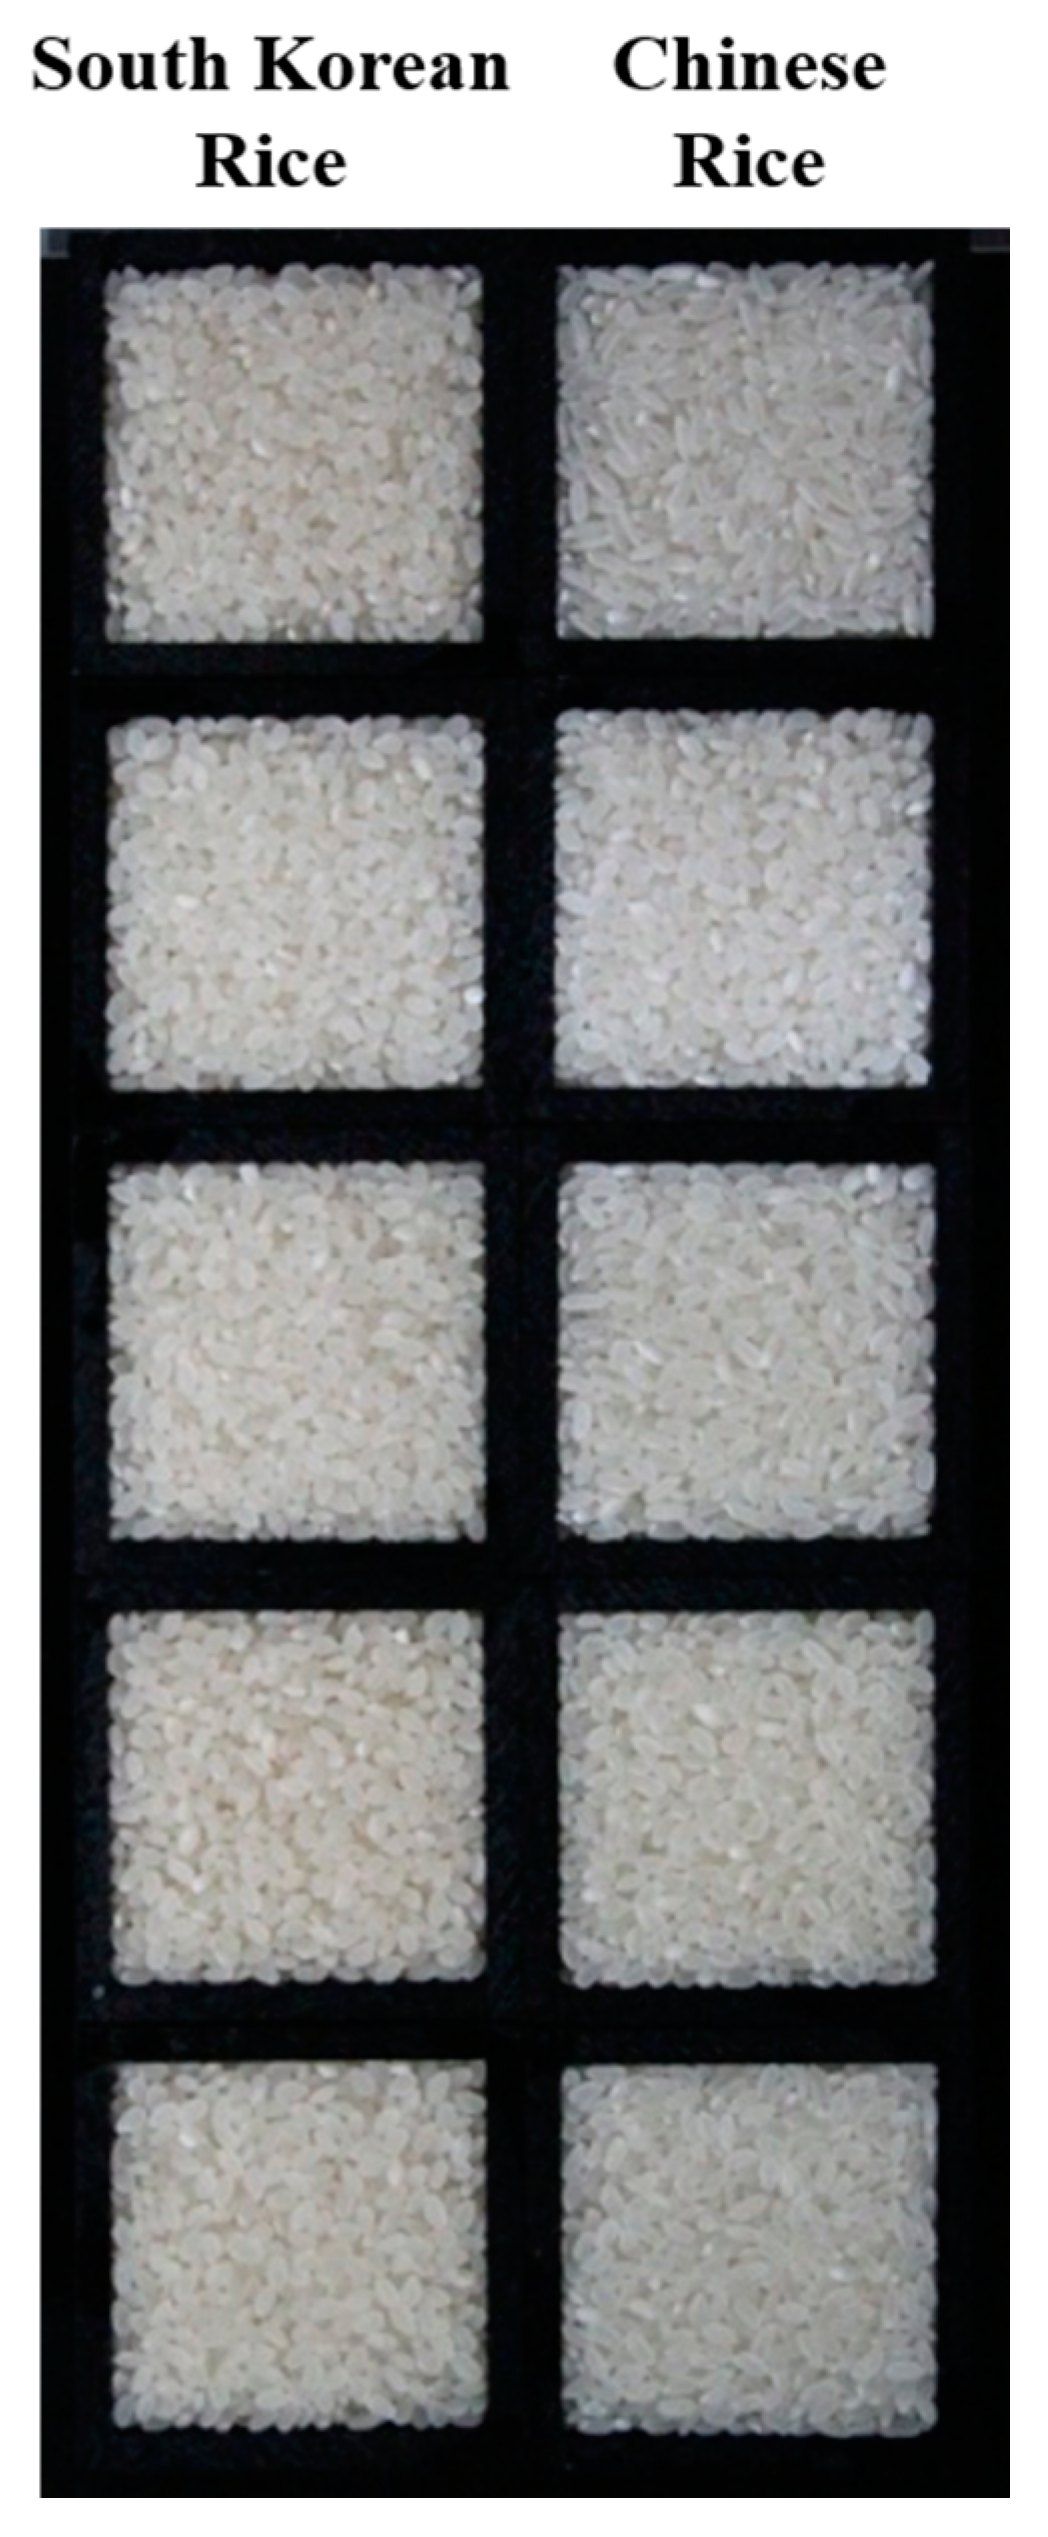
Figure 1. Photograph of South Korean and Chinese rice samples.
Applsci 10 05794 g001
Figure 2. Schematic diagram of the hyperspectral imaging system.
Applsci 10 05794 g002
Figure 3. Flowchart for developing the white rice geographical origin discrimination model.
Applsci 10 05794 g003
Figure 4. Fluorescence spectra of the South Korean and Chinese rice samples in the years (a) 2014, (b) 2015, and (c) 2016.
Applsci 10 05794 g004
Figure 5. Average fluorescence spectra after pre-treatment application for the South Korean and Chinese rice samples: (a) first-order derivative and (b) second-order derivative.
Applsci 10 05794 g005
Figure 6. Geographical origin discrimination results for the PLS-DA models developed using (a) no pre-treatment, (b) baseline pre-treatment, (c) maximum normalization, (d) smoothing pre-treatment, (e) Savizky–Golay first-order derivative, and (f) Savizky–Golay second-order derivative.
Applsci 10 05794 g006
Figure 7. Steps of the PLS image algorithm for geographical origin discrimination of white rice.
Applsci 10 05794 g007
Figure 8. (a) PLS image and (b) binary image of geographical origin discrimination between the South Korean and Chinese rice samples using the Savitzky–Golay first-order derivative at pixel dimensions of 30 mm × 30 mm.
Applsci 10 05794 g008
Table 1. Cultivation regions of domestic (South Korean) and imported (Chinese) rice.
NationRegion201420152016
Number of SamplesNumber of SamplesNumber of Samples
Short-Medium GrainLong GrainTotalShort-Medium GrainLong GrainTotalShort-Medium GrainLong GrainTotal
South KoreaGyonggi-do120121701713013
Gangwon-do707808606
Chungcheongbuk-do303404101
Chungcheongnam-do404404505
Jeollabuk-do60650512012
Jeiollanam-do1101160614014
Gyeongsangbuk-do606101808
Gyeongsangnam-do101202000
Etc.-0-101000
ChinaHeilongjiang9233214173115419
Jilin448731013821
Liaoning6062602621021
Jiangsu224112200
Table 2. Number of data sets used and pixel dimensions.
Pixel Dimension (mm)
2 × 23 × 34 × 45 × 56 × 67 × 730 × 30
Training data set61,46028,42814,36611,90471704664294
Predicted data set30,73014,214718359523585233283
Table 3. Results for the PLSR model developed to discriminate the geographical origin between South Korean and Chinese rice samples for various pixel dimensions.
Pixel Dimension (mm)
2 × 23 × 34 × 45 × 56 × 67 × 730 × 30
Rc20.57630.64850.69770.69250.71660.71920.8023
RMSEC0.32440.29550.27400.27660.26570.26420.2218
RV20.57570.64750.69540.69110.71480.71680.7601
RMSEV0.32470.29600.27510.27720.26620.26540.2456
F101110101099
Table 4. PLSR model geographical origin discrimination results for the rice samples.
Pixel Dimensions (mm)
2 × 23 × 34 × 45 × 56 × 67 × 730 × 30
CV a)0.5450.5550.550.560.530.510.60
South Korean rice89.8390.4795.1394.8394.1794.52>99.99
Chinese rice87.4291.3493.7092.4795.7795.8697.78
Total accuracy88.6390.9094.4293.6594.9795.1998.89
a) CV: Classification value.
Table 5. Calibration and validation results from using PLS-DA models with several rice sample pre-treatment methods.
Pre-TreatmentNoneSNVBaselineMSCNormalizationSmoothing1D a)2D b)
MeanMaxRange
No. of samples259259259259259259259259259259
Rc20.80230.81600.80270.83130.81260.81880.81870.80140.79720.7918
RMSEC0.22180.21400.22160.20490.21590.21240.21240.22230.22460.2276
RV20.76010.73130.75860.74840.76090.74630.75010.76000.76840.7621
RMSEV0.24560.25830.24580.24980.24410.25180.24990.24530.24160.2435
F912913912121098
a) 1D: first-order derivatives with a gap of 43.2 nm, b) 2D: second-order derivatives with a gap of 52.8 nm.
Table 6. Results of the PLS-DA model in discriminating the geographical origin of the rice samples.
PretreatmentNoneSNVBaselineMSCNormalizationSmoothing1D a)2D b)
MeanMaxRange
No. of samples83838383838383838383
CV c)0.600.550.590.680.640.600.600.630.610.61
South Korea rice>99.9994.74>99.99>99.99>99.99>99.9997.37>99.99>99.99>99.99
Chinese Rice97.78>99.9997.7895.5695.5697.78>99.9997.7897.7897.78
Total Accuracy98.8997.3798.8997.7897.7898.8998.6898.8998.8998.89
a) 1D: first-order derivatives with a gap of 43.2 nm, b) 2D: second-order derivatives with a gap of 52.8 nm, c) CV: classification value.