Abstract
The growth of the urban population and its activity in major cities has led to various public health challenges, including environmental pollution, which are reflected in a decrease in the well-being of societies. This paper presents a predictive tool used to mitigate the noise impact study of commercial centre noise on the surrounding houses, the study being conducted prior to its construction. Before the construction of the supermarket, the sound pressure levels from the façade of the surrounding building are measured to have a background noise level of the analysed area. The noise impact study is made using prediction software in which the houses and the shopping centre buildings are numerically modelled. The main noise sources of the commercial centre, defined in numerical predictions, are represented by the air conditioners, heat pumps situated on the roof and the noise generated by the activities from the supply ramp. The noise impact evaluation is performed at different heights and by determining the number of affected inhabitants. To reduce the number of exposed inhabitants to noise, four technical solutions are presented. The proposed noise solutions are based on technical and economic analyses and also on the urban landscape. The study presents the noise prediction for which the propagation calculus was made according to ISO 9613-2. The noise limits were evaluated according to the Romanian national legislation. The final part of this study presents the noise measurements performed after the construction of this shopping centre and the validation of the implemented noise reduction solution.
1. Introduction
The growth of the urban population and its activity in major cities has led to various public health challenges, including environmental pollution, which are reflected in a decrease in the well-being of societies, also called quality of life. Therefore, a better practice to increase the quality of life from the noise point of view is to adopt preventive measures which are more practical than their further elimination. Noise can be defined as unwanted sound that has adverse effects on health and its effects can manifest with damages at the physiologic or psychological level. At the psychological level, noise exposure may manifest as an increased physiologic stress response, adverse social consequences, sleep disturbance and detrimental economic effects [1].
Among the current environmental problems, urban noise can be considered one of the main sources of pollution. Since 1972, the World Health Organization (WHO) has declared noise a pollutant. In the same decade, the project developed by Murray Schafer in Canada, the World Soundscape Project [2], defended the importance of improving the quality of the urban sound environment, due to the negative effects of noise pollution on human health.
Currently, there are many studies and concerns for evaluating and improving the quality of life in urban areas both in the landscape [3,4,5], inside shopping centres and in adjoining residential areas [6,7,8].
During the projecting phase, architects and heating ventilation and air conditioning (HVAC) engineers are concerned with the outdoor noise problems generated by climate installations near residential areas. Usually, such installations are powerful and noisy, and preliminary software simulation of generated noise by HVAC systems should be very useful. Noise limits are imposed by standards and regulations for outdoor HVAC systems to protect people’s health. ASHRAE (American Society of Heating Refrigeration and Air Conditioning Engineers) or ISO 13261-1 regulate the sound pressure levels of outdoor radiation of air conditioners and heat pumps (ACs&HPs) [9]. Sound pressure levels mapping is taken into consideration by professionals in projecting and choosing the proper type and place of HVAC installations, as mentioned by Waleed El-Sallamy et al., in 2018 [10]. In such software simulations, the noise generated by HVAC installations could be combined with other types of noise (traffic, logistic, etc.) and also the influence of adjacent buildings with their geometry and orientation (facades reflections, diffusion from balconies, diffraction by corners, etc.) should be highlighted.
From the psychological and psychosomatic point of view, impact noises are an important source of annoyance for a residential zone. Impact noises create emotional states like threat, frustration, anger, startle and unpleasant feelings, as studied by S. H. Park. et al., in 2018 [11]. Often, such impact noise is created by logistic activities at shopping centres, with the loading and unloading of products and materials, dropping empty packages or hitting platforms.
Previous studies related by the level of noise generated by the activities of a shopping centre near a residential zone were done in Bucharest during the day and night in a study of risk management, assessment and mitigation by Istrate I. A. et al., in 2010 [12].
Based on the prediction model of the international standard ISO 9613-2 [13], noise mapping was done in a 2D model and validated with measured data for a mixed commercial and residential area by Filho J. J. de S. et al., in Campo Grande (Brazil) in 2015 [14].
Nowadays, in noise simulations methods, generation of 3D data is required for buildings, terrain and so on, from current 2D topographic data. Jantien Stoter et al. showed in 2020 [15] that the results obtained from generated data algorithms for buildings, noise absorption or reflection, terrain height, bridges and noise barriers are similar to measured data.
According to our documentation research, until present, impact noises, as part of global noise near a residential zone, were not treated in a comparative manner with 2D/3D simulations and a measurement method. A shopping centre area was chosen for the reason that there are both existing tonal broadband HVAC noise and impact noise, as important sources of creating annoying effects and a health threat on people located in the adjoining residential area. If traffic noise is considered as an important disturbance mainly as a level, tonal and impact noises are viewed as direct health threats with various psychosomatic annoying noise-related responses. We have assumed that the location of a noise source at a higher level, as is the case of air conditioning units placed on a building, could have a different influence on the receiving points at the façade of the adjoining buildings, compared with the noise produced by traffic. Thereby, the influence of the ground and vegetation could have a reduced influence on sound attenuation measured at the level of adjacent building façades.
In this paper, the noise produced by the activity of a commercial centre situated at a small distance from residential buildings is analysed. The main noise sources in this study are represented by the air conditioning units that are positioned on the roof of the commercial building and the noise generated by the activities of loading and unloading performed on the supply ramp. Having a small distance between the commercial centre and the residential buildings and considering the continuous functioning of the AC&HP units, a special attention must be paid to these types of noise sources due to their continuous functioning regime and especially by their tonal character for which some added correction must be applied, thus the noise is felt as louder.
The close proximity of the commercial centre near the residential buildings has led to the necessity of performing a noise impact study before starting its construction. The noise exposure of surrounding inhabitants is analysed using a VBEB (Vorläufige Berechnungsmethode zur Ermittlung der Belastetenzahlen durch Umgebungslärm) method, which estimates the number of exposed inhabitants, this analysis being presented in the next chapter. The first phase of the study consists of measuring the noise levels at the façade of the analysed buildings in order to assess the background noise level of the analysed area. The second step consists of modelling the residential buildings, the commercial building and noise sources by using IMMI software (noise mapping and prediction software), 2012 version. The noise prediction shows that the legal noise limits are exceeded, leading to the necessity of studding different noise reduction solutions. Five scenarios are considered: the first scenario consists of a noise prediction of all the noise sources in the surrounding area; in the second scenario, a parallel noise barrier with the supply ramp is modelled; in the third scenario, a higher barrier is studied; in the fourth scenario, a construction in which the supply van enters is modelled; and the last scenario is where the noise barriers are mounted on the roof near the noise sources. The last chapter presents the situation after the construction of the shopping centre, in which a noise measurement campaign is performed in order to validate the prediction results.
2. Shopping Center Noise Predictions
2.1. Noise Impact Methodology
In accordance with EU DIRECTIVE 2002/49/EC [16], strategic noise mapping has to be modelled and assessed at a height of 4 m that corresponds to the height of the first floor of a residential building. The height of the noise prediction is treated in different studies [17,18,19], where it was concluded that the measured noise levels of road traffic or railway noise increase with height. Considering that the noise sources from the present study are situated at a 6 m height, a noise assessment is made according to a VBEB method which is made according to German national legislation.
The studied area is situated on the northeast side of Bucharest in a densely populated area. The location of the commercial centre is planned to be situated among the houses at a distance of just 16 m from the closest residential building facade. In the surrounding area of the commercial centre, residential buildings with 10 stories are found with an average height of 26 m. Due to the daily commercial centre activities, a large number of inhabitants can be exposed to high levels of noise, resulting in a large number of complaints.
In accordance with the WHO (World Health Organization), in the Guidelines for Community Noise [20], and Romanian legislation [21], it is specified that local economic activities with noise and vibration sources should be placed at a distance from the protected territories such that the equivalent continuous sound level at the building facade is under 55 dB(A) in the day period (from 7:00 to 23:00) and 45 dB(A) in the night period (from 23:00 to 7:00). The numerical modelling of the studied area was made using the IMMI software from Wölfel, which supports the requirements of Directive 2002/49/EC with the calculation method from ISO 9613-2. For outdoor cases, the IMMI software supports different methods for sound reflections calculation: the mirror source method and the ray tracing method.
The mirror source method gets very time-demanding when you have a higher order of reflections (2nd, 3rd or 4th order) in combination with a lot of reflecting surfaces. IMMI analyses the desired reflection order and the number of reflectors in a first step and then decides which method should be used. For a simple project with the 1st reflection order, the mirror source method will be used and for high orders of reflection, the ray tracing method will be used. In the present study, 2nd order reflection was adopted using the ray tracing method. The ray tracing method consists of substituting the sound wave with a ray which is a straight line emanated by the noise source, carrying a sound energy, which is specular reflected by the walls with a reduction in the energy according to the imposed reflection coefficients of the walls. The prediction software requires different input data: land surfaces with their acoustic characteristics, the shape and the heights of the buildings, noise power levels of the noise sources, etc. The geospatial vector data of residential buildings, the administrative buildings and other buildings from the analysed area were modelled with the IMMI software. The numerical model needs data related to humidity and temperature in order to compute the sound waves propagation into the air. According to the yearly average of Romania’s climate, a relative humidity of 70% and a temperature of 10 °C were introduced in the numerical model. Special attention was given to buildings modelling, which significantly influences noise propagation due to reflection. In this case, the attenuation due to reflection at the facades of the building was set at −1 dB and due to the lack of vegetation, the ground attenuation was set to G = 0 which represents reflecting ground.
The main noise sources considered in this noise impact study were generated by the air conditioners, heat pumps and the loading and uploading activities performed on the supply ramp of the commercial centre. Figure 1 presents the entire numerical model which consists of: buildings (represented with grey), the noise sources’ positions (in the zoomed section) and the location of the virtual receivers that coincide with the location of the measurement’s points.
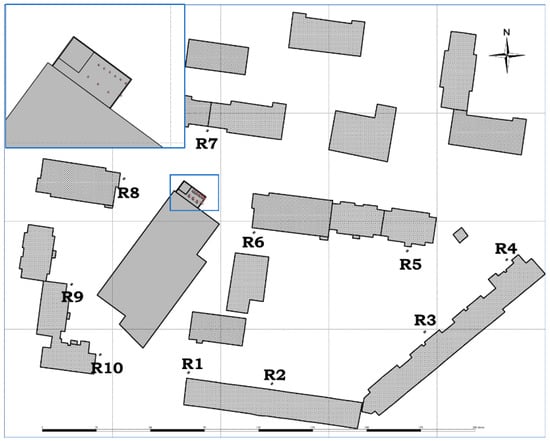
Figure 1.
Thematic layers (shaded buildings: residential buildings, grey building: residential centre, loudspeakers: noise sources, points: virtual receivers).
To assess the background noise in this area, acoustic measurements were made at 3 m from the building’s façade and 1.5 m height in accordance with the ISO 1996-2 [22]. Further, in the prediction software, the receiver’s points were placed in the same places as the measurement’s points.
Figure 2 presents the equivalent continuous sound pressure level (LAeq) from the measurements campaign, during the day and night periods, where the dotted lines represent the noise limits for the day and night periods. Figure 2 highlights that prior to the construction of the commercial centre, the noise at the façade of the surrounding buildings is generated mainly from the road traffic. Thus, the community noise in this area is below the legal limits.
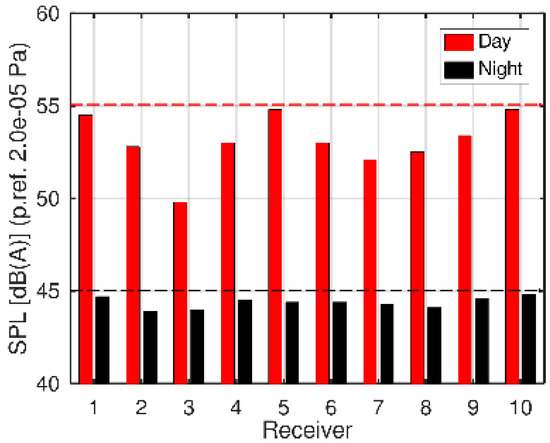
Figure 2.
Equivalent continuous sound pressure level (LAeq) at the building’s façade before building the shopping centre (red bars and dotted line: day period, black bars and dotted line: night period).
2.2. Buildings Modelling
The vectorised model of the commercial centre building was made according to the construction drawings provided by the constructor (the height regimes, walls material and the number and positions of the noise sources). As can be seen in the zoomed section of Figure 1, on the roof of the commercial centre, there are nine noise sources (eight air conditioners, model RV4B0909, each one having a sound power level of 62 dB(A) and a dry cooler, GFW 090.1/2-S(L)-F4/01/6P, with a sound power level of 75 dB(A). These sound power levels were taken from the technical specifications of the cooling systems that were provided by the constructor. In the prediction software, these cooling systems were modelled as point sources which radiate noise as a monopole source. The tenth noise source is represented by the supply ramp which is also considered as a point source, for which a sound power level of 90 dB(A) was defined.
For each residential building, the number of inhabitants has been defined depending on the number of apartments from that building. The predictions performed in this study do not take into account the traffic and other noise sources, the only noise sources being represented by the loading/uploading activities generated only in the day period and the cooling systems that function continuously.
This study presents 5 scenarios in which various methods of reducing the noise are studied. The first scenario presents the worst case, with the prediction of the noise generated by all sources and with no barriers. In the second scenario, an acoustic barrier at 2.3 m height is designed to screen the noise from the supply ramp. The third scenario presents an improved acoustic barrier with a bigger height of 4 m, whose geometrical parameters are presented in Figure 3. Both sound barriers from the second and third scenario consist of a sandwich panel with a perforated metal sheet, fibrous material and an unperforated metal sheet. For the sound barrier, the absorption coefficient was set to 0.6 only for the interior part of it and a transmission loss of 30 dB. The barrier was placed at a distance of L = 8.5 m, parallel with the supply ramp in order to permit the entrance of the supply van. For a better noise masking effect for the apartments at upper floors, in the third scenario, a sloped barrier was studied with the following parameters: height of the barrier Z = 4 m, and the height and the length of the sloped portion of the barrier dH, dV = 1.5 m, as is presented in Figure 3.
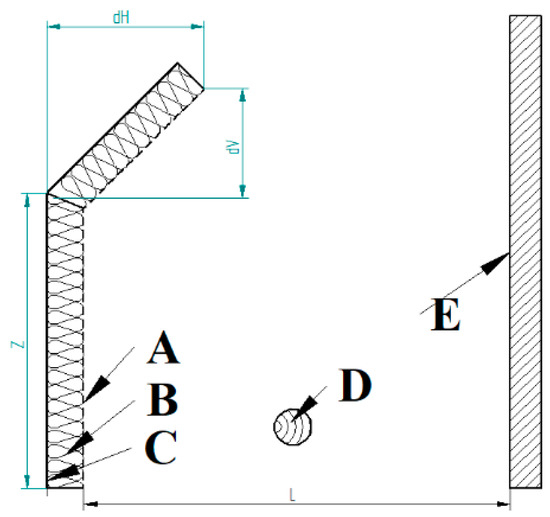
Figure 3.
Barrier design and location (barrier components: A—perforated metallic sheet, B—porous material, C—unperforated sheet; D—the supply ramp modelled as a point source, E—commercial centre wall, L—distance between barrier and commercial wall).
In the fourth scenario, a closed construction made by sandwich panels with a perforated aluminium sheet on one side and mineral wool inside is constructed to insulate the noise generated by the supply ramp. Thus, the supply van will enter in this closed enclosure provided with a sliding door, that will reduce the noise propagation. For this sandwich panel, a sound transmission loss of 30 dB was set in the software. It must be mentioned that the supply activities are performed only in the day period (after 7:00). The fifth scenario completes the fourth scenario by adding sloped barriers next to the cooler units, thereby aiming to reduce also the noise generated in the night period by these cooling systems. Figure 4 presents all the scenarios and the proposed technical solutions to reduce the noise propagation.
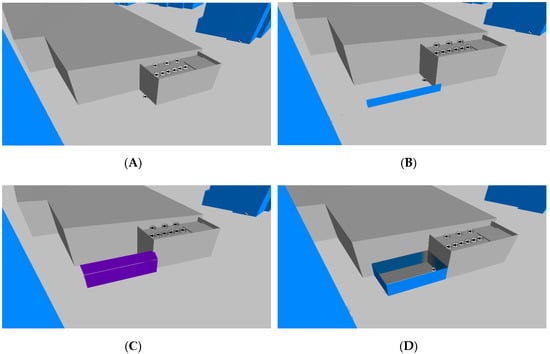
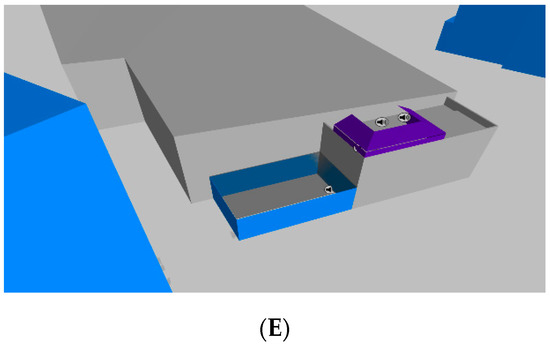
Figure 4.
3D model with the cooling systems, supply ramp and residential buildings ((A) Scenario 1, (B) Scenario 2, (C) Scenario 3, (D) Scenario 4, (E) Scenario 5).
3. Results
In the following figures, the results of the acoustic predictions made for the day period at a height of 4 m, as is specified in EU DIRECTIVE 2002/49/EC, and also at 10 m are presented for each scenario. Predictions with noise levels at 10 m were performed in order to observe the noise propagation at upper floors. Considering in this case that the noise sources are situated at 6 m height from the ground on a reflective surface, the noise propagation must be evaluated at different heights.
The noise map resulting from Scenario 1 at a height of 4 m (see Figure 5) emphasizes that the noise emission produced by the cooling systems is screened by the roof of the building, the supply ramp source is stronger than the other sources and the noise propagation is directed towards the two buildings in the north and east. In the noise map obtained at a height of 10 m, it is observed that the noise is widespread and the building facades are exposed to higher noise levels due to the fact that the levels of the two noise sources are summed.
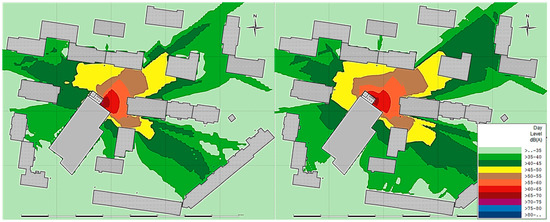
Figure 5.
Scenario 1 with no technical solution—Lday with all noise sources (left: 4 m, right: 10 m).
By installing a barrier with a height of only 2.3 m in parallel with the unloading area (see Figure 6) at heights under 4 m, the supply activity noise will be directed along the barrier, while at higher heights, the noise has almost the same mode of dispersion as in Scenario 1 but with lower amplitudes. A better reduction in noise propagation at a higher height can be achieved only by installing very high acoustic barriers, as shown in Scenario 3.
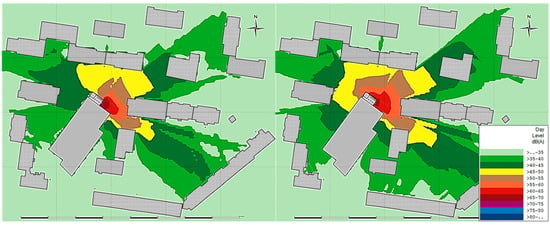
Figure 6.
Scenario 2 with acoustic barrier of 2.3 m—Lday with all noise sources (left: 4 m, right: 10 m).
As is presented in Figure 7, at low heights, these acoustic barriers with a total height of 5.5 m lead to an accentuation of the noise propagation along them. It can also be seen that the space left between the barrier and the centre of the building leads to multiple reflections between them, producing a leak of noise that spreads to the north of the building. Due to the height of the barriers and the sloping portion, the noise is “trapped” and the propagation at upper floors is smaller than in Scenario 2. The next technical solution is designed to maintain and absorb the supply noise without letting it propagate freely.
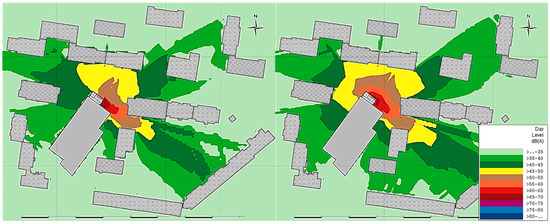
Figure 7.
Scenario 3 with a sloped acoustic barrier and higher height—Lday with all noise sources (left: 4 m, right: 10 m).
In Scenario 4 (see Figure 8), an interesting effect is produced which can be observed in the noise map from 10 m. The noise from the supply ramp, which until now was the major one, in this case it have almost the same amplitude as the noise generated by the cooling systems from the roof. This effect is given by the uniform directivity of noise and the absence of acoustic lobes. Due to the continuous functioning regime of the chiller and its tonal character, another solution is proposed to be studied, in which a set of acoustic barriers is mounted on the roof next to the cooling systems.
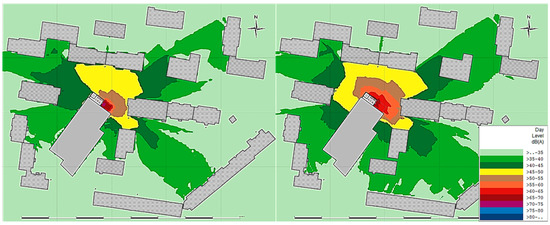
Figure 8.
Scenario 4 with a supply ramp inside a construction—Lday with all noise sources (left: 4 m, right: 10 m).
The noise maps for Scenario 5 (see Figure 9) highlight that the acoustic barriers have an outstanding effect at both studied heights, the noise being reduced especially in the north and in west parts. In the east part, the remaining noise is caused by the transmission of the supply ramp noise through the enclosure walls which was presented in Scenario 4.
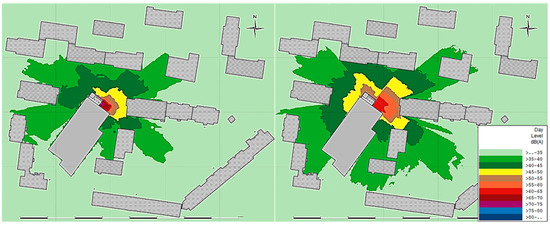
Figure 9.
Scenario 5 with a supply ramp inside a construction and acoustic barriers on the roof—Lday with all noise sources (left: 4 m, right: 10 m).
Figure 10 presents the noise levels calculated in each receiver point for each scenario for the day period. The sound pressure levels were evaluated at 1.5 m, in accordance with the national legislation.
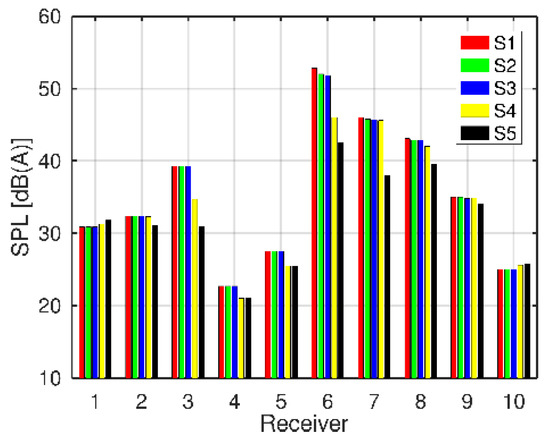
Figure 10.
Noise level in each receiver at 1.5 m—Lday with all noise sources.
The noise values from the receiver points do not highlight any exceeding of the noise limits. The barrier solutions from Scenarios 1 and 2 do not lead to any significant noise reduction, the maximum attenuation being 0.8 dB. At 4 m height, the noise is lower than at 10 m due to the masking effect of the building on which the air conditioner units are placed. Therefore, a study of the noise level only at 4 m is not conclusive and inhabitants at higher floors can face noise level problems. To predict the noise impact, namely the noise exposure of the inhabitants, a facade calculation was adopted in accordance with the VBEB method. This method is according to the German national method, in which the inhabitants are proportionally allocated to the receiver points where noise is calculated; the sum over all receiver points of a building represents the total number of inhabitants [23,24]. The result of the VBEB analysis is presented in Table 1.

Table 1.
Inhabitants’ noise exposure in the day period.
The noise levels computed in receiver points did not identify any exceeding of the noise limits, but the VBEB method identified a number of 16 persons in Scenario 1, 13 persons in Scenario 2 and 5 persons in Scenario 3, that are exposed at noise levels higher than 55 dB(A). To have an overview of the noise propagation of the most exposed buildings, Figure 11 presents the acoustic prediction for Scenario 2 and the solution with the best results from Scenario 5. In Scenario 2, the closest building is exposed at a noise level higher than 55 dB(A).

Figure 11.
Lday—façade calculation plots (left: Scenario 2, right: Scenario 5).
The above predictions were considered for the day period with all noise sources, including the supply ramp noise. Considering that the heat pumps and air conditioning units are running continuously, even in the night period and especially during the summer, a new study was performed by removing the noise generated by the supply ramp. This evaluation is needed in order to verify if the night noise limit of 45 dB(A) is exceeded. The assesment was made by computing the noise level in receiver points and also by using the VBEB method.
For night-time, in the predictions of the Scenarios 1 to 4, the same noise levels are obtained due to the fact that the proposed technical solutions have an insignificant influence in the propagation of the chiller noise. Only in Scenario 5, the acoustic barriers from the roof will act as an absorbent obstacle with attenuation effects. Thus, the noise levels computed in virtual receivers are presented only for Scenarios 1 and 5. From Figure 12, it is observed that at 1.5 m height in receivers R6 and R7, a noise reduction of almost 10 dB is obtained between the two scenarios.
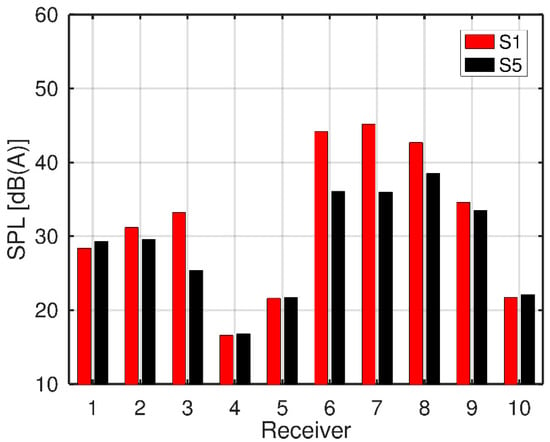
Figure 12.
Noise levels predicted in each receiver—Ln only with roof noise sources (red: Scenario 1, black: Scenario 5).
The VBEB analysis performed for night period (see Table 2) performed for Scenario 1 highlights a number of 114 inhabitants exposed at a higher level than 45 dB, while in Scenario 5, all the inhabitants are exposed at noise levels smaller than 45 dB.

Table 2.
Noise exposure of people in the night period.
For a better comparison of the noise propagation pattern generated in Scenario 1 with the noise from Scenario 5, the next noise maps present the computed noise fields in the night period at 4 and 10 m height. Without any obstacles, the noise is spread in all directions, especially at higher heights than the roof, as is presented in Figure 13. In the west part, below the roof height, the noise is screened by the shopping centre roof and thus the residential buildings are exposed at lower noise levels.
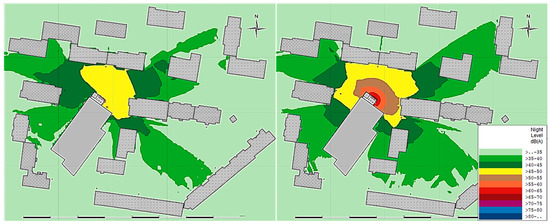
Figure 13.
Ln—Scenarios 1, 2, 3 and 4 (left: 4 m, right: 10 m).
The noise barriers mounted on the roof produce a high noise reduction even at high heights, as is presented in Figure 14, or in the façade calculation presented in Figure 15. Comparing the noise maps of the scenarios without noise barriers with Scenario 5, another effect can be observed. In the case with the noise barrier on the roof, for the noise that hits the barrier, a part of its energy is absorbed due to the imposed absorption characteristics and the other part is reflected in the south direction. This phenomenon does not lead to any noise problem in this part of the analysed area.
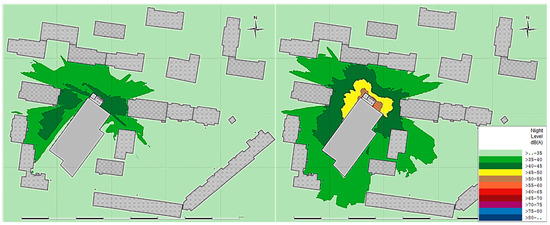
Figure 14.
Ln—Scenario 5 (left: 4 m, right: 10 m).

Figure 15.
Ln—façade calculation plots (left: Scenarios 1, 2, 3 and 4, right: Scenario 5).
Comparing the façade calculation of Scenarios 1, 2, 3 and 4 with the one in Scenario 5, big amplitude differences can be observed from a maximum of 55 to 45 dB. Further investigations could be performed in accordance with the standard ISO 1996-2/2017 and the European Noise Directive, in order to measure the noise levels at the façade level, at different heights and with different distances of the microphone from the source. Such measurements could offer the possibility to make a correction of the simulated values. It is known that in the case of multi-storey buildings, the noise level increases with the hight till 5 m, and after that, the level decreases, as was investigated in detail by Morillas J. M. B et al., with a source located at the ground level, as traffic noise [25]. Such a correction of simulated noise levels of a source situated at a higher level relative to the ground, with the height and distance from the source, could offer a better estimation of the noise environment in an agglomerate building area with many reflected facades. If the noise source is located at a higher level, as is the case for HVAC systems placed on a building, the absorption influence of the ground and vegetation is estimated to be lower.
4. Predictions Validation
The above scenarios and predictions were performed before the construction of this shopping centre, the study being a mandatory requirement to obtain the construction permit. In Figure 16, presented are the satellite images with the analysed area before the construction and the other image with the construction finalized and functional. In this chapter, a validation procedure of the previous predictions is proposed. The validation procedure consists of a comparison of the noise levels obtained through simulation with those measured in the field.
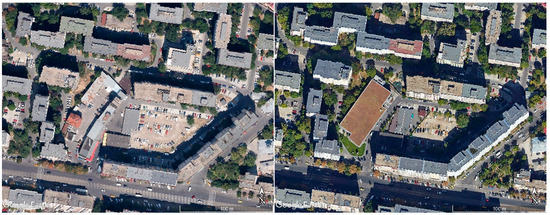
Figure 16.
Analysed area (left: before constructing the shopping centre, right: after the construction).
It must be mentioned that the constructor has implemented the noise barrier studied in Scenario 2 and presented in Figure 17.
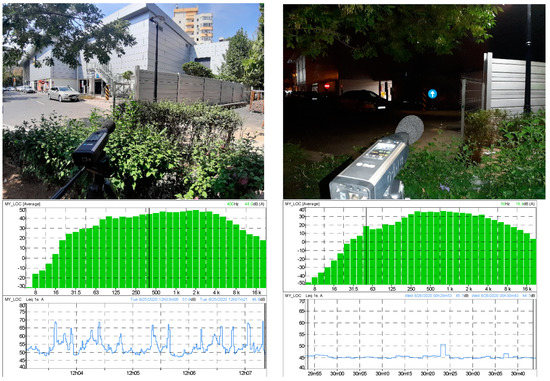
Figure 17.
Noise measurements in R6 point during the day and night periods (upper part: images with the sound level meter, bottom: average sound spectra and the Laeq (1 s) variation in time, left part: day, right part: night).
The noise maps revealed that the most exposed buildings are situated near the noise sources. As is presented in Figure 1, for each residential building, a virtual receiver was defined according to the location in the measurement campaign, performed before the construction. The validation procedure is based on the comparison of the sound pressure levels predicted with those measured in receiver points 6, 7 and 8. The measurements were made using a FUSION sound level meter from the company 01 dB, mounted on a tripod at a height of 1.5 m. The measurements were performed both in the day and night periods, and in Figure 17, the presented images are from during the measurements and below each image are the overall sound pressure level (OASPL) variation in time and the averaged spectrum for the measured period. The measurements during the day indicate high-amplitude peaks which are produced by the unloading/loading from the supply van.
It must be mentioned that during the night measurements, the cooling systems were functional and the measurements were made in a period with no traffic and no other noise sources, as can be seen from the variation of the Laeq 1 s (where one second denotes the time period over which the fluctuating sound levels were averaged).
During daytime noise measurements, unloading and loading activities were performed on the supply ramp, as shown in Figure 18.
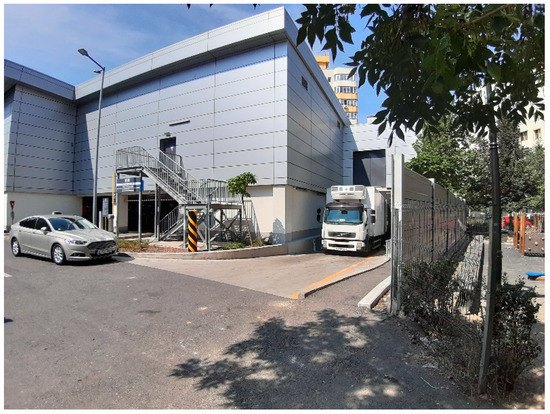
Figure 18.
Supply ramp, acoustic barrier and shopping centre building.
In Figure 19, presented are the sound pressure levels in the measurement points R 6, 7 and 8, measured before and after the construction of the shopping centre, and also the sound pressure levels resulting from the acoustic prediction made for Scenario 2. The measurements during the day indicate that the noise trend will increase after the construction of the centre. The values obtained from the acoustic prediction are different from those measured, this being caused by the fact that in the simulations, the road traffic and other noise sources were not modelled. Considering that no noise sources, other than those studied, were measured during the night, it is considered that the measured noise is generated entirely by the sources on the roof. The comparison of the measured data with the predicted ones during the night indicates good agreement between them, and it can be concluded that the prediction results are valid and this numerical solution is a good tool for noise assessment and prevention method. The differences between the simulated and the measured values reach a level of maximum at 1.5 dB.
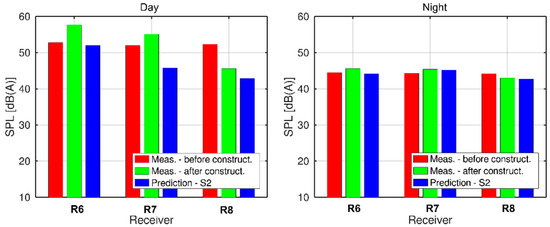
Figure 19.
Comparative analysis between the predicted and the measured sound levels in the “hot spot” receivers for the day and night periods.
5. Conclusions
The paper has presented a noise impact study of a commercial centre which was planned to be constructed in a residential area where the distance between the noise sources and the residential buildings is smaller than 20 m. The noise impact was performed using IMMI noise prediction software, in which the calculation method was in accordance with ISO 9613-2. In the day period, the commercial centre noise is produced by the ACs&HPs functioning and the noise generated by the activities from the supply ramp. The noise generated by the traffic and other sources have not been studied in this paper.
The assessment of commercial centre noise was made by defining the receiver points and performing two 2D prediction calculations at 4 m and 10 m height, followed by a façade calculation. The façade calculation highlighted its utility by identifying the number of inhabitants exposed at high noise levels. Further, from the façade plots, the conflict areas are more visible. The study presents five scenarios in which different technical solutions are presented in order to reduce the noise on the shopping centre’s surrounding area. The predictions showed that in order to reduce the number of exposed inhabitants to noise, both acoustic barriers installed on the roof near the cooling units and the construction of an enclosure in which the truck can enter are necessary. With these two modelled technical solutions, it is assumed that no inhabitant will be exposed to noise levels higher than those provided by law, both during the day and night.
The measurements performed in situ after the construction of the shopping centre have shown good agreement with the predicted values, which confirms that the acoustic predictions made with the acoustic mapping software are a useful tool in combating urban noise.
Author Contributions
Conceptualization, M.D., L.C.; Data curation and experiments and validation, M.D., G.C.; writing—original draft preparation, M.D., L.C.; writing—review and editing, M.D., G.C., L.C. All authors have read and agreed to the published version of the manuscript.
Funding
This research received no external funding.
Conflicts of Interest
The authors declare no conflict of interest.
References
- Seidman, M.D.; Standring, R.T. Noise and Quality of Life. Int. J. Environ. Res. Public Health 2010, 7, 3730–3738. [Google Scholar] [CrossRef] [PubMed]
- Schafer, R.; Schafer, M. World Soundscape Project; Simon Fraser University (SFU): Burnaby, BC, Canada, 1978; Available online: https://researchdata.sfu.ca/islandora/object/islandora%3A9880 (accessed on 17 September 2020).
- Lee, H.M.; Liu, Y.; Lee, H.P. Assessment of acoustical environment condition at urban landscape. Appl. Acoust. 2020, 160, 107126. [Google Scholar] [CrossRef]
- Meng, Q.; Kang, J. Effect of sound-related activities on human behaviours and acoustic comfort in urban open spaces. Sci. Total. Environ. 2016, 573, 481–493. [Google Scholar] [CrossRef] [PubMed]
- Rodrigues, R.C. Quiet areas and urban sustainability. Energy Procedia 2018, 153, 334–341. [Google Scholar] [CrossRef]
- Nowicka, E. The acoustical assessment of the commercial spaces and buildings. Appl. Acoust. 2020, 169, 107491. [Google Scholar] [CrossRef]
- Della Crociata, S.; Simone, A.; Martellotta, F. Acoustic comfort evaluation for hypermarket workers. Build. Environ. 2013, 59, 369–378. [Google Scholar] [CrossRef]
- Du, X.; Zhang, Y.; Lv, Z. Investigations and analysis of indoor environment quality of green and conventional shopping mall buildings based on customers’ perception. Build. Environ. 2020, 177, 106851. [Google Scholar] [CrossRef]
- ISO 13261-1; Sound Power Rating of Air-Conditioning and Air-Source Heat Pump Equipment—Part 1: Non-Ducted Outdoor Equipment; International Organization for Standardization: Geneva, Switzerland, 1998.
- El-Sallamy, W.; Osman, T.; Abbas, S. Acoustic consultant—An under-development novel indoor and outdoors noise assessment software. Ain Shams Eng. J. 2018, 9, 3305–3313. [Google Scholar] [CrossRef]
- Park, S.H.; Lee, P.J.; Jeong, J.H. Effects of noise sensitivity on psychophysiological responses to building noise. Build. Environ. 2018, 136, 302–311. [Google Scholar] [CrossRef]
- Istrate, I.A.; Oprea, T.; Rada, E.C.; Torretta, V. Noise and air pollution from urban traffic. WIT Trans. Ecol. Environ. 2014, 191, 1381–1389. [Google Scholar]
- ISO 9613-2; Attenuation of Sound during Propagation Outdoors—Part 2: General Method of Calculation; ISO: Geneva, Switzerland, 1996.
- de Souza Filho, J.J.; Steffen, J.L.; Andreasi, W.A.; Trombetta, P.H. Urban Noise Assessment based on noise mapping and measurements. Can. Acoust. 2015, 43, 3–10. [Google Scholar]
- Stoter, J.; Peters, R.; Commandeur, T.; Dukai, B.; Kumar, K.; Ledoux, H. Automated reconstruction of 3D input data for noise simulation. Comput. Environ. Urban Syst. 2020, 80, 101424. [Google Scholar] [CrossRef]
- European Commission Directive 2002/49/EC of the European Parliament and of the Council of 25 June 2002 relating to the assessment and management of environmental noise. Off. J. Eur. Communities. 2002, 159, 24–25. Available online: https://eur-lex.europa.eu/legal-content/EN/TXT/PDF/?uri=CELEX:32002L0049&from=EN (accessed on 17 September 2020).
- Kotronarou, A.; Lykoudis, S. A case study of the effect of assessment height of the END noise indicators on the estimation of population exposure to road traffic Noise. In Proceedings of the 23rd International Congress on Sound and Vibration, Athens, Greece, 10–14 July 2016. [Google Scholar]
- Montes González, M.; Morillas, J.B.; Gozalo, G.R. The influence of microphone location on the results of urban noise measurements. Appl. Acoust. 2015, 90, 64–73. [Google Scholar] [CrossRef]
- Oegren, M.; Jerson, T.; Oehrstroem, E.; Gidloef Gunnarsson, A. Difference between using 2 and 4 meter receiver height in railway noise prediction. In Noise and Vibration Mitigation for Rail Transportation Systems; Springer: Tokyo, Japan, 2012; Volume 118, pp. 541–546. [Google Scholar]
- Berglund, B.; Lindvall, T.; Schwela, D.H.; World Health Organization. Guidelines for Community Noise; World Health Organization: Geneva, Switzerland, 1999. [Google Scholar]
- Order of Ministry of Health 119/2014. For Approval of the Hygiene and Public Health on the Population’s Life, Off. J. of Romania, 130/20 February 2014. Available online: https://www.iso.org/obp/ui/#iso:std:iso:1996:-2:ed-3:v1:en (accessed on 17 September 2020).
- ISO 1996-2 second edition; Acoustics—Description, Measurement And assessment of Environmental Noise—Part 2: Determination of Environmental Noise Levels Annex C; International Organization for Standardization: Geneva, Switzerland, 2017.
- Licitra, G.; Ascari, E.; Brambilla, G. Comparative analysis of methods to evaluate noise exposure and annoyance of people. In Proceedings of the 20th International Congress on Acoustics, Sydney, Australia, 23–27 August 2010; ICA: Sydney, Australia, 2010. [Google Scholar]
- Umweltbundesamt. Vorläufige Berechnungsmethode zur Ermittlung der Belastetenzahlen durch Umgebungslärm—VBEB; Federal German Gazette, No. 154a; Umweltbundesamt: Berlin, Germany, 9 February 2007. Available online: https://www.bmu.de/fileadmin/bmuimport/files/pdfs/allgemein/application/pdf/berechnungsmethode_umgebungslaerm.pdf (accessed on 17 September 2020).
- Morillas, J.M.B.; Gonzale, D.M.; Gozalo, G.R. A review of measurement procedure of ISO 1996 standard. Relationship with the European Noise Directive. Sci. Total Environ. 2016, 565, 595–606. [Google Scholar] [CrossRef] [PubMed]
© 2020 by the authors. Licensee MDPI, Basel, Switzerland. This article is an open access article distributed under the terms and conditions of the Creative Commons Attribution (CC BY) license (http://creativecommons.org/licenses/by/4.0/).