1. Introduction
Landslides, as the most common natural geohazard type in mountainous areas, often cause heavy economic loss and human casualties [
1]. According to the statistical data in the Three Gorges Reservoir Area (TGRA), increasing slope instabilities have occurred since the establishment of the Three Gorges Dam and the official impoundment of the reservoir [
2,
3,
4]. As a world-famous example of a human engineering project seriously impacting the surrounding environment, the TGRA provides a perfect scenario for scholars around the word [
5]. Since the official impoundment in 2003, over fifteen years of reservoir water level fluctuations have influenced the stress forces redistribution in the reservoir banks, thus fostering instability and mass movements [
6]. After the initial rise, the amount of geomorphic movements and landslide occurrences declined each year as the reservoir bank stabilized [
7]. Huge amounts of human and monetary resources were injected to carry out a large number of investigations and engineering remedial works in the reservoir bank area, aiming at a full understanding of the reservoir bank stability [
8].
In recent years, the trend of technical innovation and method improvements intensified due to the gradual maturity of advanced technologies, such as ground-based interferometric synthetic aperture radar (InSAR) [
9], InSAR [
10], and light detection and ranging (LiDAR) [
11]. Currently, InSAR has been accepted and widely used in many landslide investigations. Undoubtedly, InSAR is an effective and powerful tool in hazard researches; however, it is still inadequate to study the intricate relationship between deformation and failure simply according to InSAR ground surface deformation analysis results. At present, the applications of InSAR in the geohazard field can be divided into six categories: Hazard identification [
12,
13], hazard mapping [
14], systematic monitoring (e.g., [
15,
16]), prediction and early warning [
17], and stability analysis [
18] and hazard remedial measures effect inspection [
19,
20].
As the earliest experimental site of landslide InSAR monitoring technology, under the support of the China Geological Survey, corner reflectors were established on the Xintan landslide and Lianziya landslide in the TGRA early from 1999 [
21]. For over ten years of technical advancement, more monitoring test sites were set up in representative landslides, such as Shuping landslide and Fanjiaping landslide, etc. hoping to find a reliable InSAR monitoring technique process [
3,
22,
23].
Due to its unique geographic position and geological conditions, large-scale engineering remedial work was conducted in the TGRA. Landslides with engineering remedial work were typically considered to be stable and no longer monitored, which led to an underestimation of the residual risk. Research monitoring the performance of the remedial work also focused on single landslides instead of the large scale of engineering prevention work covering a regional space [
19,
20]. To quantitively evaluate the performance of remedial work, researchers carefully selected the evaluation indexes and divided them into five categories according to the fundamental types and hazard prevention features, to build an evaluation index system [
24].
The objective of this work was to study the geohazards, with a special focus on controlled landslides. In particular, the activity relied on the following steps: (i) Large-scale slow-moving landslide mapping to identify the active landslides, employing InSAR-HCA (hotspot and clustering analysis); (ii) single slope-scale landslide deformation analysis combining InSAR time-series analysis, conventional ground monitoring, and field investigation methods; and (iii) landslide engineering remedial work performance evaluation considering its operating conditions and landslide deformation.
2. Materials and Methods
2.1. Geological and Geomorphological Settings
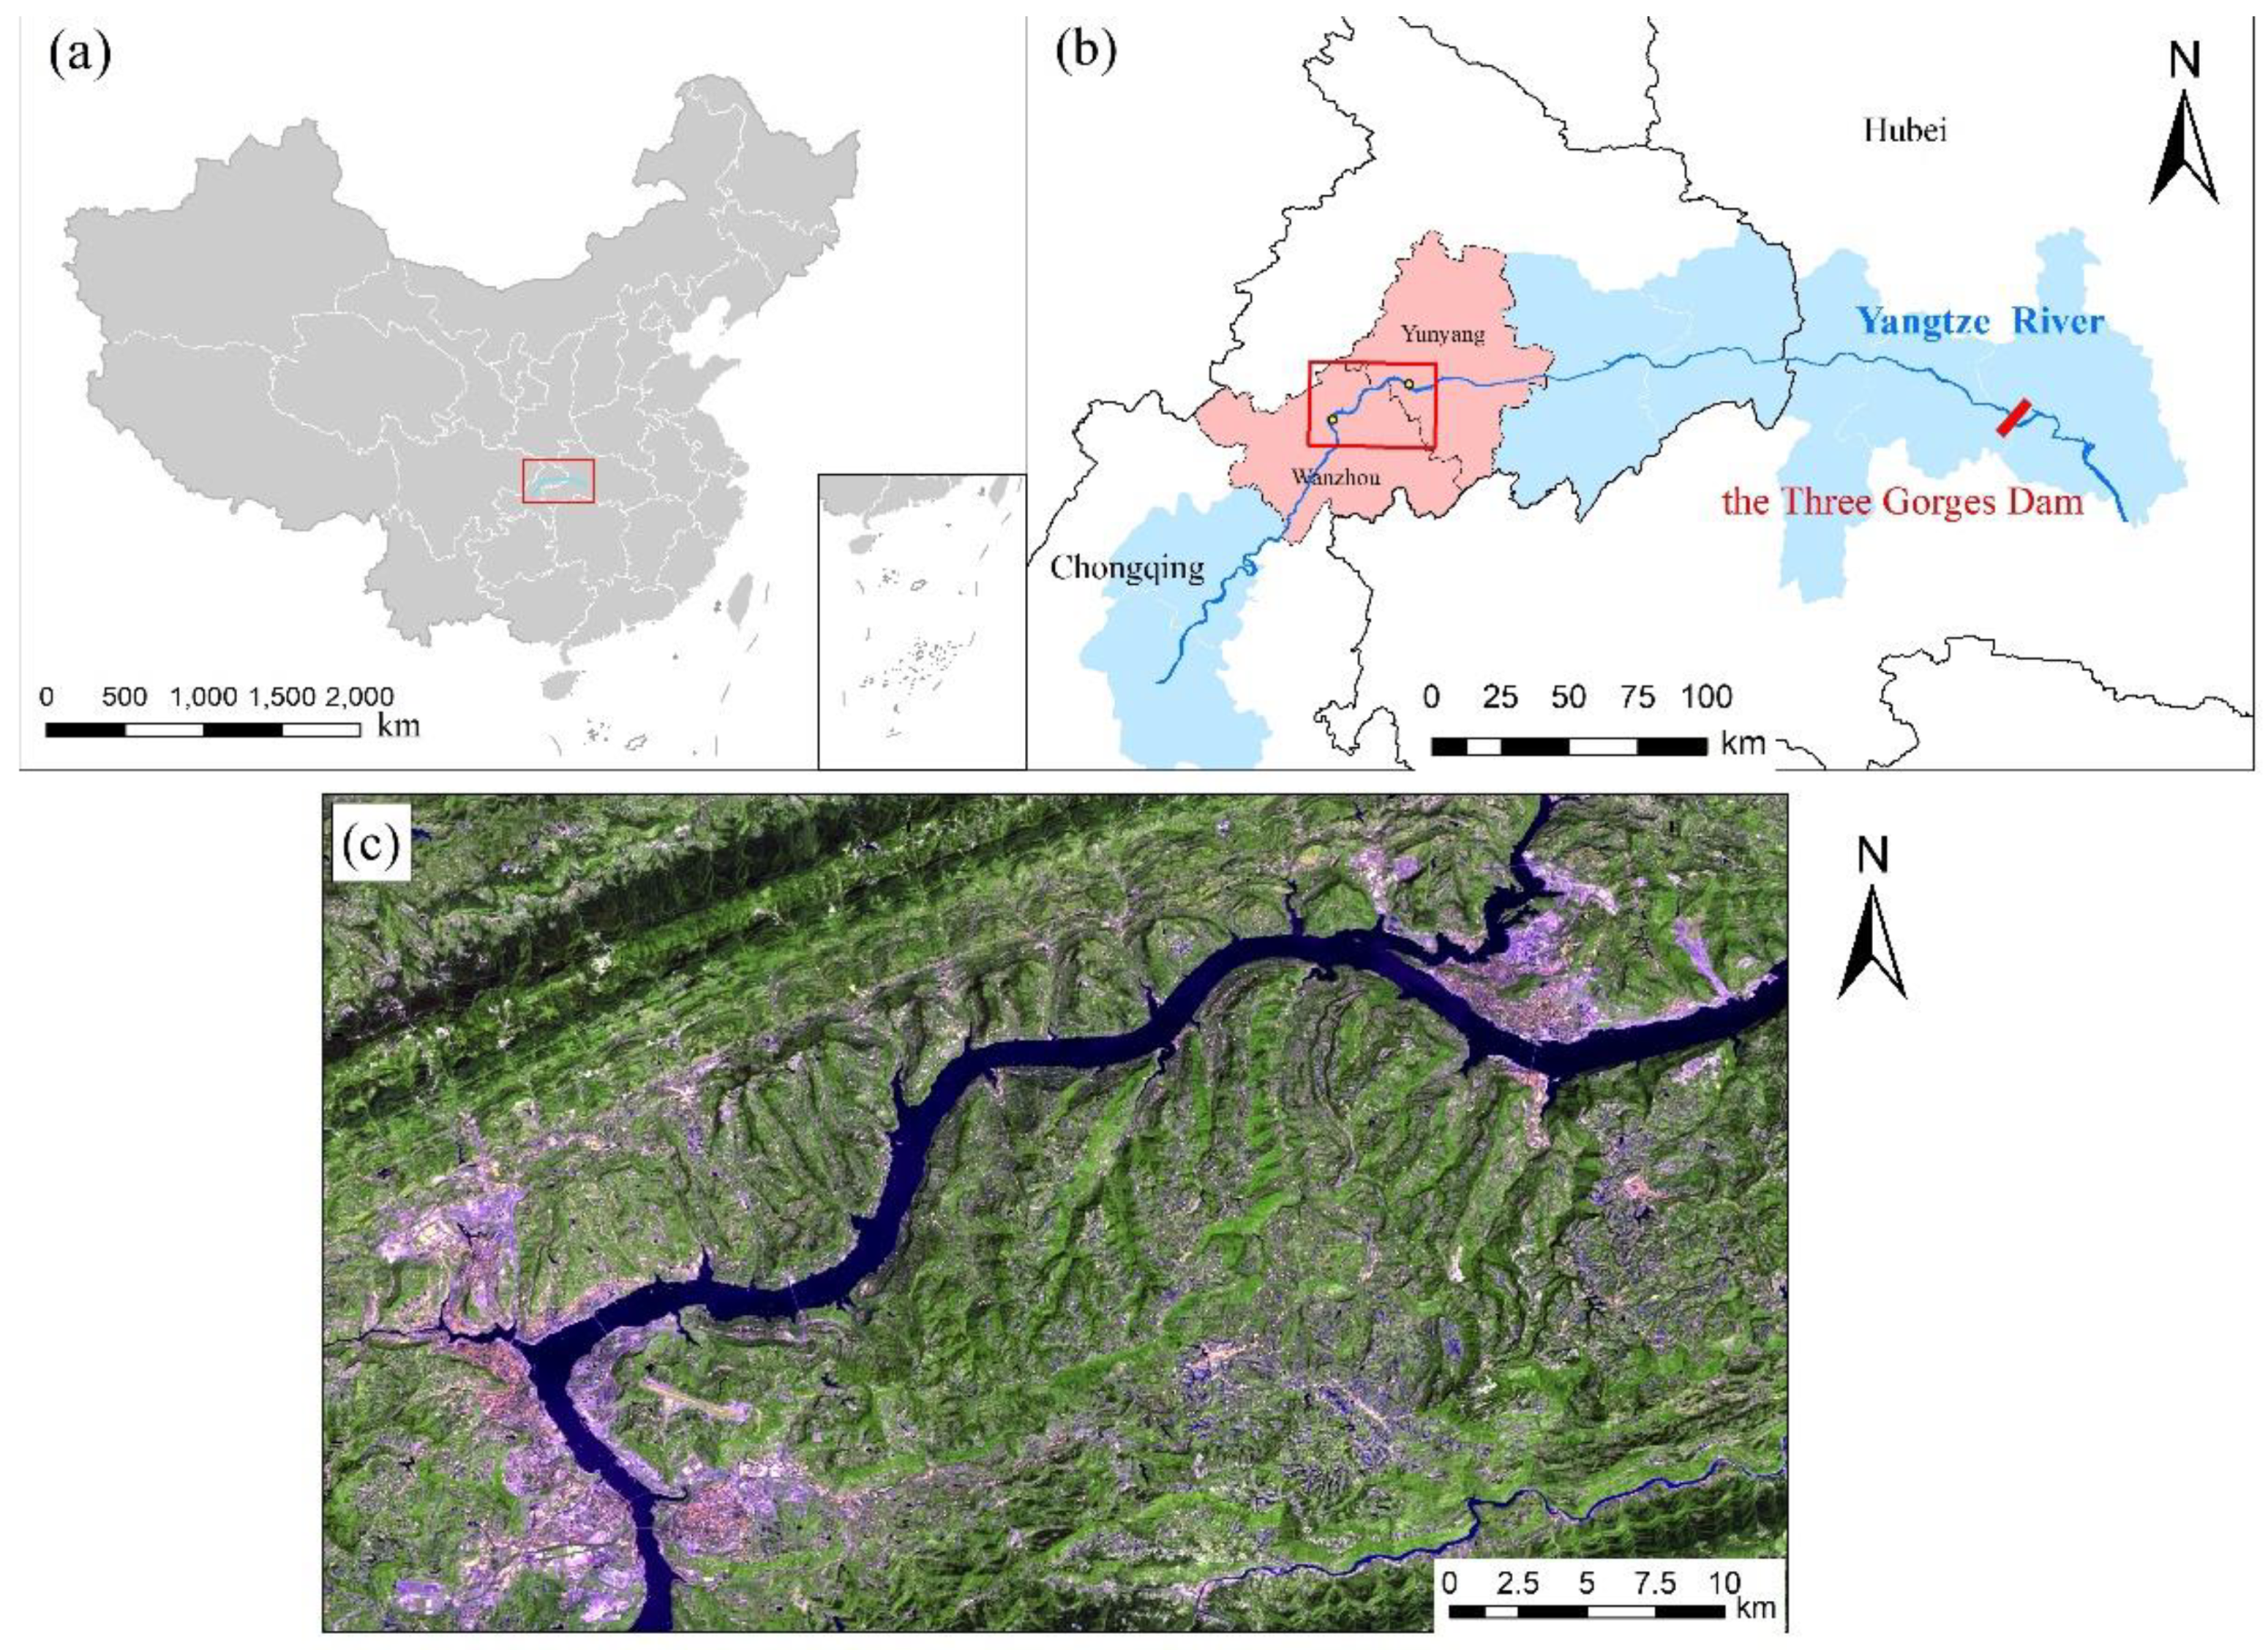
The TGRA is a typical narrow strip reservoir with an average width of 1.576 m. When the water level of the TGRA reaches its normal water level of 175 m, the total length of the reservoir is 663 km. The study area is located in the central reaches of the TGRA, Southwestern China, within longitude 108°18′–108°48′ east and latitude 30°43′–31° north (
Figure 1). This area belongs to Chongqing, and the total area is approximately 1350 km
2. The region is surrounded by mountains with elevations ranging from 45 to 1598 m above sea level, with the Yangtze River flowing across from south to northeast. Several tributaries flow in the main river, shaping a well-developed water system. The average annual rainfall reaches 1200–1400 mm, and the monsoon season is from April to September, when the maximum monthly rainfall is larger than 300 mm.
In
Figure 1, a false color synthetic image was generated using bands 8, 4, and 3 of a Sentinel-2 image (acquired on 4 August 2018), to better display the distribution of urban center areas and anthropic elements at risk, with purple indicating the main city constructions and green representing mountainous and vegetated areas.
From a geological point of view, the study area consists of a Mesozoic terrigenous sequence interbedded with Jurassic and Triassic claystone, marlstone, and sandstone, deposited in a nearly horizontal direction (
Figure 2).
Table 1 provides explanations to the lithological and stratigraphic unit.
The overall topography shows a trend of elevation decline from southeast to northwest. Due to the TGRA regional crustal uplift and the local interbedded strata differential weathering, coupled with the incision effect of the Yangtze river and its tributaries, the overall landscape of this region presents a typical step-like morphology, with eroded multi-level fluvial terraces, floodplains, denuded low mountains, and sporadically distributed hills. The area is affected by tectonism, with developed fold structures characterized by tight anticlines and wide synclinals distributed in echelon form. As the Yangtze river runs right through the core of the main sysclinorium, which consists of the Wanxian syncline, Huangbaixi syncline, and Xinchang anticline, both sides of the riverbank have bedding slopes. Such relation between the slope aspect and strata inclination caused the slope bank structure to be more prone to landslides. Indeed, several studies highlighted that landslides are one of the most important geomorphological processes shaping the landscape of the study area [
25,
26].
2.2. Landslide Inventory and Landslide Characteristics
Landslide inventory is the basis for all hazard analyses. The original landslide database was realized by the China Geological Survey, through a series of field investigations and historical landslide data, and later updated by remote sensing, using high-resolution images of Pleiades-1 (22/09/2014) and GF-2(06/12/2015). As landslides within the range of the reservoir area are the main objective of this study, landslides situated far from the riverbank were intentionally excluded from the inventory. The final inventory counted 310 landslides delineated as polygons, including 58 landslides under the control of engineering remedial works and about 30 landslides of interest in ongoing monitoring programs. All the selected landslides can be defined as rotational/translational slides or as complex landslides, with sizes ranging from 1360 m2 to 1.28 × 10⁶ m2. The information about the landslide boundaries and engineering projects was collected from the third phase of the Three Gorges engineering project geological disasters prevention and control plan, and the related engineering geological survey and design data was based on the work of the Institute of geological environment monitoring, China Geological Survey.
Statistical analysis of the inventory data demonstrated a strong correlation with the geological setting, with landslides basically occurring in strata with dip angles below 15° [
26,
27]. In the Sichuan basin, China, such landslides with near horizontal sliding surfaces, represented by landslides in the Wanzhou district, mainly occurred in the Mesozoic sandstone and mudstone strata. Through the analysis of the weak interlayers and age tests in landslide soil masses, the weak layers rich in hydro-expansible montmorillonite were considered as one of the strongest controlling factors of ancient near horizontal slip surface landslides in the Wanzhou district [
28].
2.3. InSAR Dataset and Processing
To assess the general stability of the test site, the specific characteristics of localized instability areas and the effectiveness of recently implemented remedial works, we set up a multiscale and multi-level procedure combining different monitoring methodologies (
Figure 3).
As a leading active remote sensing technique, InSAR techniques were proven to be an effective tool in long-term and slow deformation monitoring [
29]. In this study, after the InSAR deformation velocity map was obtained, a statistical method (hotspot analysis) was employed to extract the hotspot from the sparsely distributed PSs, which can exclude the redundant information and indicate deformation concentrated area. Then, according to the landslides inventory data, the landslide edges were delineated as polygons and overlaid on the ground displacement rate map to target the suspected active landslides. For controlled landslides showing deformation trends, analysis of ground-based monitoring data and field investigations were conducted to verify the overall effect of the engineering remedial works.
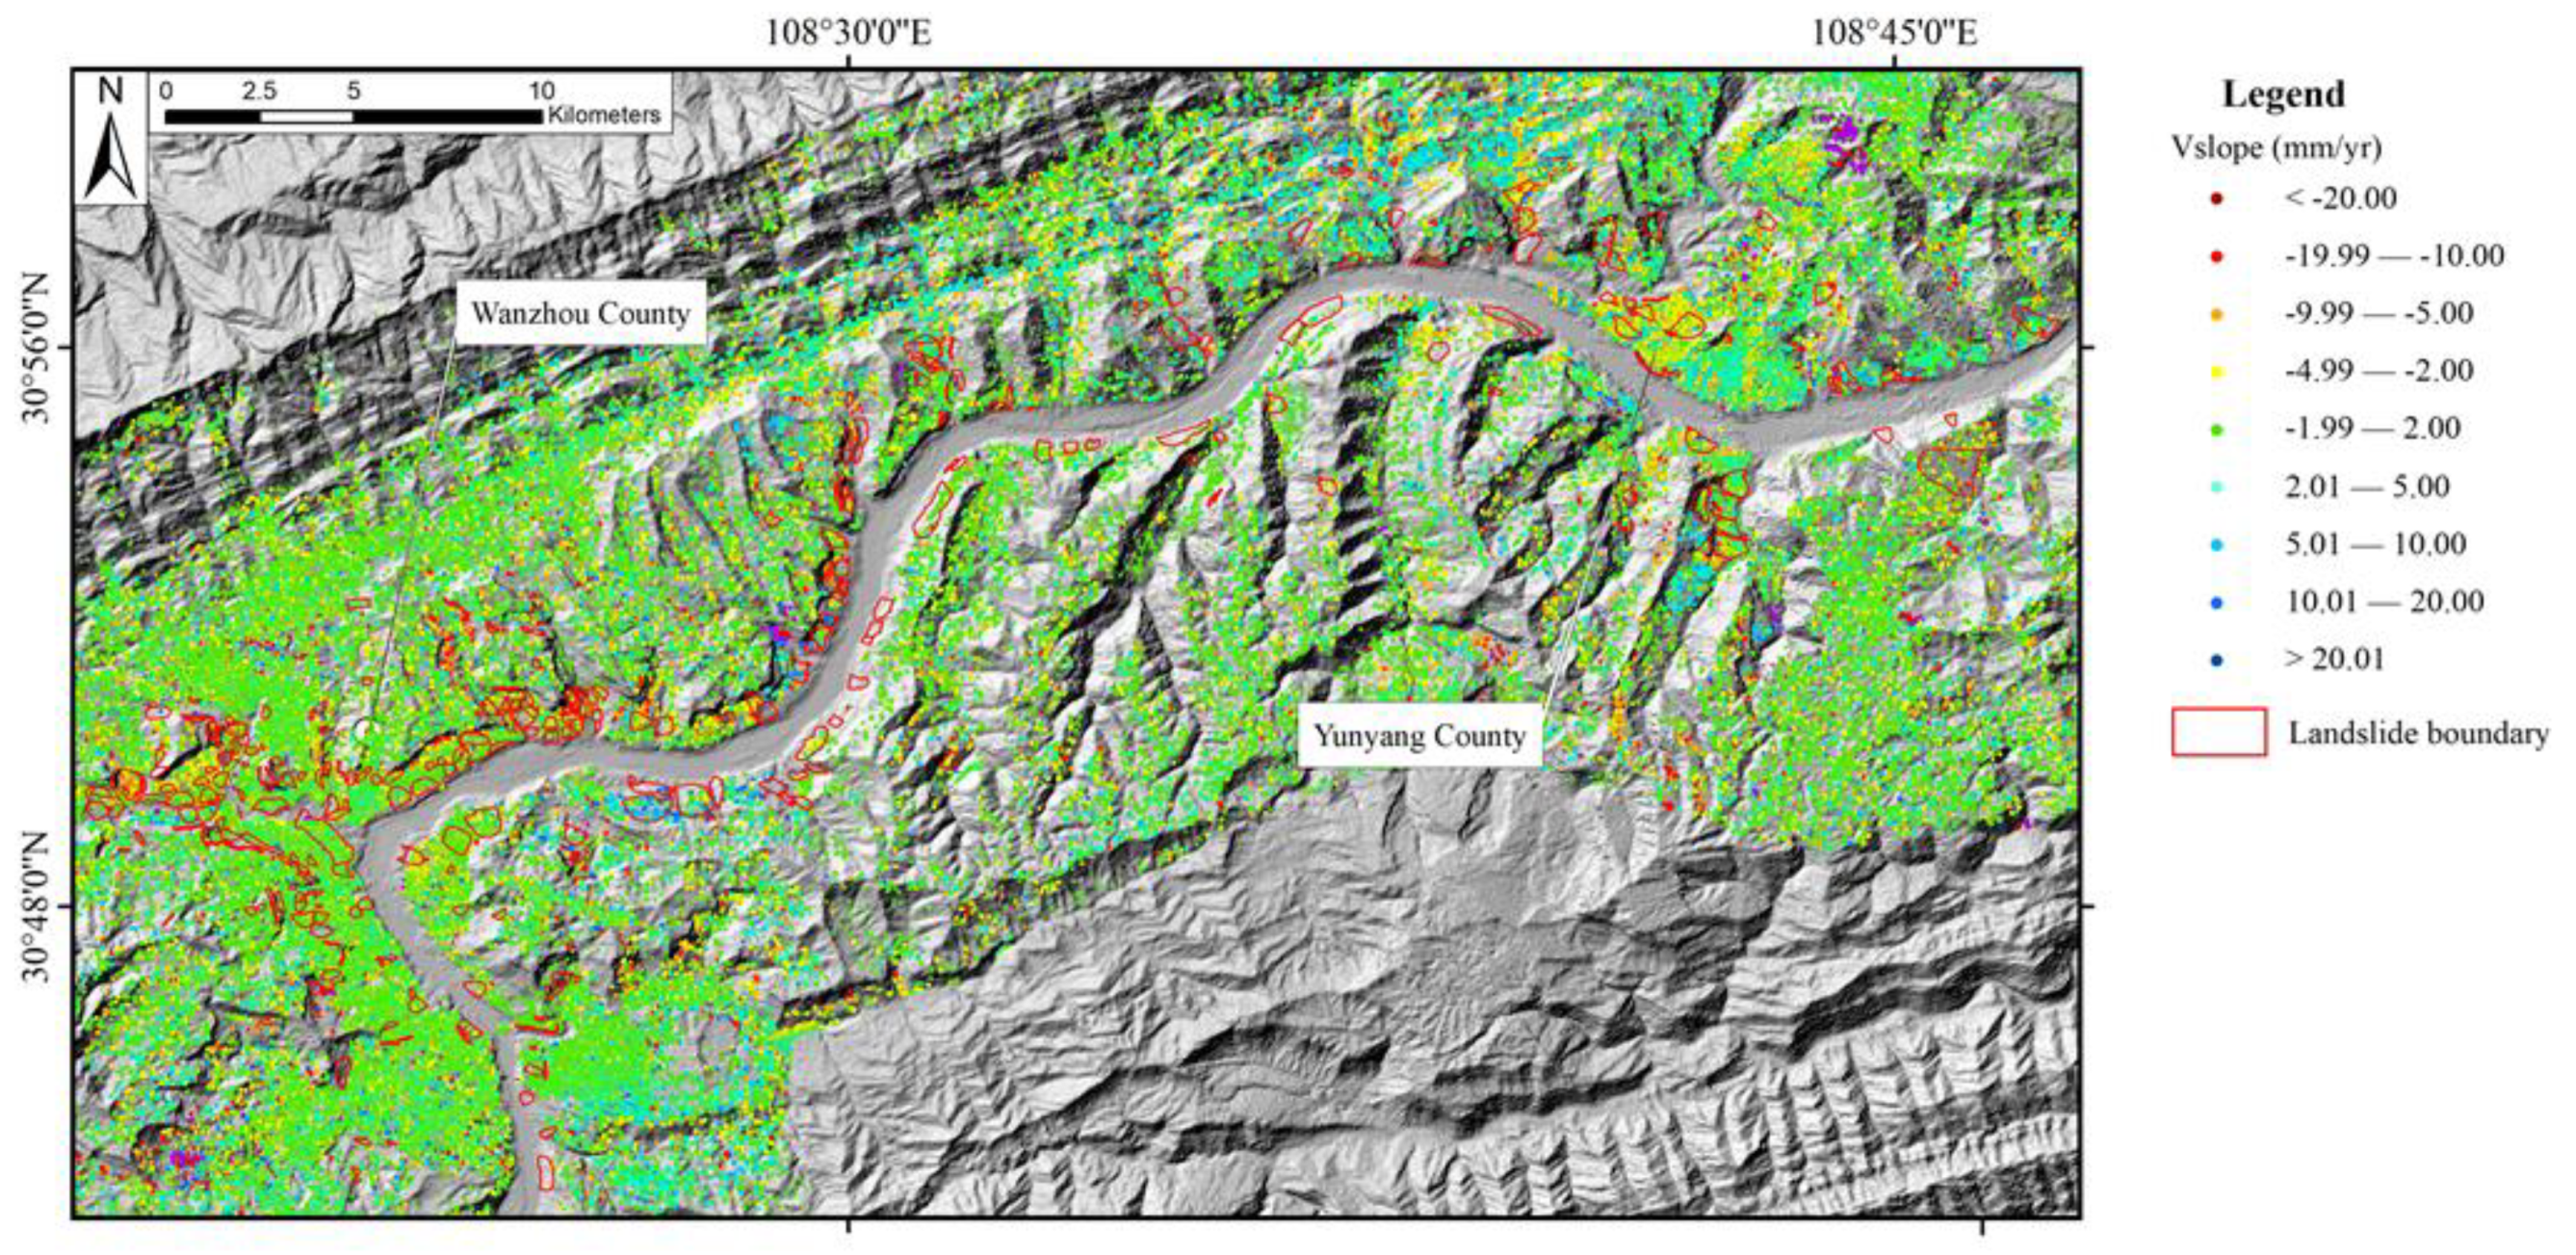
Equipped with a C-band synthetic aperture radar, Sentinel-1 provides continuous images in various weather conditions at an almost global coverage scale. To obtain the ground deformation velocity map for the study area, 70 Sentinel-1 images covering a time span between June 2015 and June 2018 were collected and selected for PSInSAR analyses. More than 980,000 PSs with coherence level above 0.60 were obtained, thus ensuring a sufficient spatial coverage and reliable information about the deformation characteristics (
Figure 4). The SRTM (Shuttle Radar Topography Mission) DEM (Digital Elevation Model) covering the study area was used in the generation of differential interferograms and the processing procedure employed the PSInSAR technique [
30,
31]. First, the precision track parameters file and the DEM of the study area were used for image cropping and registration. Then, the differential interference process was conducted by SARscape 5.2.1 at ENVI 5.3 environment. Finally, the obtained LOS InSAR ground displacement rate was projected at the steepest slope direction to better retrieve the ground deformation trend.
The above mentioned InSAR analysis process was relatively easy, flexible, and accessible, with totally free satellite radar images and a short machine processing time. Such a method is a reasonable basis for the following regional ground surface stability analysis.
2.4. InSAR Hotspot Clustering Analysis
Typically, a cluster of PSs representing relative high deformation velocities tends to aggregate in unstable areas, which are often recognized as active landslides or ground subsidence areas. However, point-based deformation rate maps are scattered and noise-affected, especially in mountainous areas where coherence varies largely in space. Such results can hardly provide reliable information indicating the spatial difference of landslide local deformation [
32]. Thus, only point-based PSs with the absolute displacement velocity value above a basic threshold (>10 mm/yr in this study) and showing obvious spatial aggregation can be used to discern active deformation areas from stable regions.
In this study, we employed the hotspot and clustering analysis (HCA), which uses a statistics approaches, namely Getis-Ord Gis* statistics [
33], to identify the hot and cold spots of point clustering. The obtained Z scores measured the extent of the clustering, and the Gi-Bin value identified the hot and cold spots of statistical significance with different levels of confidence intervals. PSs with Z-scores over 2.9 were extracted as ‘hotspots’ and used to identify mass ground movements, which corresponded to an approximate 99% confidence interval. Represented by the Gi-Bin values, positive values were rendered with blue and negative values with red. Both colors indicate the location of relevant clustering of PSs, with deeper colors standing for a higher clustering status. The clustering of elements with no statistical significance were rendered with light yellow, which means they provide no reliable information in identifying active landslides or ground deformation. The result is shown in
Figure 5a.
Hotspots, PSs, and landslide polygons can be overlaid on high-resolution Google Earth images in a GIS system to obtain substantial information regarding the exact deformation area, which, in turn, can provide exact targets for further field investigation. Landslide polygons with hotspots insides its boundaries were considered as suspected active landslides, and then a second confirmation step was conducted at the slope scale to verify the effectiveness of the engineering remedial measures for controlled landslides. Different colors were rendered on landslides polygons representing their active level, orange representing active controlled landslides, pink for active uncontrolled landslide and yellow for the remaining inactive landslides (
Figure 5b).
2.5. Effectiveness Evaluation of Landslides Engineering Remedial Measures
Thus, the framework proposed in this study encompasses an evaluation of the effectiveness of remedial works in two steps. The first step uses regional scale satellite monitoring data with the objective to provide a general overview of the regional scale remedial programs and to highlight localized problems to be further investigated. The second step involves local scale evaluations on ground-based landslide monitoring data (if available) and field investigations.
Based on previous InSAR-HCA results, controlled landslides with noticeable ground surface deformations were targeted and received detailed field investigations. The integrity of their major engineering remedial structures, such as anti-slide piles or drainage ditches, were carefully inspected. Other deformation features of these controlled landslides were also closely recorded periodically in case of sudden deforming acceleration, which may cause engineering structure malfunction. Apart from this, other sources of monitoring data, like long-term GPS and borehole inclinometer data, were combined to predict the future deformation trend and the overall stability of landslide.
3. Results
3.1. InSAR Regional Deformation Rate Result and Landslide Hotspot Map
The displacement rate map in the slope direction over the TGRA from Wanzhou County to Yunyang County is shown in
Figure 4. Approximately 93% of the PSs show displacement rates within 10 mm/yr to −10 mm/yr, which indicates an overall stable environment of the study region.
The output of PSI-HCA is shown in
Figure 5a, all the remaining spots have displacement rates at a slope direction over 10 mm/yr. (>10 mm/yr. or <−10 mm/yr).
In general, a total of 310 landslides in this region covered an area of 32.16 km2. Engineering remedial works were already performed for 58 landslides. According to the first step (PSI-HCA), 52 out of 310 landslides remain in an active status, which accounts for nearly one sixth all landslides, and a total of 11 controlled landslides were diagnosed as suspected unstable landslides.
Table 2 shows the results of our entire procedure. After combining the field investigation and ground monitoring data, two of the suspected active controlled landslides were confirmed to be active with some obvious deformation features that are continuously developing. The other nine showed different levels of surface deformation, but generally were not as strong as the former two landslides. Continuous attention should be kept on these nine suspected active landslides and periodic field investigations or even ground monitoring instruments are highly recommended depending on the trend of their development. The field investigation and engineering remedial work validation process are presented in following sections. For the 58 landslides under engineering remedial works in this area, 47 (81.0%) were inactive, which corresponds to 82.0% of the controlled landslides area.
3.2. Suspected Active Controlled Landslides
Table 3 shows the suspected active landslides with engineering remedial work, their highest InSAR displacement rate at the slope direction, the deformation scale, and implemented type of engineering remedial works. The next step of the proposed methodology aimed at identifying potentially instable slopes or the failure of engineering remedial work and confirmed the activity level of this suspected cases. Through our field investigations, nine of them (No.1 and No.4–No.11) were considered as very slow deforming, and no signs of persistent deformation were detected on the landslide body or buildings on it. In addition, their engineering remedial structures were all intact and well-functioning, despite that some of them were deeply planted into the ground and hard to check.
Figure 6 shows the displacement rate map and deformation features of the Ertunping landslide, such as building cracks at the middle part of the sliding body, and bank collapse at the front edge. The landslide showed no obvious signs of continuous overall deformation, and deformation features, such as pre-existing building cracks, also showed no developing tendency. The implemented engineering structures, including anchors on the trailing, anti-slide piles, and retaining wall on the front edge, all maintained fixed positions and functioned well.
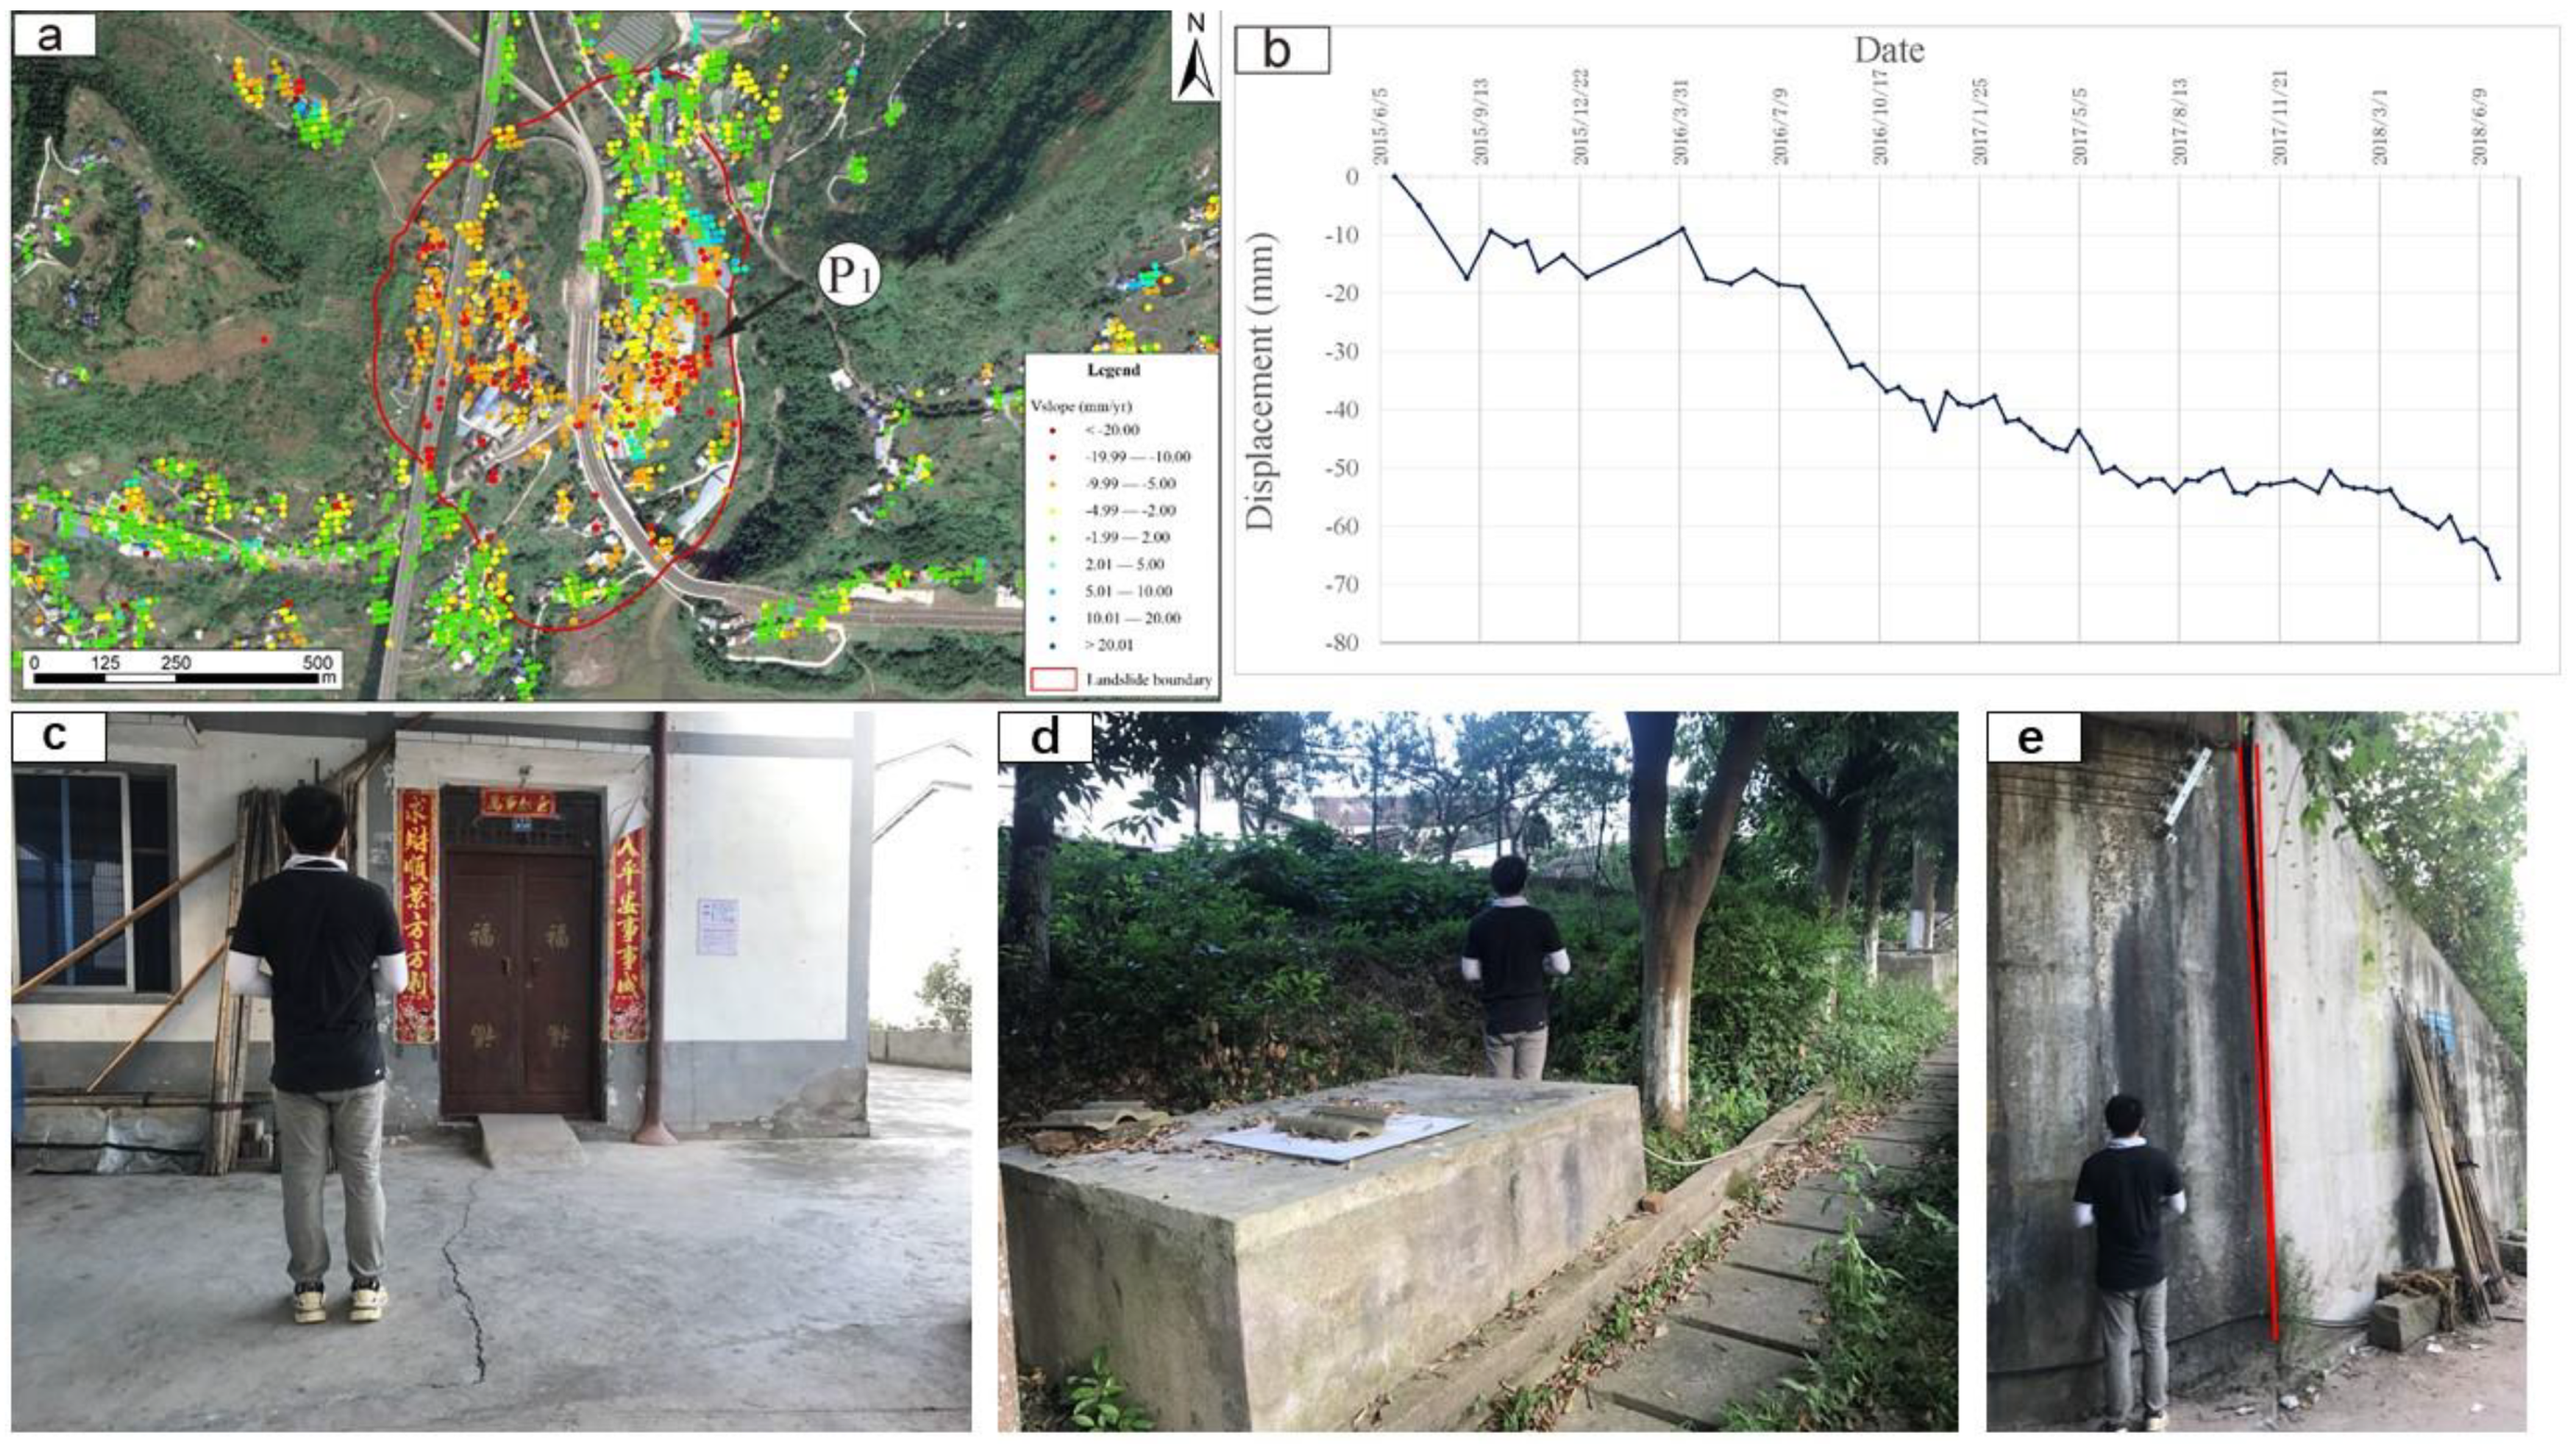
The Dadiping landslide lies on the bank of a tributary of the Yangtze River. Many risk elements exist on the landslide body, including an elevated highway and many buildings, which significantly increases the load on the Dadiping landslide. Both the InSAR displacement rate map and time-series of local PSs showed an obvious local deformation trend (
Figure 7). As the engineering remedial work of Dadiping landslides was designed and implemented in 2016 (which is quite recently), no sign of damage was detected on its engineering structures, which mainly consist of two rows of anti-slide piles, located in the front edge of the landslide, and with the trail edge on one side of the highway, respectively.
The displacement history was greatly influenced by the periodic reservoir water level fluctuation and characterized by rapid displacements over short-term periods and a subsequent low strain rate over the long-term period. Given the joint effect of water level fluctuations and rainfall, the displacement rates showed irregular patterns that were very difficult to predict. PS spots with the highest deformations rates were found mainly at the leading edge of most of the landslides, likely owing to the rapidly changed ground coverage conditions, water level fluctuations, and the absence of permanent scatters in other sectors of the slope. In such a case, field investigation could provide more reliable information regarding the signs of deformation.
The results of the field investigation were quite similar for the other seven controlled landslides (No. 5–No.11 in
Table 3). Based on the past experience in this area, although the InSAR displacement rate was steady at tens of millimeters per year, such a level of deformation would not cause much trouble for the overall stability of a controlled landslide.
3.3. Active Controlled Landslides Areas
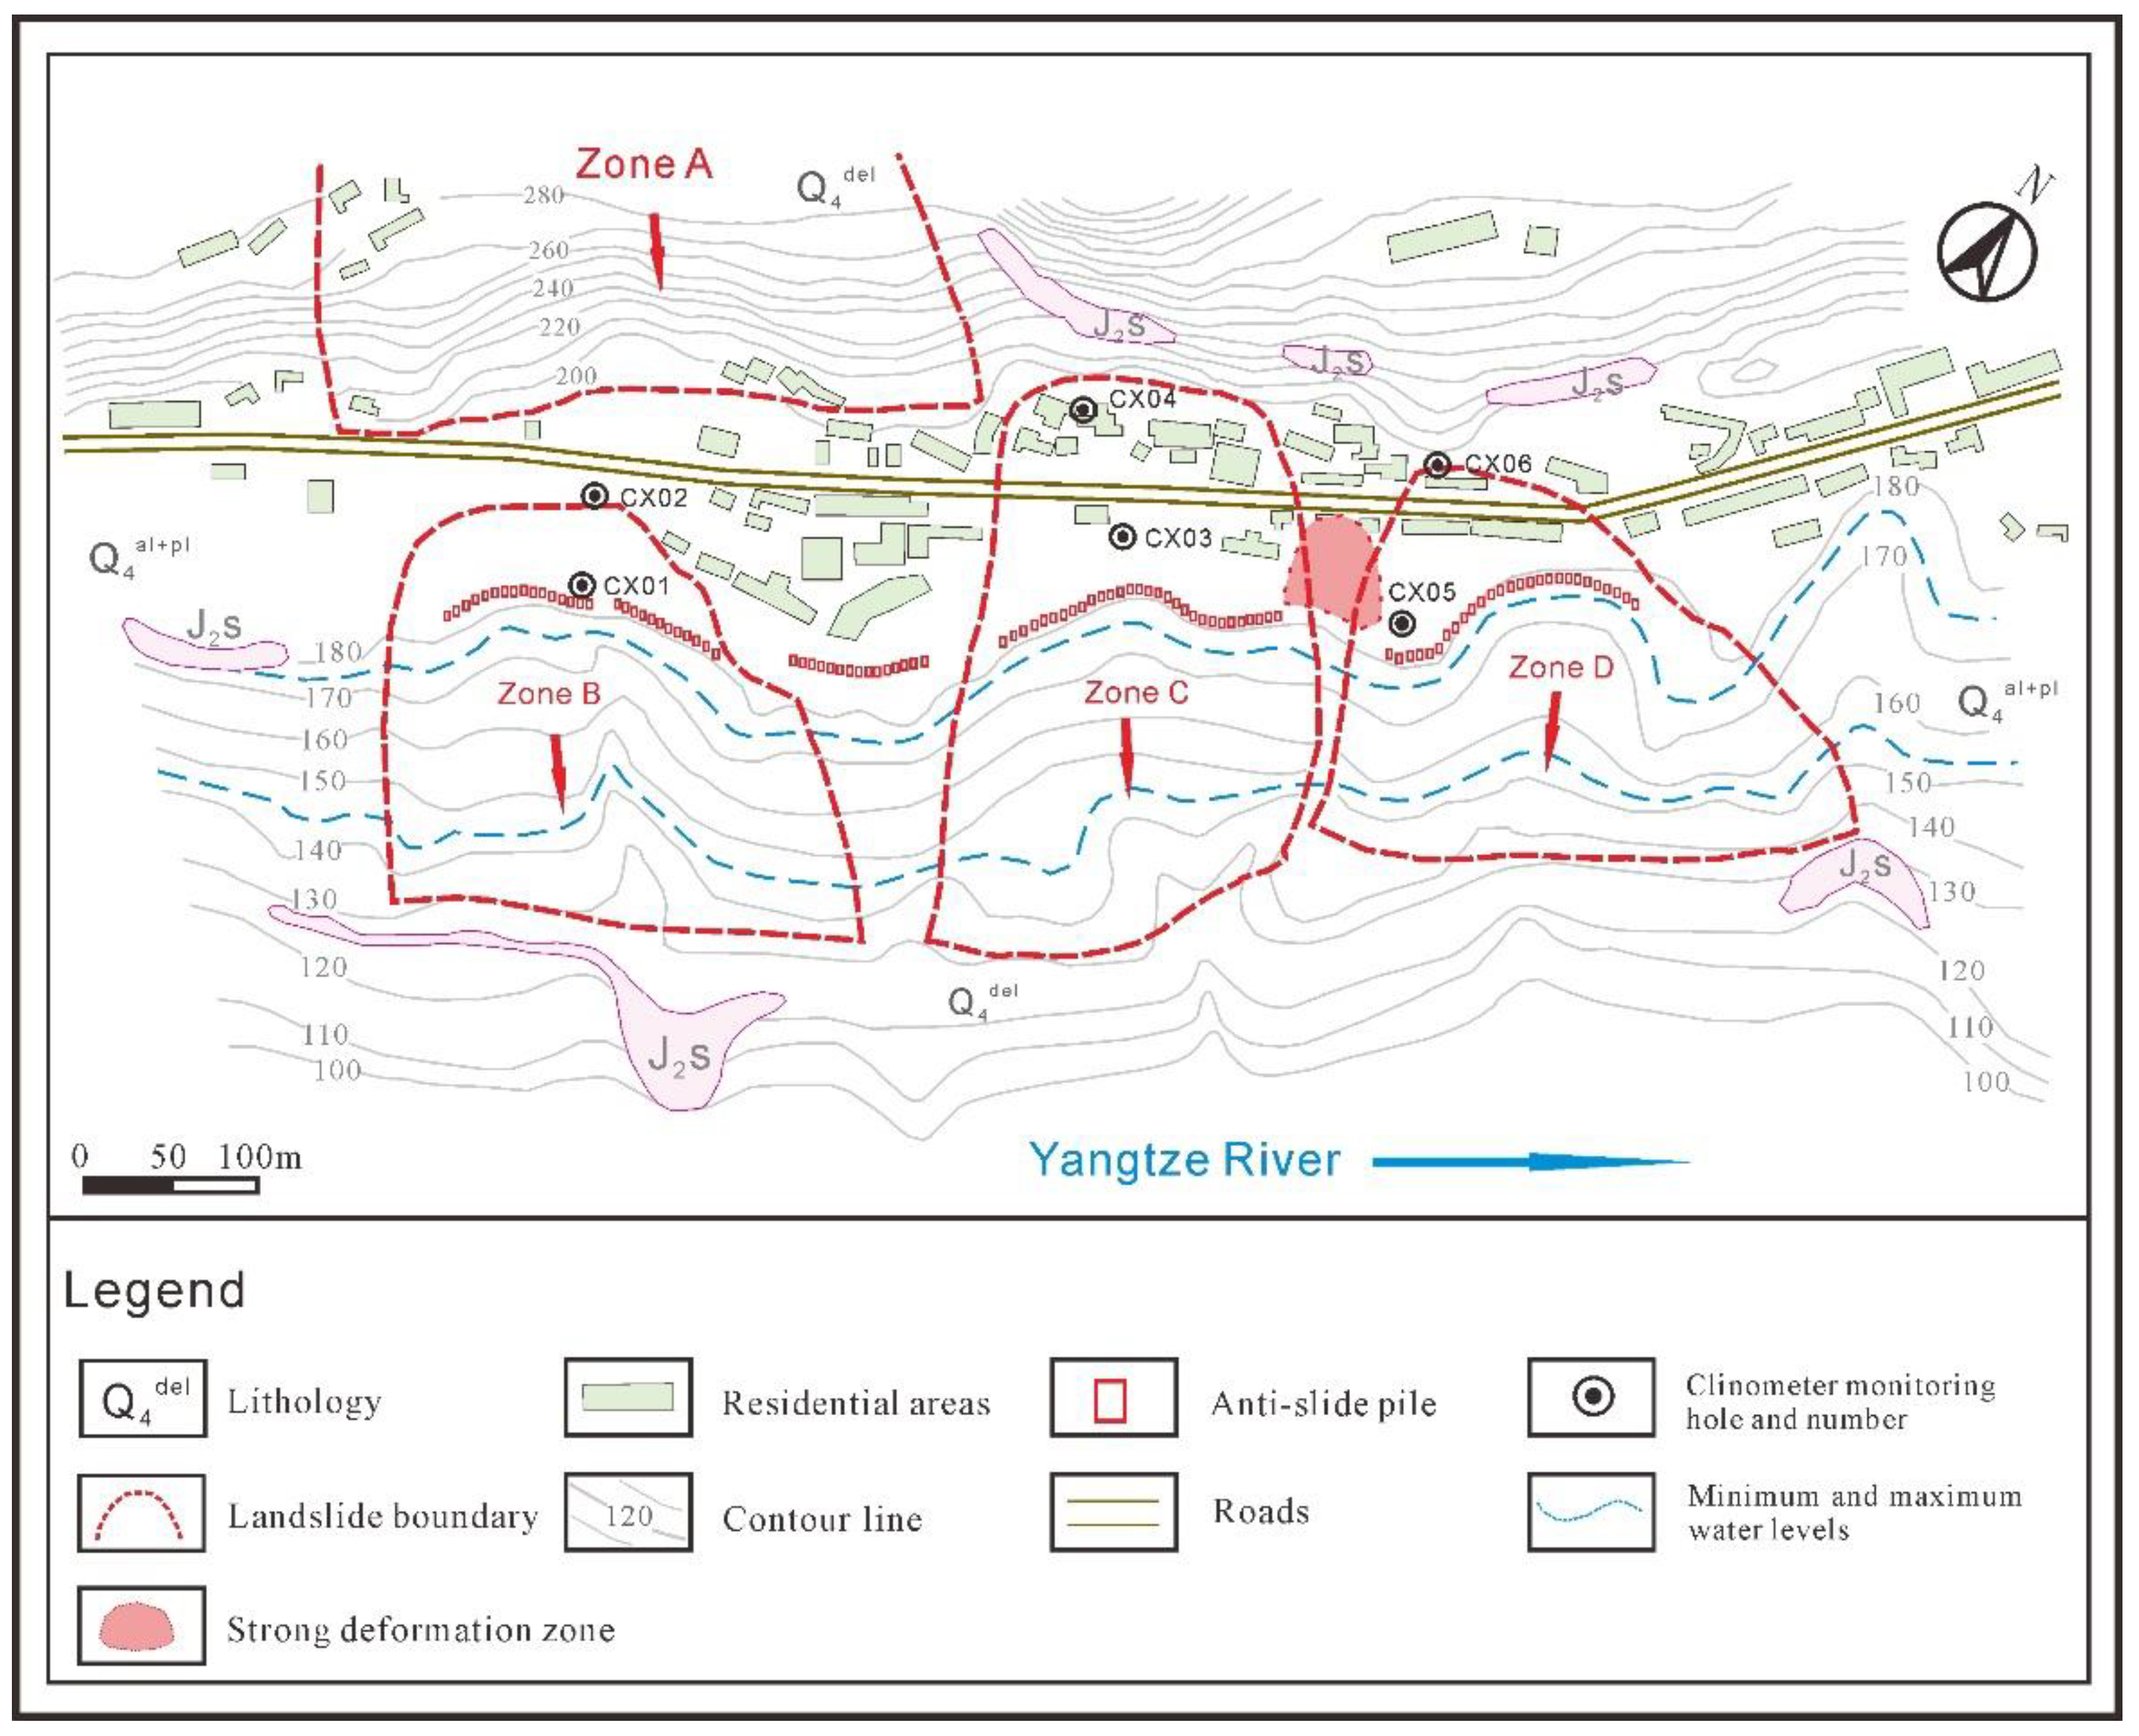
Some evident deformation was detected in the Dazhou landslide, which is a landslide group consisting of five individual landslides named from Zone A to Zone E. Situated in Dazhou town, the total length of these five landslide bodies stretches over 1370 m. Extended from south to north, Zones B, C, and D are separated by gullies and maintain their own boundaries (
Figure 8). The trailing edge of them is in a gentle area on the west side of the highway, and the leading edge has a steeper slope and is permanently submerged into the Yangtze river.
Previous field investigations suggested that significant deformation was found for Zones C and D, including clear signs of sliding caused by tensile rupture, such as cracks on the buildings and ground, collapse, and distortion on the road (see
Figure 9). A strong deformation zone between Zones C and D is highlighted in
Figure 10.
The engineering remedial work for the Dazhou No.2 landslide was designed in a segmented form and the main engineering countermeasures are anti-slide piles, combined with drainage ditches and modification of the slope geometry. Based on the calculation of the slope thrust and the design load, the pile spacing was initially drawn to be 5.5–6 m, and the pile length was 15.5 m. In total, 29 piles were planted into the bodies of Zones B, C, and D. No obvious deformation was detected in engineering the countermeasure structures of slides B and D, while some damages occurred in three anti-slide piles on the left edge of slide C (
Figure 9). In total, three anti-slide piles were inclined on the left edge of slide C. Soil in front of the anti-slide piles moved down significantly. An evident crack, about 30 cm length, was observed on the second pile of the left edge of slide C. Another crack about the same length was found on the left edge of slide B. Except for the different level of soil slips in front of the piles, the pile structures were basically intact.
The information indicates that the slope is unstable at a certain depth, and the damage of engineering project could influence the overall stability of slide C; to assess the exact deformation of the underground pile section and the depth of the sliding surface subsurface data are needed.
As the Dazhou landslide is one of the few controlled landslides that was still carefully monitored, more sources of monitoring data could be introduced to verify its deformation. The positions of the monitoring devices are shown in
Figure 10; all of the monitoring points were arranged along the three cross sections of Zones B, C, and D. The position of the piles was also depicted in
Figure 10. The most significant deformation occurred between Zones C and D, where no piles were designed to protect this area. This deformation could also be verified with InSAR surface monitoring: PSs with relatively high deformation rates were located exactly at the same place between Zone C and D.
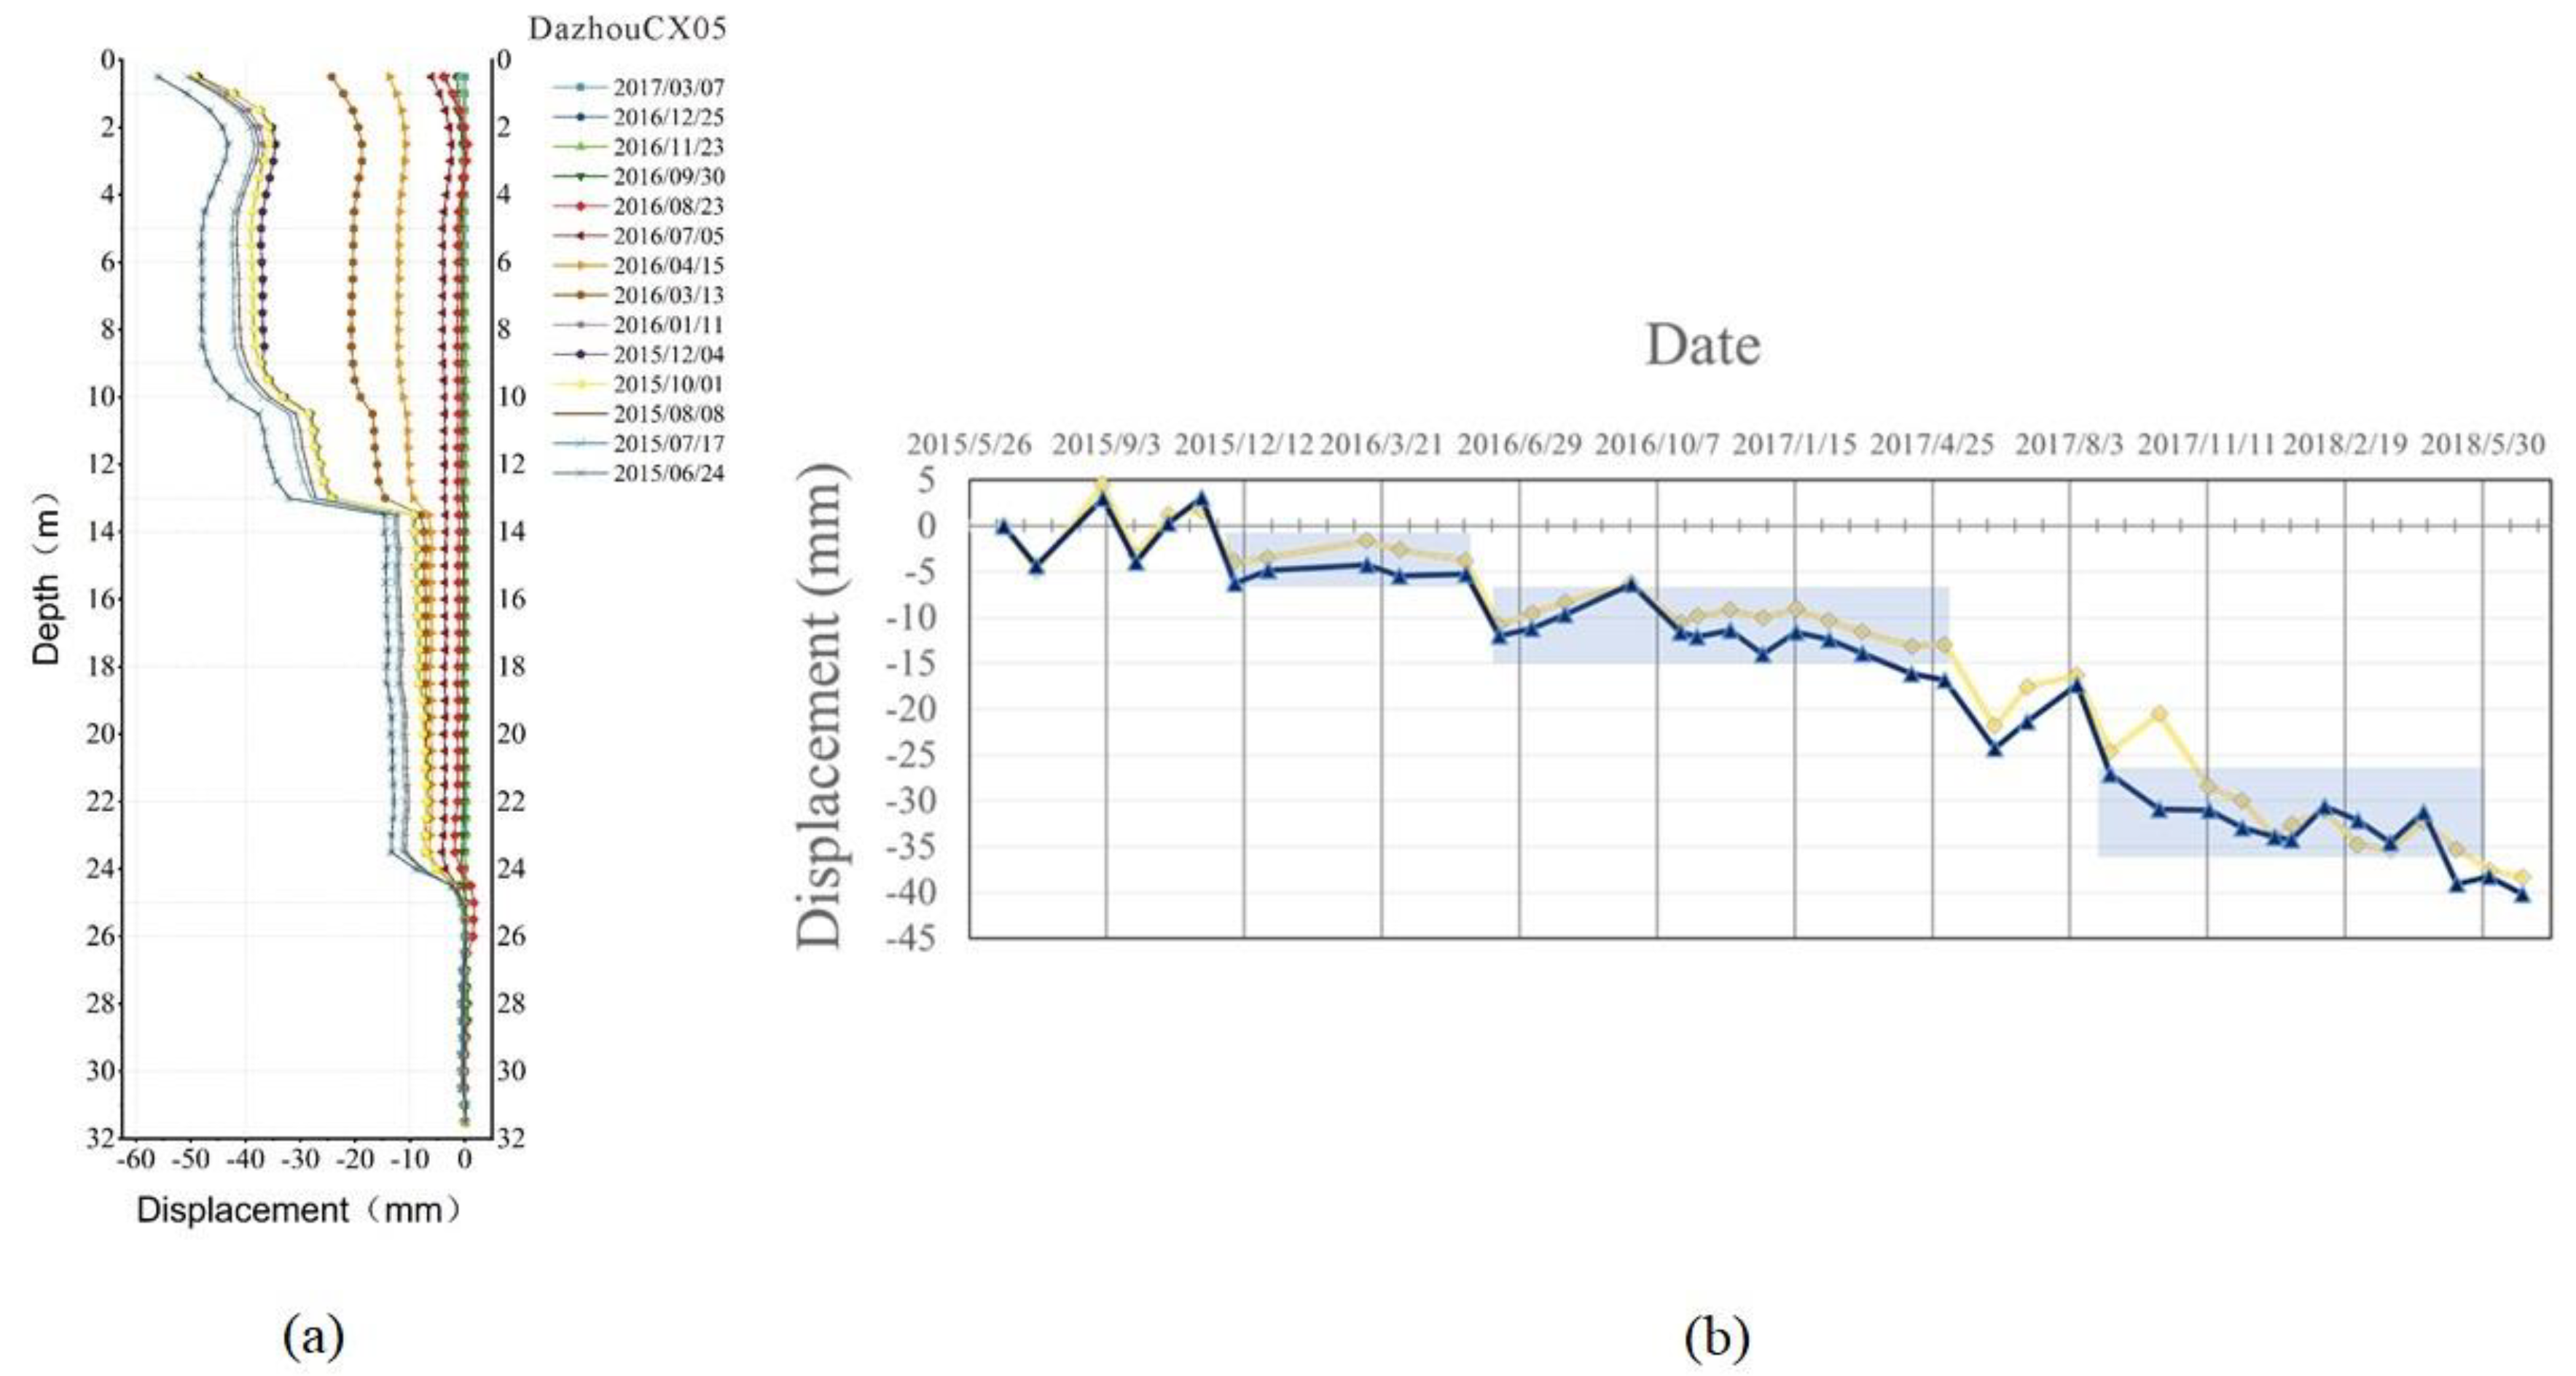
Figure 11 shows the inclinometer data of the Dazhou landslide, showing that a significant movement was detected in 2017. The sharp change in the curve profile reveals the depth of the sliding surface, which was also consistent with the result of the drilling exploration. The inclinometer data shows that the creep deformation of the Dazhou landslide continued along the slip surface and some of the data missing from March 2017 to December 2017 was due to the instrument damage, when the semi-automatic inclinometer became stuck in the borehole, which also indicated a relatively large deformation of the landslide body. CX06, an inclination hole located at the trailing edge of Zone D, showed that the slip surface exists at approximately 16 m depth while the surface movement was not evident during the monitoring period. The inclinometer data also revealed a different degree of deformation that Dazhou landslide Zone D is developing, and this local deforming circumstance was likely caused by the segmented anti-slide piles.
The outcomes of the regional scale and local scale analyses support the conclusion that the rapid fluctuation of the reservoir water level may have induced localized sliding activity in some sectors of the main body of the Dazhou landslide. Even if we have no reason to claim that the design of the engineering countermeasures of the Dazhou landslides were invalid, the evolution process of the Dazhou landslide could have been greatly influenced by the piles planted in the landslide body. For instance, the original separated boundaries of Zone C and D are now connected by a strong deforming zone, which was generated after the implementation of the anti-slide piles.
Another case is the Kangjiapo landslide. During a routine inspection on the second Wanzhou Yangtze River Bridge, on 12 July 2018, we noticed that a brick at the edge of the No.6 pier was sunk more than 60 mm. A T-shape beam of the north shore approach bridge was noticed to be displaced toward the bank. According to the on-site field investigation, the pier No.6 was suspected to be shifting towards the river center, posing a serious threat to the bridge structure and vehicle safety.
A series of PSs with a high moving rate were captured at the front edge of the nearby Kangjiapo landslide, which was a controlled landslide, and the highest slope displacement rate reached 17.88 mm/y (
Figure 12). Since the engineering remedial work of Kangjiapo landslide were established in 2003 and, at present, the surface of the landslide area is covered by a large number of buildings, many treatment projects cannot be directly observed. Therefore, the deformation degree of the engineering measures was impossible to assess. However, since noticeable deformation happened at the bridge and nearby landslide, some actions were taken immediately to alleviate this danger, such as landslide temporary reinforcement with mini-scale anti-slide piles. While the landslide body was submerged within the range of the reservoir water fluctuating area, further reinforcement to both landslides and bridge piers were extremely difficult to implement.
4. Discussion
Evaluating the effect of landslide engineering remedial works at the regional scale is a relatively unattempted task and, even at the slope scale, is usually time-consuming and highly empirical: For instance, researchers attempted to build an evaluating system considering factors from different aspects employing an integrated fuzzy hierarchy process theory [
24].
The main purpose of this study is to propose a multi-scale integrated monitoring method to prevent landslide remedial works from invalidation. It is true that a remedial work’s effectiveness may be considered inappropriate or seriously damaged only with very large deformations; however, a monitoring program, like the one proposed, may identify precursor signs that could allow for intervention before reaching critical conditions.
The presented methodology is low-cost, easy to perform, and very straightforward to communicate to citizens and authorities. According to the requirements of the local government administration, casualties, and property losses caused directly by geohazards in the TGRA should be completely eradicated, and, consequently, large investments on scientific research and on hazard mitigation have been undertaken. Our study proves that, up to now, great accomplishments have been achieved: Overall, the engineering remedial works in the Wanzhou to Yunyang reservoir section played a significant role in the landslide control as most of the controlled landslides remained inactive, and most of the active landslides were not controlled with engineering remedial work.
The majority of the controlled landslides are no longer being carefully monitored, as typically the designs of controlling projects are relatively safe and hiring other forms of monitoring equipment is considered as an avoidable investment. Thus, it is hard to obtain other sources of monitoring data to observe the difference of deformation rates before and after the remedial works [
35,
36]. In such condition, the joint use of InSAR data and field investigation became the most direct and reliable mean to detect possible criticalities and to study the evolution process of controlled landslides [
19,
20]. The results of our application also showed that remote sensing technologies alone were not sufficient to obtain complete and reliable information. For example, as we reported in the results section, owing to the relatively short interaction time between the engineering remedial work and the sliding body, it is difficult to determine whether the landslide remedial work is valid or not in the Dadiping landslide. Thus, further attention should be paid over the next few years, and periodic field investigation or even ground monitoring instrument are highly recommended; besides, although a series of active PS spots were observed at the Kangjiapo landslide, the reported deformation of the bridge pier was still hard to capture. InSAR can detect deformation related to the interaction between the ground and infrastructures; however, it is not suitable to measure internal deformation of the structure itself.
Although the general trend of the deformation is captured by the InSAR time-series analysis, the detailed and short-term displacements are not always completely in accordance with the GPS data. This is likely due to the inconsistency between the projection direction of the InSAR displacement results and the GPS data, and the lowest spatial and temporal resolution of the accessible SAR images; however, this drawback did not prevent us from recognizing a potential instability hotspot in the framework of a regional scale investigation. Further and more thorough analyses are then needed in the highlighted hotspots with other methods: in this perspective, the ground monitoring has an unsubstituted advantage over InSAR in real-time monitoring and the two techniques can be considered complimentary.
The proposed integrated monitoring method provided a solution for such circumstances and proved that the InSAR regional-scale deformation mapping must be completed by regular field investigations or ground monitoring in order to avoid missing deformations that may be of serious consequence. With Sentinel satellite InSAR, the deformative scenario at a wide scale could be updated periodically, for instance every year or less, and the necessity of extensive field investigation could be largely reduced, at least for some typologies of landslides.
The majority of the engineering remedial work in the TGRA started construction after the establishment of the Three Gorges Dam in 2003, and was sequentially built up later. Since the huge scale of landslides engineering remedial work was extremely costly due to the unexpectedly large number of natural hazards, the hazard engineering remedial works were implemented in a multi-stage plan to alleviate the financial pressure on the government. Along with this staged plan came a new problem regarding the changing setting of prevention work design. The remedial work design engineer could have not known the presence of such intense urban growth and environment changes; thus, the additional weight and interference may cause the remedial work invalidation and the landslide reactivation. For example, several landslides are distributed at the north bank of the second Wanzhou Yangtze River Bridge, including landslides with already implemented engineering remedial work or ancient landslides in a dormant state. However, the heavy load from the bridge and buildings could have largely fostered the landslide reactivation, which may have led to the sinking of the bridge piers. In such case, the landslide deformation may not be attributed to the invalidation of its engineering remedial work, but mainly due to the changes in the surrounding environmental conditions. Landslides reactivations resulting from land use changes (and particularly from urban growth) might become a general issue in this region, and thus monitoring programs are urgently needed [
37]. The setting changed due to anthropic (e.g., urban expansion) and natural (e.g., climate change) factors, thus the long-term effectiveness of remedial measures should be constantly checked.
The geohazard prevention and control plan of the TGRA was formulated based on the idea of hazard risk management. The engineering remedial works were primarily built on landslides with many anthropic elements (mainly buildings and roads) exposed at risk. This circumstance is ideal for the application of our methodology because the urban environment provides reflectors for and effective InSAR deformation analysis at the regional scale, and, in addition, it is possible to observe deformation features, such as cracks and other building damage, directly through field investigation.
5. Conclusions
This study provided a practical example in verifying the effectiveness of landslide engineering remedial works and the geomorphological stability characterization of landslides employing an InSAR and conventional ground monitoring combined method. To this aim, the effectiveness of InSAR-based techniques was exploited at the regional scale to determine possible hot spots of landslide hazards. The matching with landslide inventories allowed us to downscale the analysis to the slope scale where possible precursory signals of instability were identified. At this scale, where deemed necessary, more detailed analyses were conducted: Field surveys and conventional ground monitoring data had the irreplaceable advantages in obtaining substantial insights for each hotspot, including deformation mechanisms and the inducing factors.
The results correspond to the field evidence and matched with the outcomes of previous research in this area. Compared to previous studies, the effect of geohazard engineering remedial works was emphasized and taken as a primary consideration. The multi scale analysis allowed us to detect precursory signals of possible instability in certain sections of the controlled landslides. In general, with a total of 310 mapped landslides, 52 of them (13.87%) were classified as active in a slow-moving state. A total of 58 landslides were instrumented (18.71%), and others were slowed through remedial efforts. We found two controlled landslides that were confirmed to be active, while another nine cases were suspected to be active and demand further attention.
Currently, extensive protective measures have been planned and carried out; however, it is not feasible to avoid all threats or protect all affected areas. Considering that we cannot prevent all landslides and landslide remedial work could have been weakened or even failed, different strategies involving monitoring and early-warning systems are valid options for risk mitigation. This strategy relies on satellite InSAR, starting from the most urgent situations, combining advanced techniques with practical experience. This could not only greatly reduce the effort of field work but also effectively identify potentially dangerous landslides. The proposed procedure is low-cost, easy to perform and very straightforward to communicate to citizens and authorities. It could be easily implemented on very wide areas to assess the slope stability and to investigate the effectiveness of large-scale governmental risk mitigation programs, identifying precursor signals that could allow for intervention before reaching critical conditions.


 ,
, 


