Correlation of Concurrent Extreme Metocean Hazards Considering Seasonality
Abstract
1. Introduction
2. Significant Wave Height and Wind Velocity Data Used
3. Extreme Value Analysis Considering Seasonality
4. Correlating Extreme Metocean Variables
4.1. Nonstationary Models Considered Separately
4.2. Simplified Approach for Return Period Correlated Values
- (1)
- Select an Hs value associated with a T-yr and month of interest (e.g., see Table A1 in Appendix A) as input for Equations (8) or (10).
- (2)
- Select the season (month) for which the correlated values are desired, and the corresponding parameters (Table 1) to be also plugged into Equation (8) or (10), and compute Vw.
- (3)
- Use Hs in step (1) and Vw in step (2) as simultaneous demands associated with the selected T-yr and month acting over a maritime system to be designed.
- (4)
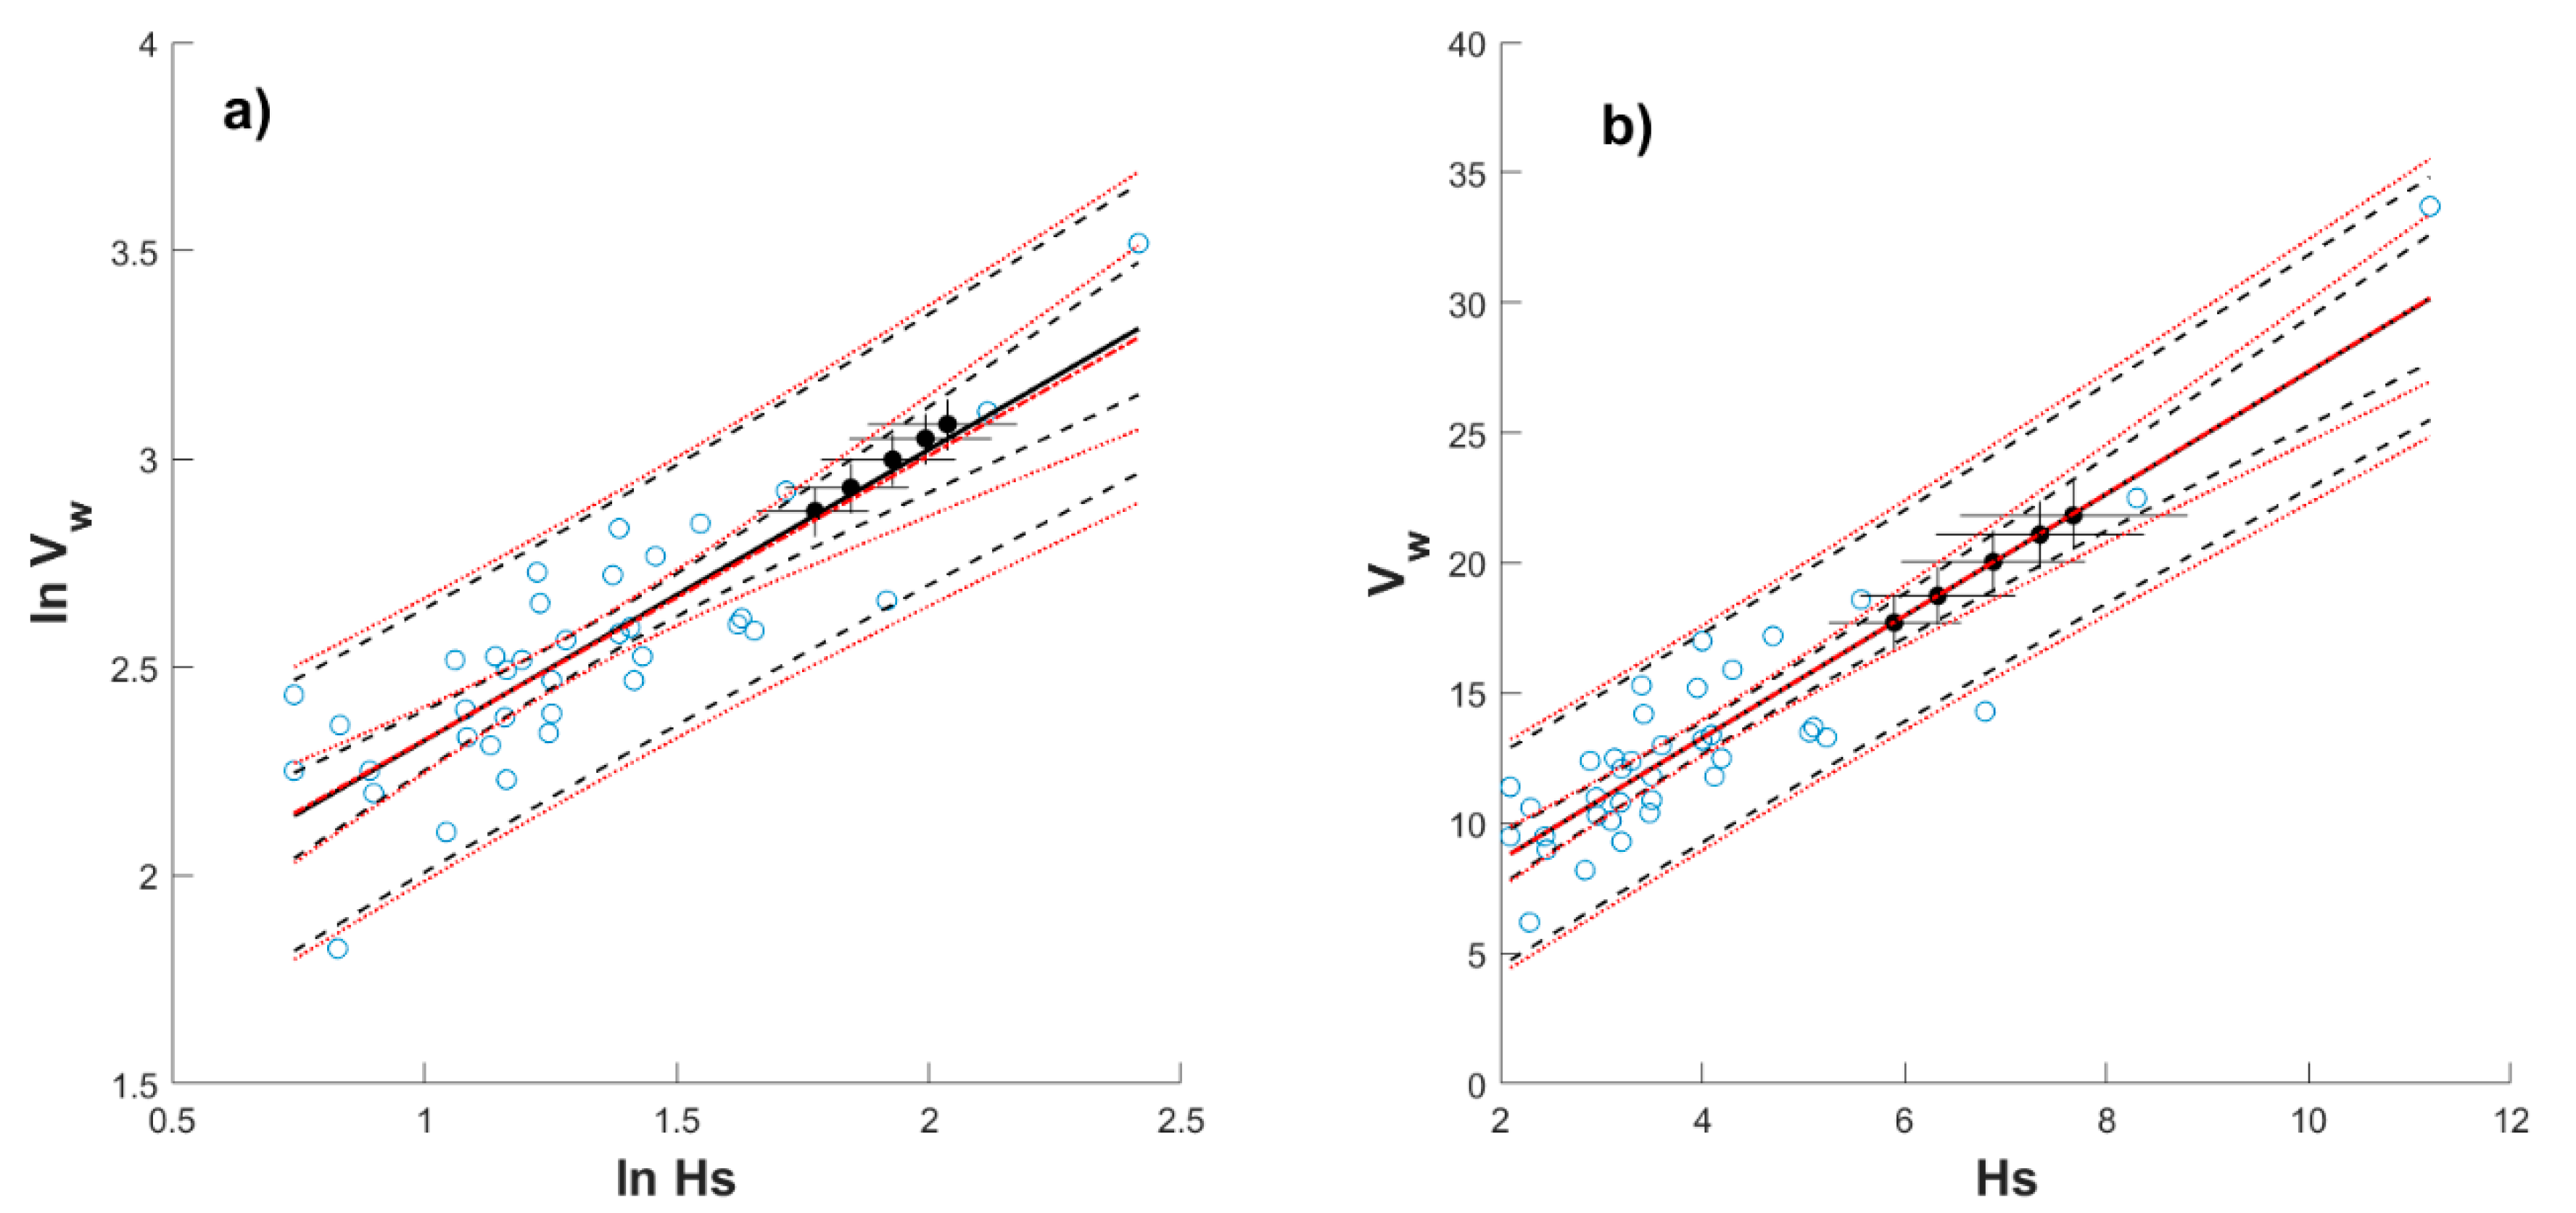
- If uncertainty is to be used by the designer, the corresponding σe together with Equations (11) or (12) can be used to establish upper (or lower) limits by using a δ value (e.g., δ = 2 could be used to approximate the 95% confidence intervals for future values).
5. Discussion
6. Conclusions
Author Contributions
Funding
Acknowledgments
Conflicts of Interest
Appendix A
| Hs (m) | |||||
|---|---|---|---|---|---|
| Month\Tr (yr) | 20 | 30 | 50 | 75 | 100 |
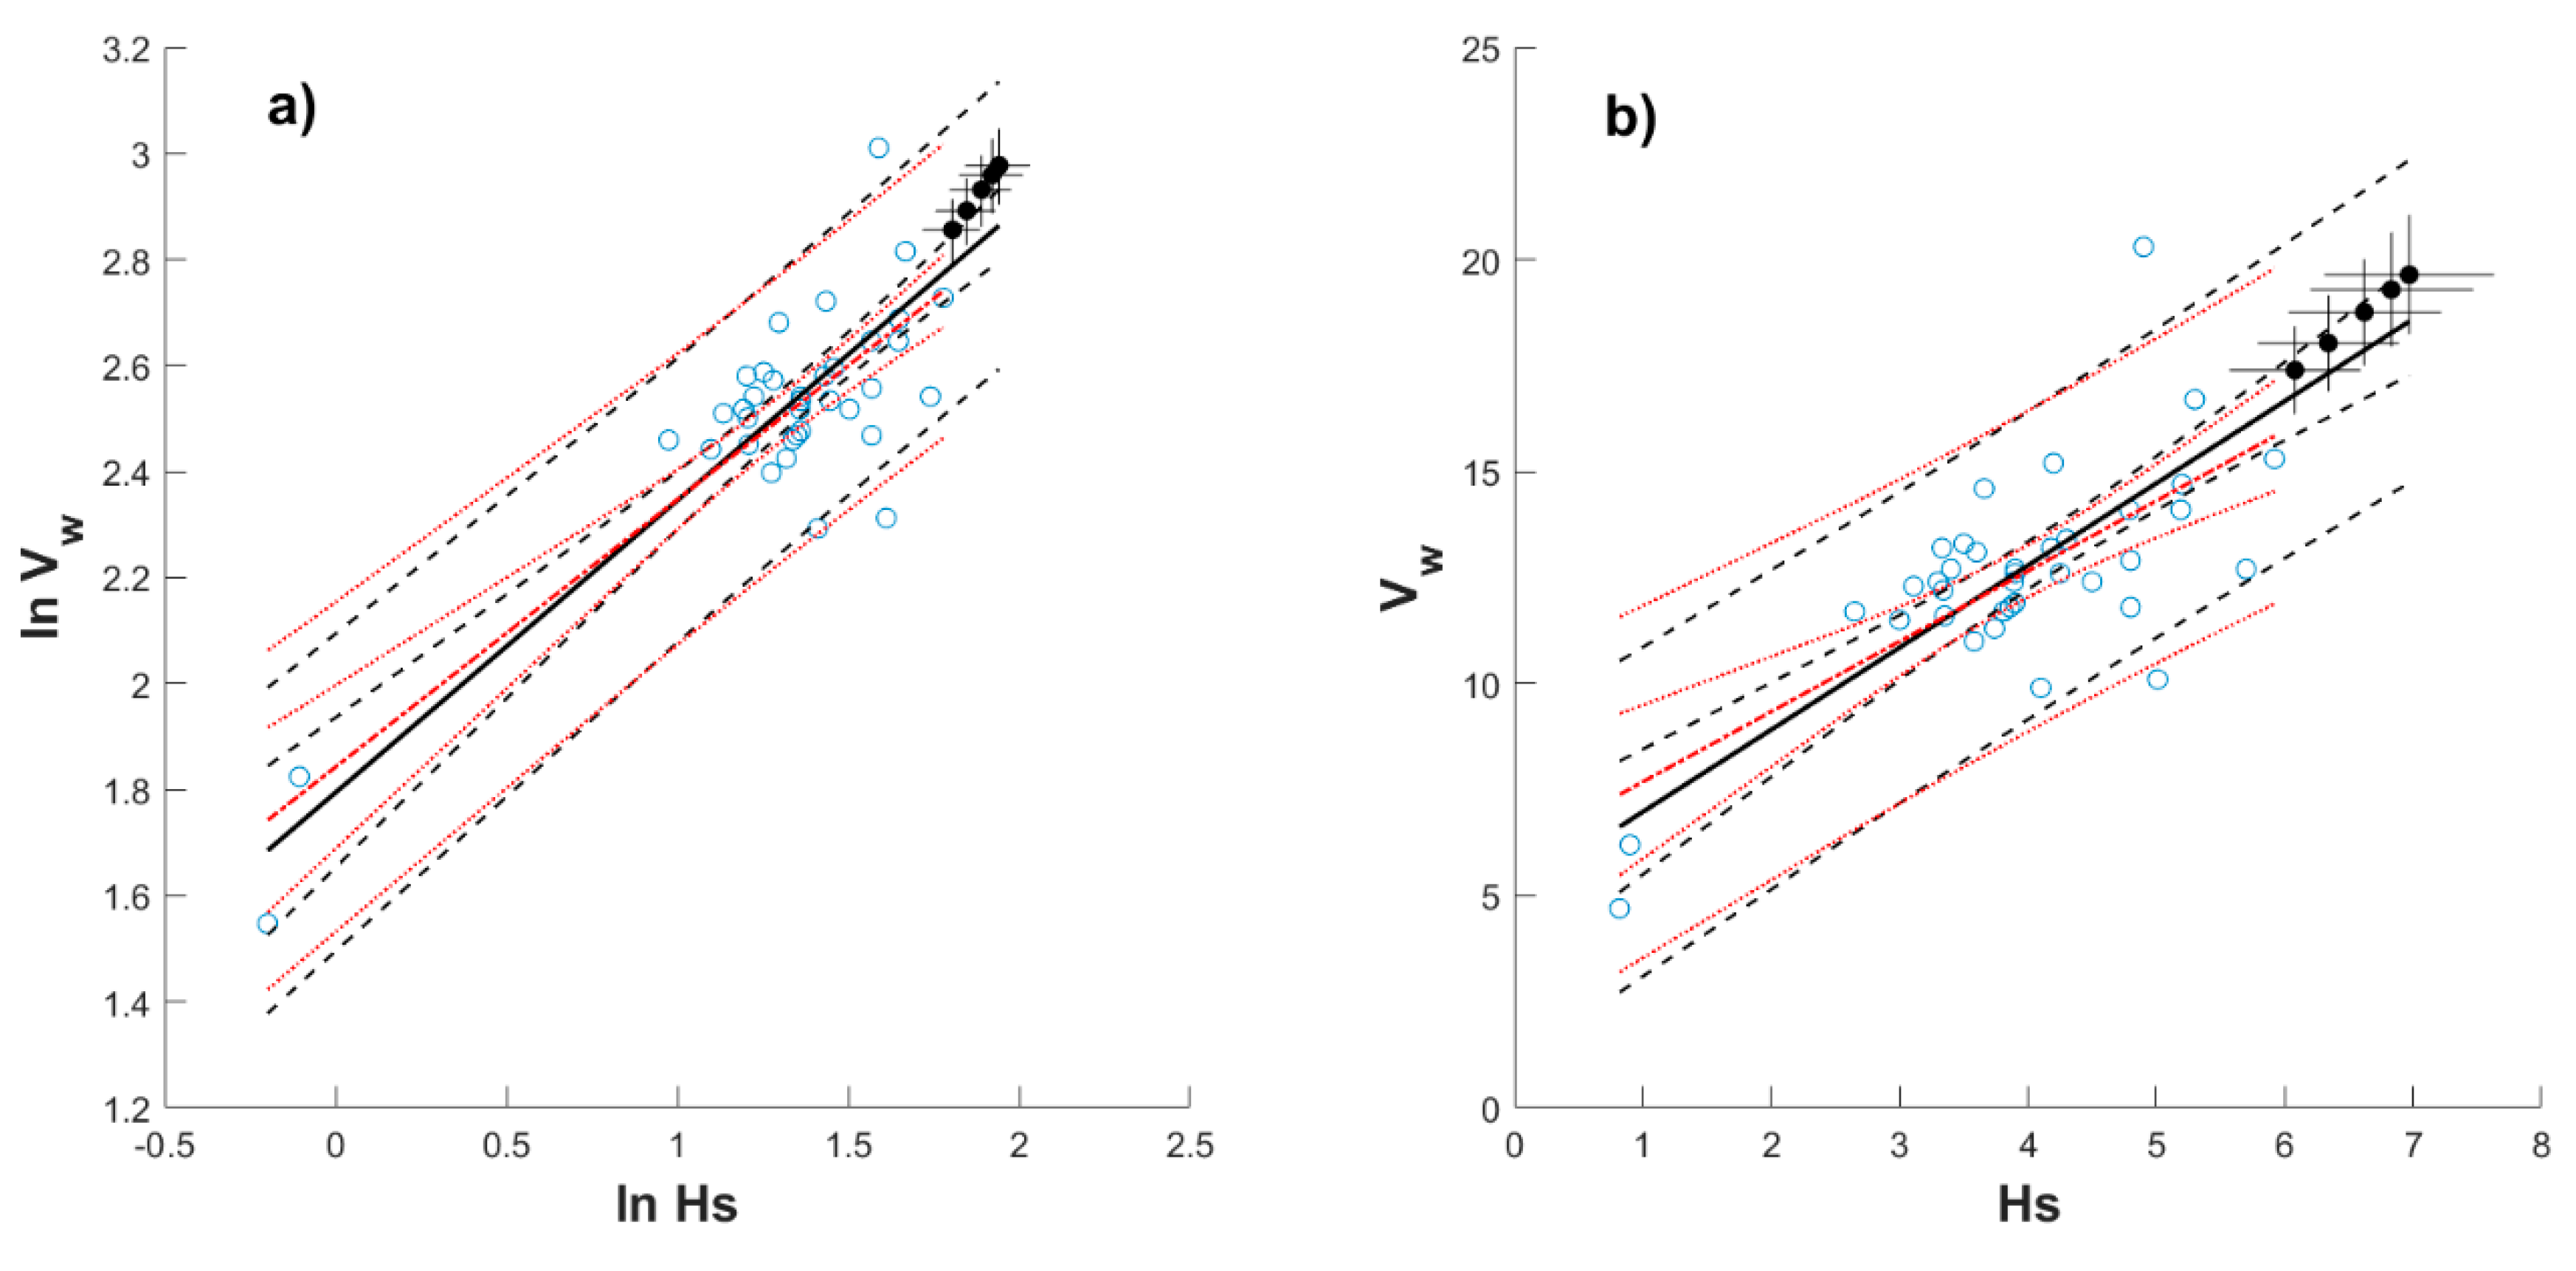
| January | 6.08 | 6.34 | 6.62 | 6.83 | 6.97 |
| February | 6.09 | 6.36 | 6.68 | 6.91 | 7.06 |
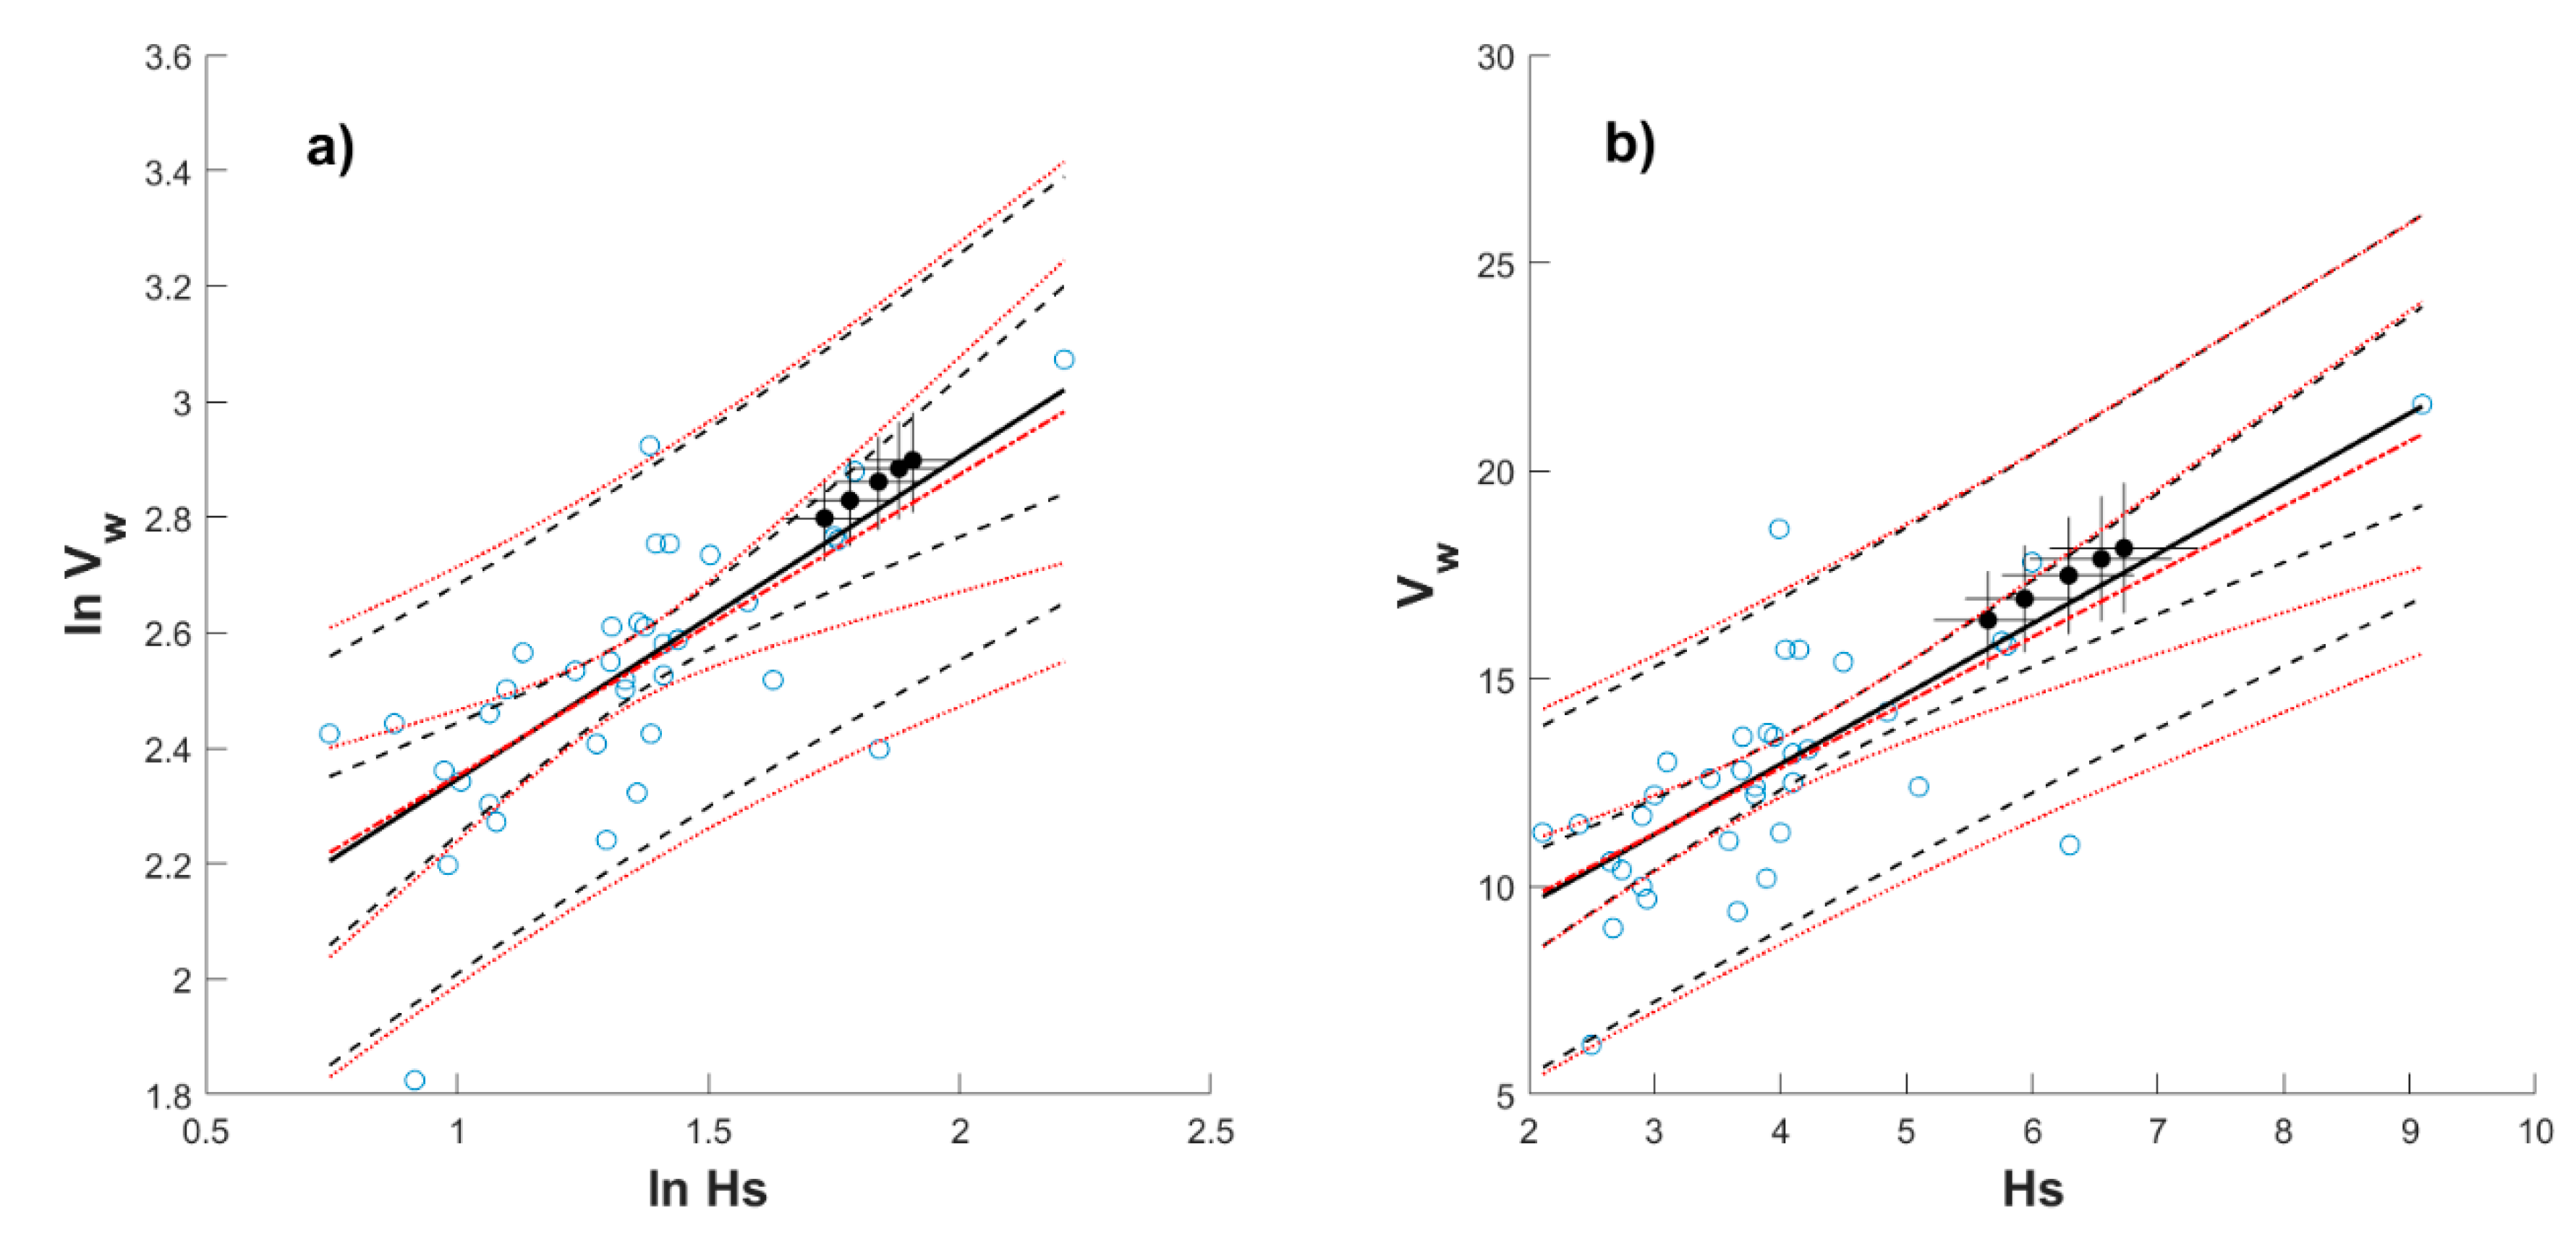
| March | 5.65 | 5.94 | 6.29 | 6.55 | 6.73 |
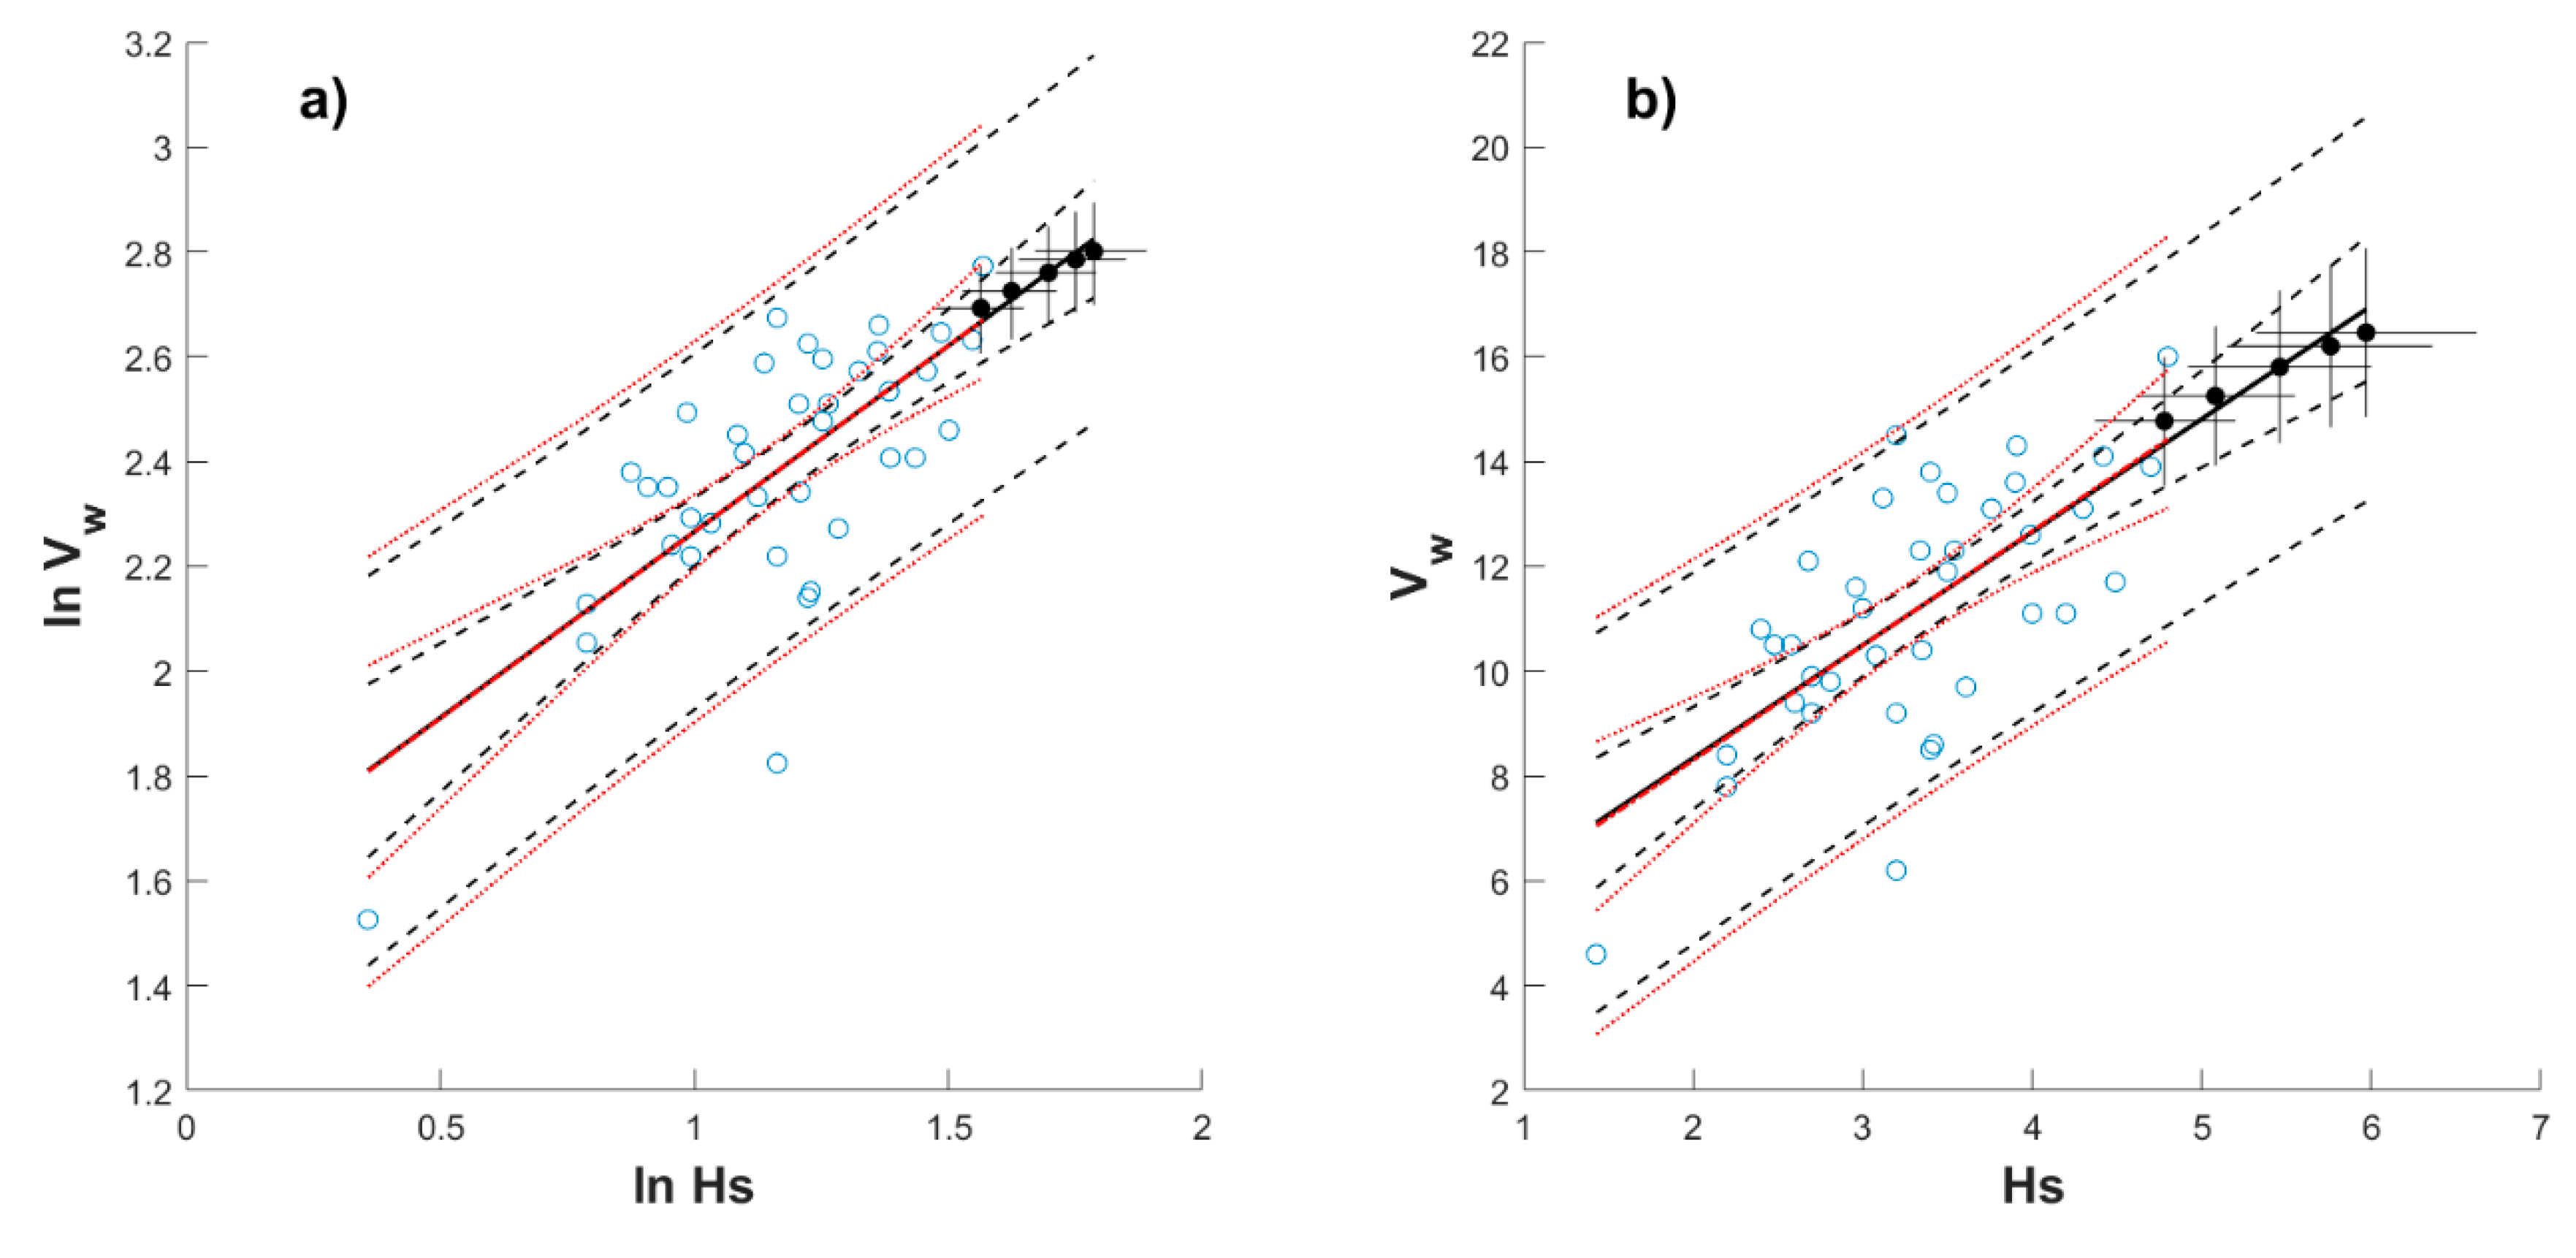
| April | 4.78 | 5.08 | 5.46 | 5.76 | 5.97 |
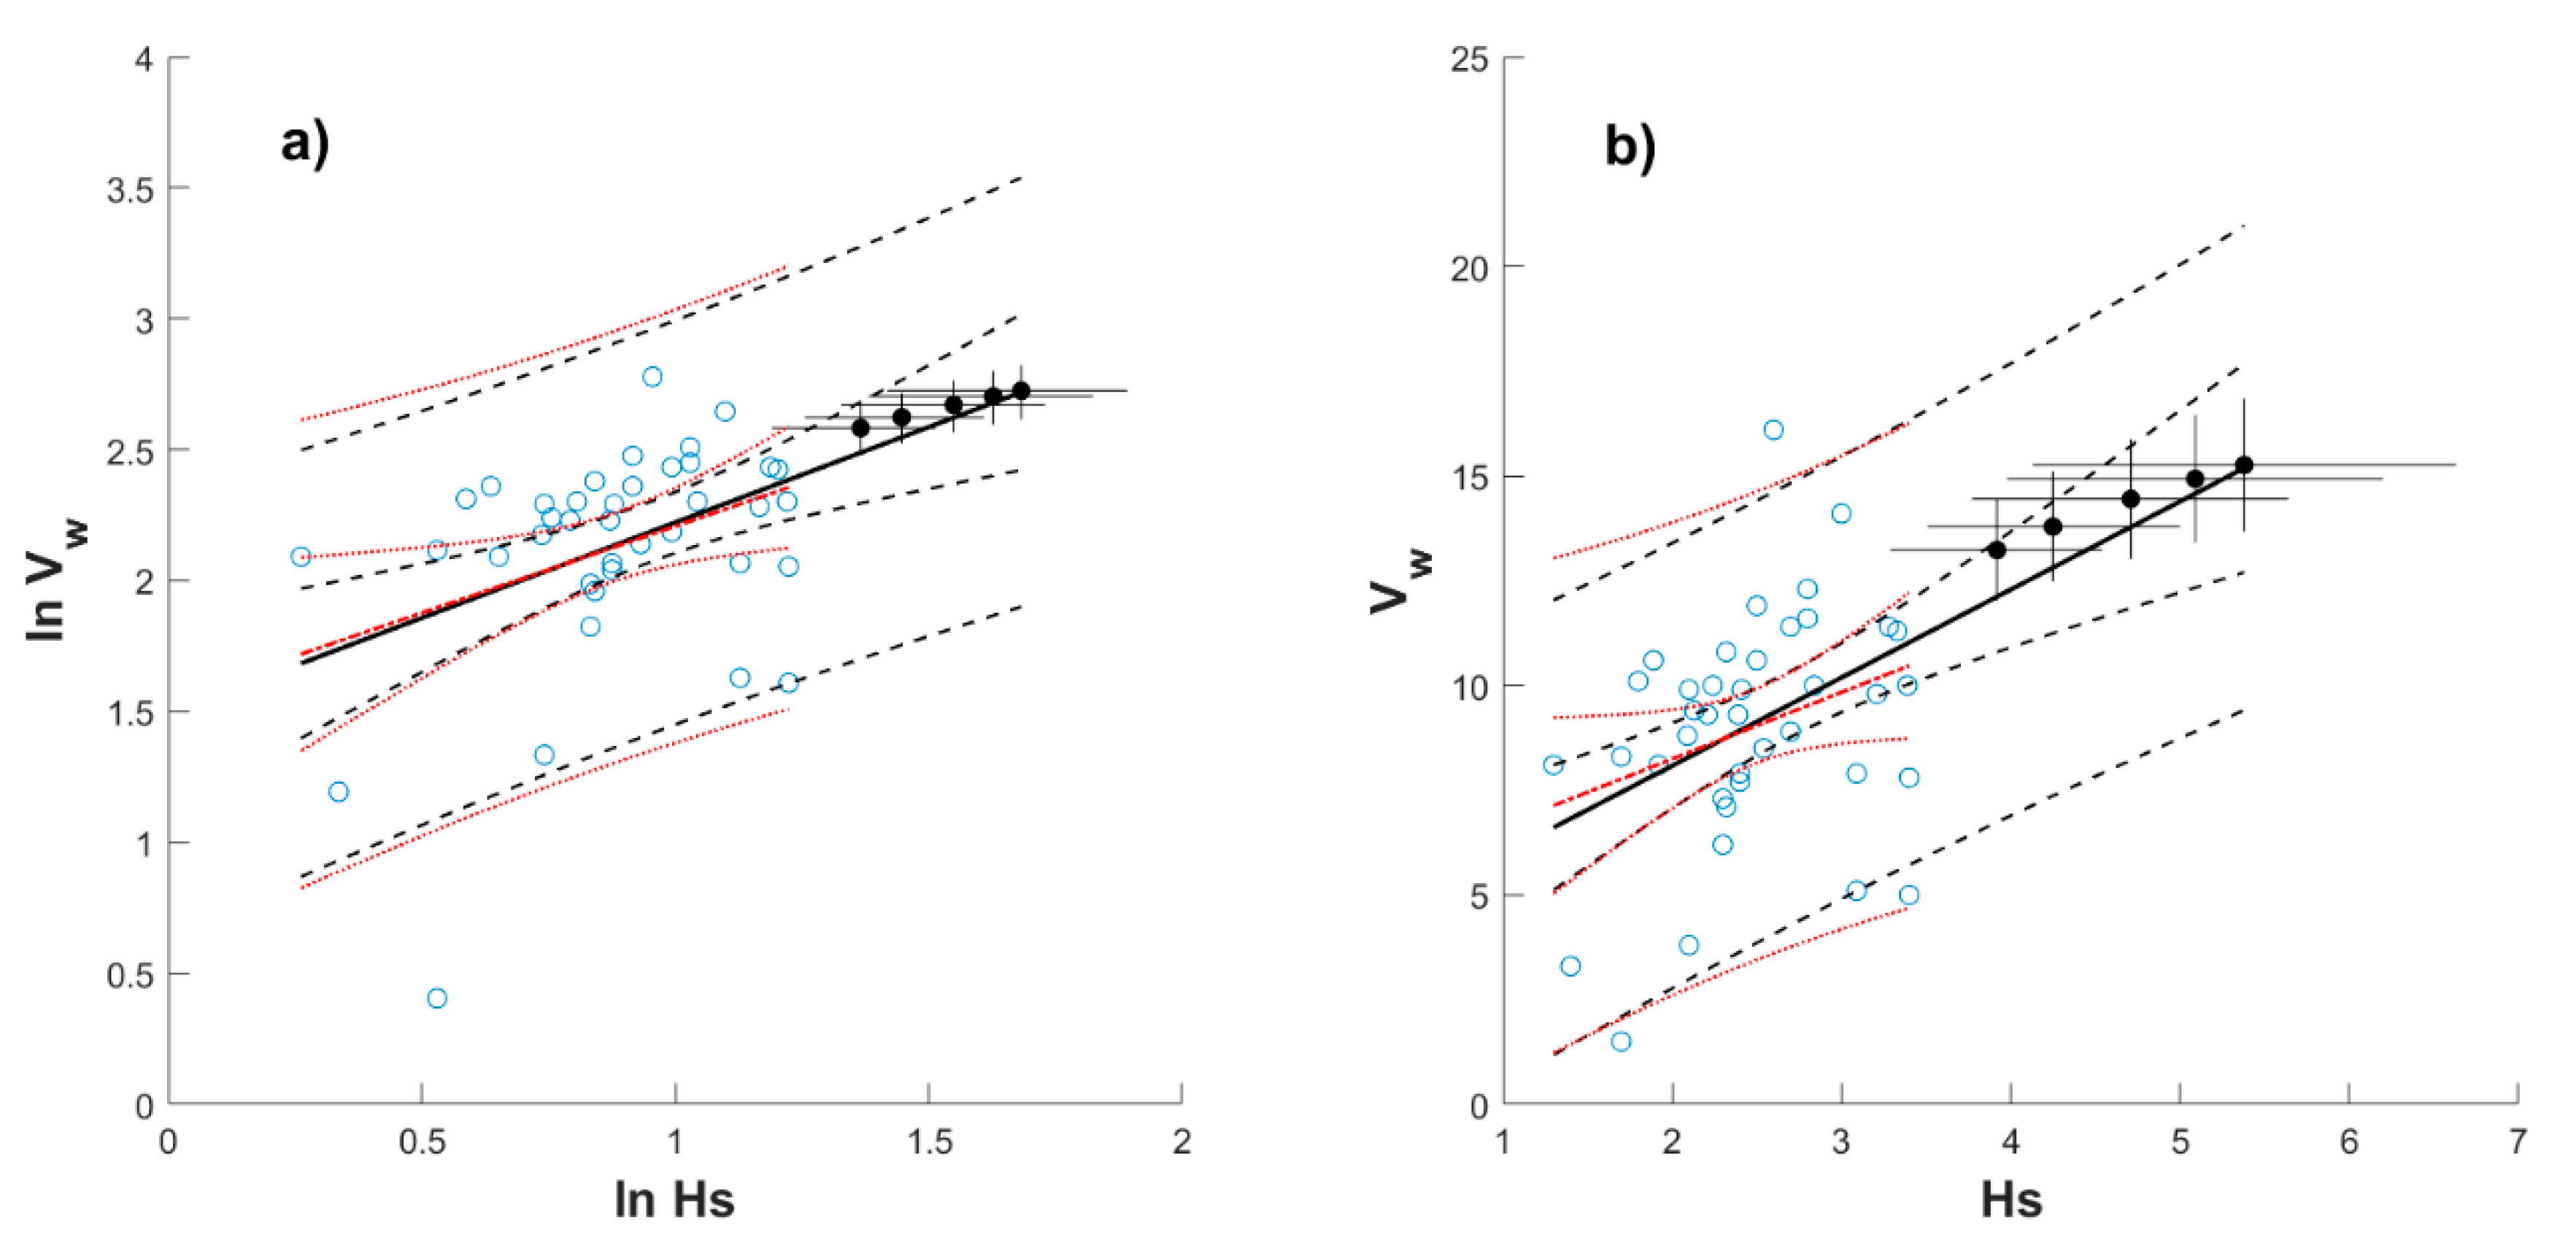
| May | 3.92 | 4.25 | 4.71 | 5.09 | 5.38 |
| June | 4.03 | 4.53 | 5.25 | 5.88 | 6.36 |
| July | 5.03 | 5.81 | 6.92 | 7.93 | 8.73 |
| August | 5.99 | 6.87 | 8.13 | 9.27 | 10.16 |
| September | 6.17 | 6.84 | 7.77 | 8.57 | 9.18 |
| October | 5.90 | 6.33 | 6.88 | 7.34 | 7.67 |
| November | 5.76 | 6.05 | 6.41 | 6.69 | 6.88 |
| December | 5.89 | 6.14 | 6.43 | 6.64 | 6.78 |
| Vw (m/s) | |||||
|---|---|---|---|---|---|
| Month\Tr (yr) | 20 | 30 | 50 | 75 | 100 |
| January | 17.39 | 18.03 | 18.76 | 19.29 | 19.64 |
| February | 17.36 | 17.92 | 18.55 | 19.00 | 19.29 |
| March | 16.41 | 16.92 | 17.48 | 17.88 | 18.14 |
| April | 14.77 | 15.25 | 15.80 | 16.20 | 16.46 |
| May | 13.23 | 13.79 | 14.45 | 14.93 | 15.26 |
| June | 13.30 | 14.06 | 14.97 | 15.66 | 16.14 |
| July | 14.88 | 15.92 | 17.22 | 18.23 | 18.95 |
| August | 16.88 | 18.14 | 19.75 | 21.03 | 21.95 |
| September | 17.98 | 19.22 | 20.81 | 22.09 | 23.01 |
| October | 17.71 | 18.74 | 20.05 | 21.09 | 21.83 |
| November | 17.15 | 17.99 | 19.01 | 19.81 | 20.37 |
| December | 17.08 | 17.79 | 18.62 | 19.25 | 19.68 |
Appendix B

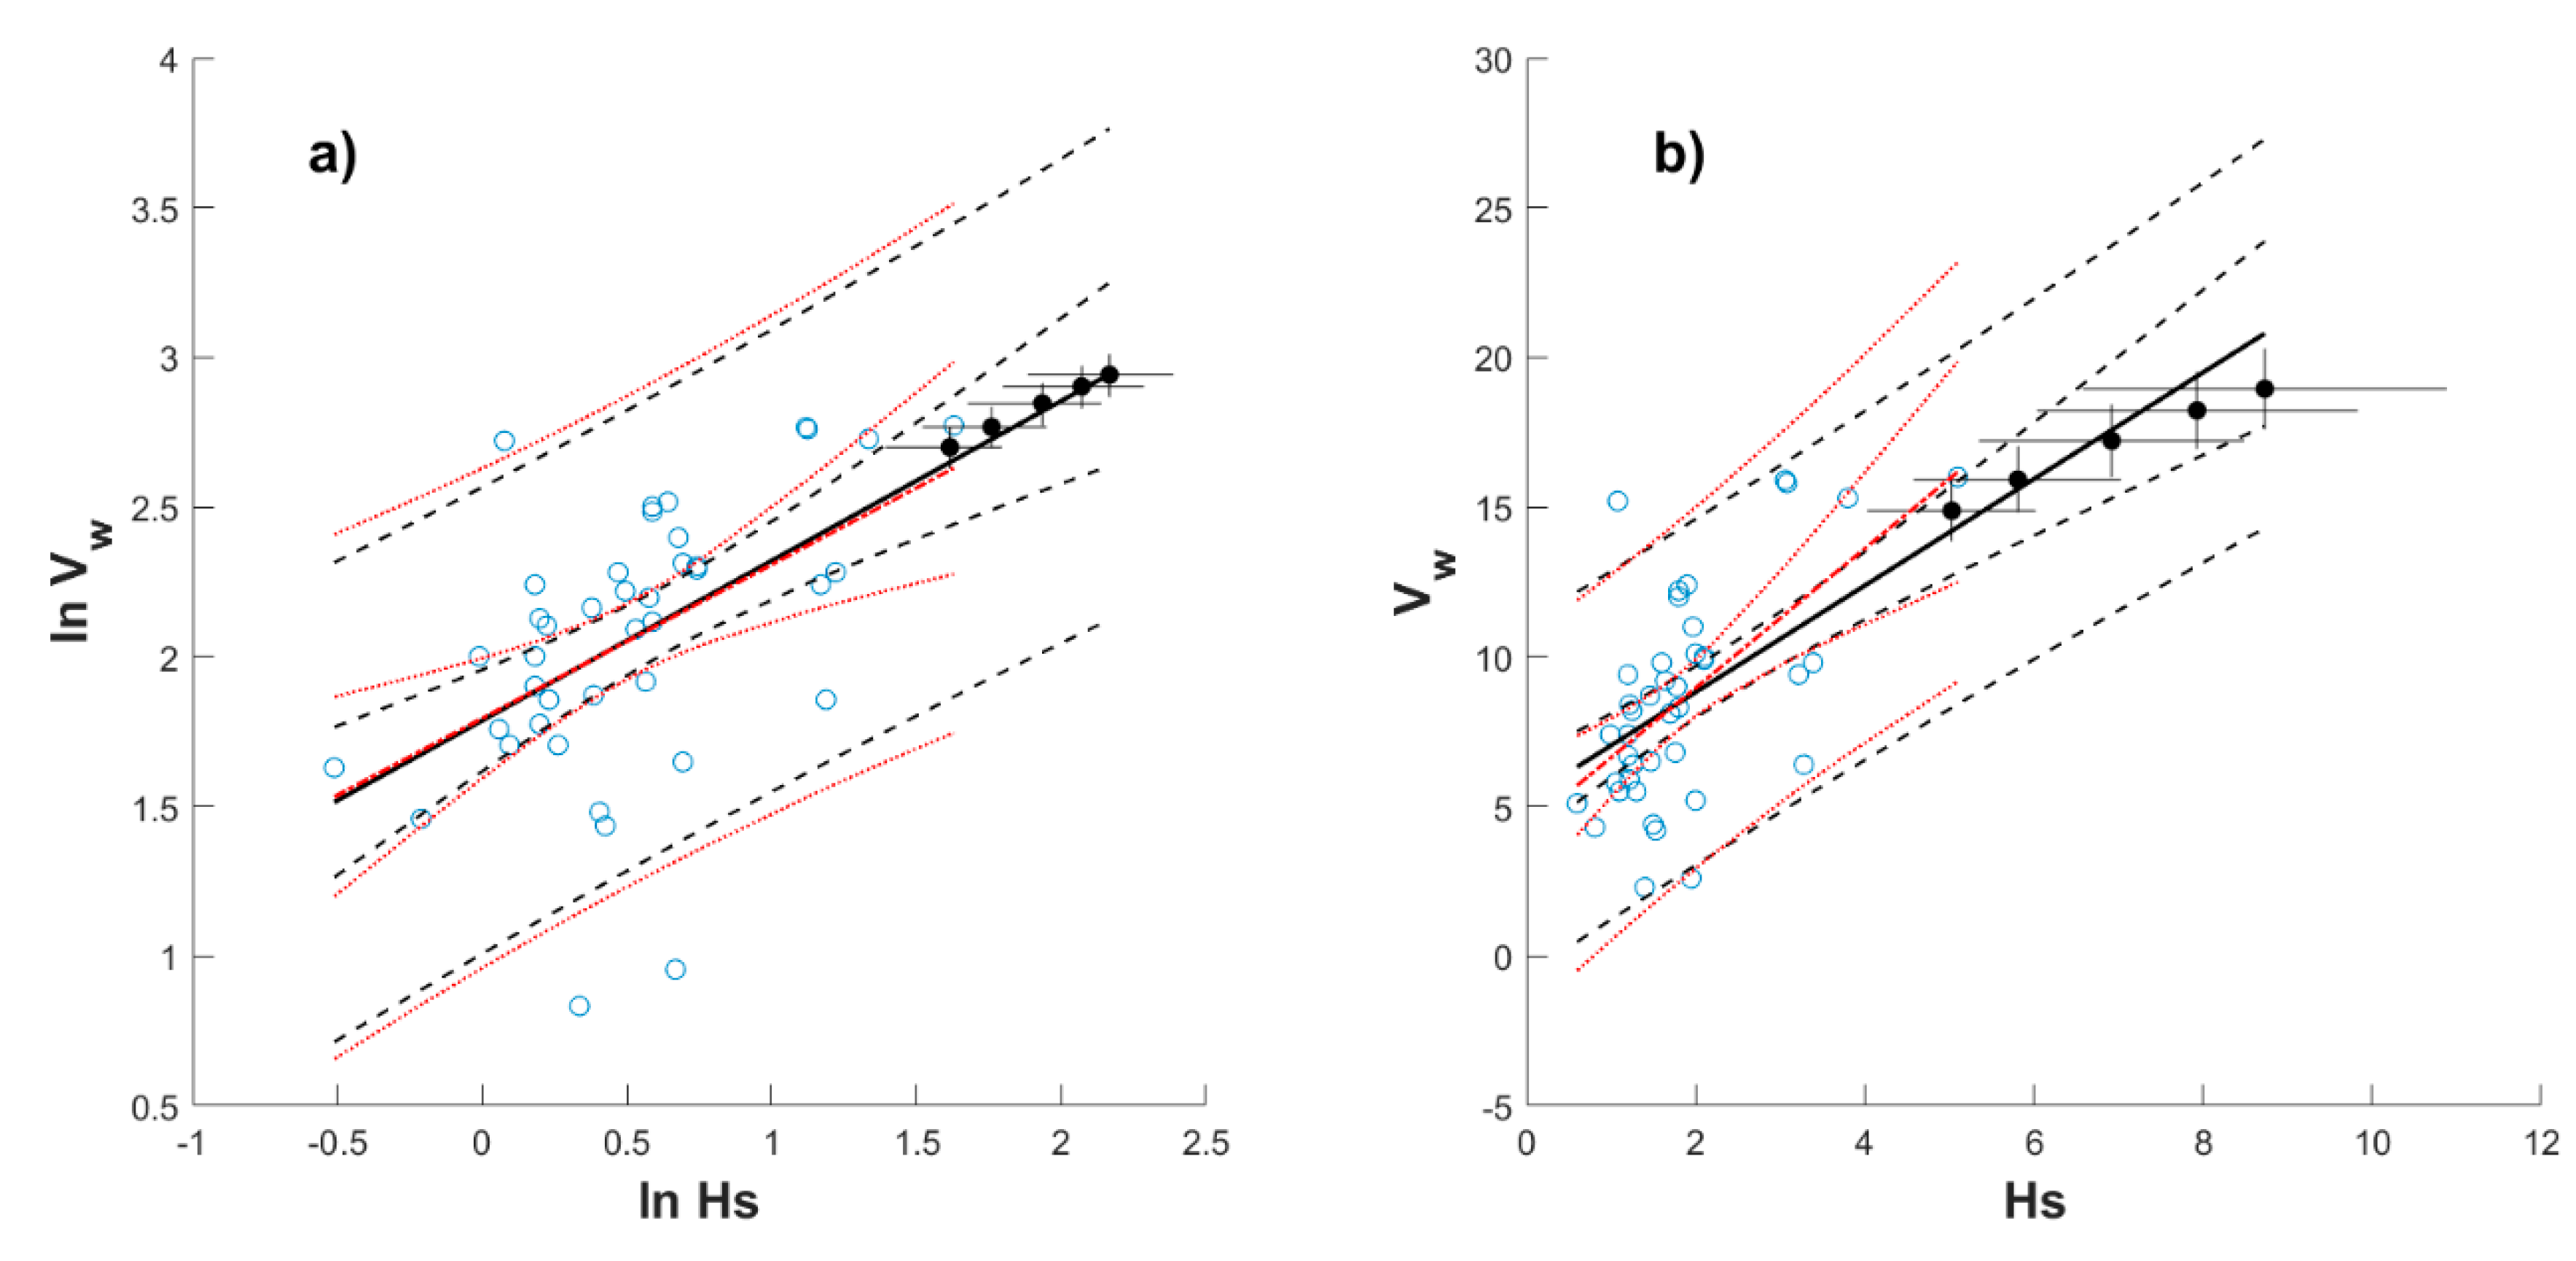
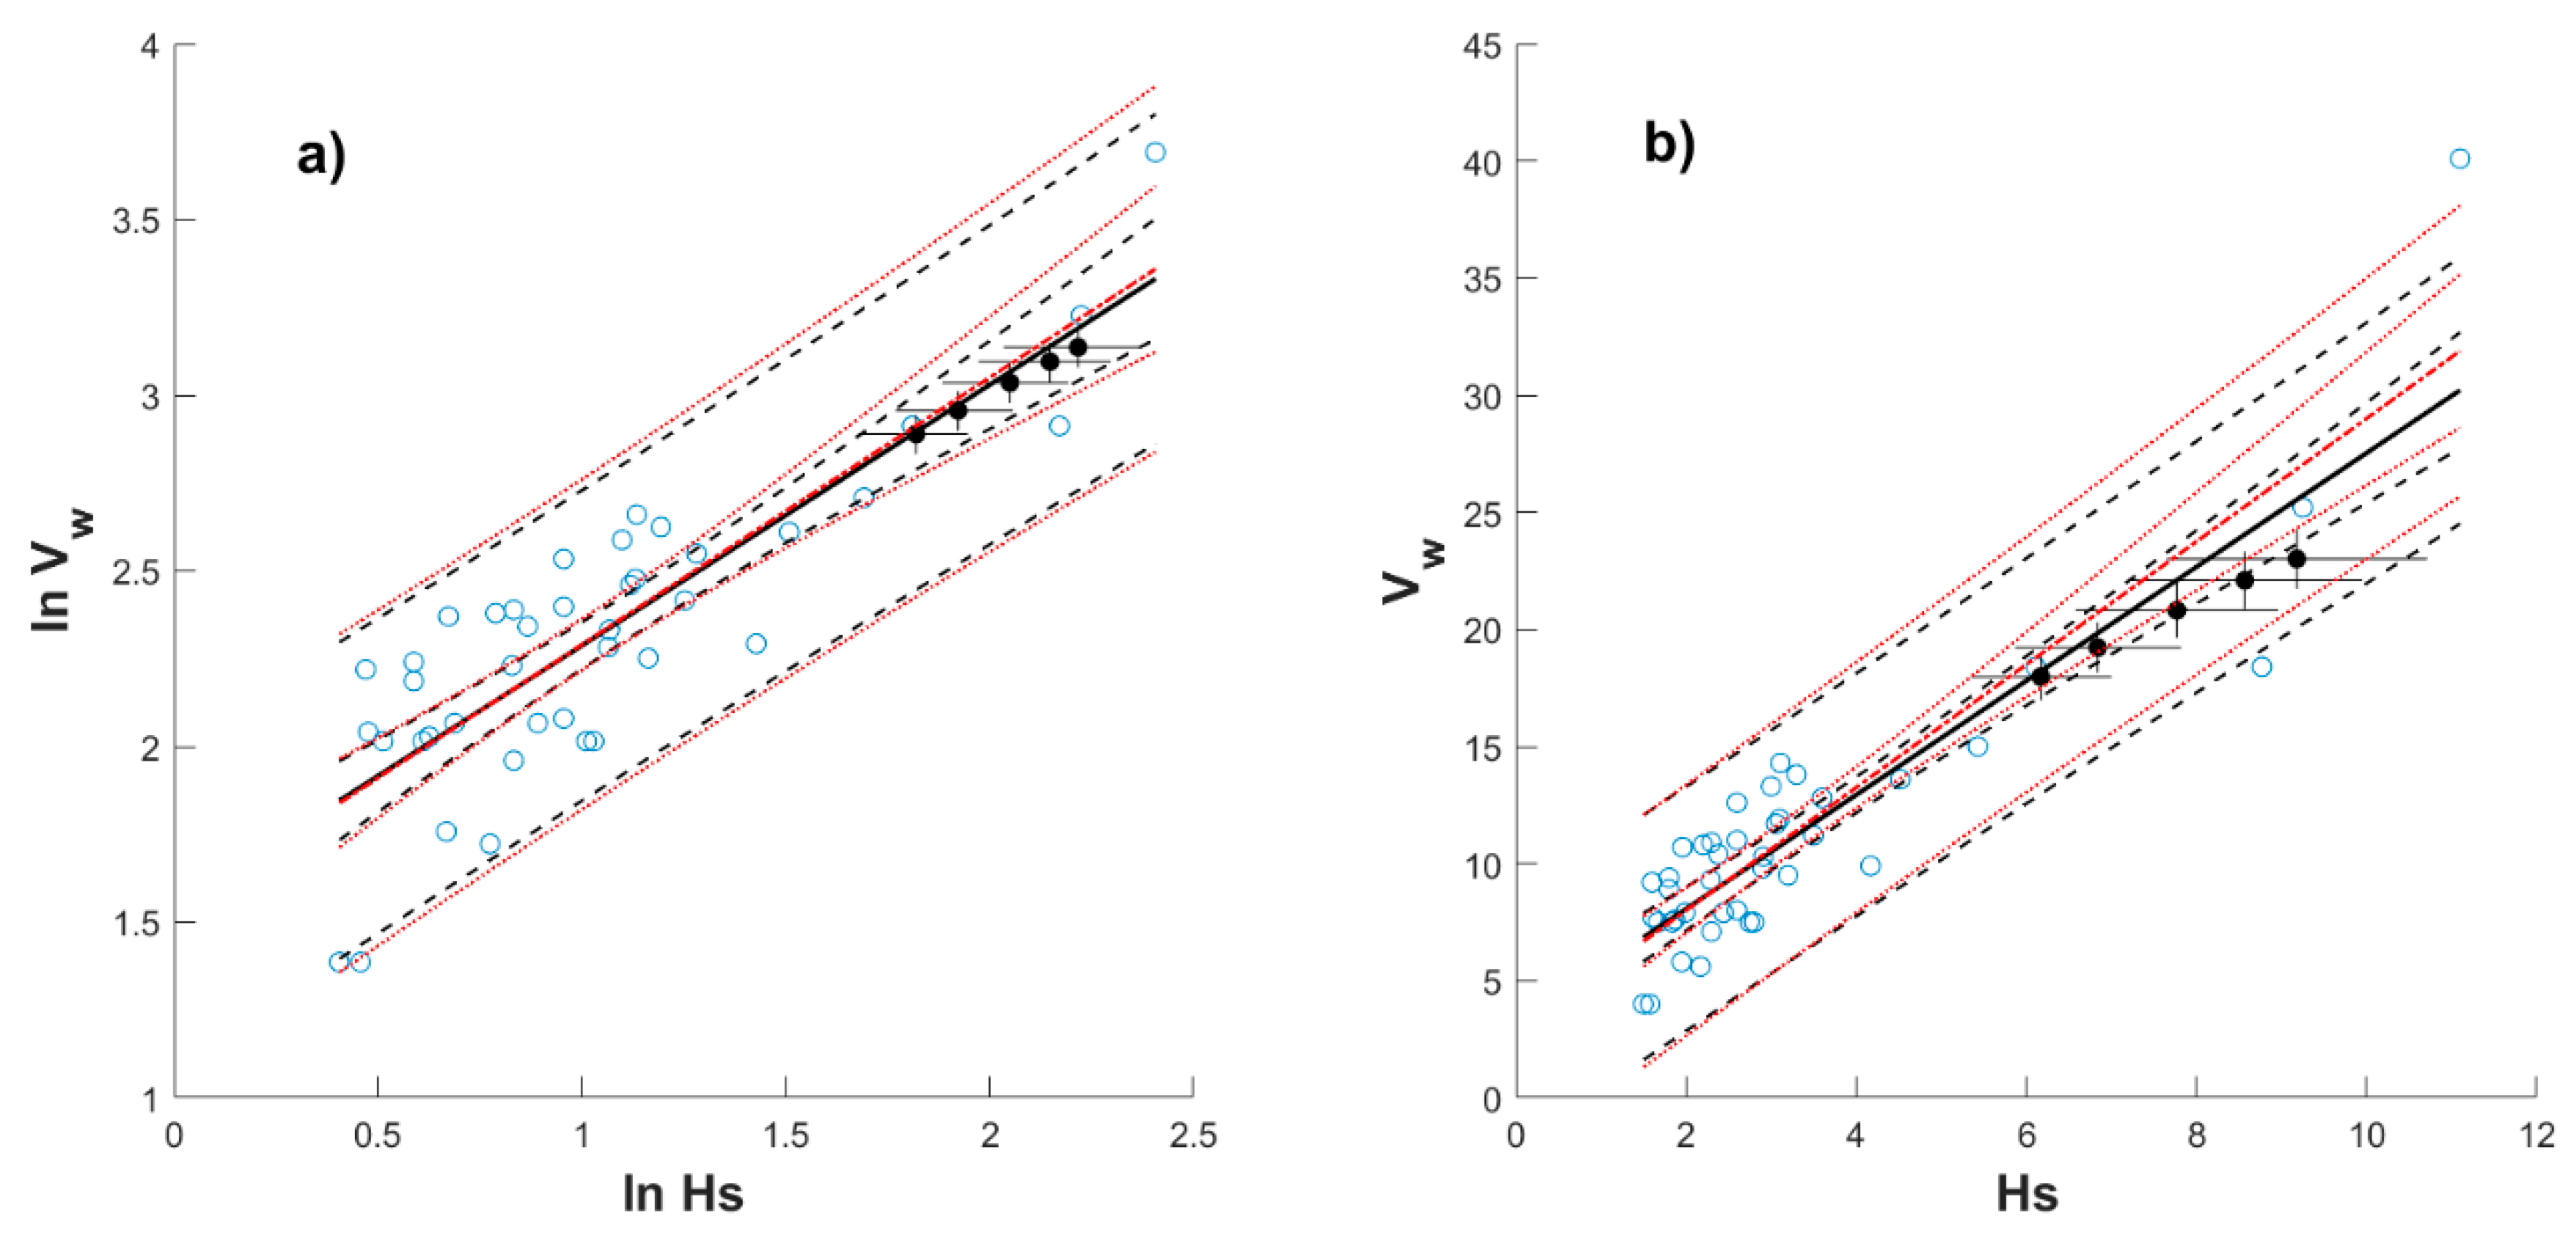


Appendix C
| Month | Log. Space | Lin. Space |
|---|---|---|
| January | 7.8 × 10⁻¹⁷ | –4.5 × 10⁻¹⁶ |
| February | 3.4 × 10⁻¹⁶ | 1.9 × 10⁻¹⁵ |
| March | –5.1 × 10⁻¹⁶ | 1.4 × 10⁻¹⁵ |
| April | 1.8 × 10⁻¹⁷ | 1.4 × 10⁻¹⁵ |
| May | –3.3 × 10⁻¹⁶ | 9.1 × 10⁻¹⁷ |
| June | 4.8 × 10⁻¹⁷ | –1.3 × 10⁻¹⁵ |
| July | 1.4 × 10⁻¹⁶ | 8.9 × 10⁻¹⁶ |
| August | 4.3 × 10⁻¹⁶ | –3.2 × 10⁻¹⁵ |
| September | –4.4 × 10⁻¹⁶ | 9.5 × 10⁻¹⁶ |
| October | 0.0 | 8.9 × 10⁻¹⁶ |
| November | 9.9 × 10⁻¹⁷ | –1.4 × 10⁻¹⁵ |
| December | –5.6 × 10⁻¹⁷ | –2.4 × 10⁻¹⁶ |
References
- Castillo, E.; Hadi, A.S.; Balakrishnan, N.; Sarabia, J.M. Extreme Value and Related Models with Applications in Engineering and Science; Wiley: Hoboken, NJ, USA, 2004; Volume 4, pp. 1–362. [Google Scholar]
- Hong, H.P. Estimate of extreme wind and wave loading and safety level of offshore structures. In Proceedings of the Risk Analysis: Proceedings of a Symposium, Ann Arbor, MI, USA, 11–12 August 1994; University of Michigan: Ann Arbor, MI, USA, 1994; Volume 4, pp. 107–117. [Google Scholar]
- Nessim, M.A.; Hong, H.P.; Swail, V.R.; Henderson, C.A. Design criteria for offshore structures under combined wind and wave loading. J. Offshore Mech. Arct. Eng. 1995, 117, 1–11. [Google Scholar] [CrossRef]
- Shao, Z.; Liang, B.; Li, H.; Lee, D. Study of sampling methods for assessment of extreme significant wave heights in the South China Sea. Ocean Eng. 2018, 168, 173. [Google Scholar] [CrossRef]
- Shao, Z.; Liang, B.; Li, H.; Wu, G.; Wu, Z. Blended wind fields for wave modeling of tropical cyclones in the the South China Sea and East China Sea. Appl. Ocean Res. 2018, 71, 20. [Google Scholar] [CrossRef]
- Ludeno, G.; Serafino, F. Estimation of the Significant Wave Height from Marine Radar Images without External Reference. J. Mar. Sci. Eng. 2019, 7, 432. [Google Scholar] [CrossRef]
- Chen, S.-T.; Wang, Y.-W. Improving Coastal Ocean Wave Height Forecasting during Typhoons by using Local Meteorological and Neighboring Wave Data in Support Vector Regression Models. J. Mar. Sci. Eng. 2020, 8, 149. [Google Scholar] [CrossRef]
- Gao, H.; Shao, Z.; Wu, G.; Li, P. Study of Directional Declustering for Estimating Extreme Wave Heights in the Yellow Sea. J. Mar. Sci. Eng. 2020, 8, 236. [Google Scholar] [CrossRef]
- Katalinić, M.; Parunov, J. Uncertainties of Estimating Extreme Significant Wave Height for Engineering Applications Depending on the Approach and Fitting Technique—Adriatic Sea Case Study. J. Mar. Sci. Eng. 2020, 8, 259. [Google Scholar] [CrossRef]
- Cavaleri, L.; Barbariol, F.; Benetazzo, A. Wind–Wave Modeling: Where We Are, Where to Go. J. Mar. Sci. Eng. 2020, 8, 260. [Google Scholar] [CrossRef]
- Weisse, R.; Gaslikova, L.; Geyer, B.; Groll, N.; Meyer, E. Coastdat—Model data for science and industry. Kuste Westholsteinische Verl. Boyens Co. 2014, 81, 5–18. [Google Scholar]
- Weisse, R.; Groll, N. A multi-decadal wind-wave hindcast for the North Sea 1949–2014: CoastDat2. Earth Syst. Sci. Data 2017, 9, 955. [Google Scholar]
- Monish, N.T.; Rehana, S. Suitability of distributions for standard precipitation and evapotranspiration index over meteorologically homogeneous zones of India. J. Earth Syst. Sci. 2020, 129, 25. [Google Scholar] [CrossRef]
- Schardong, A.; Simonovic, S.P.; Gaur, A.; Sandink, D. Web-Based Tool for the Development of Intensity Duration Frequency Curves under Changing Climate at Gauged and Ungauged Locations. Water 2020, 12, 1243. [Google Scholar] [CrossRef]
- Prakash, A.; Panchang, V.; Ding, Y.; Ntaimo, L. Sign Constrained Bayesian Inference for Nonstationary Models of Extreme Events. J. Waterw. Port Coast. Ocean Eng. ASCE 2020, 146, 04020029. [Google Scholar] [CrossRef]
- Kim, H.-J.; Suh, S.-W. Improved Hypothetical Typhoon Generation Technique for Storm Surge Frequency Analyses on the Southwest Korean Coast. J. Coast. Res. 2018, 85, 516. [Google Scholar] [CrossRef]
- Weinan, H.; Shanshan, T.; Qiang, B.; Sheng, D. Bivariate Distribution Modelling for Wave Height and Period in Jiaozhou Bay. In Proceedings of the ASME 2018 37th International Conference on Ocean, Offshore and Arctic Engineering 2018, Volume 11B: Honoring Symposium for Professor Carlos Guedes Soares on Marine Technology and Ocean Engineering, Madrid, Spain, 17–22 June 2018. V11BT12A054. [Google Scholar] [CrossRef]
- Sartini, L.; Besio, G.; Cassola, F. Spatio-temporal modelling of extreme wave heights in the Mediterranean Sea. Ocean Model. 2017, 117, 52. [Google Scholar] [CrossRef]
- Muraleedharan, G.; Lucas, C.; Guedes Soares, C. Regression quantile models for estimating trends in extreme significant wave heights. Ocean Eng. 2016, 118, 204. [Google Scholar] [CrossRef]
- Ross, E.; Astrup, O.C.; Bitner-Gregersen, E.; Bunn, N.; Feld, G.; Gouldby, B.; Liu, Y.; Randell, D.; Vanem, E.; Jonathan, P. On environmental contours for marine and coastal design. Ocean Eng. 2020, 195, 1. [Google Scholar] [CrossRef]
- Vanem, E. A simple approach to account for seasonality in the description of extreme ocean environments. Mar. Syst. Ocean Technol. 2018, 13, 63. [Google Scholar] [CrossRef]
- Randell, D.; Feld, G.; Ewans, K.; Jonathan, P. Distributions of return values for the ocean wave characteristics in the South China Sea using directional-seasonal extreme value analysis. Environmetrics 2015, 26, 442. [Google Scholar] [CrossRef]
- Randell, D.; Turnbull, K.; Ewans, K.; Jonathan, P. Bayesian inference for nonstationary marginal extremes. Environmetrics 2016, 27, 439. [Google Scholar] [CrossRef]
- Ross, E.; Randell, D.; Ewans, K.; Feld, G.; Jonathan, P. Efficient estimation of return value distributions from non-stationary marginal extreme value models using Bayesian inference. Ocean Eng. 2017, 142, 315. [Google Scholar] [CrossRef]
- Anokhin, V.; Randell, D.; Ross, E.; Jonathan, P. Spatial and seasonal variability of metocean design criteria in the southern south China Sea from covariate extreme value analysis. In Proceedings of the ASME 2019 38th International Conference on Ocean, Offshore and Artic Engineering, OMAE, Glasgow, Scotland, UK, 9–14 June 2019; Volume 1. [Google Scholar]
- Bitner-Gregersen, E.M. Comparison of wind and wave climate in open sea and coastal waters. Ocean Eng. 2018, 170, 199. [Google Scholar] [CrossRef]
- National Data Buoy Center (NDBC). Available online: www.ndbc.noaa.gov (accessed on 30 June 2020).
- Calderón-Vega, F.; Vázquez-Hernández, A.O.; García-Soto, A.D. Analysis of extreme waves with seasonal variation in the Gulf of Mexico using a time-dependent GEV model. Ocean Eng. 2013, 73, 68–82. [Google Scholar] [CrossRef]
- Coles, S.G. An Introduction to Statistical Modelling of Extreme Values, 1st ed.; Springer: London, UK, 2001; Volume 4, pp. 1–208. [Google Scholar]
- Calderón Vega, F. Caracterización del Régimen Extremal del Oleaje en el Golfo de México Considerando la Variación Estacional. Master’s Thesis, Universidad de Cantabria, Santander, Spain, 2009. (In Spanish). [Google Scholar]
- Bitner-Gregersen, E.M.; Gramstad, O. Potential Changes in the Joint Probabilistic Description of the North Atlantic Wave Climate. In Proceedings of the ASME 2018 37th International Conference on Ocean, Offshore and Arctic Engineering, Volume 11B: Honoring Symposium for Professor Carlos Guedes Soares on Marine Technology and Ocean Engineering, Madrid, Spain, 17–22 June 2018. V11BT12A056. [Google Scholar] [CrossRef]
- Hong, H.P.; Zimmerman, T.J.; Bach, L. Probabilistic basis of resistance factors for use in oriented strand board. In Proceedings of the 1st Structural Specialty Conference, Canadian Society of Civil Engineering, Edmonton, AB, Canada, 29 May–1 June 1996; pp. 1223–1235. [Google Scholar]
- Jordaan, I. Decisions under Uncertainty: Probabilistic Analysis for Engineering Decisions, 1st ed.; Cambridge University Press: Cambridge, UK, 2005; pp. 1–672. [Google Scholar]
- Kottegoda, N.T.; Rosso, R. Applied Statistics for Civil and Environmental Engineers, 2nd ed.; Blackwell Publishing-Wiley: Oxford, UK, 2008; pp. 1–718. [Google Scholar]
- Faber, M.H. Statistics and Probability Theory: In Pursuit of Engineering Decision Support, 2nd ed.; Springer: Dordrecht, The Netherlands; Heidelberg, Germany; London, UK; New York, NY, USA, 2012; pp. 1–190. [Google Scholar]
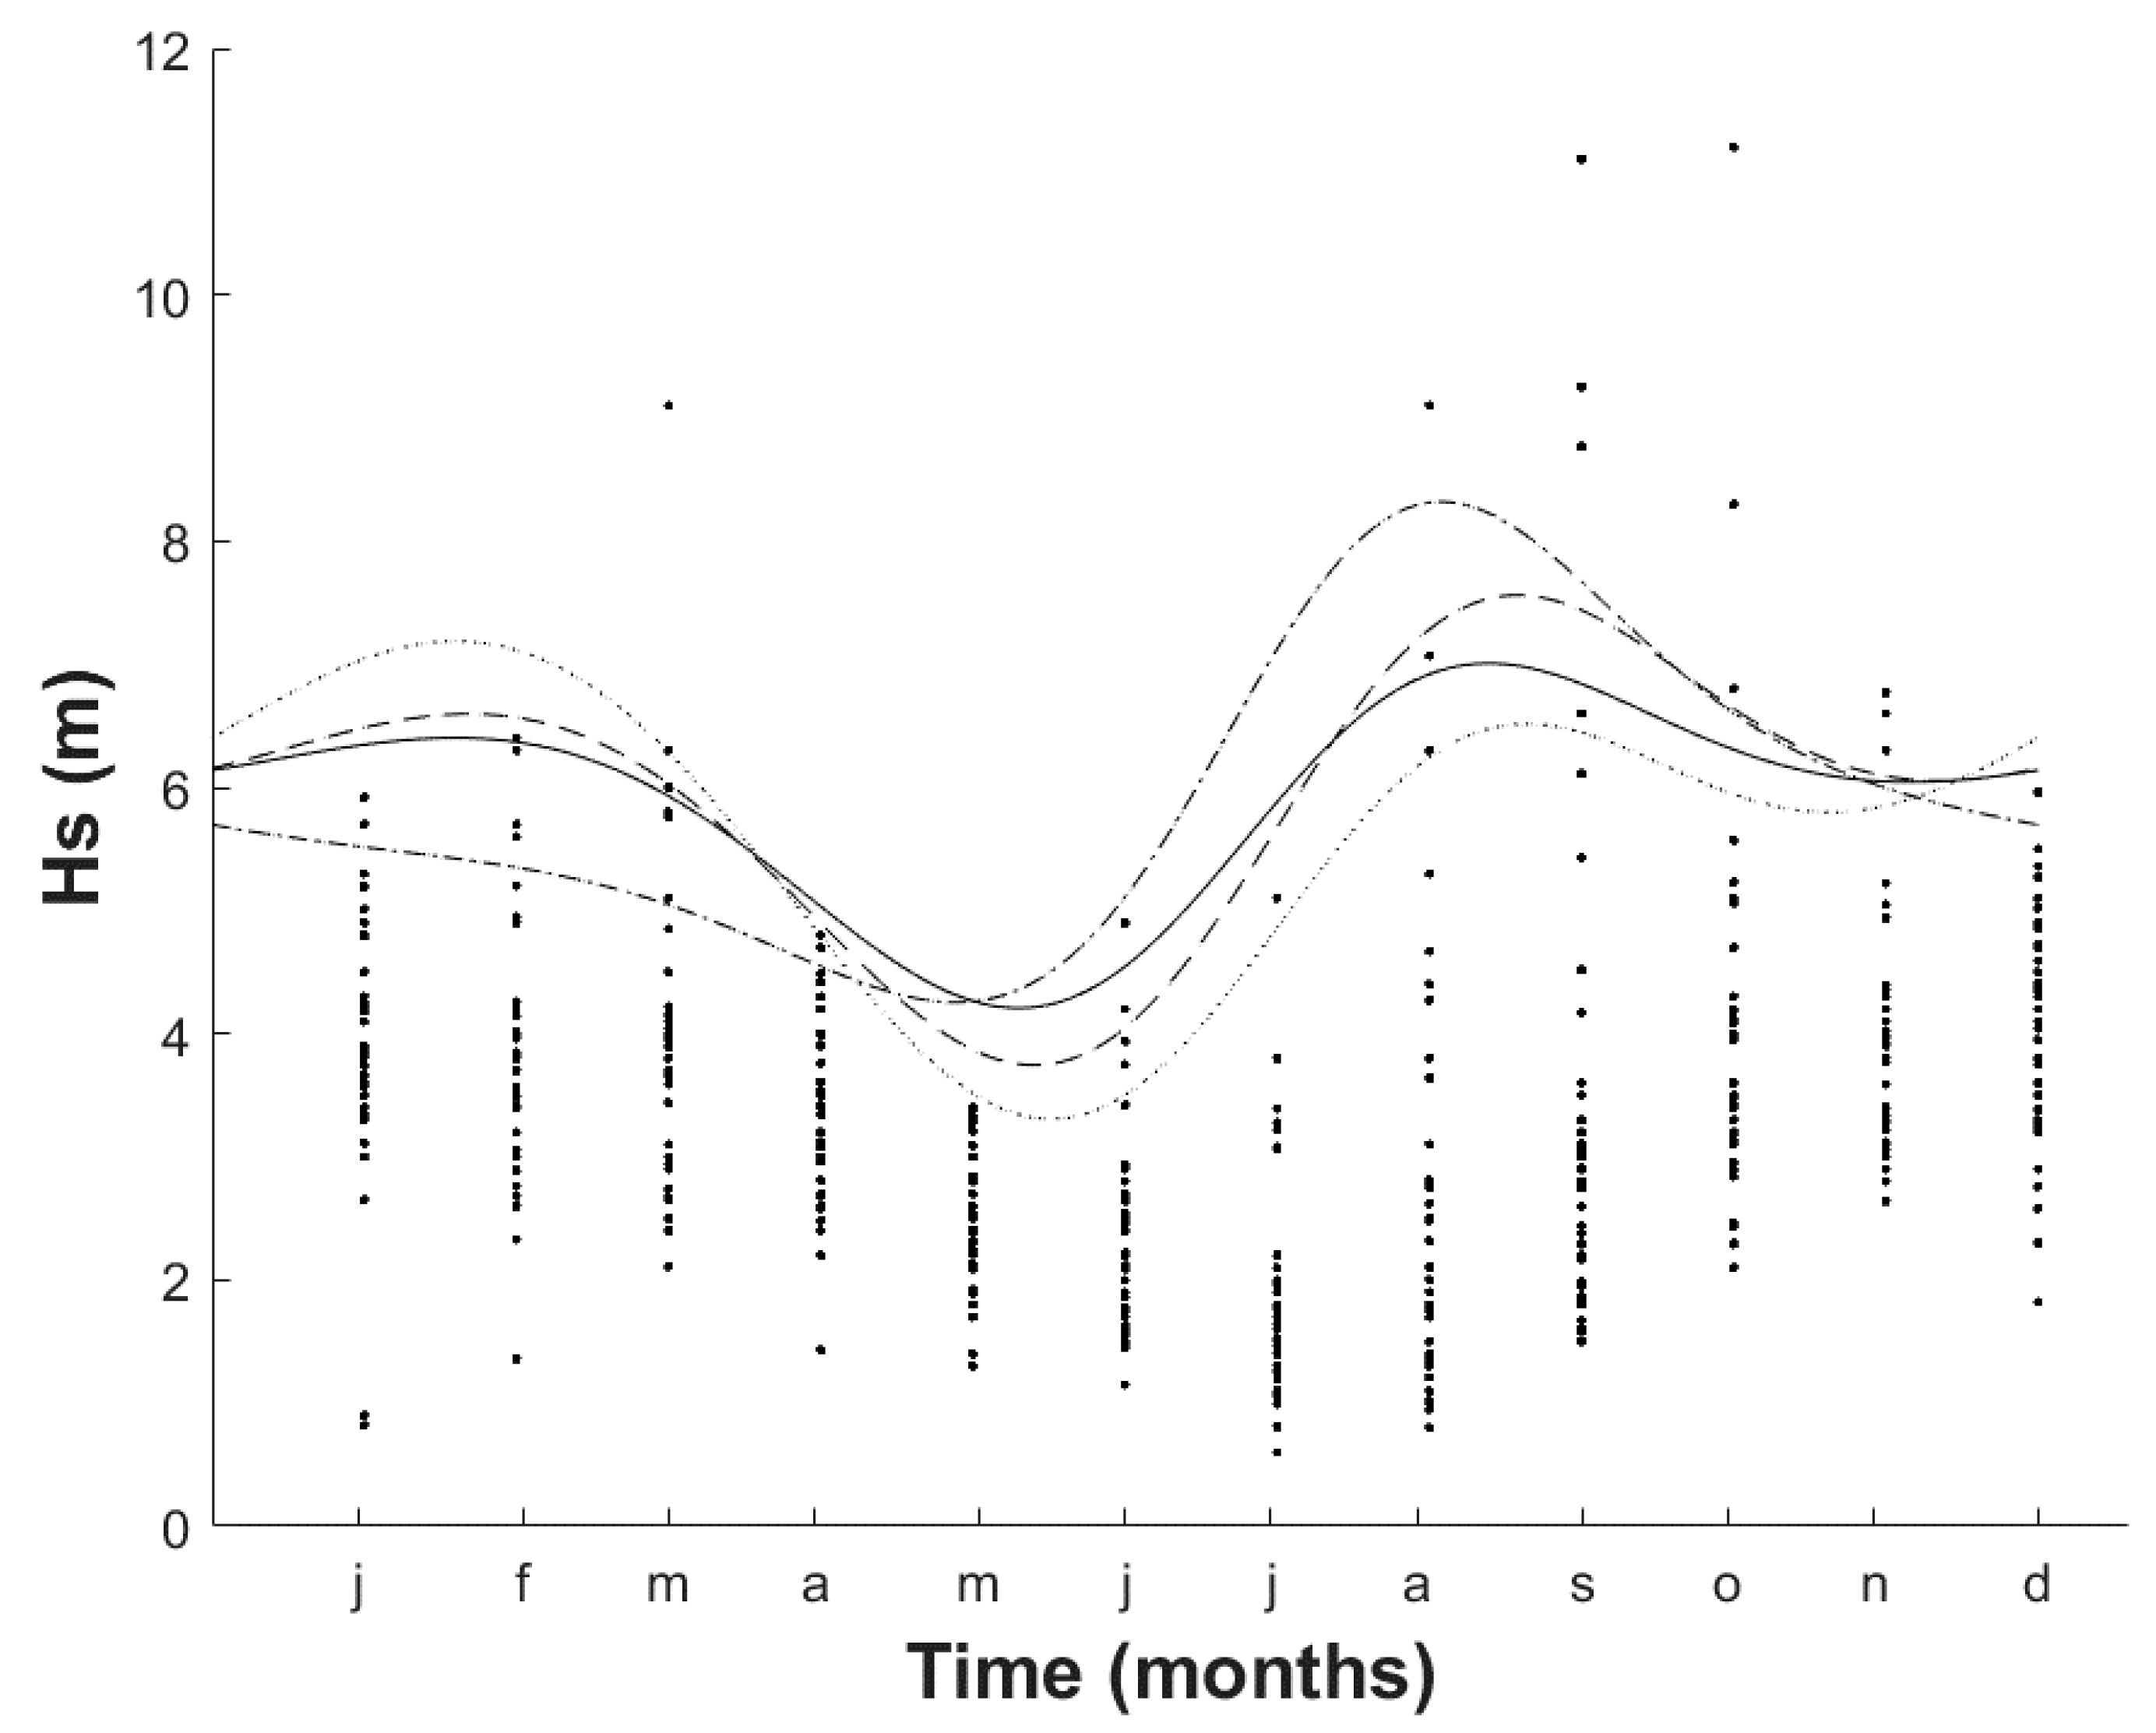
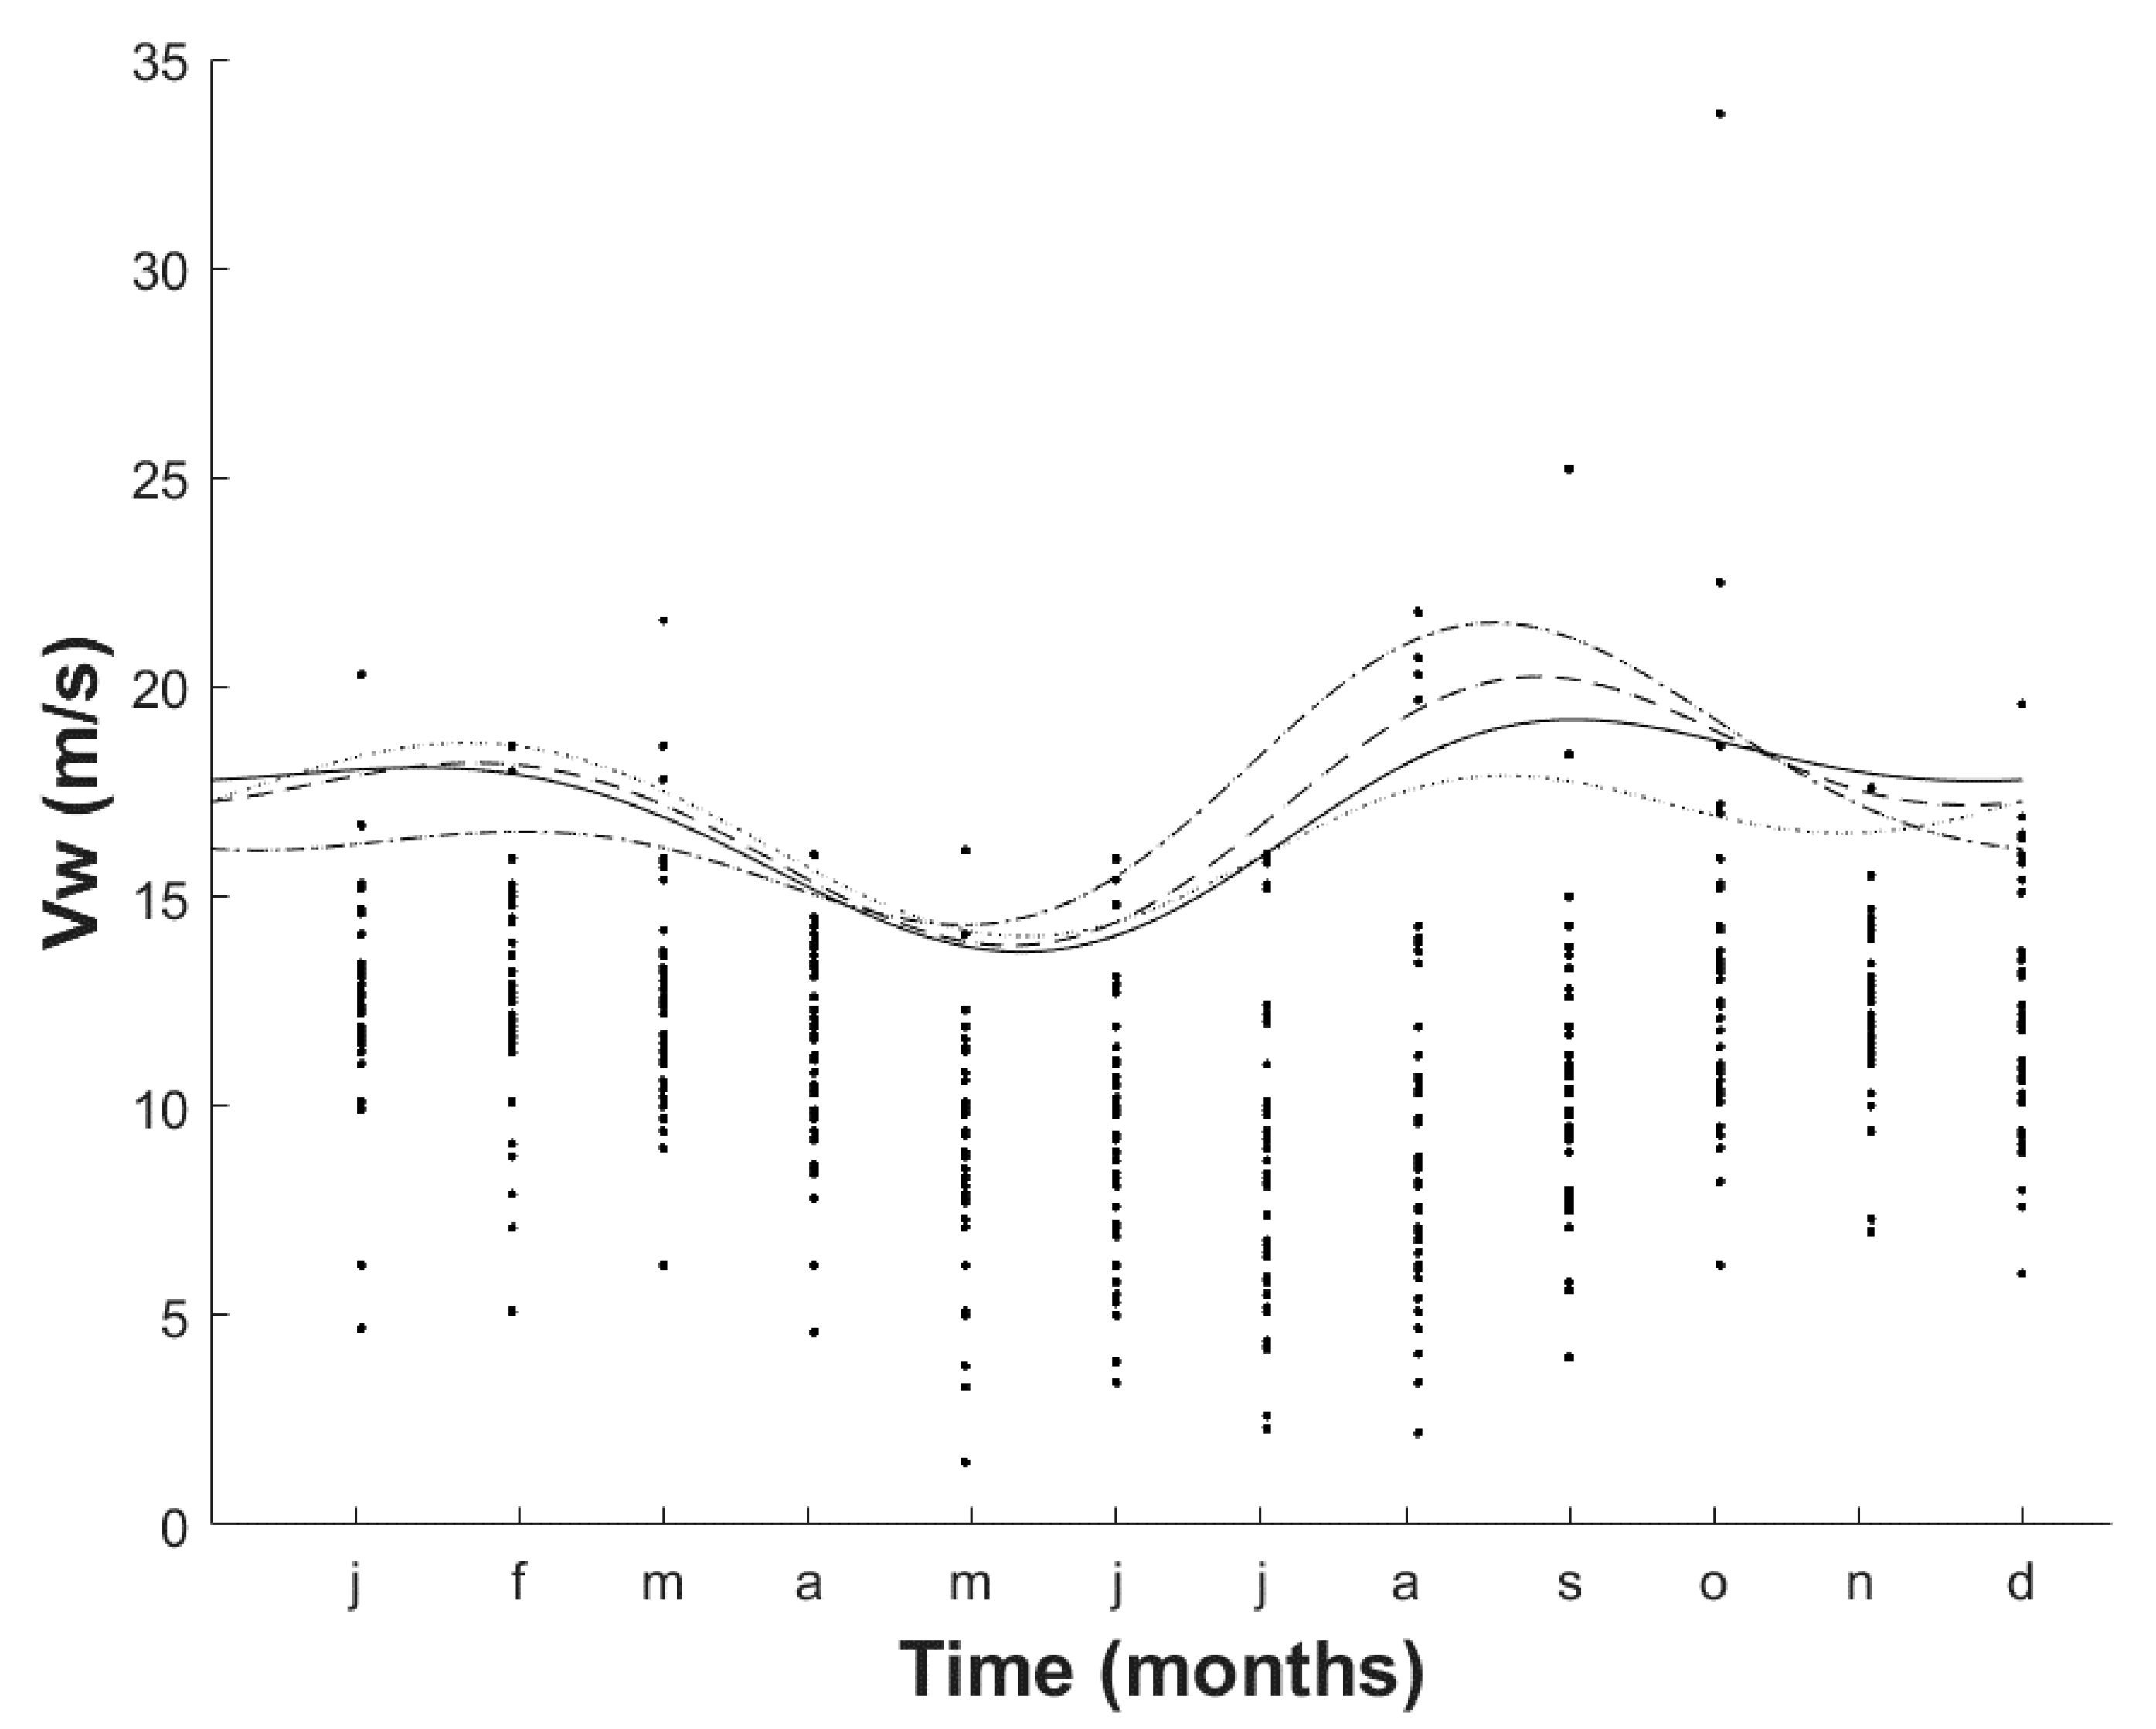

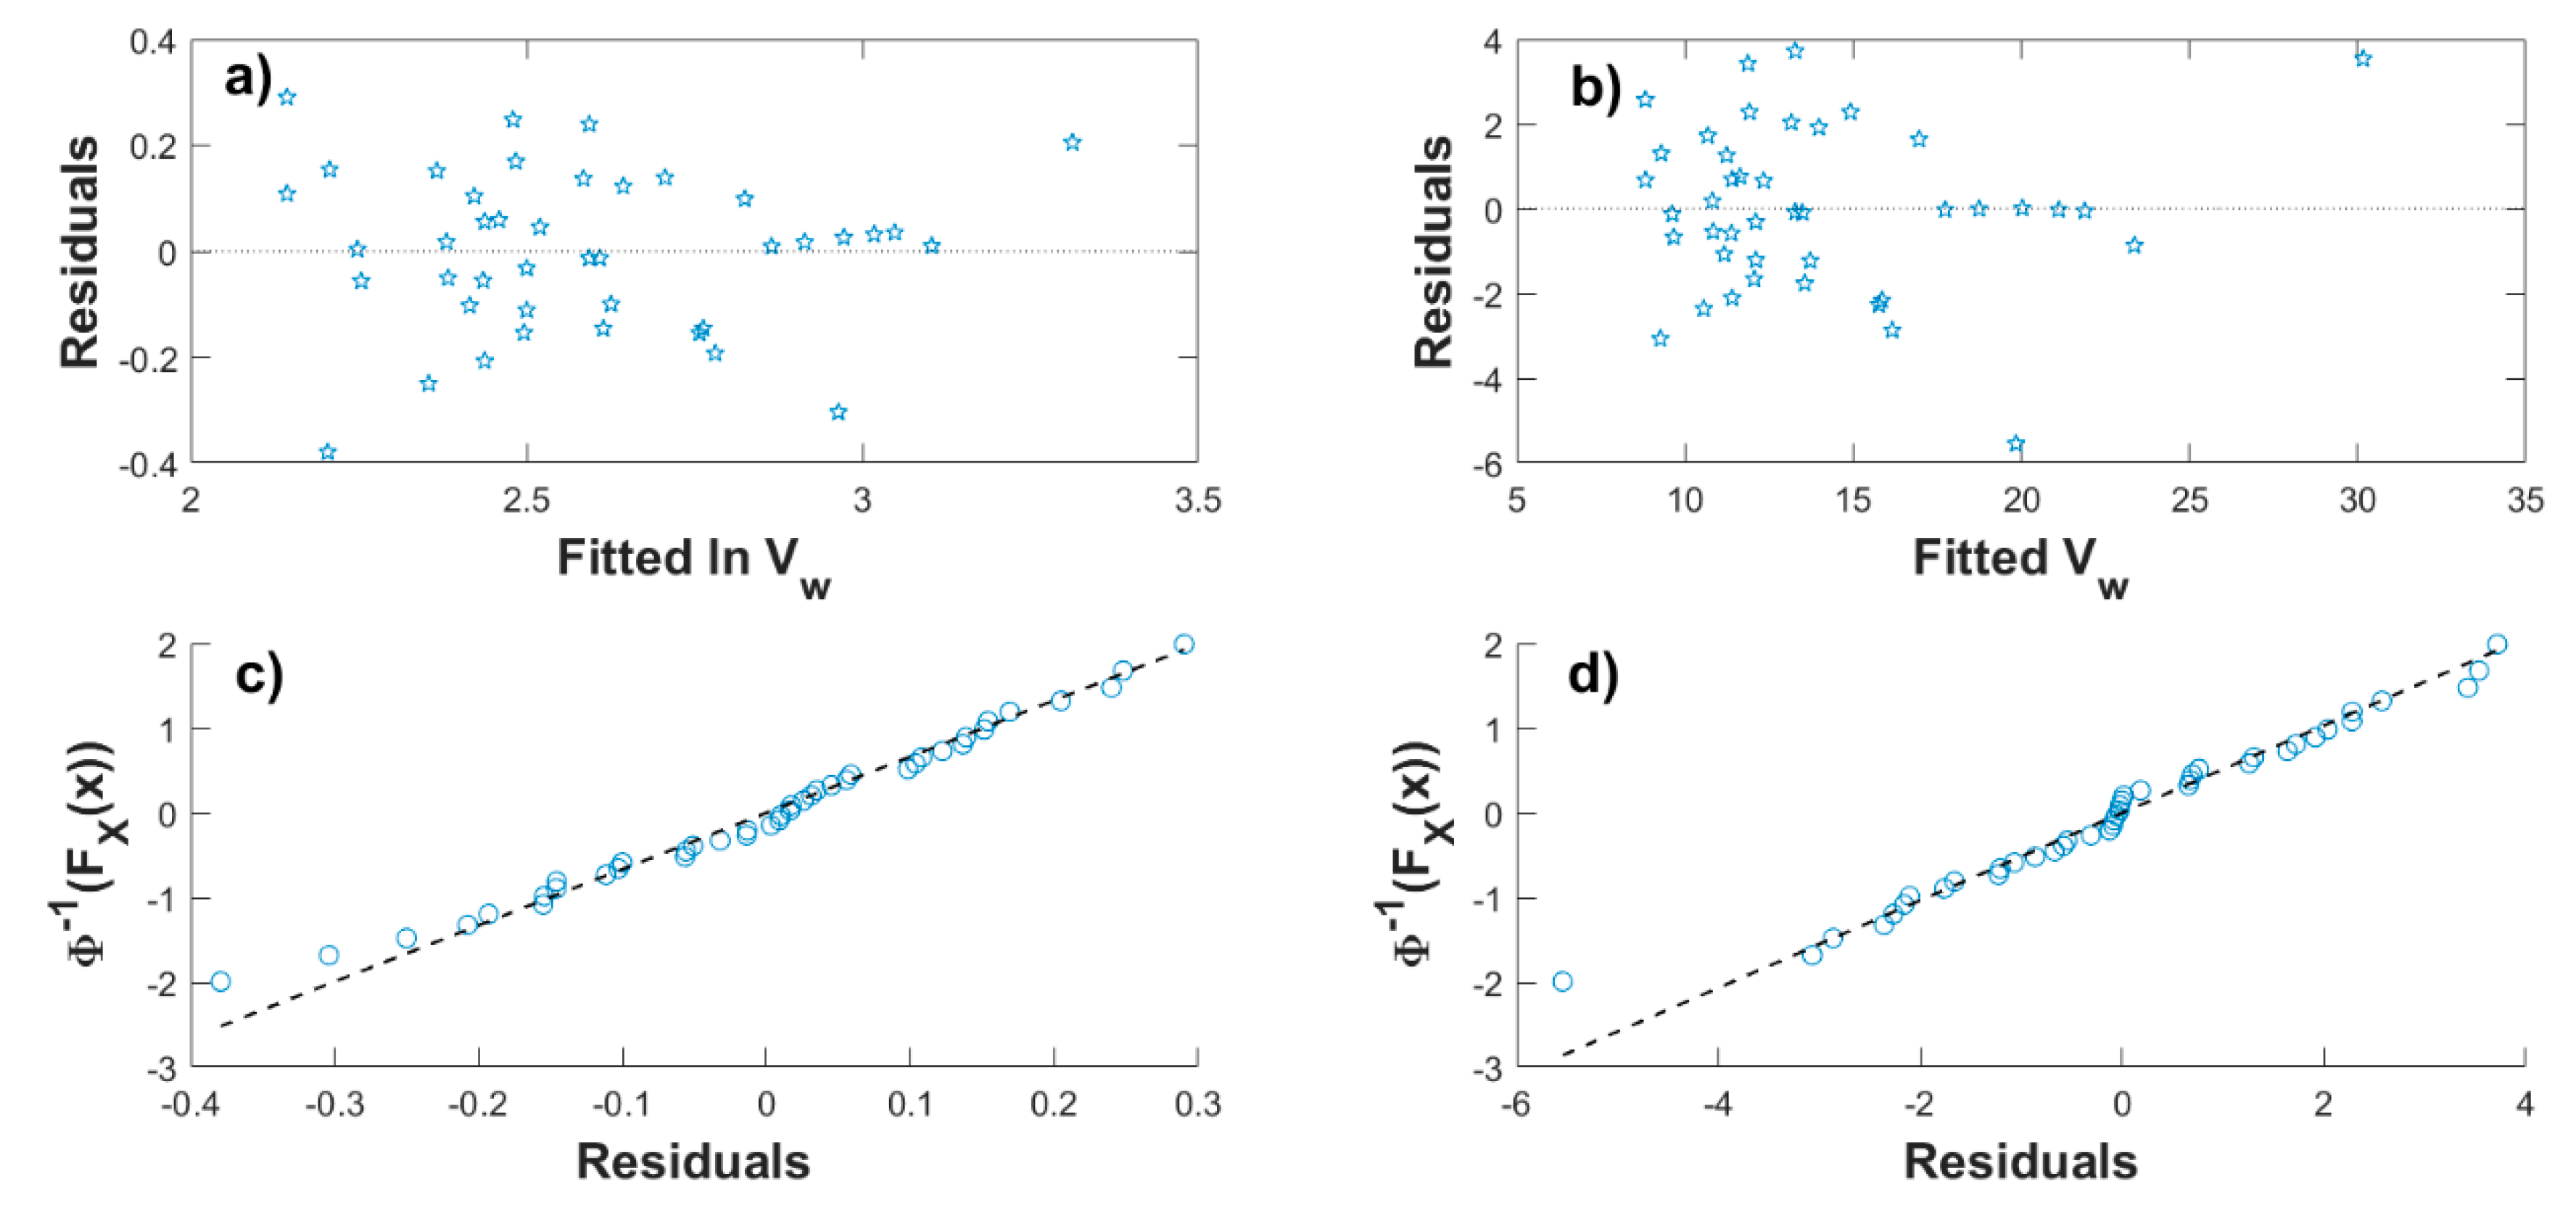
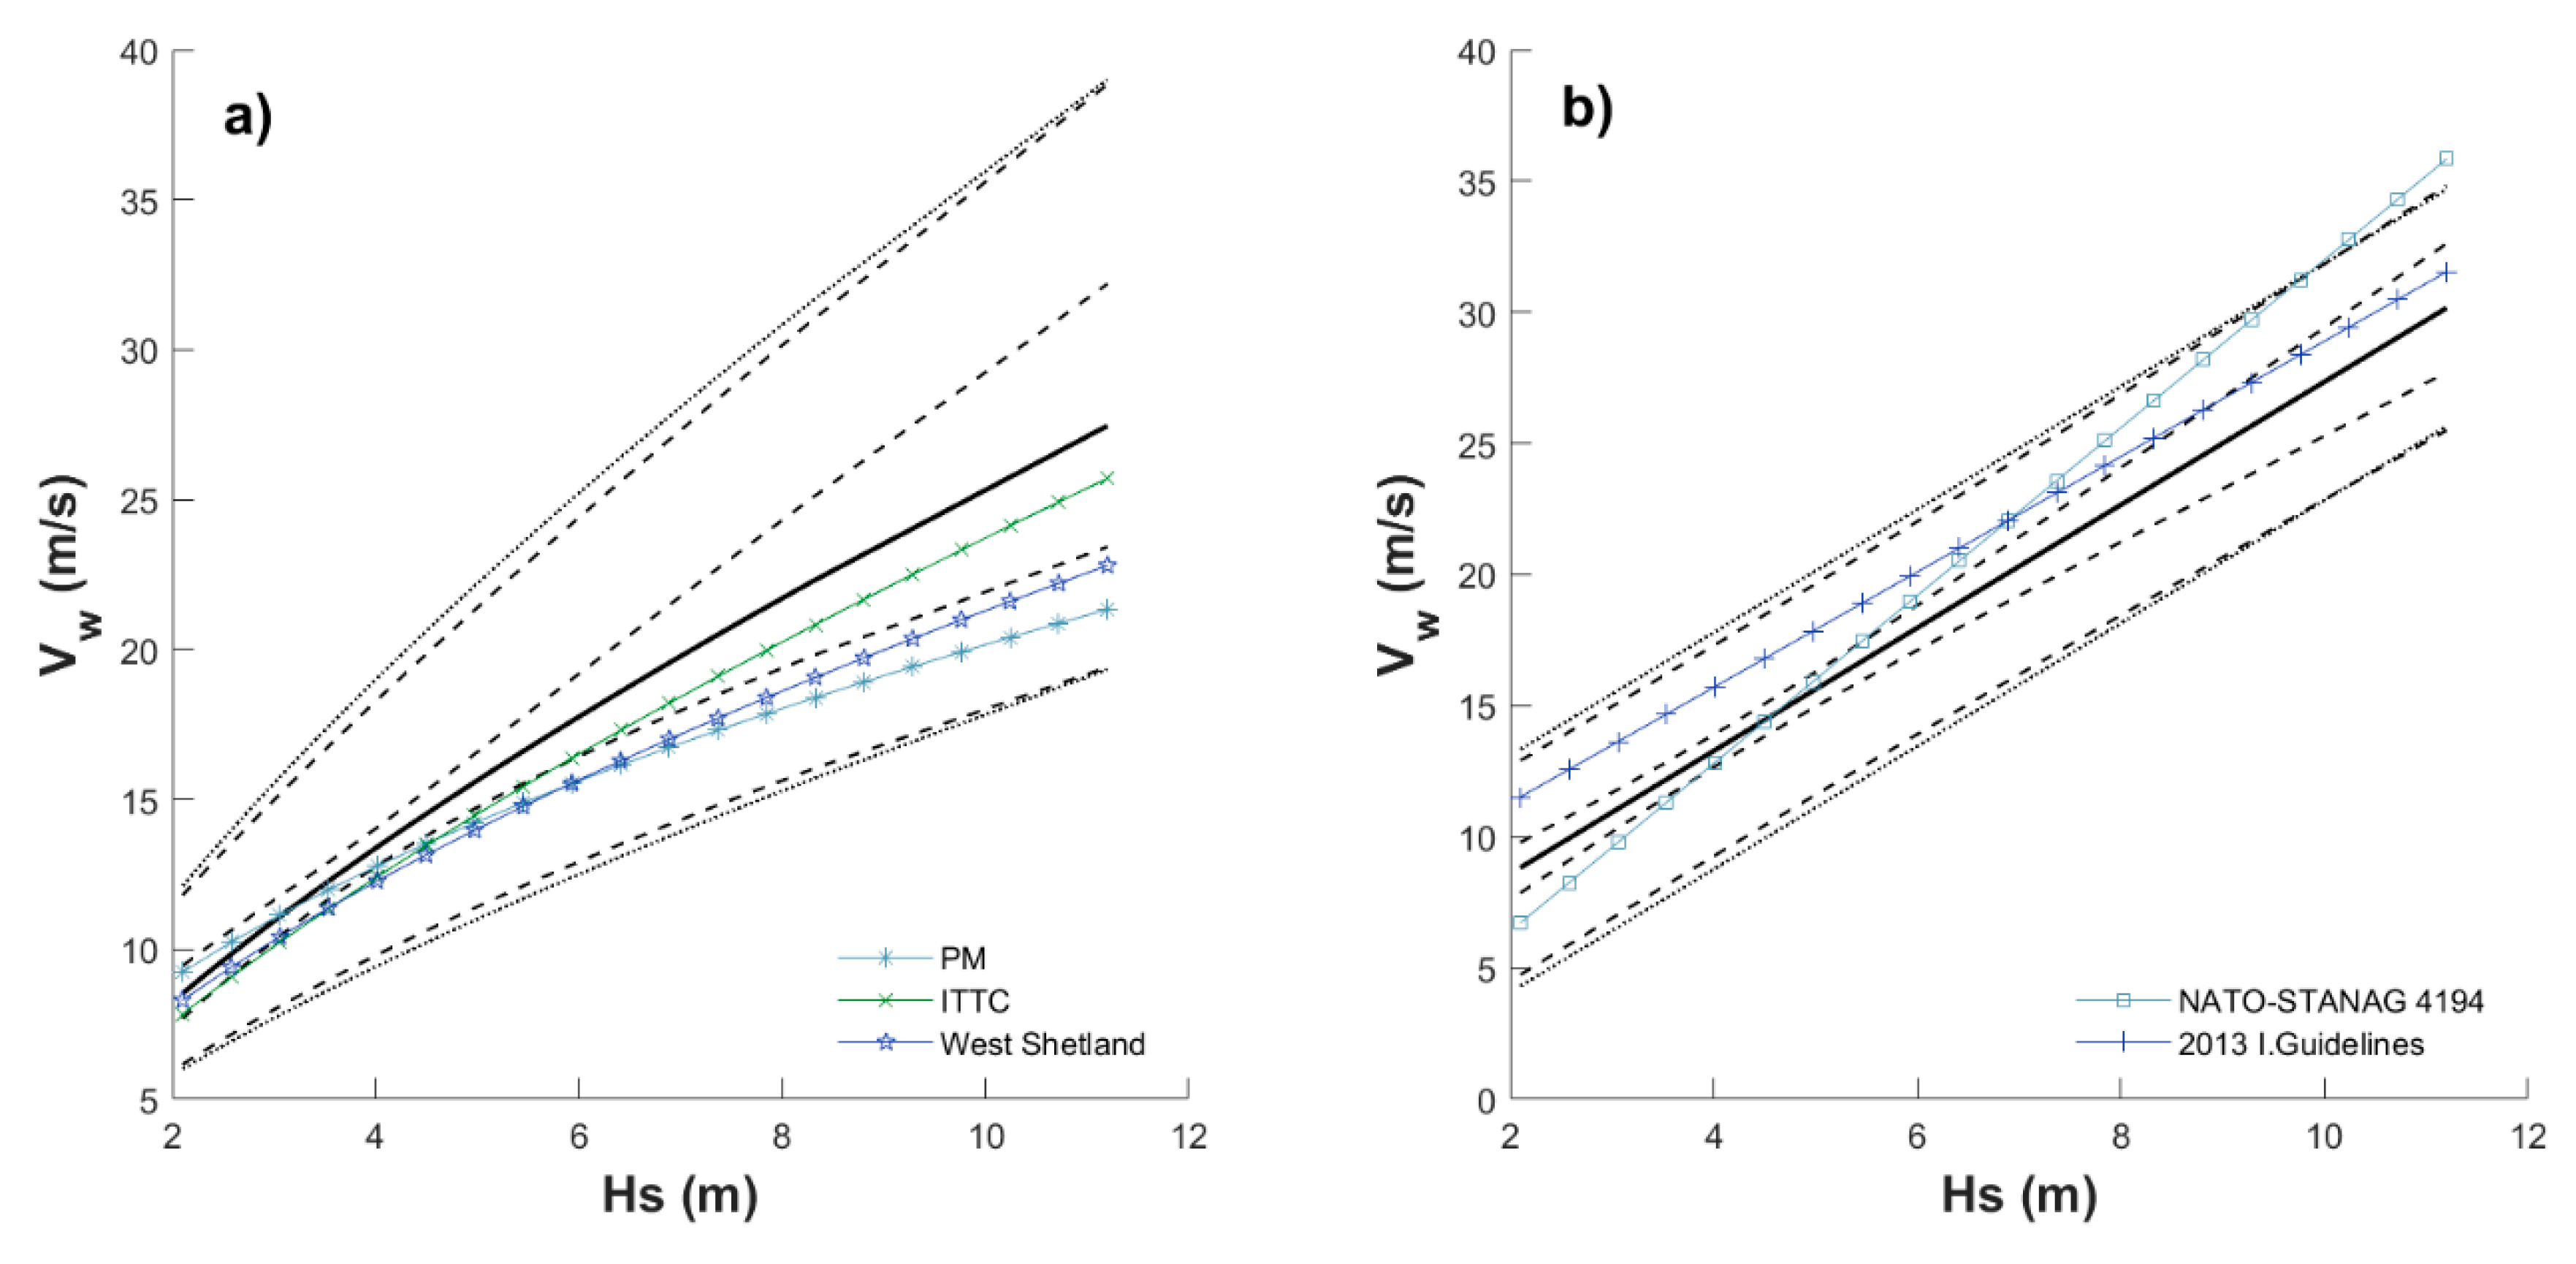


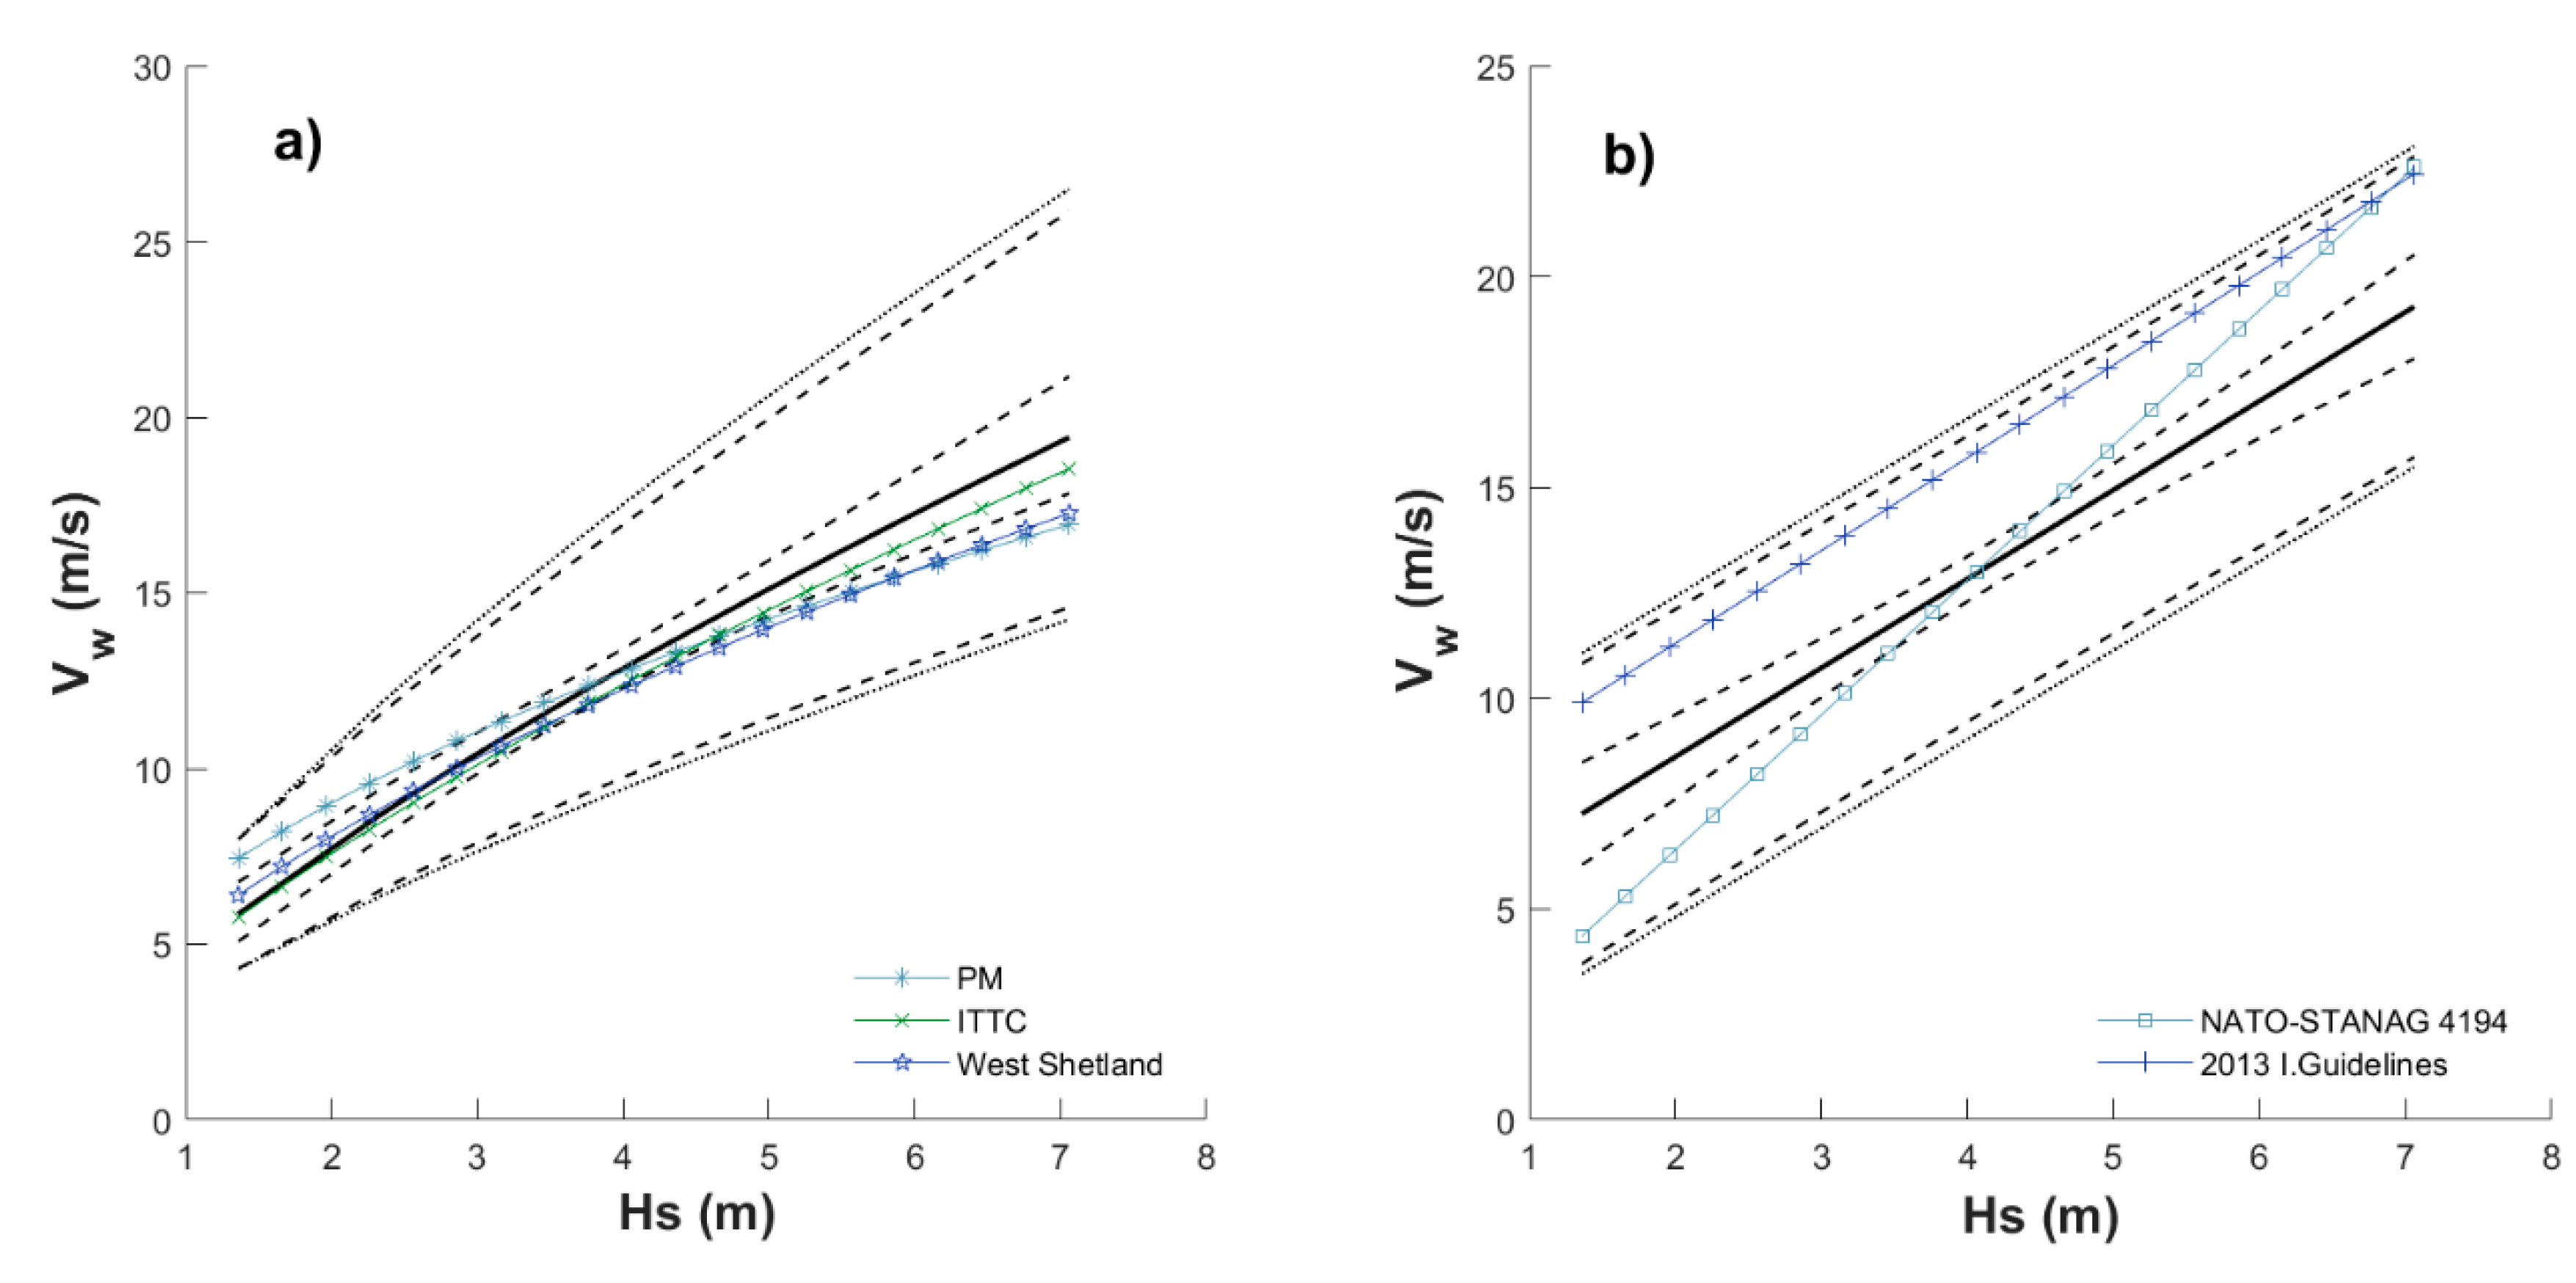
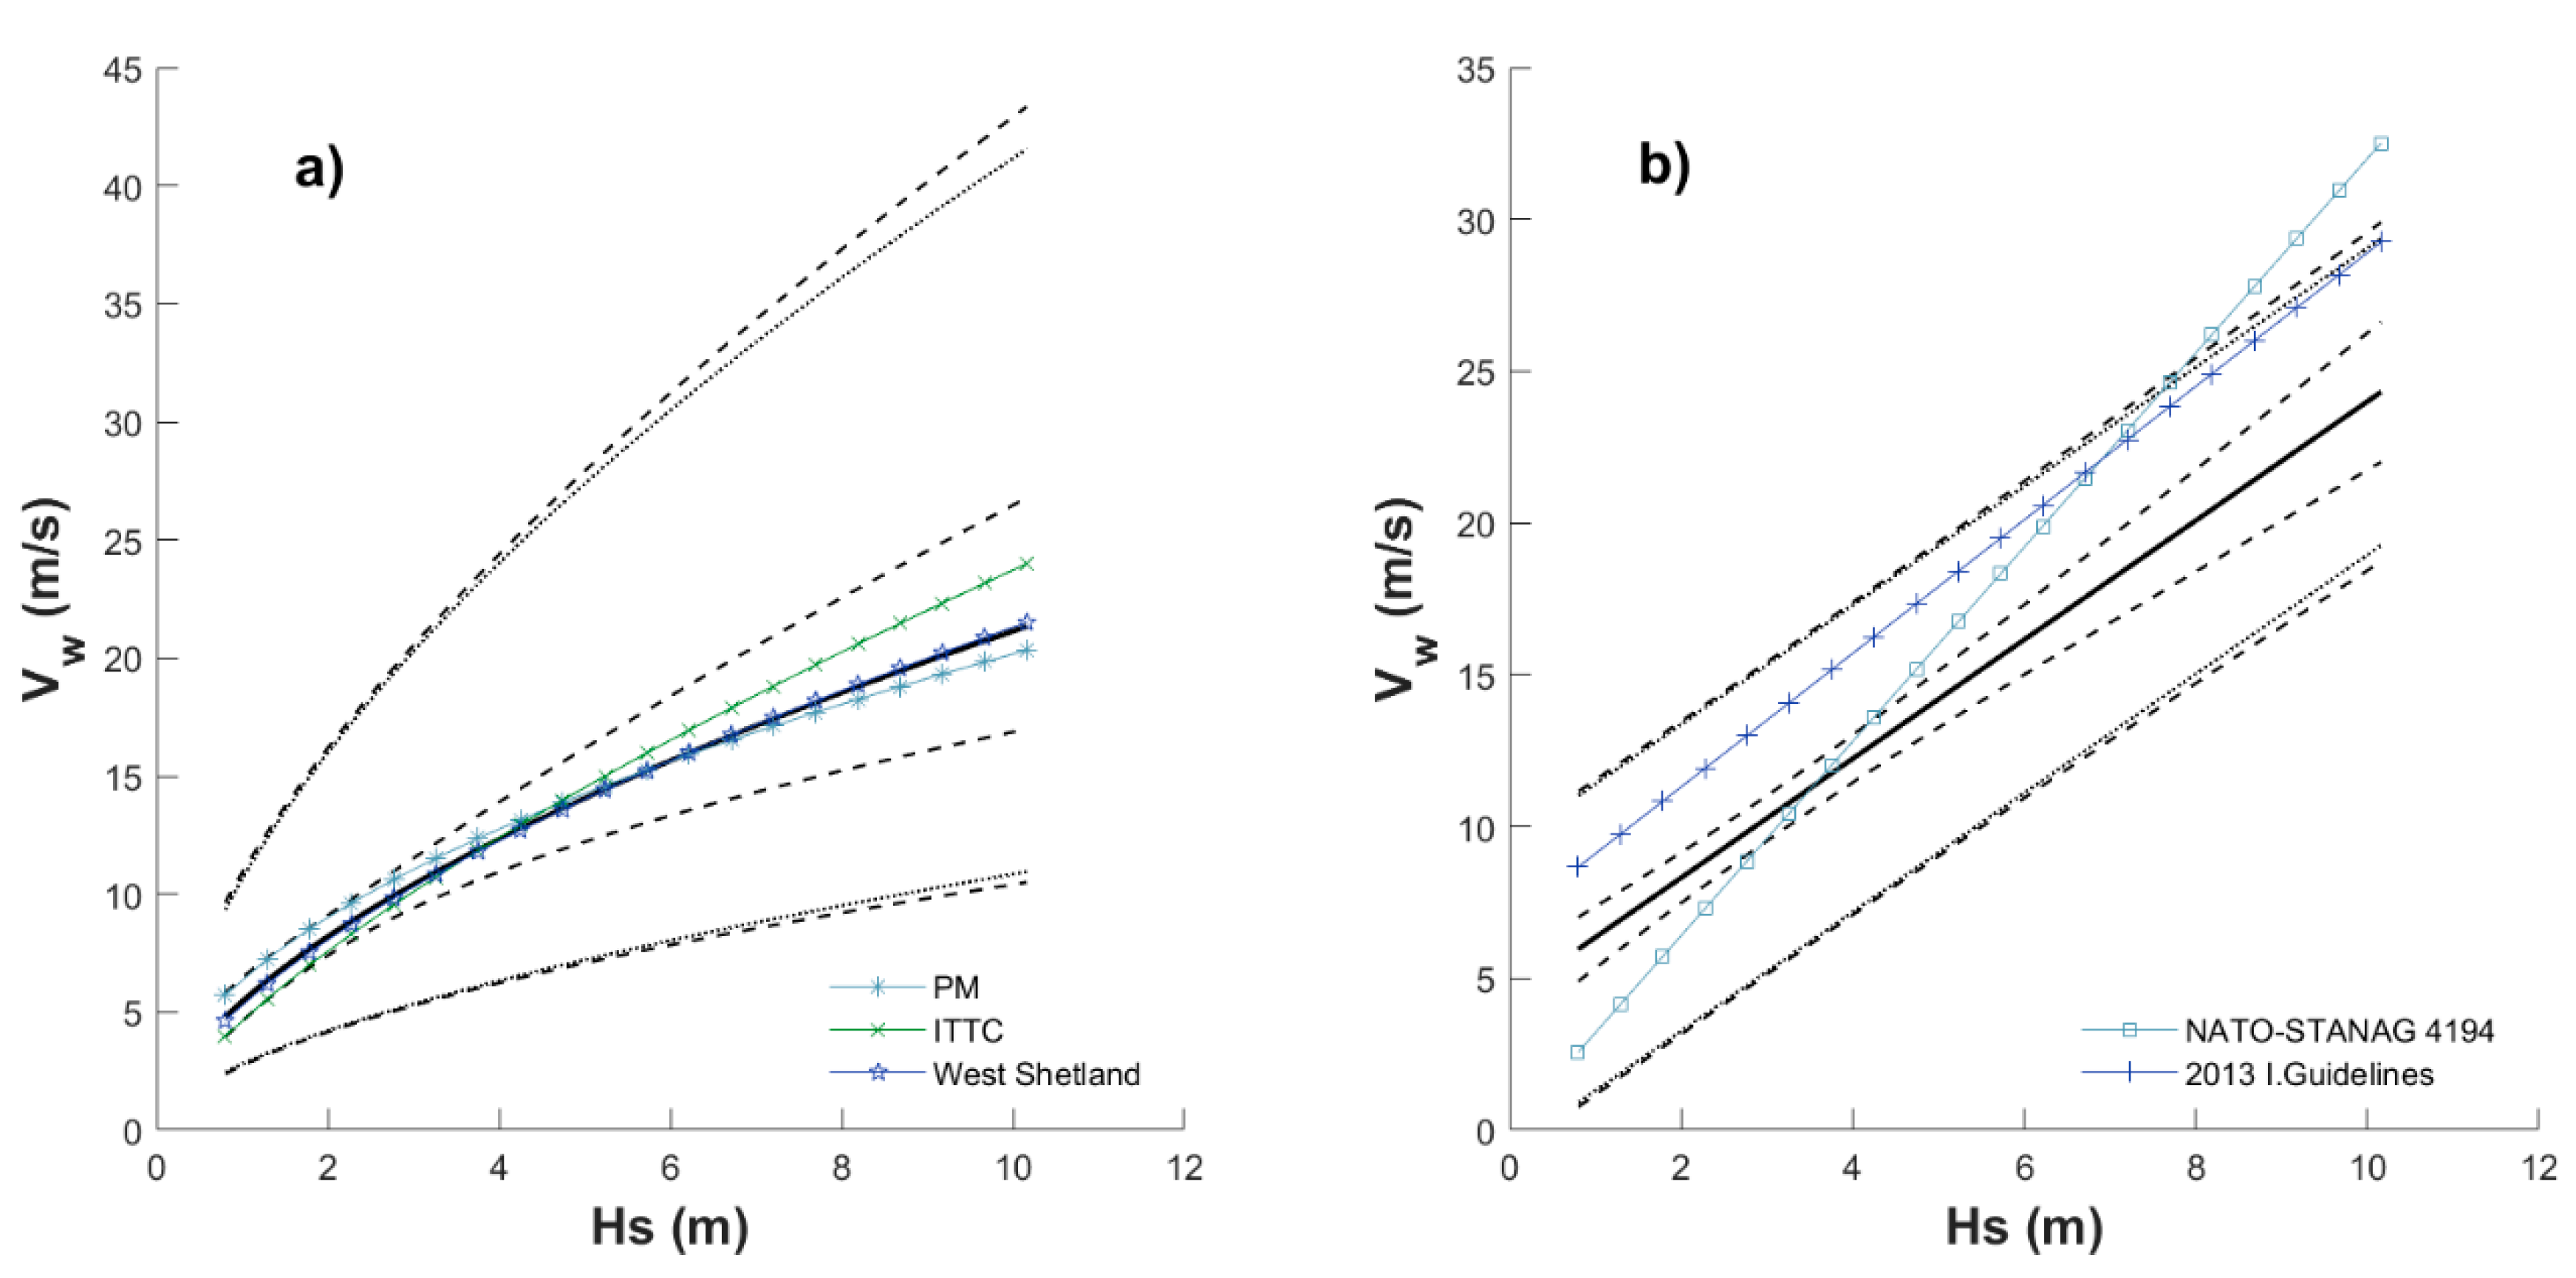
| Month | For Equations (8) and (12) | For Equations (10) and (11) | ||||||
|---|---|---|---|---|---|---|---|---|
| 1b | α | σe | εV(%) | b | α | σe | εV(%) | |
| January | 6.3130 | 0.5050 | 0.1323 | 12.6 | 6.0266 | 1.6565 | 1.8380 | 9.4 |
| February | 4.6311 | 0.7332 | 0.1448 | 0.48 | 4.4597 | 2.0891 | 1.7735 | 0.73 |
| March | 6.2270 | 0.5223 | 0.1692 | 6.92 | 6.5585 | 1.5731 | 2.0592 | 5.87 |
| April | 4.7280 | 0.7117 | 0.1757 | 0.16 | 3.914 | 2.1898 | 1.7927 | 0.44 |
| May | 4.6922 | 0.6616 | 0.4018 | 9.5 | 5.0670 | 1.5891 | 2.7234 | 13.1 |
| June | 6.3611 | 0.4104 | 0.3205 | 16.1 | 5.2639 | 1.7290 | 2.5623 | 4.2 |
| July | 6.0159 | 0.5132 | 0.4005 | 5.7 | 4.3002 | 2.3281 | 2.9474 | 18.5 |
| August | 5.5229 | 0.5648 | 0.3529 | 8.7 | 3.8972 | 2.1768 | 2.6075 | 9.3 |
| September | 4.6209 | 0.7596 | 0.2295 | 5.4 | 2.7402 | 2.6259 | 2.607 | 11.2 |
| October | 5.1243 | 0.6823 | 0.1626 | 4.7 | 3.8933 | 2.3476 | 2.0973 | 0.03 |
| November | 10.3253 | 0.1050 | 0.1742 | 34.0 | 10.5871 | 0.3736 | 1.9726 | 31.7 |
| December | 4.6688 | 0.6860 | 0.1899 | 10.1 | 3.3722 | 2.2109 | 2.2703 | 5.5 |
© 2020 by the authors. Licensee MDPI, Basel, Switzerland. This article is an open access article distributed under the terms and conditions of the Creative Commons Attribution (CC BY) license (http://creativecommons.org/licenses/by/4.0/).
Share and Cite
Calderón-Vega, F.; García-Soto, A.-D.; Mösso, C. Correlation of Concurrent Extreme Metocean Hazards Considering Seasonality. Appl. Sci. 2020, 10, 4794. https://doi.org/10.3390/app10144794
Calderón-Vega F, García-Soto A-D, Mösso C. Correlation of Concurrent Extreme Metocean Hazards Considering Seasonality. Applied Sciences. 2020; 10(14):4794. https://doi.org/10.3390/app10144794
Chicago/Turabian StyleCalderón-Vega, Felícitas, Adrián-David García-Soto, and César Mösso. 2020. "Correlation of Concurrent Extreme Metocean Hazards Considering Seasonality" Applied Sciences 10, no. 14: 4794. https://doi.org/10.3390/app10144794
APA StyleCalderón-Vega, F., García-Soto, A.-D., & Mösso, C. (2020). Correlation of Concurrent Extreme Metocean Hazards Considering Seasonality. Applied Sciences, 10(14), 4794. https://doi.org/10.3390/app10144794


