Article

Choice between Surgery and Conservative Treatment for Patients with Lumbar Spinal Stenosis: Predicting Results through Data Mining Technology

1
Department of Management Center, Sisters of our Lady of China Catholic Medical Foundation, St. Martin De Porres Hospital, Chiayi City 60069, Taiwan
2
Department of Industrial Engineering and Management, National Yunlin University of Science and Technology, Yunlin 640301, Taiwan
3
Department of Orthopedics, Sisters of our Lady of China Catholic Medical Foundation, St. Martin De Porres Hospital, Chiayi City 60069, Taiwan
4
Department of Creative Product Design, Southern Taiwan University of Science and Technology, Tainan 71005, Taiwan
*
Author to whom correspondence should be addressed.
Appl. Sci. 2020, 10(18), 6406; https://doi.org/10.3390/app10186406
Submission received: 20 July 2020 / Revised: 8 September 2020 / Accepted: 8 September 2020 / Published: 14 September 2020

Abstract

:
Currently, patients with lumbar spinal stenosis (LSS) have two treatment options: nonoperative conservative treatment and surgical treatment. Because surgery is invasive, patients often prefer conservative treatment as their first choice to avoid risks from surgery. However, the effectiveness of nonoperative conservative treatment for patients with LSS may be lower than expected because of individual differences. Rules to determine whether patients with LSS should undergo surgical treatment merits exploration. In addition, without a decision-making system to assist patients undergoing conservative treatment to decide whether to undergo surgical treatment, medical professionals may encounter difficulty in providing the best treatment advice. This study collected medical record data and magnetic resonance imaging diagnostic data from patients with LSS, analyzed and consolidated the data through data mining techniques, identified crucial factors and rules affecting the final outcome the patients with LSS who opted for conservative treatment and ultimately underwent surgical treatment, and, finally, established an effective prediction model. This study applied logistic regression (LGR) and decision tree algorithms to extract the crucial features and combined them with back propagation neural networks (BPNN) and support vector machines (SVM) to establish the prediction model. The crucial features obtained are as follows: reduction of the intervertebral disc height, age, blood pressure difference, leg pain, gender, etc. Among the models predicting whether patients with LSS ultimately underwent surgical treatment, the model combining LGR and the decision tree for feature selection with a BPNN has a testing accuracy rate of 94.87%, sensitivity of 0.9, specificity of 1, and area under the receiver operating characteristic curve of 0.952. Adopting these data mining techniques to predict whether patients with LSS who opted for conservative treatment ultimately underwent surgical treatment may assist medical professionals in reaching a treatment decision and provide clearer treatment. This may effectively mitigate disease progression, aid the goals of precision medicine, and ultimately enhance the quality of health care.

1. Introduction

Lumber spinal stenosis (LSS), the narrowing of the spinal canal with neural compression, is the most common cause for spinal surgery in older adults in the U.S., afflicting over 200,000 individuals from 1988 to 2011 [1,2]. LSS is commonly considered as the cause of low back pain due to age-related degenerative changes in older adults and often leads to lumbar surgery [2,3,4,5]. In Taiwan, treatment costs for LSS have been estimated by the National Health Insurance Administration of the Ministry of Health and Welfare to have reached USD 460 million for 2.0 million patients in the year 2015.
Classic symptoms of LSS include lower back pain and a combination of lower extremity symptoms, lumbago, neurogenic claudication, hypoesthesia, paresthesia of the legs, ataxia, weakness, and a feeling of heavy legs [2,5,6,7]; neurogenic claudication, defined by Dejerine [8], is also frequently associated with LSS. Since symptoms of LSS may range from asymptomatic to severe disability, clinical diagnosis is based on a combination of symptoms, medical history, physical examination, and imaging findings [3]. Of the various imaging modalities available, magnetic resonance imaging (MRI) has been considered ideally suited to delineate the presence, extent, and complications of degenerative spinal diseases [9]; therefore, it has been widely used to evaluate lumbar foraminal stenosis caused by events such as decreased height of an intervertebral disc, facet joint osteoarthritic changes, inferior vertebra subluxation, and the protrusion of the annulus fibrosus [5,10]. Imaging studies allow for anatomical classifications as central, lateral, or foraminal stenosis, and the L4–5 spinal discs are most frequently affected in LSS, followed by L3–4, L5–S1, and L1–2 [11].
Treatment options for LSS are categorized as conservative and surgical; conservative therapies include pain medication, epidural injections, rehabilitation such as manual therapy with a hands-on physical therapist, aerobic training, and exercise intervention to treat patients with mild to moderate symptoms [7,11], and surgical intervention is considered if LSS symptoms do not improve with conservative therapies [12]. Surgeries aim to decompress the entrapped neural element or provide decompression through lumber fusion; for example, a split–spinous process for laminotomies and discectomies to correct LSS can minimize muscular trauma, maintain spinal stability, and easily re-enable movement, shorten the duration of hospital stays, reduce postoperative back pain, and provide satisfactory neurological and functional outcomes [13].
When comparing conservative and surgical treatments, studies have reported conservative treatments having a success rate of 15–70% [4,14,15]; on the other hand, while surgeries can alleviate pain, disability, or claudication, the rates of major complications are high, as are costs—Truven MarketScan commercial data from 2013 estimated the average cost of each surgical decompression procedure to be approximately USD 687, and USD 2255 in inpatient services for lumbar fusions [16]. A review of various conservative versus surgical treatment comparison studies published up to February 2015 found that surgery was associated with high complication and reoperation rates, whereas on the other hand, no side effects were reported for any of the conservative treatment options [17]. Even minimally invasive surgery for LSS did not significantly reduce operating time, length of hospital stay, or reoperation rates, nor did it offer better pain relief in outcome scores such as the visual analog scale (VAS), the 36-Item Short-Form Survey, and Japanese Orthopaedic Association scores [12]. However, a ten-year follow-up study of one hundred LSS patients who underwent either conservative therapy or surgical treatment found many with the former to have unsatisfactory outcomes that later became favorable after a subsequent switch to surgery, and there was no evidence of surgical treatment having worse outcomes in LSS patients with moderate to severe symptoms [18]. From these examples of conflicting studies, it is evident that, with a wide variation in clinical conditions, LSS treatment studies are controversial and lack a consensus; however, most researchers agree that inappropriate interventions should be avoided [5,18]. Therefore, it is essential to identify factors predicting the choice of conservative therapy for LSS to improve the efficiency of treatments, improve patient safety and outcomes, and reduce unnecessary spinal surgery. In light of past studies applying algorithms to predict LSS treatment choice (conservative vs. surgery), this study intends to utilize medical records and MRI imaging data of LSS patients via data mining technology to determine key factors and treatment results from conservative treatment to establish a model for predicting conservative treatment.

2. Previous Studies on LSS Prediction Models

Prediction models are developed through medical informatics for assessment, diagnosis, and treatment via methods such as logistic regression (LGR), a common and traditional predictive tool, and artificial neural networks, a computational model based on the functioning of biological neural networks that model complex relationships between inputs and outputs.
For example, Azimi [19] compared the prediction ability by LGR vs. artificial neural network the satisfaction level of 168 LSS patients at two years post-surgery, as well as the adoption of surgical or conservative treatment in 346 LSS patients—in both cases, neural networks were found to have a higher accuracy rate than LGR.
A second example in prediction models is demonstrated by van Dongen et al. [20], in which 47 potential patient-reported predictive factors from the hospital records of 4,987 patients with chronic low back pain were used to predict referrals for spinal surgery via LGR—the results showed that being female, having previous back surgery, high-intensity leg pain, somatization, and positive treatment expectations increased the likelihood of being referred for spinal surgery, whereas obesity, comorbidities, pain in the thoracic spine, increased walking distance, and the consultation location reduced the likelihood.
A third example of prediction models can be seen in Spratt et al. [21], using imaging and physical examination data from 36 LSS patients who underwent surgery, via chi-square automatic interaction detection decision tree, to predict the success of the surgery as defined by improvement in three out of four of: visual analog pain scale, lumbar functioning, limping and leg pain—the accuracy rate of said decision tree reached 90.1%.
In the above studies of subjects with LSS or low back pain, the outcome predicted by the constructed models included satisfaction level, opting for surgery vs. conservative treatment, referral for surgery, as well as success for surgery. In a similar vein, this study aims to explore the predictive factors in LSS patients who initially opted for conservative treatment who subsequently opted for surgical treatment using imaging data and medical records.

3. Methods

3.1. Data

This study was approved by the review board of the St. Martin De Porres Hospital (Approved No.17B-003). For data collection, patients with LSS who received treatment at the orthopedics and rehabilitation medicine department of the St. Martin De Porres Hospital from 2014 to 2016 were recruited as participants. In this research, we applied the reduced height of an intervertebral disk of the lumbar spine through MRI as an evaluated factor. The digital medical records and MRI image data of 103 patients were collected and analyzed. After compiling data from the available sources (i.e., physicians’ opinions, nursing experts’ opinions, and relevant studies, 18 factors related to LSS were chosen as the input factors. The only output variable was whether the patient ultimately received surgical treatment [22]. Details are provided in Table 1.

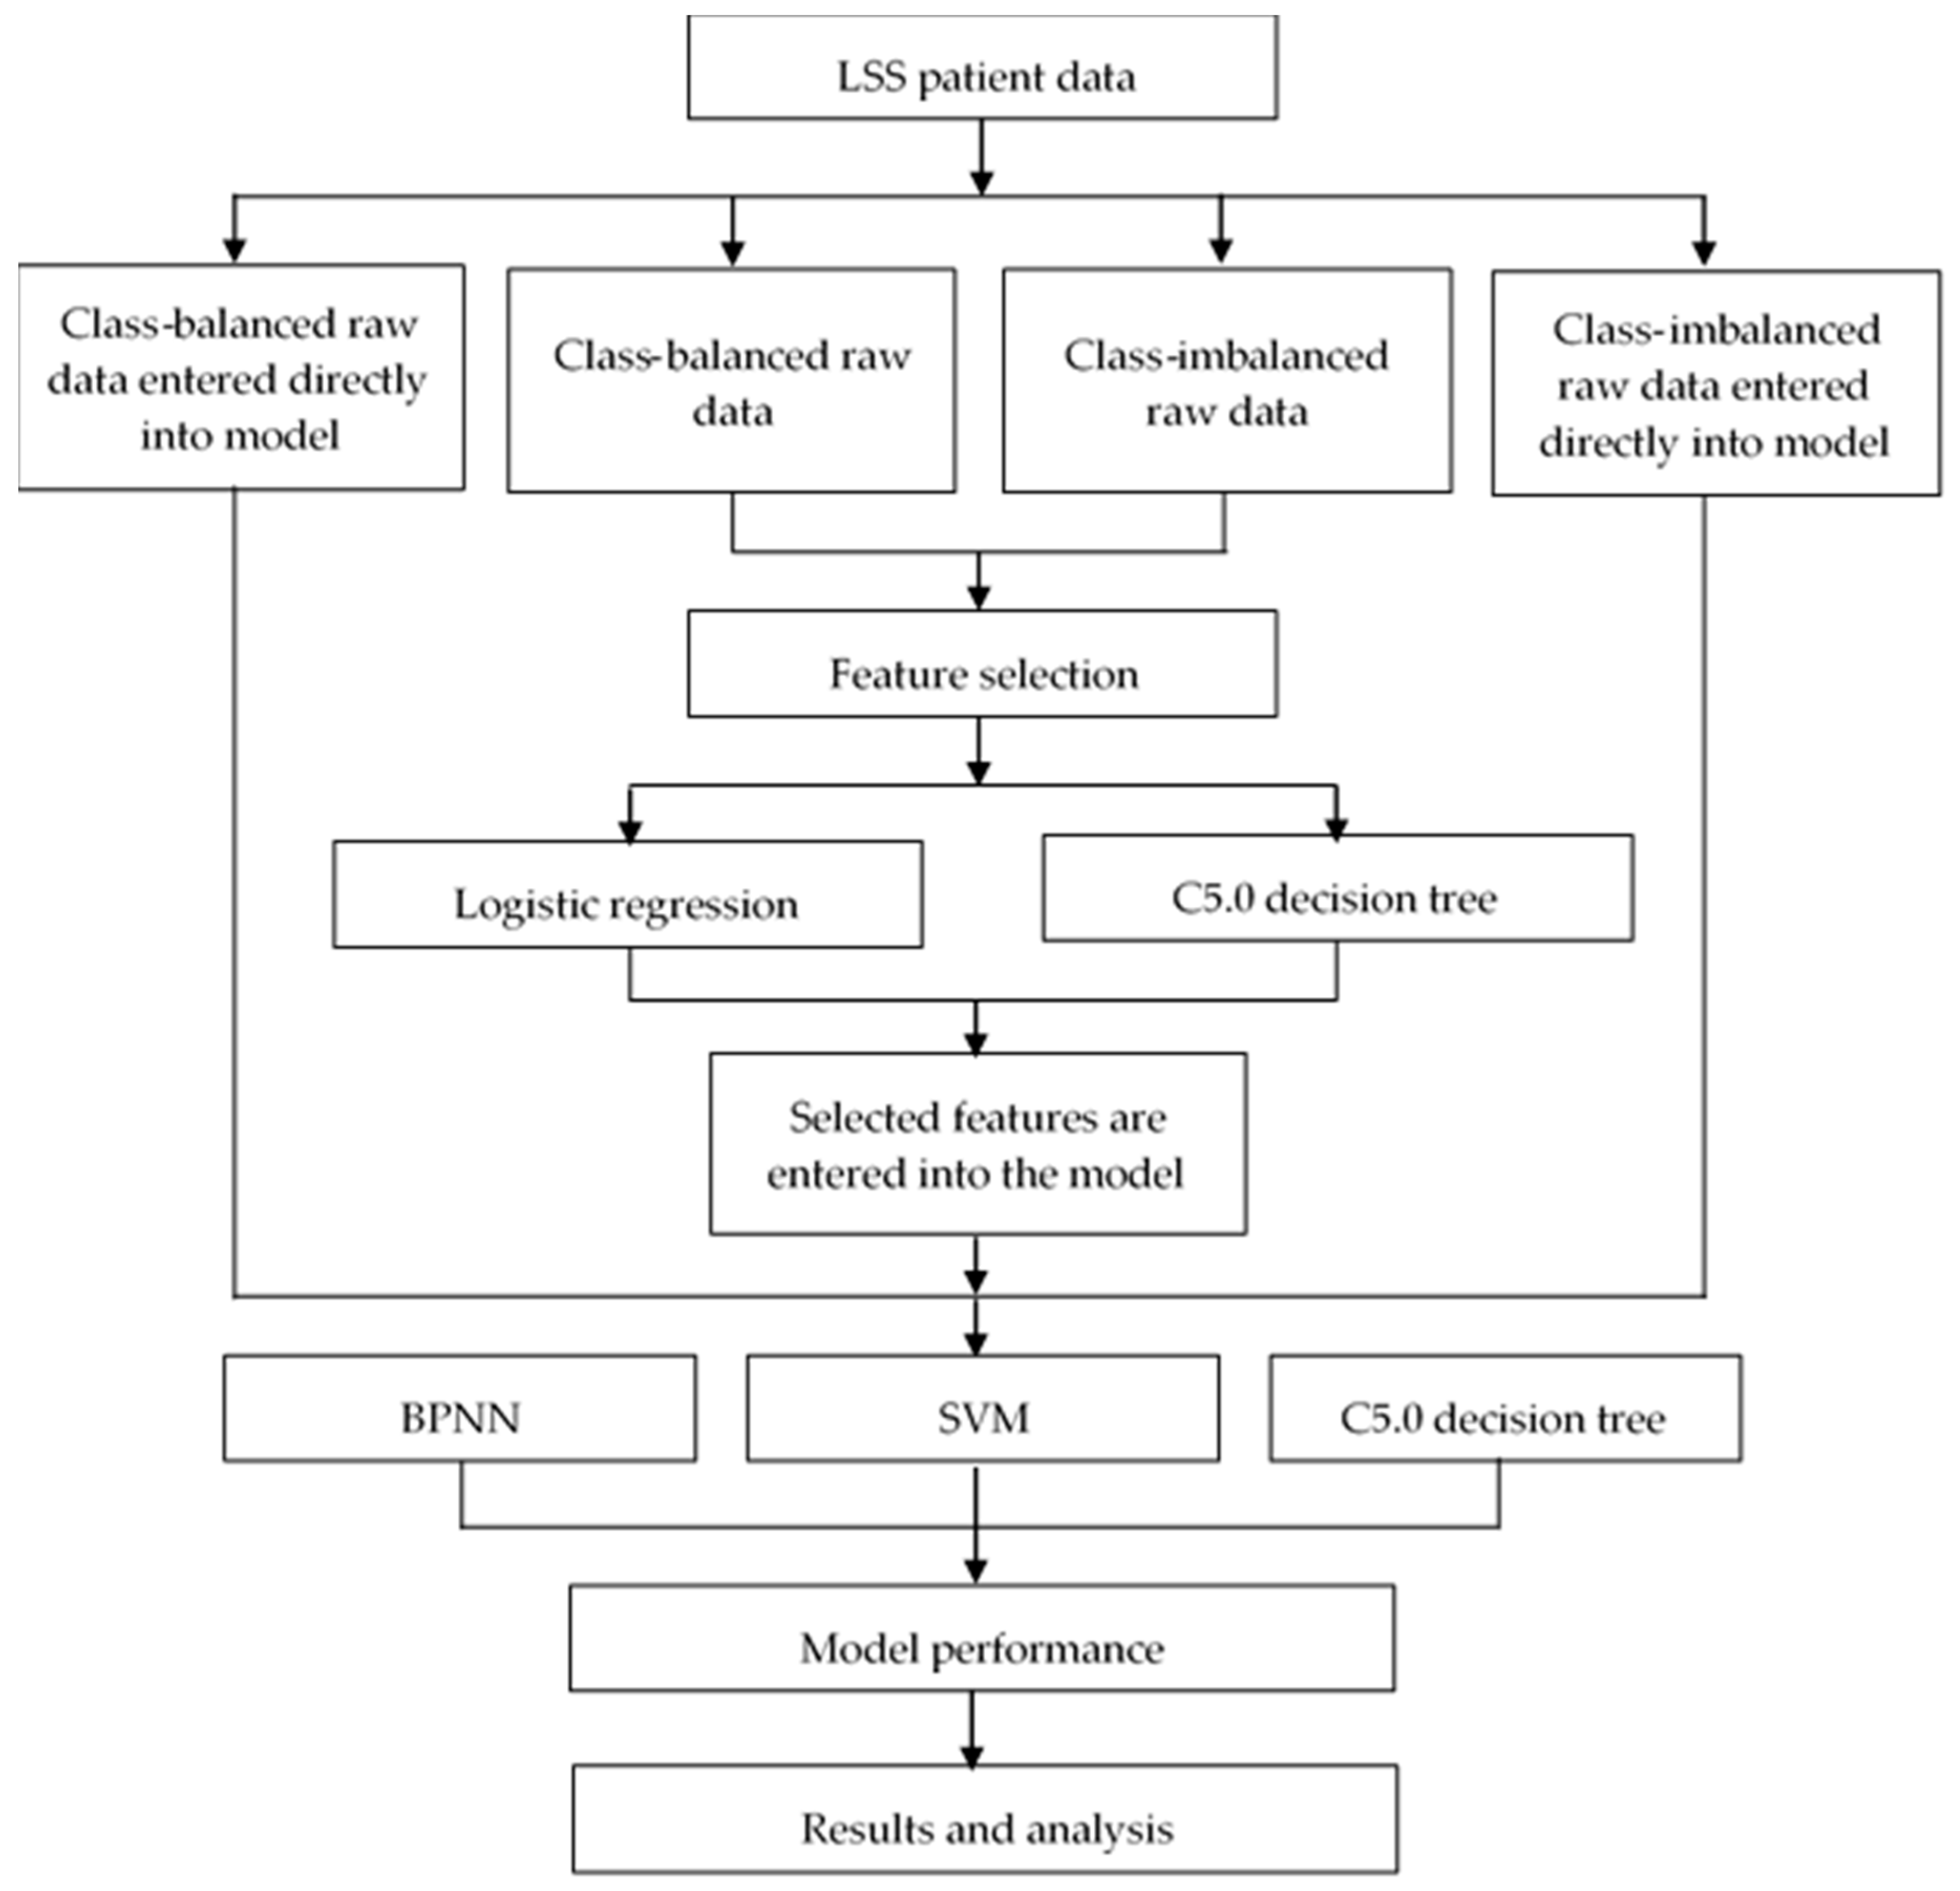
3.2. Application of Data Preprocessing Techniques

Pre-processing of data in this study mainly involved data merging, data cleaning, and data conversion: to enable subsequent exploration and modeling, data from medical records and MRI imaging were merged together and the merged dataset was re-checked and cleaned for errors such as inconsistencies, repetitions, redundancies, and outliers. Then, the cleaned dataset was normalized with a sample of six patients, to ensure distribution in a specified range as well as to minimize effects from scale differences, using the following formula [23]:
X = X X A m i n X A m a x X A m i n ( X A , n e w m a x X A , n e w m i n ) + X A , n e w m i n
where A is the attribute data,
  • X A m i n , X A m a x are the minimum and maximum value of A, respectively,
  • X is the new value of each entry in data,
  • X is the old value of each entry in data,
  • X A , n e w m a x , X A , n e w m i n is the max and min value of the range (i.e., boundary value of range required), respectively.
On the basis of the two categories emerging from the data—surgical treatments performed (n = 81) and surgical treatments not performed (n = 22)—the researchers developed a synthetic minority oversampling technique (SMOTE) by using R. On the basis of the characteristics of a minority class, SMOTE manually synthesizes new and nonrepetitive minority class samples by using other minority class neighbors surrounding the original minority class. This helps ensure the balance between data category sample sizes. Originally, the number of unprocessed data listings was 103 and the distribution ratio of the two categories was 0.78:0.21. After categorical data were balanced, the number of data listings was 132, and the distribution ratio of the two categories was 0.5:0.5.

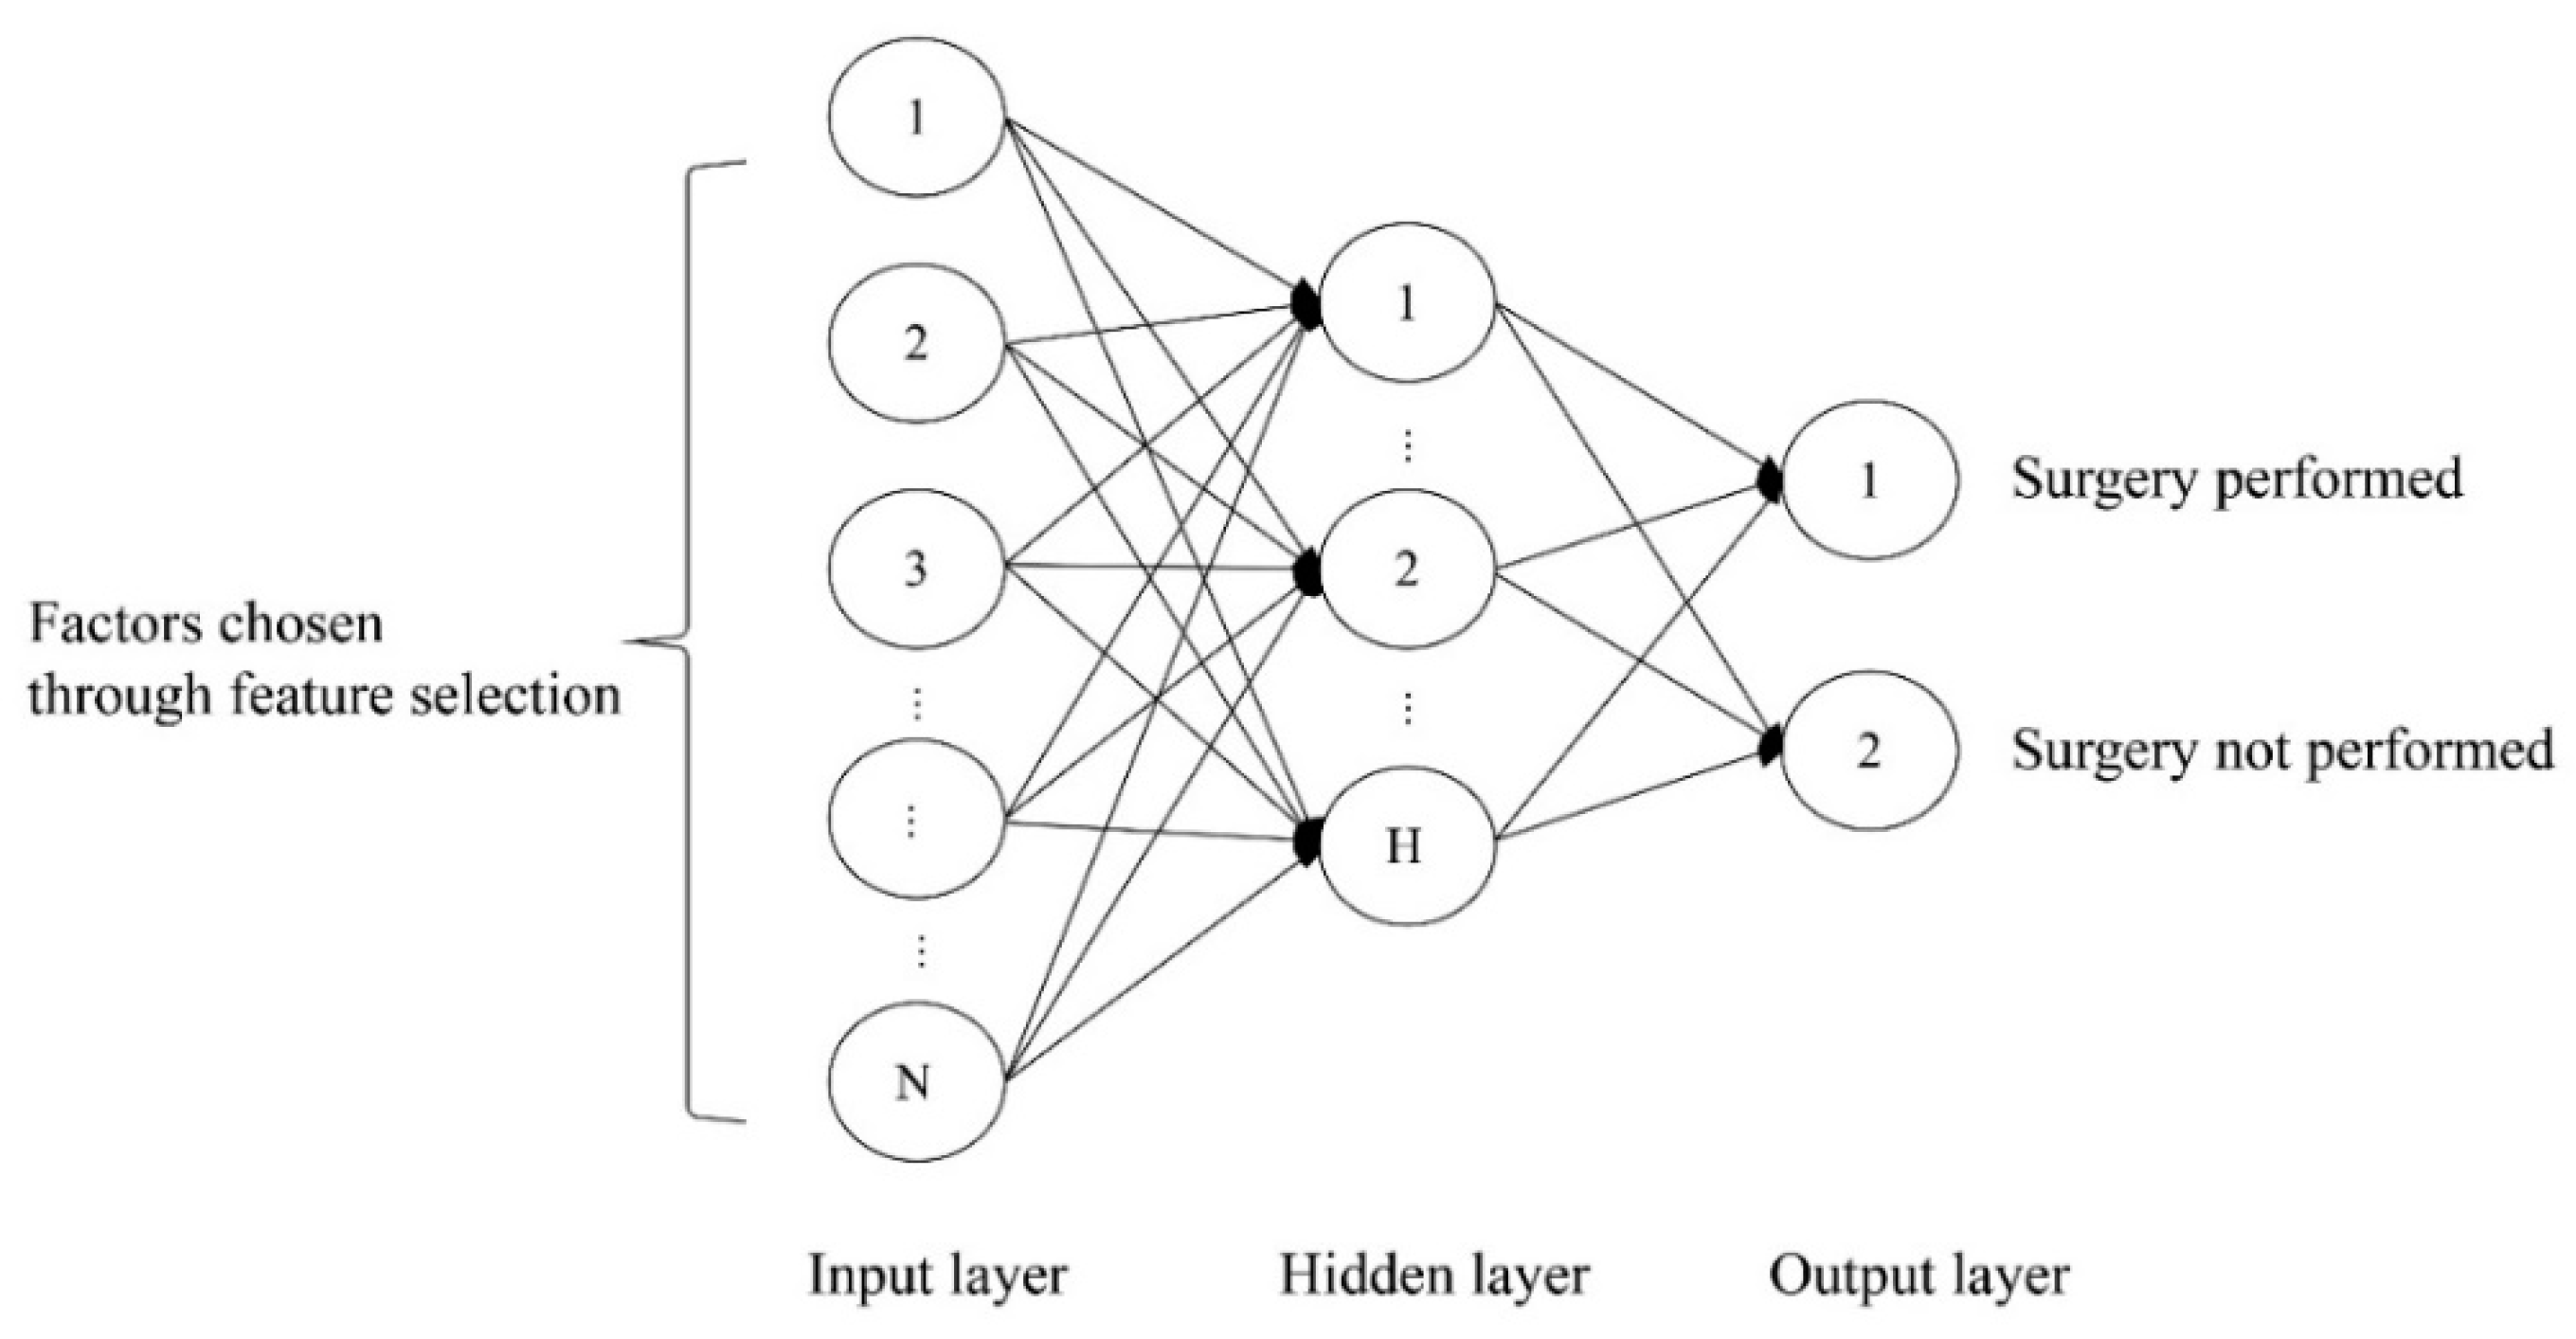
3.3. Supervised Learning Techniques

Four well-known supervised learning techniques were used, including LGR, decision tree (DT), a back-propagation neural network (BPNN), and a support vector machine (SVM). The steps involved in building the models are shown in Figure 1. Both the 103 class-imbalanced data and the 132 class-balanced data were divided into 70% training set and 30% testing set.
Being a type of multilayer feedforward networks, BPNN is able to deal with non-linear classification, and is the most commonly used supervised learning network [24]. Many studies have demonstrated the application of this network in building prediction models for medical conditions and found the accuracy rates of such models to be satisfactory. The C5.0 DT enables the prediction of future data based on patterns extracted from a series of verification processes using the training data set; application of C5.0 DT in the field of medicine is widely popular for the use of exploring important factors to construct predictive models. SVM is a supervised learning classifier, and its use of RBF kernel has been shown to have better performance than other models in medicine-related studies [25].
This study used SPSS version 22 to conduct various statistical operations, including performing LGR, selecting input variable features by using raw data with imbalanced categories, using medical record data with balanced categories, and using MRI diagnostic data. Subsequently, the researchers screened through variables with significant influence and determined whether significant differences occurred in the accuracy rate of models constructed before and after screening.
In this study, a C5.0 DT was used to select features for input variables, delete input variables with a lower influence on target variables, select input variables with substantial influence, and compare whether significant differences exist in terms of the accuracy of models constructed before and after screening.
This study applied the aforementioned supervised learning techniques to construct a prediction model by back-propagating the factors selected through feature selection procedures as the input variables and dividing them into training and testing groups. For hidden layer configuration, two levels of hidden layers are established using the most commonly used sigmoid function. For learning efficiency, the best parameter setting for the model is identified through trial and error. For the output layer, the decision of whether to perform surgical treatment is determined using two output neurons. For the learning parameters, trial and error is used to identify the best parameter setting. The termination conditions are set for when the network training reached a convergent and completely stable state and when learning efficiency, maximum learning iteration number, and mean square error are present. The BPNN model is illustrated in Figure 2.
In this study, the researchers input factors selected through feature selection into C5.0 DT as the root nodes and generated child nodes through splitting the data set performed from the maximum. This step was conducted repeatedly until the data set could no longer be split. Then, the rules affecting the final outcome of whether patients who opted for conservative treatment ultimately underwent surgical treatment were formed from the key factors.

3.4. Feature Selection

In this study, the researchers used raw categorical data to balance the data and subsequently performed feature selection on the data sets by using LGR, C5.0 DT, and LGR+C5.0 DT. Before conducting feature selection procedures, collinearity diagnostic tests were conducted for the 18 involved features. The results indicated that all variance inflation factor values were smaller than 5 and ranged from 1 to 3. These results confirmed that no collinearity problem occurred between the 18 features.

3.5. Experimental Setup and Performance Measure

In this study, a computer with an Intel Core i5-2410M central processing unit with a 2.30-GHz processor, 8 GB of internal memory, and a Windows 10 64-bit operating system was used to execute the required software. Three types of software were used for programming: clementine12, R, and MATLAB R2013a. After the data categories were balanced, the following analyses were conducted to select features from the data sets: (1) SPSS version 22 was used to conduct LGR analysis; (2) clementine12 was used to construct a C5.0 DT, and (3) LGR+C5.0 DT. Subsequently, the selected key factors were imported into a BPNN, C5.0 DT, and SVM for subsequent predictions. In addition, we adjusted the parameter values of each classifier to obtain the optimized results. Parameter settings of the models are shown in Table 2:
Finally, in order to evaluate model performance, the accuracy, sensitivity, and specificity of the confusion matrix were calculated based on the receiver operating characteristic (ROC) curve, which was created by plotting the true positive rate (TPR) against the false positive rate (FPR) at various threshold settings, and the area under the ROC curve (AUC) provides an aggregate measure of performance across all possible classification thresholds and is often interpreted as the probability that the model ranks a random positive example more highly than a random negative example. When AUC = 0.5, then the model is not able to distinguish between Positive and Negative class points, meaning either the model is predicting random class or constant class for all the data points. When 0.5 < AUC < 1, there is a high chance that the model will be able to distinguish the positive class values from the negative class values. Therefore, the higher the AUC value for a model, the better its ability to distinguish between positive and negative classes. Hosmer and Lemeshow further classified the performance capability of the AUC models into levels: a value of 0.9–1 indicates excellent model performance, a value of 0.8–0.9 indicates good model performance, and a value of 0.8–0.7 indicates fair model performance [26].

4. Measurements and Experimental Results

4.1. Feature Selection Results

From the balanced data, the three feature extraction methods each retained the following number of variables: LGR retained 9 variables; C5.0 DT retained 8 variables; and LGR + C5.0 DT retained 11 variables. The variables retained for the three feature extraction methods are listed in Table 3.

4.2. Evaluation of Model Performance

The researchers constructed 12 predictive models. The sensitivity, specificity, accuracy, and AUC values obtained using the confusion matrix of each assistive diagnostic model are displayed in Table 4.
The current study featured a binary problem, and the adopted model performance evaluation methods involved a confusion matrix and AUC. The accuracy rate, sensitivity, and specificity of the models were calculated using the confusion matrix and AUC. The percentage ratio of patients who needed and did not need to undergo surgical treatment could be accurately predicted by calculating the sensitivity and specificity. Regarding the evaluation performance of the constructed models, the model combining LGR, C5.0 DT for feature selection and using a BPNN exhibited the best model performance among the 12 models constructed. This model has a testing accuracy rate of 94.87%, a sensitivity of 0.9, a specificity of 1, and an AUC of 0.952. The prediction model that combines LGR and C5.0 DT for feature selection exhibited the best model performance among all constructed models.
Among the constructed models, the prediction model combining LGR, C5.0 DT for feature selection, and using a BPNN exhibited the best performance. Therefore, this model was used as a basis to assess rules associated with evaluating if an operation was ultimately performed. Seven rules were obtained from this model, as illustrated in Figure 3. Among the seven rules, four rules could be used to evaluate whether an operation was ultimately performed:
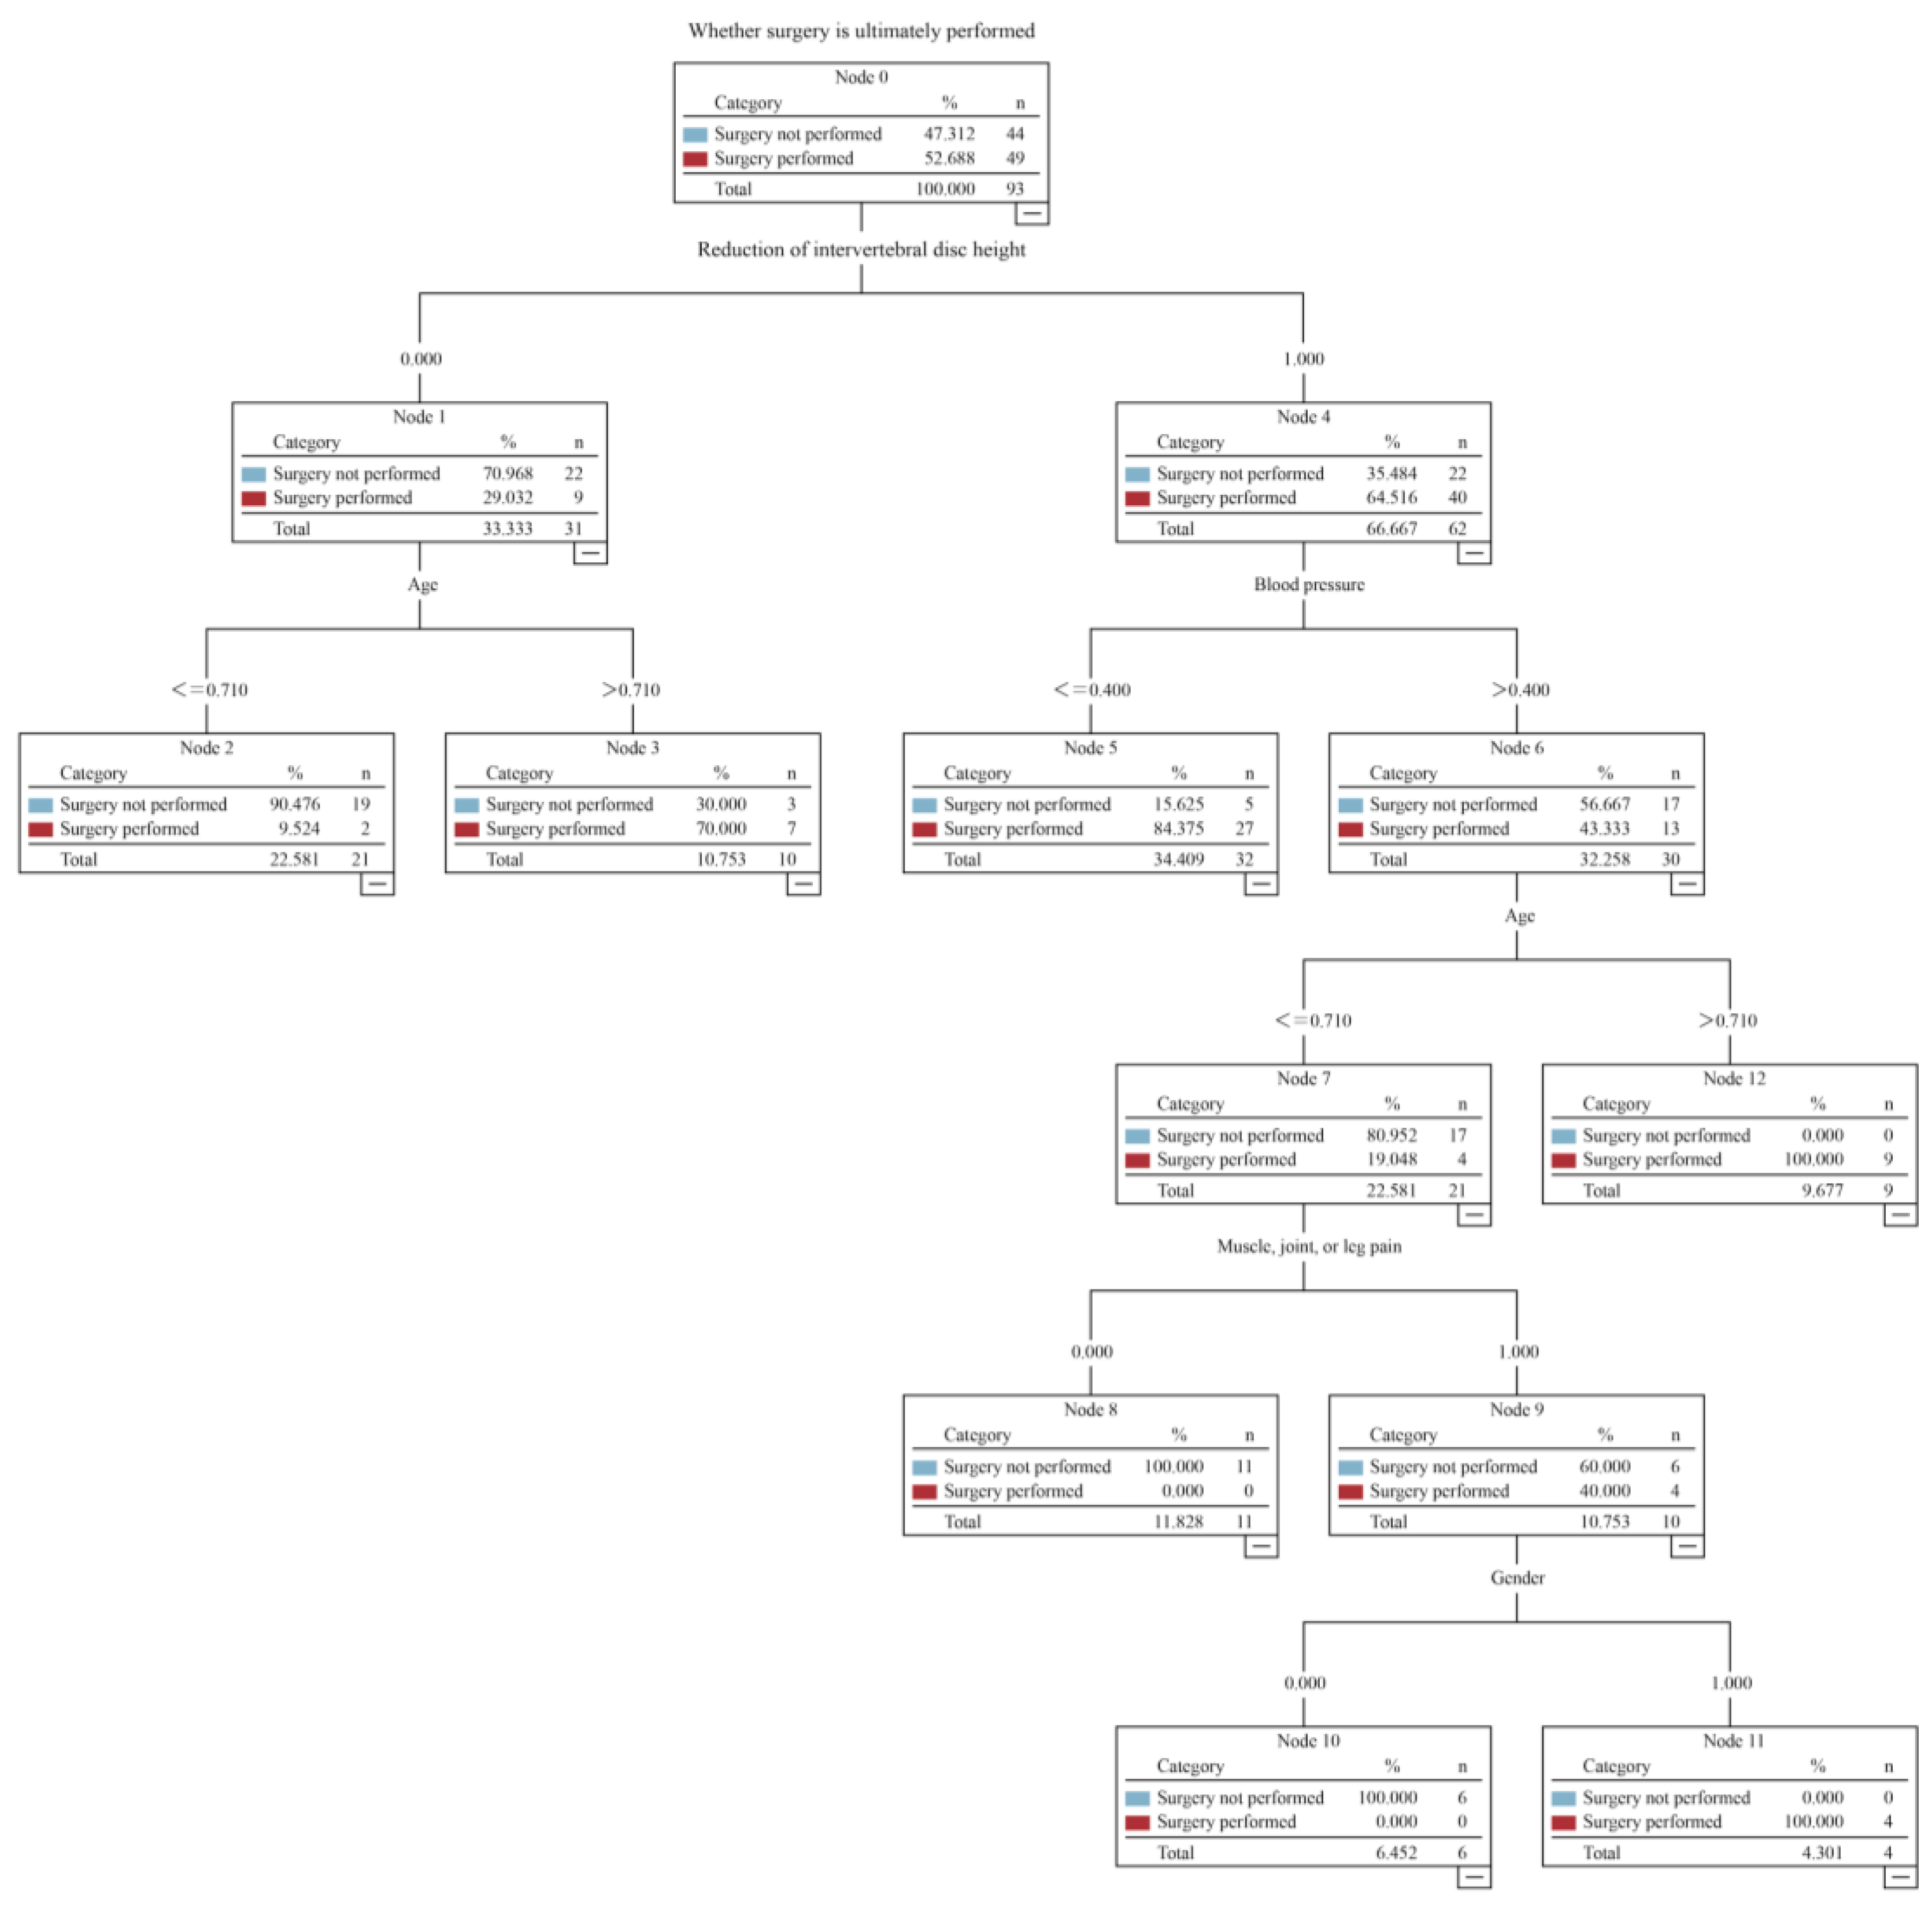
If no reduction of the intervertebral disc height occurred and the patient was older than 77 years, the patient ultimately underwent the operation.
If a reduction of the intervertebral disc height occurred and the patient’s blood pressure difference was less than 60 mm/Hg, the patient ultimately underwent the operation.
If a reduction of the intervertebral disc height occurred, the patient’s blood pressure difference was greater than 60 mm/Hg, the patient was younger than 77 years, the patient was male, and the patient had leg pain, the patient ultimately underwent the operation.
If a reduction of the intervertebral disc height occurred, the patient’s blood pressure difference was greater than 60 mm/Hg, and the patient was older than 77 years, the patient ultimately underwent the operation.
In addition, three rules could be used to evaluate whether an operation was not ultimately performed:
If no reduction of the intervertebral disc height occurred and the patient was younger than 77 years, the patient ultimately did not undergo the operation.
If a reduction of the intervertebral disc height occurred, the patient’s blood pressure difference was greater than 60 mm/Hg, the patient was younger than 77 years, the patient was female, and the patient had leg pain, the patient ultimately did not undergo the operation.
If a reduction of the intervertebral disc height occurred, the patient’s blood pressure difference was greater than 60 mm/Hg, the patient was younger than 77 years, and patient did not have leg pain, the patient ultimately did not undergo the operation.
The study results indicated that several key features were obtained using the model combining LGR and C5.0 DT for feature selection, and a C5.0 DT: reduction of the intervertebral disc height, age, blood pressure difference, leg pain, and gender. The study was limited by inherent problems such as a small sample size and imbalanced categorical data. Features were selected after categorical data were balanced. Despite the limitations, the prediction accuracy rate remained up to 90%.

5. Discussion

Class imbalance is where the classes are not represented equally among the data. It occurs in many settings such as medicine and product defect rates in manufacturing industries and has been considered an important issue recently [27]. In machine learning, if training were performed with imbalanced data, the resulting models would be biased towards predicting the majority class rather than the minority [28]. This study is a binary classification problem with imbalanced data, and classifier performance from random over-sampling is better than from random under-sampling [29], therefore random over-sampling was used in this study, namely, SMOTE from R software, to prepare the data for building the models. While the data shows 81 individuals who underwent surgery and 22 who did not, the objective of this study was to build a prediction model with appropriate factors to assist doctors in making treatment recommendations to patients.
Regarding network architecture, the BPNN is a type of multilayer feed forward network that can be used to solve nonlinear problems. It is the most widely used supervised learning network [24]. Therefore, the researchers of this study referred to neural network theory; selected features by using data sets from a C5.0 DT and combination of LGR and C5.0 DT; imported the selected key factors (i.e., imaging diagnostic data and medical record data) into a BPNN, C5.0 DT, and SVM for subsequent prediction; adjusted the parameter values of each classifier for optimization; and ultimately constructed the prediction models.
The dependent variable of the LGR model must be a binary variable. Hence, LGR is suitable for use in medical health care data, which are mainly binary. This study revealed that combining LGR and C5.0 DT feature selection methods enhanced the C5.0 DT and identified the crucial features to be disc height reduction, age, diastolic blood pressure, leg pain, and gender. Reducing the height of the intervertebral disk may cause lumbar foraminal stenosis, which is highly related to LSS symptoms such as neurogenic claudication, weakness, and a feeling of heavy legs [2,6,8]. Leg pain may be caused by lumbago, hypesthesia, paresthesia of the legs, and ataxia from lumbar foraminal stenosis [2,6]. LSS symptoms are highly related to neural compression and local vascular deficiency [30]. Furthermore, Spratt et al. indicated that the VAS, Low Back Outcome Score, and reductions in claudication and leg pain are essential factors for evaluating surgical outcomes [21]. Underlying subclinical vascular factors may be involved in complaints from patients with LSS. Degenerative changes in the spine are the most common cause of spinal stenosis [9], and advanced age is highly correlated with the onset of degenerative diseases of the lumbar spine. According to Bressler et al. [31], 50% of the population older than 65 years is expected to experience LBP from a reduced height of the intervertebral disc, as detected through MRI. Simotas assessed the treatment outcomes of undergoing no operations and receiving surgical treatment among 139 patients with LSS and reported that older patients appeared to have worse outcomes 5 years earlier for LSS procedures [4]. From a medical perspective, age is in fact a main factor in lumbar spine degeneration and has been demonstrated in the literature to have a direct effect on LSS symptoms. While the age of 77 years as a rule generated by this study’s best-performing logarithm warrants further investigation, this rule is derived from real-world data in conjunction with consideration for other factors such as intervertebral disc height, blood pressure, joint and muscle pain, etc. This is akin to clinical practice, in which doctors would make treatment recommendations based on evaluating patients’ subjective symptoms and objective examinations. Possibly related to the findings of blood pressure as a factor in the predictive model, neurogenic claudication interrupting blood flow is attributable to problems of the cauda equina, venous congestion, ischemia, axonal damage, and intraneural fibrosis from vascular factors [4], but more verifications are needed to determine indirect links to blood pressure. Wilkens et al. [22] indicated that patients with chronic LBP and lumbar degeneration may experience increased pain-related disability after 1 year of experiencing impaired fasting glucose tolerance, greater pain-related disability, a higher BMI, and lower quality of life at the baseline. This finding revealed that pain and metabolic conditions are associated with the prognostic factors of LBP. Although LBP prognostic factors may influence whether patients with LSS undergo surgery, BMI was not chosen as a key feature in all three feature extraction methods because of research purpose differences. This study found gender to be crucial in the predictive model, but it has not been discussed as a factor in other studies and will require further investigation.
DTs are an important exploration and prediction tool for data mining [32,33]. C5.0, CHAID, and CART are among the most extensively used DT algorithms [34]. Many studies have applied data mining techniques to study LSS, including by using DTs to predict the outcomes of LSS surgery, and the accuracy rate of the CHAID DT in this study was 90.1% [21]. In this study, the researchers discovered that differences in data categories may have resulted in a single algorithm not being able to fulfill the requirements of prediction model construction for multicategory variables. The input variables of this study comprised continuous and categorical variables. Accordingly, 12 prediction models were constructed. The study results indicated that the model combining LGR and C5.0 DT for feature selection and using a BPNN has a testing accuracy rate of 94.87%. This model exhibited excellent model performance for evaluating model performance indicators.
The current study is limited by problems such as a small sample size and imbalanced categorical data. The construction of larger data sets by using large insurance databases may enhance the credibility of the results and improve the balance of data categories. In this study, the best parameter setting for the model was determined through trial and error. Using optimization algorithms with prediction models in future studies may have enhanced the performance of the models. For feature variables, physical examination of the cases and the collection of psychological data should be expanded. The combination of quantitative medical data and qualitative research analysis perspectives may increase the comprehensiveness of the explored dimensions. In addition, the train-test split used for machine learning in this study was 70–30; future investigations could experiment with different split ratios such as 80–20 or 90–10 for an even wider range of potential prediction models to compare with and choose from.

6. Conclusions

Currently, data mining techniques are used extensively in health care to analyze and identify useful information to construct assistive diagnostic models that can help medical professionals perform diagnosis and treatment. Patients with mild LSS experience pain in the lower back or in the buttocks. Patients with severe LSS may experience weakness in the lower extremities while walking or dysfunction during excretion. Some patients with LSS may recover effectively after receiving conservative treatment for a period of time. However, other patients with LSS must receive surgical treatment after conservative treatment fails. Delaying required treatment affects the timeliness and efficacy of the treatment. Amundsen et al. (2000) noted that predictors of treatment outcomes for surgery or conservative treatment are unavailable. Regarding the performance of the 12 models constructed in this study, all models have an AUC performance capability beyond 0.8. Most of the models have a model performance of 0.9 or better. Among the constructed models, the model combining LGR, C5.0 DT and a BPNN exhibited the best model performance, with a testing accuracy rate of 94.87% and an AUC of 0.952. Regarding the hidden layer configuration of a BPNN, models adopting two levels of hidden layers exhibited better model performance. For feature selection, the prediction model combining LGR and C5.0 DT for feature selection exhibited the best performance. Several critical features were obtained using this model: reduction of the intervertebral disc height, age, systolic pressure, leg pain, gender, etc. However, this study was limited by practical constraints such as the small number of data available and categorical class imbalances; in the works are the plans for the next phase of this study for further verifications of the predictive models by acquiring a larger dataset such as Taiwan’s National Health Insurance Database. Although certain limitations remained for these factors for predicting whether patients with LSS ultimately underwent surgical treatment, they can still serve as references for medical care personnel. These factors can also serve as an adjunct diagnostic tool for diagnosing LSS. In the current study, sociodemographic, behavioral, and illness-related factors were collected for academic research, and these selected factors can be used to perform careful and comprehensive evaluation of suitable treatment plans to provide precision medical services. In addition, the trust level between the hospital and patients and their family members could be enhanced to lower unnecessary medical risks. Furthermore, close integration of data mining and health care information can enhance medical service quality and lower additional costs.

Author Contributions

Conceptualization, L.-P.T.; methodology, L.-P.T., Y.-C.P., Y.-S.C. and T.-H.H.; software design, Y.-S.C., T.-H.H.; collected the data, L.-P.T. Tseng and Y.-C.P.; writing—original draft preparation, Y.-S.C. and Y.-K.O.; writing—review and editing, Y.-K.O., T.-H.H. and L.-P.T. All authors have read and agreed to the published version of the manuscript.

Funding

This study was funded by the St. Martin De Porres Hospital (P1903).

Acknowledgments

We would like to thank anonymous reviewers and the editors for their comments.

Conflicts of Interest

The authors confirm that there are no conflict of interest in this current study.

Abbreviations

LSSlumbar spinal stenosis;
LGRlogistic regression;
LBPlower back pain;
MRImagnetic resonance imaging;
VASvisual analog scale;
DTdecision tree;
CHAIDchi-square automatic interaction detection;
BPNNback-propagation neural network;
SVMsupport vector machine;
CARTclassification and regression tree;
SMOTEsynthetic minority oversampling technique;
AUCoperating characteristic curve.

References

  1. Deyo, R.A.; Gray, D.T.; Kreuter, W.; Mirza, S.; Martin, B.I. United States Trends in Lumbar Fusion Surgery for Degenerative Conditions. Spine 2005, 30, 1441–1445. [Google Scholar] [CrossRef] [PubMed]
  2. Markman, J.D.; Gaud, K.G. Lumbar Spinal Stenosis in Older Adults: Current Understanding and Future Directions. Clin. Geriatr. Med. 2008, 24, 369–388. [Google Scholar] [CrossRef] [PubMed]
  3. Genevay, S.; Atlas, S.J.; Katz, J.N. Variation in Eligibility Criteria from Studies of Radiculopathy due to a Herniated Disc and of Neurogenic Claudication due to Lumbar Spinal Stenosis. Spine 2010, 35, 803–811. [Google Scholar] [CrossRef]
  4. Simotas, A.C. Nonoperative Treatment for Lumbar Spinal Stenosis. Clin. Orthop. Relat. Res. 2001, 384, 153–161. [Google Scholar] [CrossRef] [PubMed]
  5. Gevirtz, C. Update on treatment of lumbar spinal stenosis. Part 1: Defining the problem, diagnosis, and appropriate imaging. Topics Pain Manag. 2010, 25, 1–5. [Google Scholar]
  6. Verbiest, H. A radicular syndrome from developmental narrowing of the lumbar vertebral canal. J. Bone Jt. Surg. Br. 1954, 36, 230–237. [Google Scholar] [CrossRef]
  7. Backstroma, K.M.; Whitman, J.M.; Flynn, T.M. Lumbar spinal stenosis-diagnosis and management of the aging spine. Man. Ther. 2011, 16, 308–317. [Google Scholar] [CrossRef]
  8. Dejerine, J. Intermittent claudication of the spinal cord. Press Med. 1911, 19, 981–984. (In French) [Google Scholar]
  9. Malfair, D.; Beall, D.P. Imaging the Degenerative Diseases of the Lumbar Spine. Magn. Reson. Imaging Clin. N. Am. 2007, 15, 221–238. [Google Scholar] [CrossRef]
  10. Lee, S.; Lee, J.; Yeom, J.S.; Kim, K.-J.; Kim, H.-J.; Chung, S.K.; Kang, H.S. A Practical MRI Grading System for Lumbar Foraminal Stenosis. Am. J. Roentgenol. 2010, 194, 1095–1098. [Google Scholar] [CrossRef] [Green Version]
  11. Siebert, E.; Prüss, H.; Klingebiel, R.; Failli, V.; Einhäupl, K.M.; Schwab, J.M. Lumbar spinal stenosis: Syndrome, diagnostics and treatment. Nat. Rev. Neurol. 2009, 5, 392–403. [Google Scholar] [CrossRef]
  12. Ng, K.K.M.; Cheung, K.M.-C. Is minimally invasive surgery superior to open surgery for treatment of lumbar spinal stenosis? A systematic review. J. Orthop. Surg. 2017, 25. [Google Scholar] [CrossRef] [Green Version]
  13. Cho, D.-Y.; Lin, H.-L.; Lee, W.-Y.; Lee, H.-C. Split–spinous process laminotomy and discectomy for degenerative lumbar spinal stenosis: A preliminary report. J. Neurosurg. Spine 2007, 6, 229–239. [Google Scholar] [CrossRef] [PubMed]
  14. Murphy, D.R.; Hurwitz, E.L.; Gregory, A.; Clary, R. A Nonsurgical Approach to the Management of Patients with Cervical Radiculopathy: A Prospective Observational Cohort Study. J. Manip. Physiol. Ther. 2006, 29, 279–287. [Google Scholar] [CrossRef] [PubMed]
  15. Vo, A.N.; Kamen, L.B.; Shih, V.C.; Bitar, A.A.; Stitik, T.P.; Kaplan, R.J. Rehabilitation of orthopedic and rheumatologic disorders. 5. Lumbar spinal stenosis. Arch. Phys. Med. Rehabil. 2005, 86, 69–76. [Google Scholar] [CrossRef]
  16. Fitch, K.; Blumen, H.; Engel, T. Utilization and Cost of Surgery for Lumbar Spinal Stenosis in a Commercially Insured Population; Milliman Client Report; Milliman Inc.: Seattle, WA, USA, 2015; pp. 1–18. [Google Scholar]
  17. Machado, G.C.; Ferreira, M.L. No clinically important benefits of surgery over rehabilitation for lumbar spinal stenosis (PEDro synthesis). Br. J. Sports Med. 2016, 51, 541–542. [Google Scholar] [CrossRef]
  18. Amundsen, T.; Weber, H.; Nordal, H.J.; Magnaes, B.; Abdelnoor, M.; Lilleås, F. Lumbar spinal stenosis: Conservative or surgical management? A prospective 10-year study. Spine 2000, 25, 1424–1436. [Google Scholar] [CrossRef]
  19. Azimi, P.; Benzel, E.C.; Shahzadi, S.; Azhari, S.; Mohammadi, H.R. Use of artificial neural networks to predict surgical satisfaction in patients with lumbar spinal canal stenosis. J. Neurosurg. Spine 2014, 20, 300–305. [Google Scholar] [CrossRef]
  20. Van Dongen, J.M.; Van Hooff, M.L.; Spruit, M.; De Kleuver, M.; Ostelo, R.W.J.G. Which patient-reported factors predict referral to spinal surgery? A cohort study among 4987 chronic low back pain patients. Eur. Spine J. 2017, 26, 2782–2788. [Google Scholar] [CrossRef] [Green Version]
  21. Spratt, K.F.; Keller, T.S.; Szpalski, M.; Vandeputte, K.; Gunzburg, R. A predictive model for outcome after conservative decompression surgery for lumbar spinal stenosis. Eur. Spine J. 2004, 13, 14–21. [Google Scholar] [CrossRef] [Green Version]
  22. Wilkens, P.; Scheel, I.B.; Grundnes, O.; Hellum, C.; Storheim, K. Prognostic factors of prolonged disability in patients with chronic low back pain and lumbar degeneration in primary care: A cohort study. Spine 2013, 38, 65–74. [Google Scholar] [CrossRef]
  23. Chien, C.F.; Hsu, C.Y. Data Mining & Big Data Analytics; Future Career Publishing Corporation: New Taipei City, Taiwan, 2014. (In Chinese) [Google Scholar]
  24. Rumelhart, D.E.; McClelland, J.L. Parallel Distributed Processing: Explorations in the Microstructure of Cognition; MIT Press: Cambridge, MA, USA, 1986; Volume 1. [Google Scholar]
  25. Hsu, C.W.; Chang, C.C.; Lin, C.J. A Practical Guide to Support Vector Classification. 2003. Available online: http://www.csie.ntu.edu.tw/~cjlin/papers/guide/guide.pdf (accessed on 19 December 2012).
  26. Hosmer, D.W.; Lemeshow, S. Applied Logistic Regression, 2nd ed.; John Wiley & Sons, Inc.: New York, NY, USA, 2000. [Google Scholar] [CrossRef]
  27. Fernández, A.; Del Jesus, M.J.; Herrera, F.; Hilario, A.F. On the influence of an adaptive inference system in fuzzy rule based classification systems for imbalanced data-sets. Expert Syst. Appl. 2009, 36, 9805–9812. [Google Scholar] [CrossRef]
  28. Padmaja, T.M.; Dhulipalla, N.; Bapi, R.S.; Krishna, P.R. Unbalanced data classification using extreme outlier elimination and sampling techniques for fraud detection. In Proceedings of the 15th International Conference on Advanced Computing and Communications (ADCOM 2007), Guwahati, India, 18–21 December 2007; Institute of Electrical and Electronics Engineers (IEEE): Piscataway, NJ, USA, 2007; pp. 511–516. [Google Scholar]
  29. Lee, C.-I.; Tsai, C.-J.; Wu, T.-Q.; Yang, W.-P. An approach to mining the multi-relational imbalanced database. Expert Syst. Appl. 2008, 34, 3021–3032. [Google Scholar] [CrossRef]
  30. Akuthota, V.; Lento, P.; Sowa, G. Pathogenesis of lumbar spinal stenosis pain: Why does an asymptomatic stenotic patient flare? Phys. Med. Rehabil. Clin. 2003, 14, 17–28. [Google Scholar] [CrossRef]
  31. Bressler, H.B.; Keyes, W.J.; Rochon, P.A.; Badley, E. The Prevalence of Low Back Pain in the Elderly. Spine 1999, 24, 1813–1819. [Google Scholar] [CrossRef] [PubMed]
  32. Berson, A.; Smith, S.; Thearling, K. Building Data Mining Applications for CRM; McGraw-Hill: New York, NY, USA, 2000. [Google Scholar]
  33. Linoff, G.S.; Berry, M.J. Data Mining Techniques: For Marketing, Sales, and Customer Relationship Management; John Wiley & Sons: Hoboken, NJ, USA, 2011. [Google Scholar]
  34. Hastie, T.; Friedman, J.; Tibshirani, R. The Elements of Statistical Learning; Springer Series in Statistics; Springer: Berlin, Germany, 2001; Volume 1. [Google Scholar]
Figure 1. Research Flowchart for Building Prediction Models.
Applsci 10 06406 g001
Figure 2. Feature selection and backpropagation neural network.
Applsci 10 06406 g002
Figure 3. Rules extracted from the C5.0 DT (70% data for training and 30% for testing).
Applsci 10 06406 g003
Table 1. Classification of the variables.
Input Variables
Medical records
Demographic dataAgeContinuous variable
GenderMale or female
EducationNo education, elementary school, junior high school, senior high school, university or higher
Physiological dataBody mass index (BMI)Continuous variable
Diastolic pressureContinuous variable
Systolic pressureContinuous variable
LifestyleSmoking historypresent or absent
Drinking historypresent or absent
Physical examinationPresence of other medical conditionspresent or absent
Walking distance on level groundRequires complete assistance, requires partial assistance, can walk slowly for approximately 50 m, or can walk independently
Leg painpresent or absent
Joint painpresent or absent
Muscle painpresent or absent
Muscle weaknesspresent or absent
Mild paralysis/numbnesspresent or absent
Leg numbnesspresent or absent
MRI diagnosis
Reduction of intervertebral disc heightpresent or absent
Intervertebral disc herniationpresent or absent
Output variable
SurgerySurgery performed or not performed
Table 2. Parameter settings in each model.
TechniqueParameterValue/RangeConfiguration
BPNNLearning rate0.1–10.9
Number of hidden units1–22
Number of learning sample9–1818
C5.0Minimum number of instances per leaf 10
SVMKernelRBF kernelC:10
Gamma:0.1
Table 3. Compilation table of the three feature extraction methods.
Feature Selection Method
LGRC5.0 DTLGR and C5.0 DT
GenderGenderGender
AgeAgeAge
Education-Education
Systolic pressure-Systolic pressure
Diastolic pressureDiastolic pressureDiastolic pressure
Reduction of intervertebral disc heightReduction of intervertebral disc heightReduction of intervertebral disc height
Leg painLeg painLeg pain
Joint pain-Joint pain
Muscle painMuscle painMuscle pain
-Muscle weaknessMuscle weakness
-Whether
patient has other medical history
Whether
patient has other medical history
Table 4. Comparison of each assistive diagnostic model.
Constructed ModelSensitivitySpecificityAccuracy rateAUC
LGR+ C5.0 DT
for feature selection
using a BPNN
0.9194.870.952
BPNN0.950.94794.870.949
C5.0 DT for feature selection
using a BPNN
0.90.94792.300.924
LGR + C5.0 DT
for feature selection
using a SVM
0.90.94792.300.924
LGR + C5.0 DT
for feature selection
using a C5.0 DT
0.90.9492.30.924
LGR for feature selection
using a BPNN
0.8189.740.913
SVM0.8189.740.913
C5.0 DT10.889.740.910
C5.0 DT for feature selection using a SVM0.80.94787.170.880
LGR for feature selection
using a SVM
0.80.94787.170.880
C5.0 DT for feature selection
using a C5.0 DT
0.90.8387.170.873
LGR for feature selection
using a C5.0 DT
0.80.8884.60.840

