Article

Acoustic Environment and Noise Exposure in Fitness Halls

by
Omaimah Ali Al-Arja
Department of Architecture and Interior Architecture, School of Architecture and Built Environment, German Jordanian University, Amman 11180, Jordan
Appl. Sci. 2020, 10(18), 6349; https://doi.org/10.3390/app10186349
Submission received: 13 August 2020 / Revised: 6 September 2020 / Accepted: 8 September 2020 / Published: 11 September 2020
(This article belongs to the Special Issue Advances in Room Acoustics of Non-performing Public Spaces)

Abstract

:
People seek health and leisure in gyms and fitness halls. In this study, interior acoustics including reverberation time (T) and activity noise levels were studied in 20 indoor sports and gymnasium (IS & G) halls in Amman, Jordan. Interviews and questionnaires were also applied to assess the subjective comfort levels of the acoustic environment in these IS & G halls. The measured values were correlated with the subjective evaluations. The range of measured T values was 1.09–5.38 s. The activity noise level, which was measured with LA,eq over 50 min of activity, ranged between 80.0 and 110.0 dB(A). The average personal noise exposure for instructors was 92.6 dB(A), ranging from 81.0 to 108.0 dB(A), whereas 90% of the measurement results were above the occupational exposure limit (OEL) of 85.0 dB(A), and 40% of instructors were potentially exposed to excessive noise levels. The subjective rating of listening conditions correlated significantly with the reverberation time rather than noise level (p < 0.01). In conclusion, the results from this study show that noise levels generated in the studied IS & G halls present a possible workplace noise hazard. Raising awareness of the risk of hearing problems among instructors working in IS & G halls is highly recommended.

1. Introduction

In recent years, fitness gyms and indoor sports and gymnasium (IS & G) centers have become highly popular places for people seeking physical fitness and a healthy lifestyle. IS & G centers have large spaces with large areas of reflective parallel surfaces. When sound hits these reflective surfaces, it bounces back into the hall and can lead to echoes, focusing, and standing waves. Flutter echoes can occur as a result of the parallel walls, significantly increasing the reverberation time and reducing speech intelligibility [1,2,3]. Speakers increase their vocal effort and raise their voices when speaking in a noisy environment to enhance the audibility of their voice and to maintain good communication with others [4,5]. Most IS & G centers play music at a high volume as an integral feature of group exercise. Previous studies [6] have demonstrated that instructors and users believe that loud music stimulates physical activity and enhances performance. Furthermore, studies have also demonstrated that interacting with loud music with a fast beat and/or tempo plays a significant role in enhancing exercise performance and motivating those attending fitness classes [7,8,9].
For instructors, the gym hall is characterized as an occupational environment, whereas for users, it is a leisure environment. Although the main purpose of fitness gyms is to improve the users’ physical fitness and quality of life, such an environment with excessive exposure to loud music can be harmful to both instructors’ and users’ hearing [10,11,12,13]. Assessments of noise exposure in sports instructors have shown very high continuous equivalent sound pressure levels [14]. In addition, studies have investigated risks related to noise exposure, symptoms of hearing loss, and awareness of hearing problems among fitness instructors [15,16,17,18,19]. The results from a recent study [20] showed that more than half of fitness instructors were potentially exposed to excess noise and had signs and symptoms of hearing loss. Other investigators [21,22,23] also demonstrated that sports instructors have voice problems. Furthermore, the potential risk of noise-induced hearing loss (NIHL) due to loud music exposure [24] has been widely investigated in musicians and people working in music venues [25], students studying music [26], and people listening to loud music in leisure venues [27]. In general, noise sensitivity was found to significantly affect physiological responses [28]. Indoor ambient noise and noise exposure of physical education teachers were also studied [29,30] and results showed that fitness instructors are a high-risk population for vocal troubles, with 55% reporting that they experienced voice difficulties. In addition, the comfort levels of people in large interior spaces with complicated acoustical characteristics have also been investigated, and studies concluded that the acoustic environment has a negative impact on people’s emotions, attention, and thinking ability [15,31,32,33].
Considering the above, the acoustic design and qualities of fitness gyms and indoor sports halls have become integral parts of their structural design that are closely monitored and regulated by international standards. Specific standards for noise levels and reverberation time (T) for IS & G centers have been introduced in the Building Bulletin standards, BB version 17 issued in 2015 [1], and by experts in the field [34]. Criteria and allowable limits of recommended exposure levels (RELs) for occupational noise exposure have been introduced by the National Institute for Occupational Safety and Health (NIOSH) [35]. Similarly, the Occupational Safety and Health Administration (OSHA), the International Organization for Standardization (ISO-1999) [36], and the European Union Directive [37] have also established permissible exposure limits (PELs) of noise level at different settings.
In Jordan, the Jordanian Acoustic Code (JAC) established by the Ministry of Public Works and Housing recently established standards and guidelines to limit noise levels in the workplace and daily occupational exposure limits (OELs) [38]. Some IS & G centers are designed and constructed to be used as sports halls and gymnasia, while many others are adapted buildings that were previously used for another purpose. Although converting buildings to fitness gyms is an onerous task, it is considered to be essential investment, representing a means for addressing the growing demand for these facilities [39]. At present, the adherence of these centers to national and international guidelines and standards of acoustic qualities and noise levels is not well documented in Jordan. Therefore, the aim of this study is to examine the extent of noise exposure and the acoustic environment of 20 IS & G halls in Amman, Jordan by measuring the activity noise levels (LA,eq) and reverberation time (T) to compare the acoustical qualities in IS & G halls with the design criteria to assess whether the design target was achieved and to identify potential acoustic problems, as well as to investigate the subjective acoustic comfort rating through subjective survey and interview and correlate these ratings to the acoustic conditions in the different IS & G centers. Further, a case-study application for a simulation was also introduced to investigate the potential acoustic improvements resulting from using different absorptive materials.

2. Methods

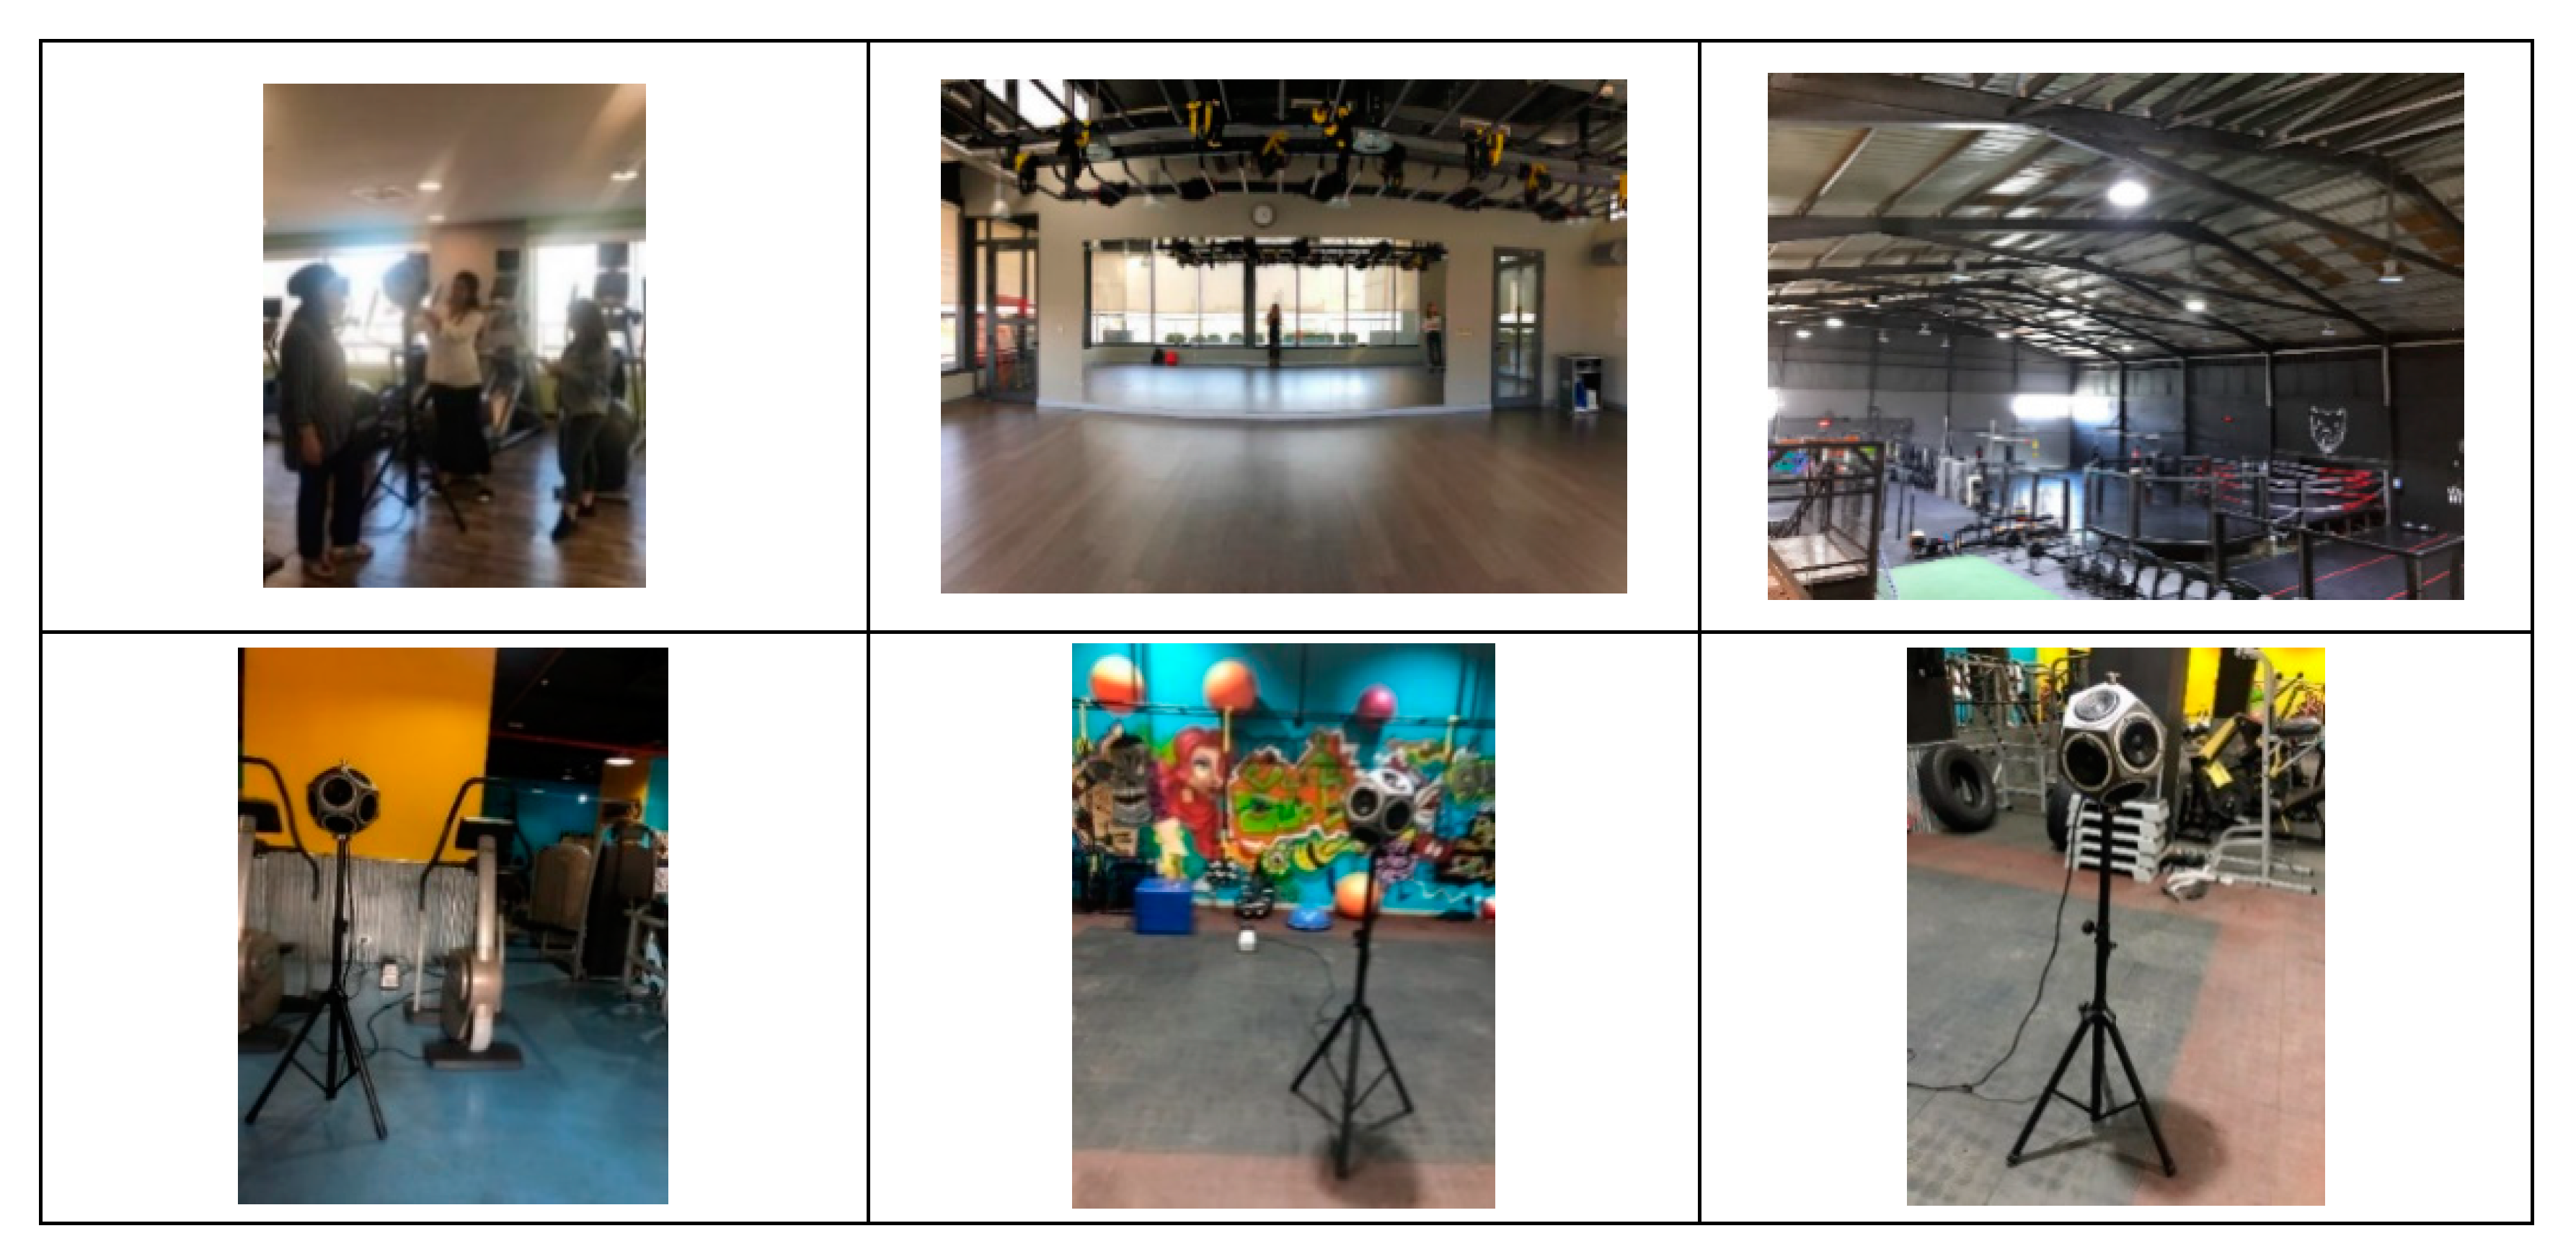
2.1. Characteristics of Studied IS & G Halls

In this study, properties of the acoustic environment were investigated in 20 IS & G halls in terms of the room acoustic parameters of reverberation time and noise level. Most of the halls were located on main streets. The sport halls vary in their geometry, but had been constructed from typical building materials. The most common building materials used for the construction of indoor sports halls and gymnasia are concrete, concrete blocks, metal decks, concrete ceilings, and ceramic tile flooring, and no thermal insulation is used in the walls, floors, or roofs. Most of the interior walls are covered with reflective materials; in addition, most of the IS & G halls contain large mirrors on two parallel walls to encourage the participants during their workout sessions. Indoor sports and gymnasium buildings were generally designed for different functions and had no acoustic treatments. Only one studied building had acoustic treatment covering the ceiling. Materials covering the interior surfaces are listed in Table 1.
The studied IS & G halls were designated by the letters A–U, whereas the indoor sports halls (R, S, and U) have an open gym design. The design of the hall is open, so all activities, including workouts, aerobics, and machines, occur in the same space; certain architectural elements and spatial organization can have a range of influences regarding the formation of an aural environment. This affects the noise exposure for all instructors and participants [40]. Many types of workouts take place in IS & G halls, but, in this paper, we concentrated on fitness sessions such as aerobics and Pilates. Usually, music accompanies these workouts, characterized by high noise levels, and is considered to be occupational noise for instructors and participants [40].
The studied halls were divided into three categories according to area [1]: Category I, comprising gymnasium halls with an area less than 280 m2 (A–I); Category II, gymnasium halls with an area in the range of 280–530 m2 (J–N); and Category III, indoor sports halls with an area greater than 530 m2 (O–U). Figure 1 shows representative photos that were taken during the measurement of reverberation time inside some of the studied IS & G halls.

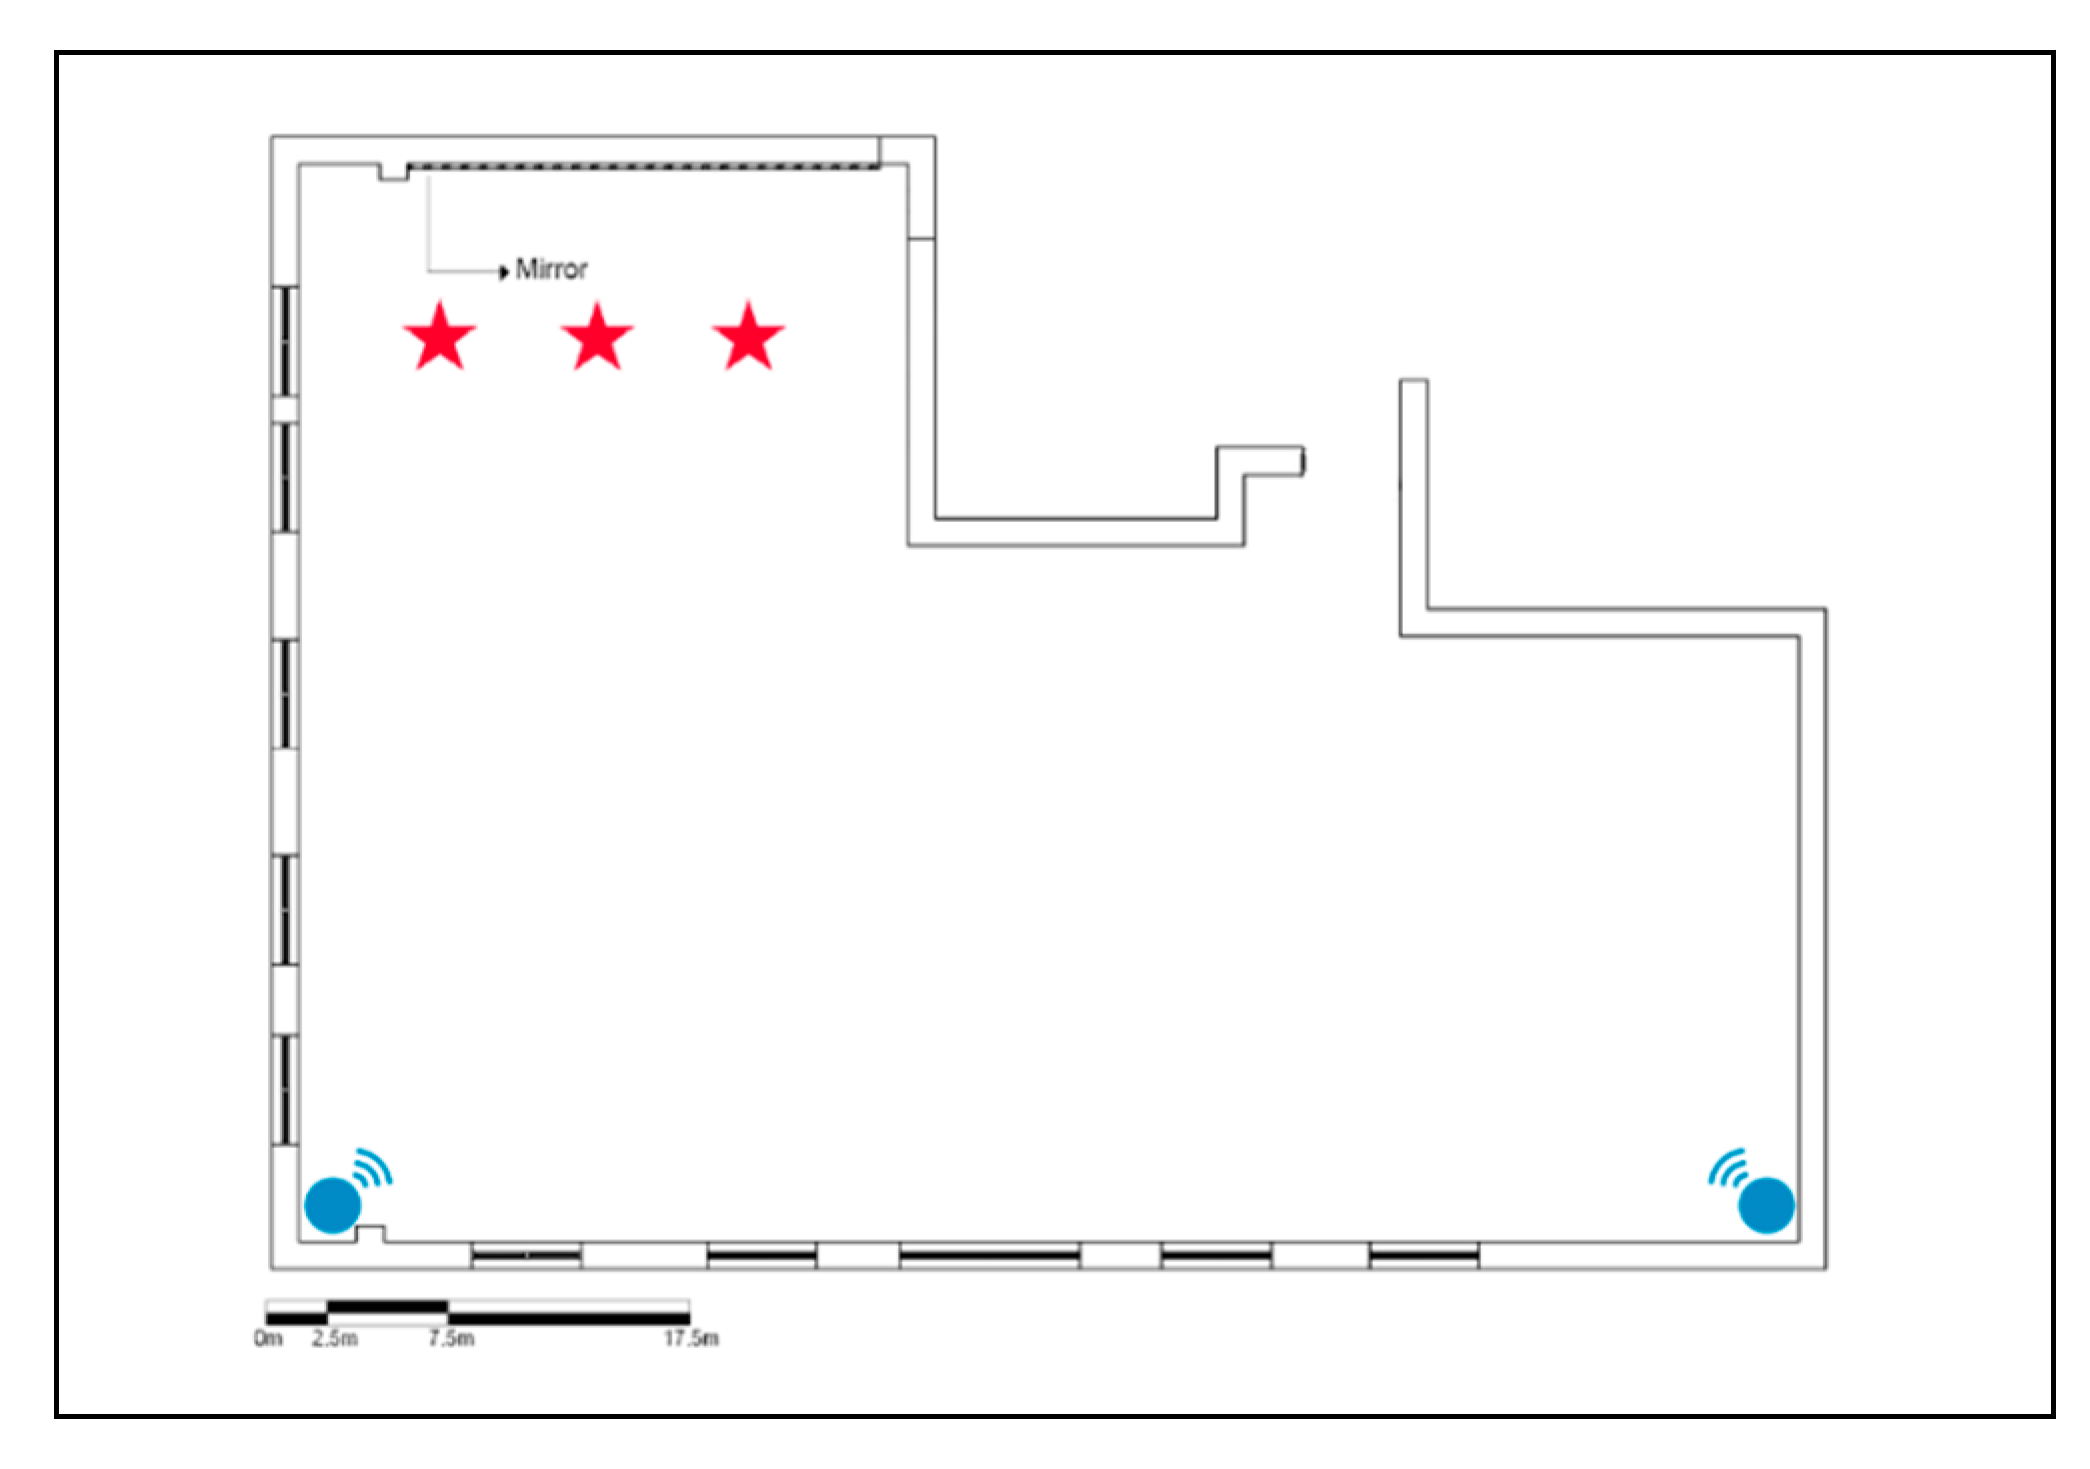
2.2. Noise Level Measurements in IS & G Halls

Following international standards adopted in the United Kingdom by BB [1], the evaluation of ambient noise was performed in non-occupied, but furnished IS & G halls with doors closed, but windows open, and without any ongoing activities inside the hall. Measurements were conducted using an XL2 Acoustic Analyzer and a Class I NTi Audio M2230 (NTi Audio AG, Schaan, Liechtenstein) sound level meter placed on a tripod at a height of 1.50 m from the floor and at least 1.5 m away from the surrounding reflective surfaces. The JAC indicates that only the continuous equivalent sound level LA,eq should not exceed 40.0 dB(A), and does not establish the duration of the measurements; the LA,eq measurement time was 30 min, thus characterizing the LA,eq, 30 min dB(A) as prescribed by Building Bulletin (BB) [1]. LA,eq, 30 min was measured twice per day: early in the morning (05:30–06:30) after opening the IS & G centers and before users arrived, and during the lunch break (14:00–15:00).
The activity noise levels (LA,eq) were measured in occupied IS & G halls during workout lessons; the music is played in all cases. The LA,eq was measured using an XL2 Acoustic Analyzer and a Class I NTi Audio M2230 sound level meter placed on a tripod at a height of 1.20 m from the floor, at the typical instructor’s position and not close to the loudspeakers, as illustrated in Figure 2. The workout session lasted for 60 min, and measurements of the equivalent continuous A-weighted sound pressure level, LA,eq, were taken for 50 min, because this is the duration of a workout session with loud music. The last 10 min of each session is for relaxation, usually accompanied by medium- to low-volume music. Hence, LA,eq was not measured during the last 10 min of the workout sessions. Three measurements of activity noise levels were measured per day during the sessions in each IS & G hall. Equivalent sound pressure levels were obtained for each record, and then the equivalent of the three measurements in each IS & G hall was calculated.
The dose per day, as a percentage, for the instructor’s exposure to occupational noise during the time they are delivering workout classes, was determined using Expression (1) [38]:
D = 100 ∑ Cn / Tn
where D is the dose (%), Cn is actual hours at a certain sound level, and Tn is the allowable time for that sound level. Allowable noise exposure time Tn was taken from [38]. It is acceptable to have the dose less than 100%, where exceeding 100% means exceeding the maximum permissible daily exposure time. The workplace noise assessment, LAEP,d [41], is known as LEX, 8 h in the Physical Agents (Noise) Directive [37]. Therefore, Expression (2) is used to calculate LEX, 8 h [41] from information about noise exposure levels during sub-periods:
LEX, 8 h = 10 × log 1/T (t1 × 10L1/10 + t2 × 10L2/10)
where L1 and L2 are the equivalent sound pressure levels during the two sub periods, t1 and t2 are the time periods for which these levels are maintained, and T is the overall time period. T must be equal to the sum of t1 and t2 sub periods of four hours were considered: t1 equals four hours with activity noise and t2 equals four hours without activity noise (i.e., only indoor background ambient noise).

2.3. Reverberation Time Measurements

Reverberation time is the key factor in characterizing the acoustic environment of a space [42], and is considered a quantity that can be used to control room acoustics [43,44]. Reverberation time values were determined according to the methodologies described by ISO 3382-2:2008 [45]. Reverberation time, T, was evaluated based on the dynamic range of 20.0 dB(A) and extrapolated to a decay time of 60.0 dB(A). T values were measured while the IS & G halls were unoccupied. This was done because the presence of people may have a strong influence on measured values. The mid-frequency reverberation time (Tmf) across the frequency spectrum was determined for all halls.
The measurements of T were taken using different equipment including an XL2 Acoustic Analyzer (serial no. A2A-14419-E0, FW4.03), NTi Audio M2230 microphone (serial no. 7492), omnidirectional DS3 Dodecahedron loudspeaker as a sound source, and PA3 power amplifier. The XL2 Acoustic Analyzer was calibrated before and after the measurements using a Class 1 94/114 dB(A) SPL calibrator. The calibrator was tested by the Royal Science Society in Amman, Jordan. The produced sound pressure level was sufficient to provide decay curves with the required dynamic range without contamination by background noise. A moving microphone was used, considering that the distance from the microphone position to the nearest reflecting surface, including the floor, was not less than 1.0 m. Reverberation time measurements were taken for one source position, and the average of the results of at least two source position‘s combinations and 2.0 m around the microphone position were applied. The source position was in the middle of the room, and if there was an irregular room shape, two sound source positions were used. The interrupted noise method was used. The frequency range covered at least 250–2000 Hz. The broadband spectrum was shaped to provide a pink spectrum of steady-state reverberant sound in the enclosure. The measurements of reverberation time were repeated three times at each IS & G hall, and the arithmetic mean was determined. An example of an IS & G hall is presented in Figure 3, illustrating the location of the measurement points of reverberation time, and locations of sound source.

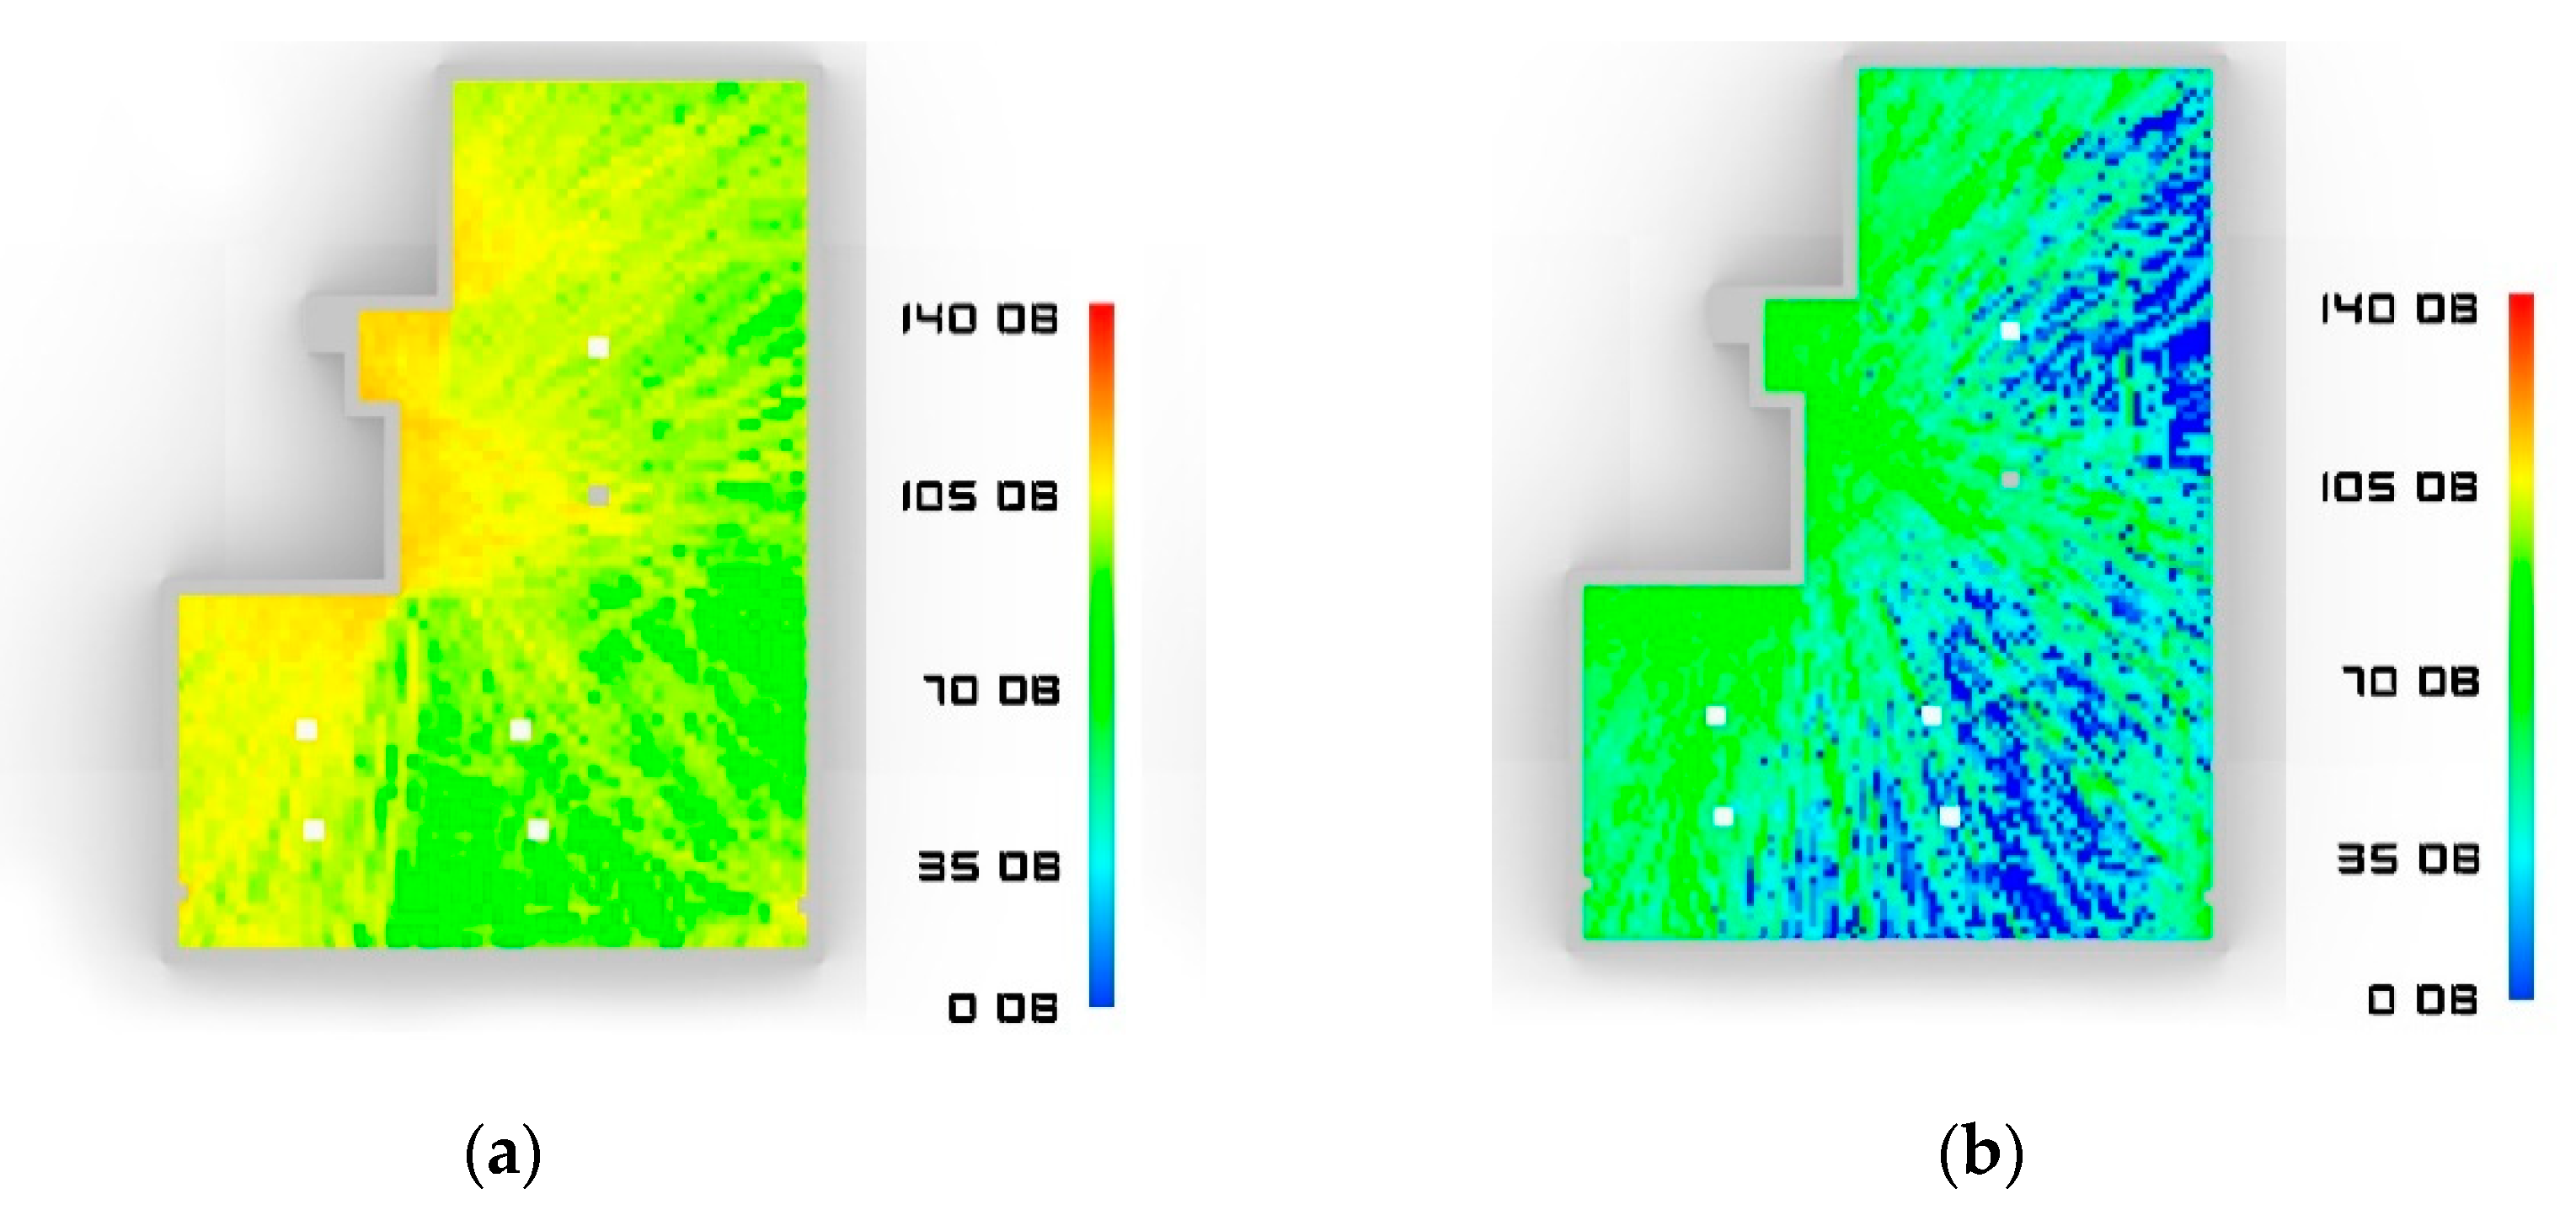
2.4. Case-Study Simulation Application

In this study, a single case-study application was also introduced to investigate the potential acoustic improvements resulting from the addition of absorptive materials to the walls and ceiling of one of the studied halls. The case study was selected from Category III halls. The hall has an L-shape and a volume of 8530 m3. The added absorptive materials are wrapped panels and baffles; the sound absorptive panels are made of fiberglass, wrapped with acoustically transparent fabric, with a total thickness of 50 mm. The wrapped panels are positioned on walls and baffles on the ceiling. The sound absorption coefficients of the used materials in the simulation are illustrated in Table 2. The simulation was carried out with a geometrical acoustic based software. Rhino3D and Visual Studio Code C# and Matplotlib were applied to obtain room acoustic predictions [46,47,48,49,50,51]. In the simulation process, the first step was to import a 3D model of the room, previously drawn in a modelling software. The software used for room modelling was 3DS, which includes an available 3DS plug-in, allowing users to make direct use of 3DS models in Rhino3D and Visual Studio Code C#. The raytracing technology was used to calculate the sound pressure level (SPL) and visualize it as a 3D Smart Particle System [52].

2.5. Interviews and Questionnaire

Interviews were conducted with instructors and users to collect information about the number of hours spent at the IS & G hall and to explore the acoustic qualities (sound clarity and loudness, reverberance, and noise annoyance). The survey was conducted during the month of July 2019. The strategy of nonprobability convenience sampling was used, and everyone in the IS & G hall was asked to participate. Participants were fully informed about the study, either by reading the first introductory paragraph and approving it or by one of the researchers verbally for illiterate participants. In total, 480 people were asked to fill out the questionnaire, among whom 401 (83.5%) accepted and completed the questionnaire; the respondents comprised 210 men and 191 women, representing 137 instructors and 264 participants. One research assistant was present to explain any unclear terms while subjects filled out the questionnaire. The survey was conducted using a simple questionnaire consisting of two groups of questions. The first group consisted of general demographic questions about age, gender, whether the respondent was an instructor or participant, and time spent in the IS & G hall. The second group of questions was related to hearing problems and the acoustic environment in terms of listening conditions and annoyance. The questions were built with a five-point Likert scale, where 1 refers to positive reactions and 5 refers to negative reactions. The questions were related to the subjective listening conditions (i.e., sound clarity and loudness) (very satisfied, satisfied, fair, unsatisfied, very unsatisfied); sound description (do not know, do not feel reverberance and echo, fair, feel reverberance and echo, feel strong reverberance and echo); loud music during workout sessions (very motivating, motivating, fair, stressful, very stressful); background noise level (not annoyed at all, annoyed, fairly annoyed, very annoyed); and overall acoustic environment (very comfortable, comfortable, fair, uncomfortable, very uncomfortable). No open-ended questions were asked. Questions in the study were derived based on different studies [32,54,55,56] investigating the acoustic environment in nonperforming spaces after modification. The questionnaire was organized so that its purpose was stated in the beginning, in order to obtain the subject’s approval to participate in the survey according to the declaration of Helsinki. The questionnaire and the informed consent forms were written in the Arabic language to ensure clarity for the participants. The questions for the English version are shown below. Questionnaire used in the study:
Part 1: General information
Age: ____________
Gender: □ Male □ Female
c. Are you:
□ Instructor □ Participant
d. Time spent in gym
□ One hour □Two hours □ Three hours □ Four hours □ Five hours and more
Part 2: Hearing and Acoustic Environment
1. Do you have any hearing problems? □ Yes □ No
2. How would you describe the listening conditions (sound clarity and loudness)?
□ Very satisfied □ Satisfied □ Fair □ Unsatisfied □ Very Unsatisfied
3. How would you describe the sound in the gym?
□ Do not know □ Do not feel reverberance and echo □ Fair □ Feel reverberance and echo □ Feel strong reverberance and echo
4. How would you evaluate the loud music during workout sessions?
□ Very motivating □ Motivating □ Fair □ Stressful □ Very stressful
5. How would you rate the background noise level?
□ Not annoyed at all □ Not annoyed □ Fairly annoyed □ Annoyed □ Very annoyed
6. How would you rate the overall acoustic environment in the fitness hall?
□ Very comfortable □ Comfortable □ Fair □ Uncomfortable □ Very uncomfortable
Data were documented and the statistical analysis was done using MATLAB. Percentage and frequency of occurrence were used to evaluate the categorical variables, while mean values were given for continuous measures. Mann Whitney test was used to check differences between groups. Statistical comparisons between groups and variables were presented where applicable, using a two-tailed N-1 chi-square test for different groups. A p < 0.05 was used to indicate statistically significant differences.

3. Results and Discussion

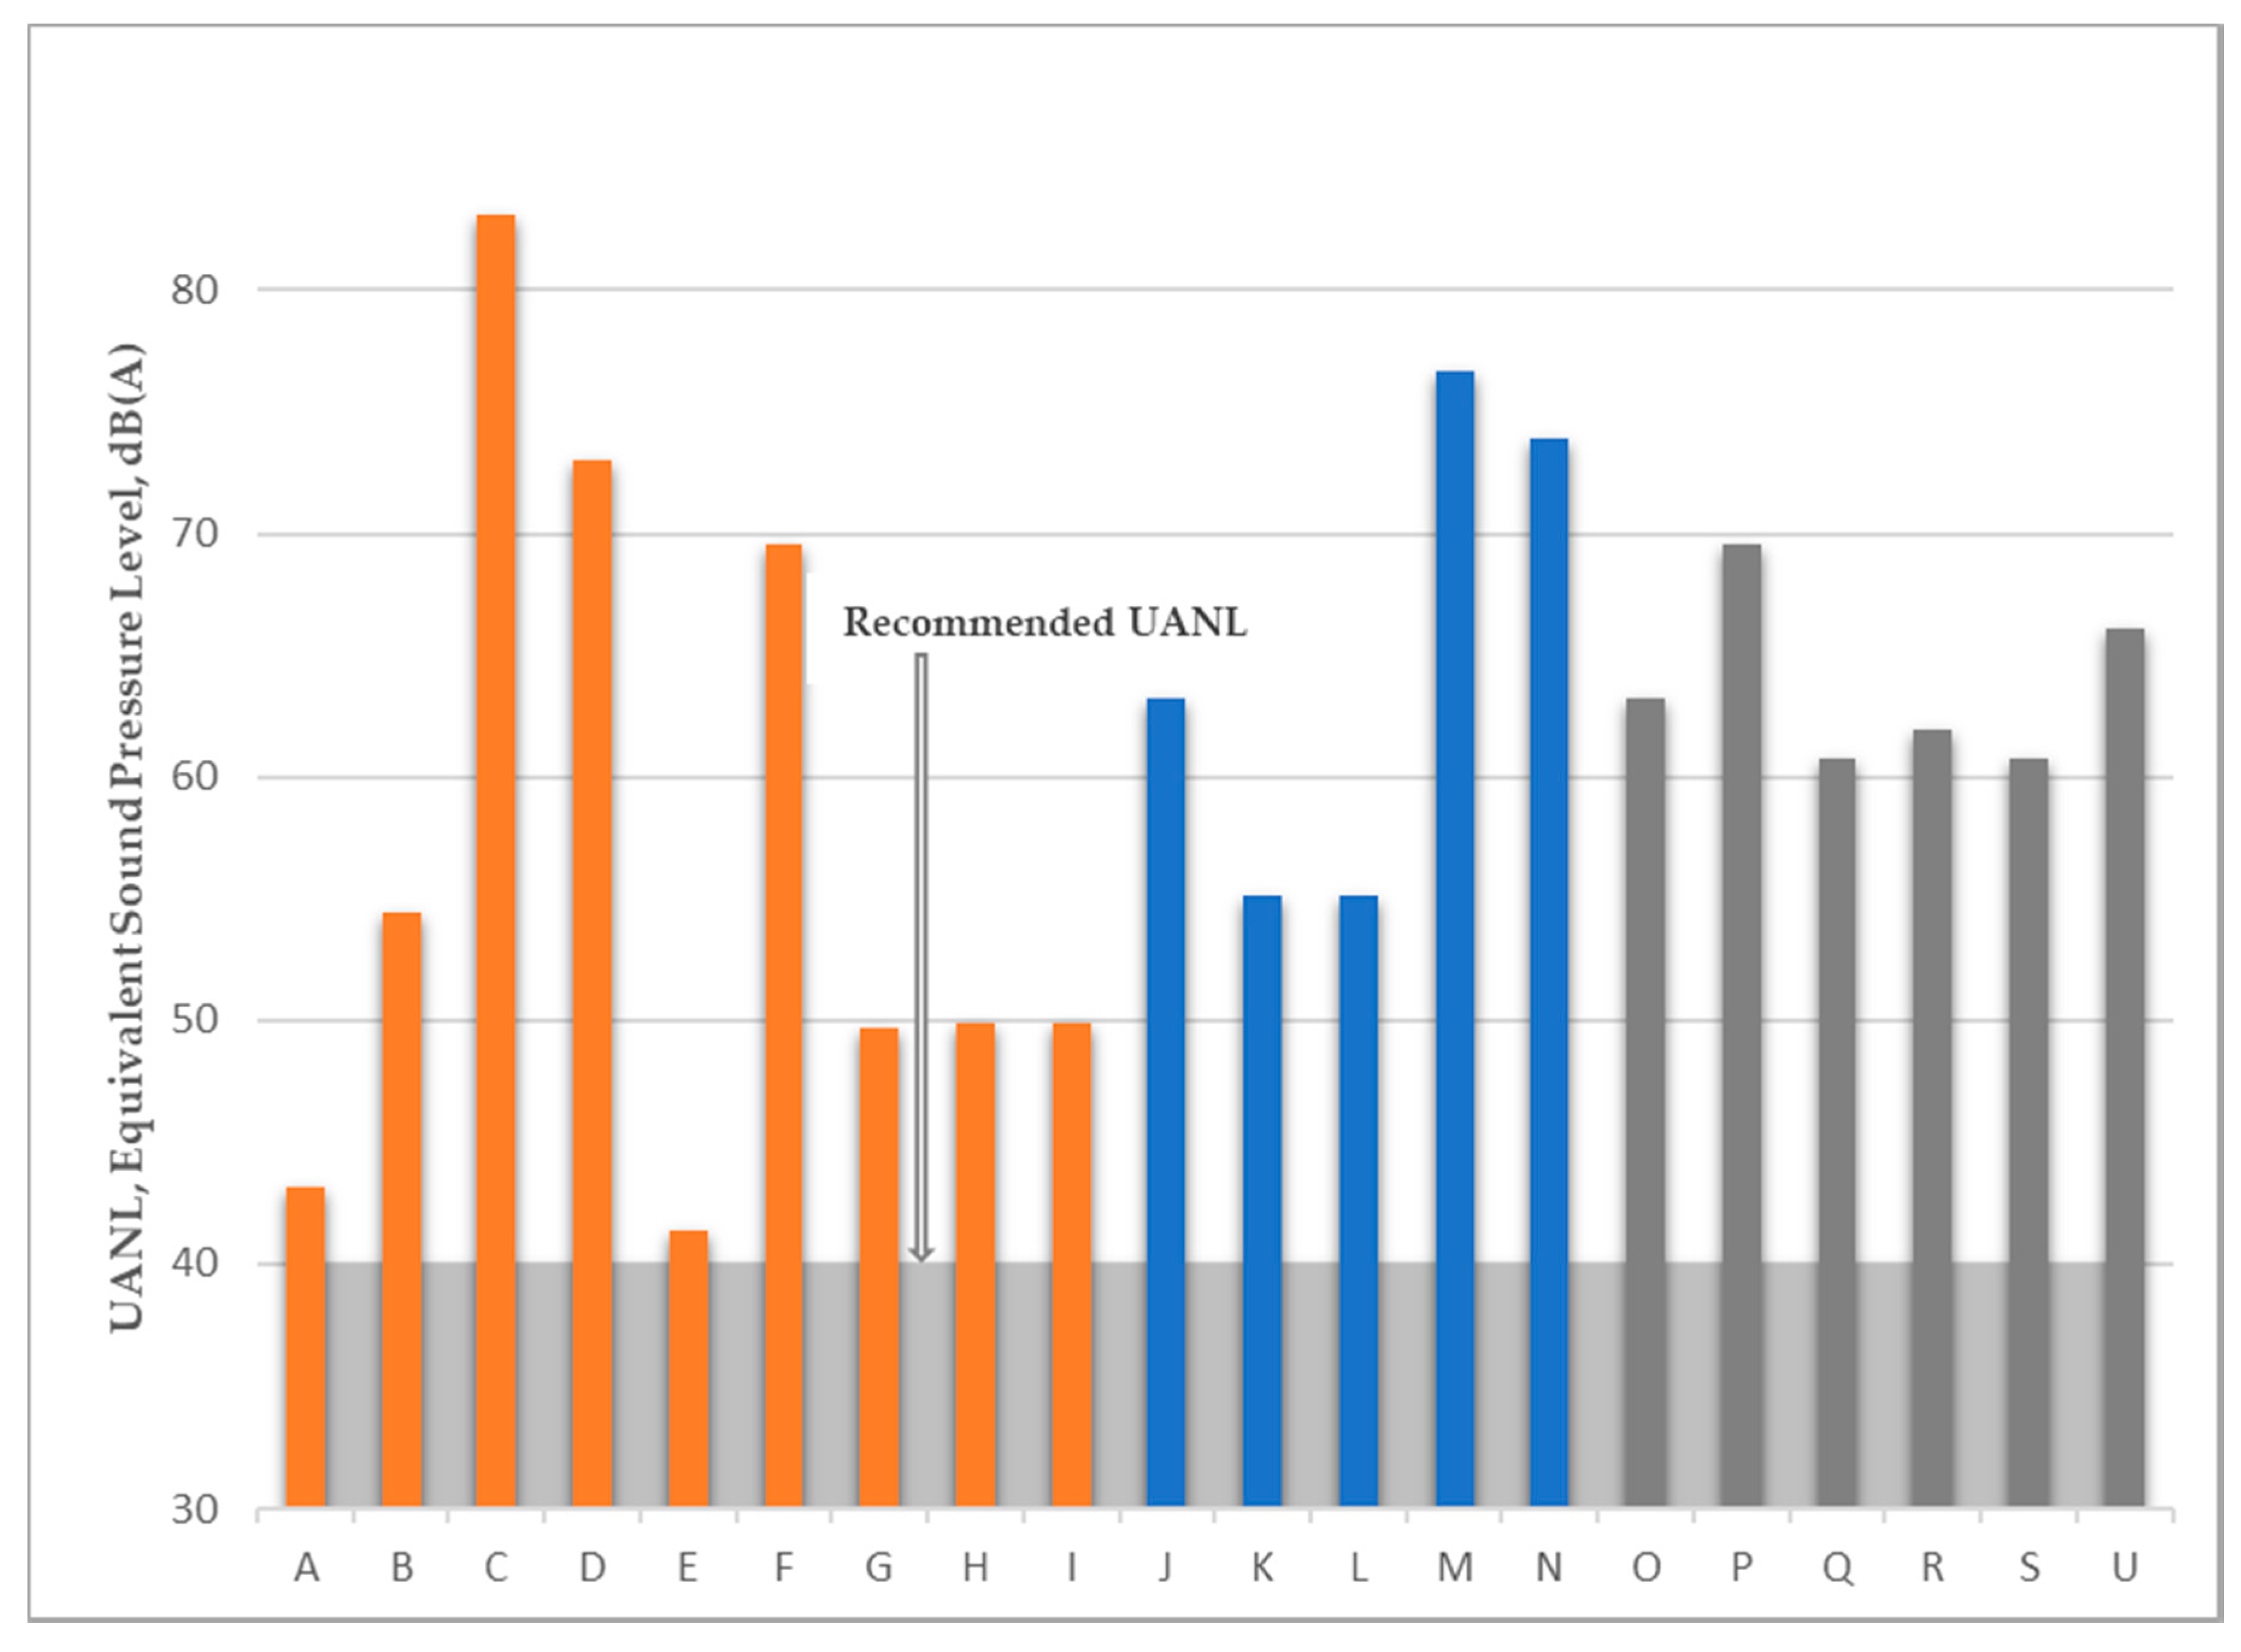
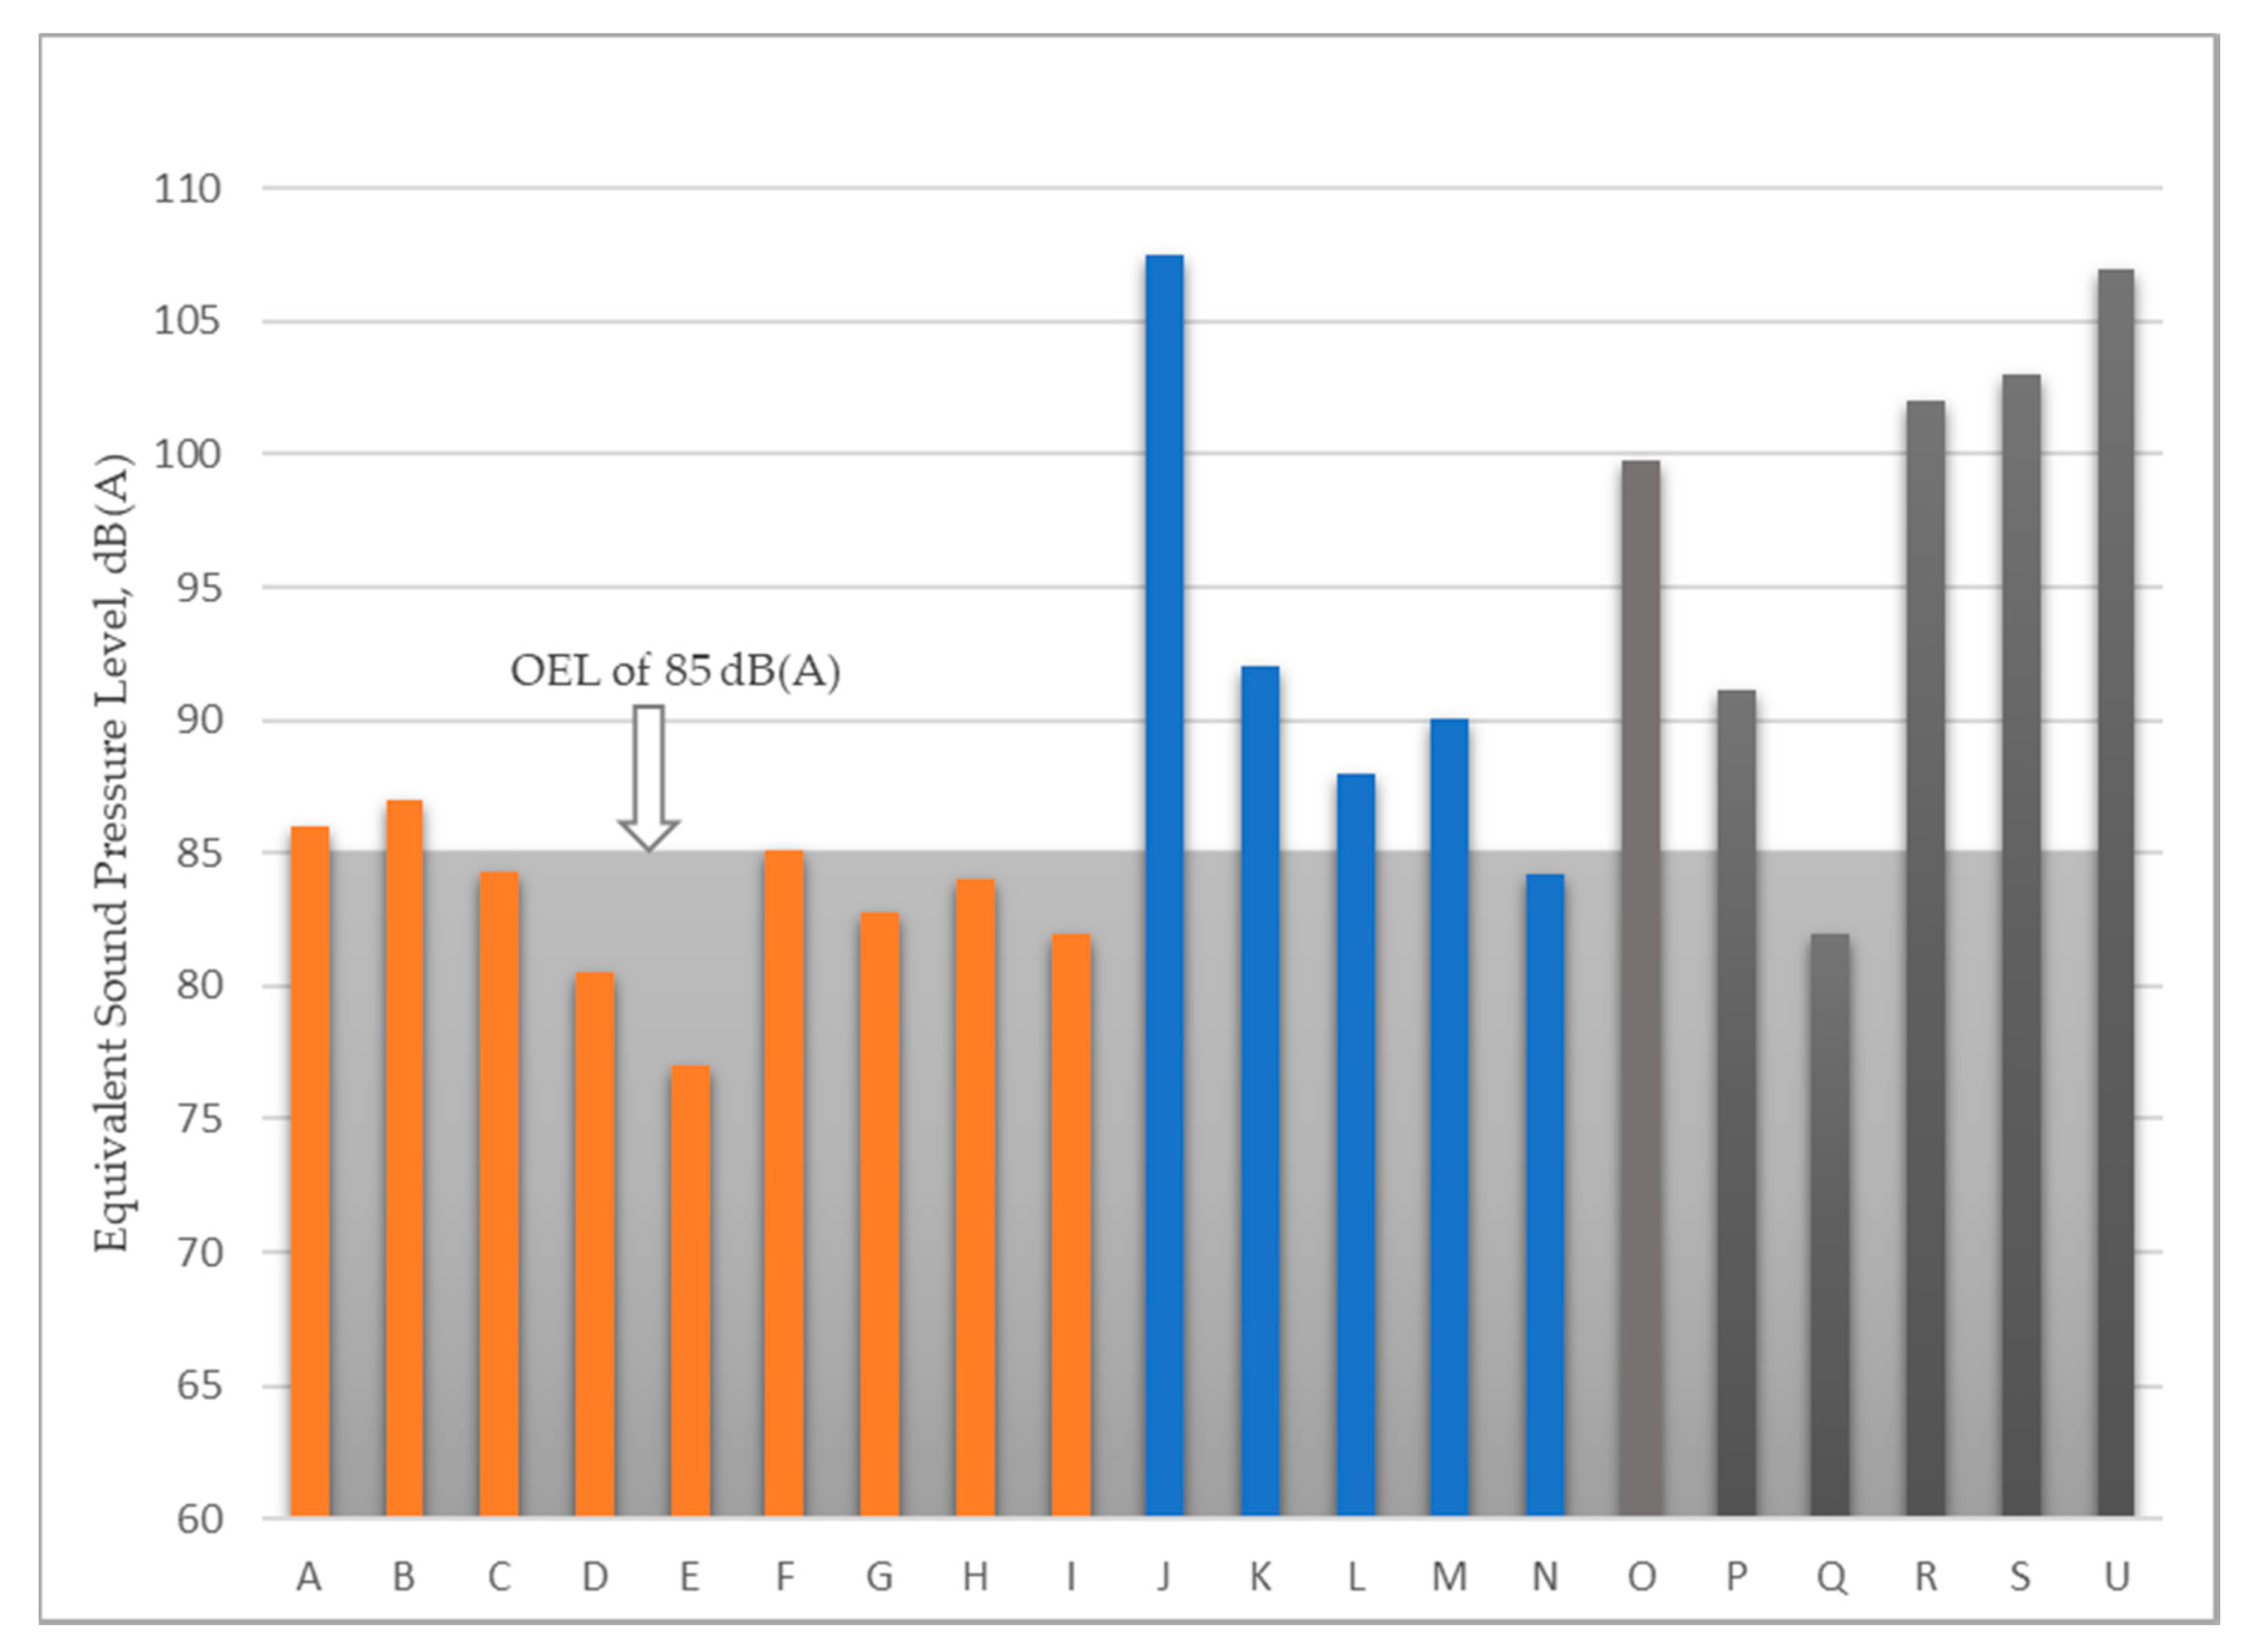
3.1. Noise Levels and Noise Exposure

The results of the indoor ambient noise levels, that is, the A-weighting equivalent continuous sound pressure level (LA,eq) measured in IS & G halls over 30 min, are shown in Table 3. As shown in the table, the ambient noise level range was 42.0–83.0 dB(A), with an average of 58.0 dB(A). Comparing the indoor ambient noise levels for IS & G halls with the recommended indoor ambient noise levels (40.0 dB(A)) illustrated in Table 4, which were introduced by BB [1], it was found that ambient noise levels in all studied indoor sports and gymnasium halls were not in agreement with the recommended unoccupied ambient noise level (UANL) [1]; this finding is also clearly illustrated by Figure 4. In comparison with another study conducted in three gymnasia and sports center in China [54], the LA,eq for background noise ranged between 50.0 and 60.0 dB(A). Internal ambient noise levels (background noise arising from external sources and building services), which were measured in unoccupied IS & G halls, were affected by noise coming from streets, because most of the IS & G halls are located on main streets and the walls are not insulated. According to [57], the average of equivalent sound pressure levels at different sites of main streets in Amman, Jordan during the daytime and evening ranged from 67 to 75.5 dB(A), and the maximum equivalent sound pressure level measured during the daytime and evening was 103.0 and 72.0 dB(A), respectively.
National Institute for Occupational Safety and Health (NIOSH) established the recommended exposure level (REL) for occupational noise exposure to be 85 decibels, with A-weighted decibels (dB(A)) as an 8 h time-weighted average [35]. Exposure equal to or above this level is considered hazardous. The REL is based on exposure at work 5 days per week and assumes that the individual spends the other 16 h of the day and weekends in quieter conditions. Importantly, the NIOSH REL is not meant to be used to protect against general environmental or recreational noise; it does not account for noisy activities or hobbies outside the workplace (such as hunting; using power tools; listening to music with earbuds; playing music; or attending sporting events, movies, and concerts), which may increase the overall risk for hearing loss. By comparison, the environmental noise limit as recommended by the Environmental Protection Agency [58] is 70.0 dB(A) over 24 h (75.0 dB(A) over 8 h).
In the same manner as NIOSH, JAC also specifies a maximum allowable daily noise dose, expressed as a percentage [38]. For example, a person continuously exposed to 85.0 dB(A) over an 8 h work shift will reach 100% of the daily noise dose. The exchange rate or equal-energy rule is that, for every 3.0 dB(A) increase in noise level, the allowable exposure time is reduced by half; alternatively, for every 3.0 dB(A) decrease in noise level, the allowable exposure time is doubled. A peak noise level of 135.0 dB(C) was used as the lower action value, which is also used by the European Union and the United Kingdom for peak sound pressure [37]. It is worth mentioning that most IS & G centers operate 6 days per week, with some operating 7 days per week. Shaikh et al. [59] explained that many businesses in developing countries operate 8 h per day, 6 days per week, that is, 48 h per week.
The results of activity noise levels, LA,eq, over 50 min during the workout sessions are shown in Table 3. In this study, the LA,eq measured during workout lessons is quite variable, reaching values between 80.0 and 110.5 dB(A). This is considered high in comparison with a sample study conducted in Italy [15], which was conducted on 15 gymnasia and 3 swimming pools. They observed that the LA,eq measured for 1 h during different lessons varied between 70.0 and 87.0 dB(A). A study conducted in China [54] demonstrated that the LA,eq of the activity noise varied between 63.0 and 70.0 dB(A). In another study [60], occupational noise exposure from indoor arena hockey games was studied, and the average sound equivalent levels ranged from 81.0 to 97.0 dB(A). The average of activity noise level LA,eq at IS & G halls is 92.6 dB(A).
The daily noise dose exposure percentage for the 50 min workout session and daily noise dose exposure percentage for 3 h are listed in Table 3. From the mentioned measurements, the personal daily dose, A-weighting LEX, 8 h in dB(A), was calculated and is presented in the table. Evaluating the data from the field survey, it was found that instructors working in 40% of the studied IS & G halls receive a daily noise dose exceeding 100%. The instructors in IS & G halls are exposed to an average personal daily dose (LEX, 8 h) of 89.8 dB(A), ranging between 80.5 and 107.5 dB(A). Previous studies [15] have shown that 20–25% of instructors could achieve weekly noise exposure higher than 80.0 dB(A). The results from our study are well above these values and show a higher risk of exposure to occupational noise. The results for personal daily dose A-weighting (LEX, 8 h) are shown in Figure 5. Evaluating the personal daily dose, referring to JAC [38], it was found that 90% of measurement results were above the OEL of 85.0 dB(A). Applying the limit action values in the Physical Agents (Noise) Directive (Table 5) [37], about 15% of the studied IS & G halls have a lower exposure action value, 30% have an upper noise exposure action value, and 55% have a noise exposure limit value. In a previous study [15], it was found that a weekly noise exposure(LEX, w) higher than 80.0 dB(A) occurs when the number of users is more than 30, time exposure is 25 h or more per week, and reverberation time is more than 5 s.

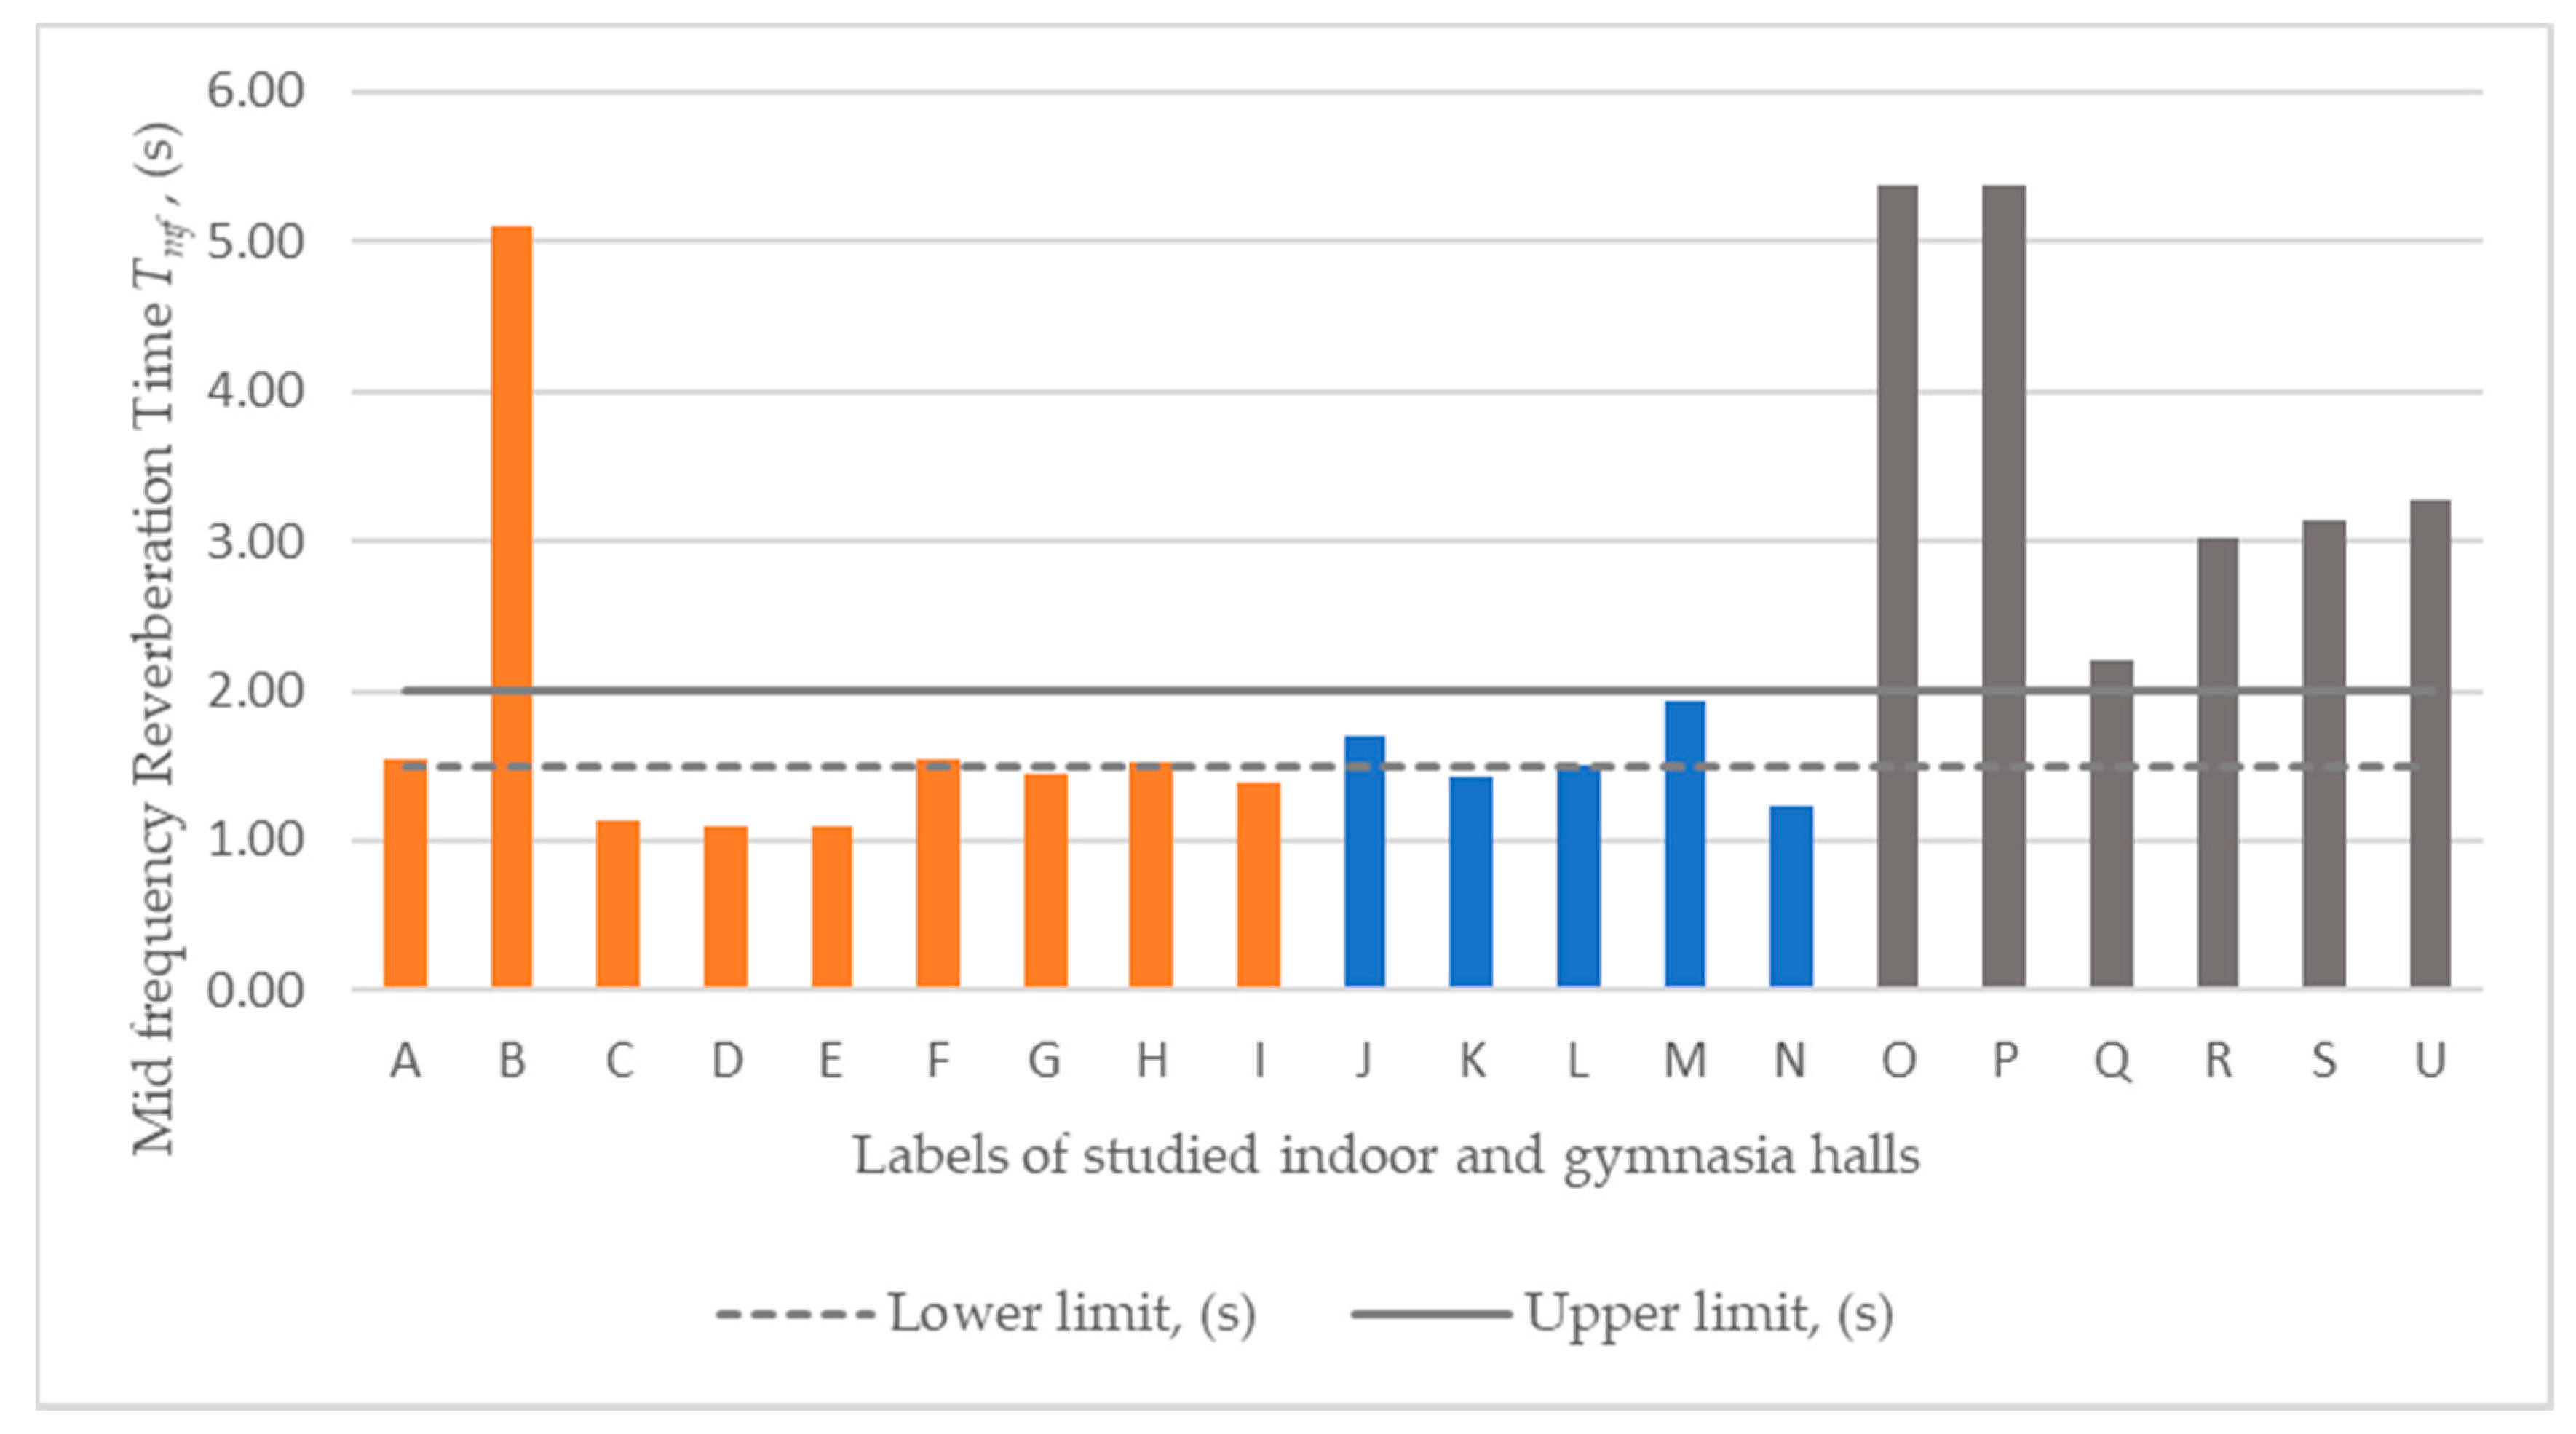
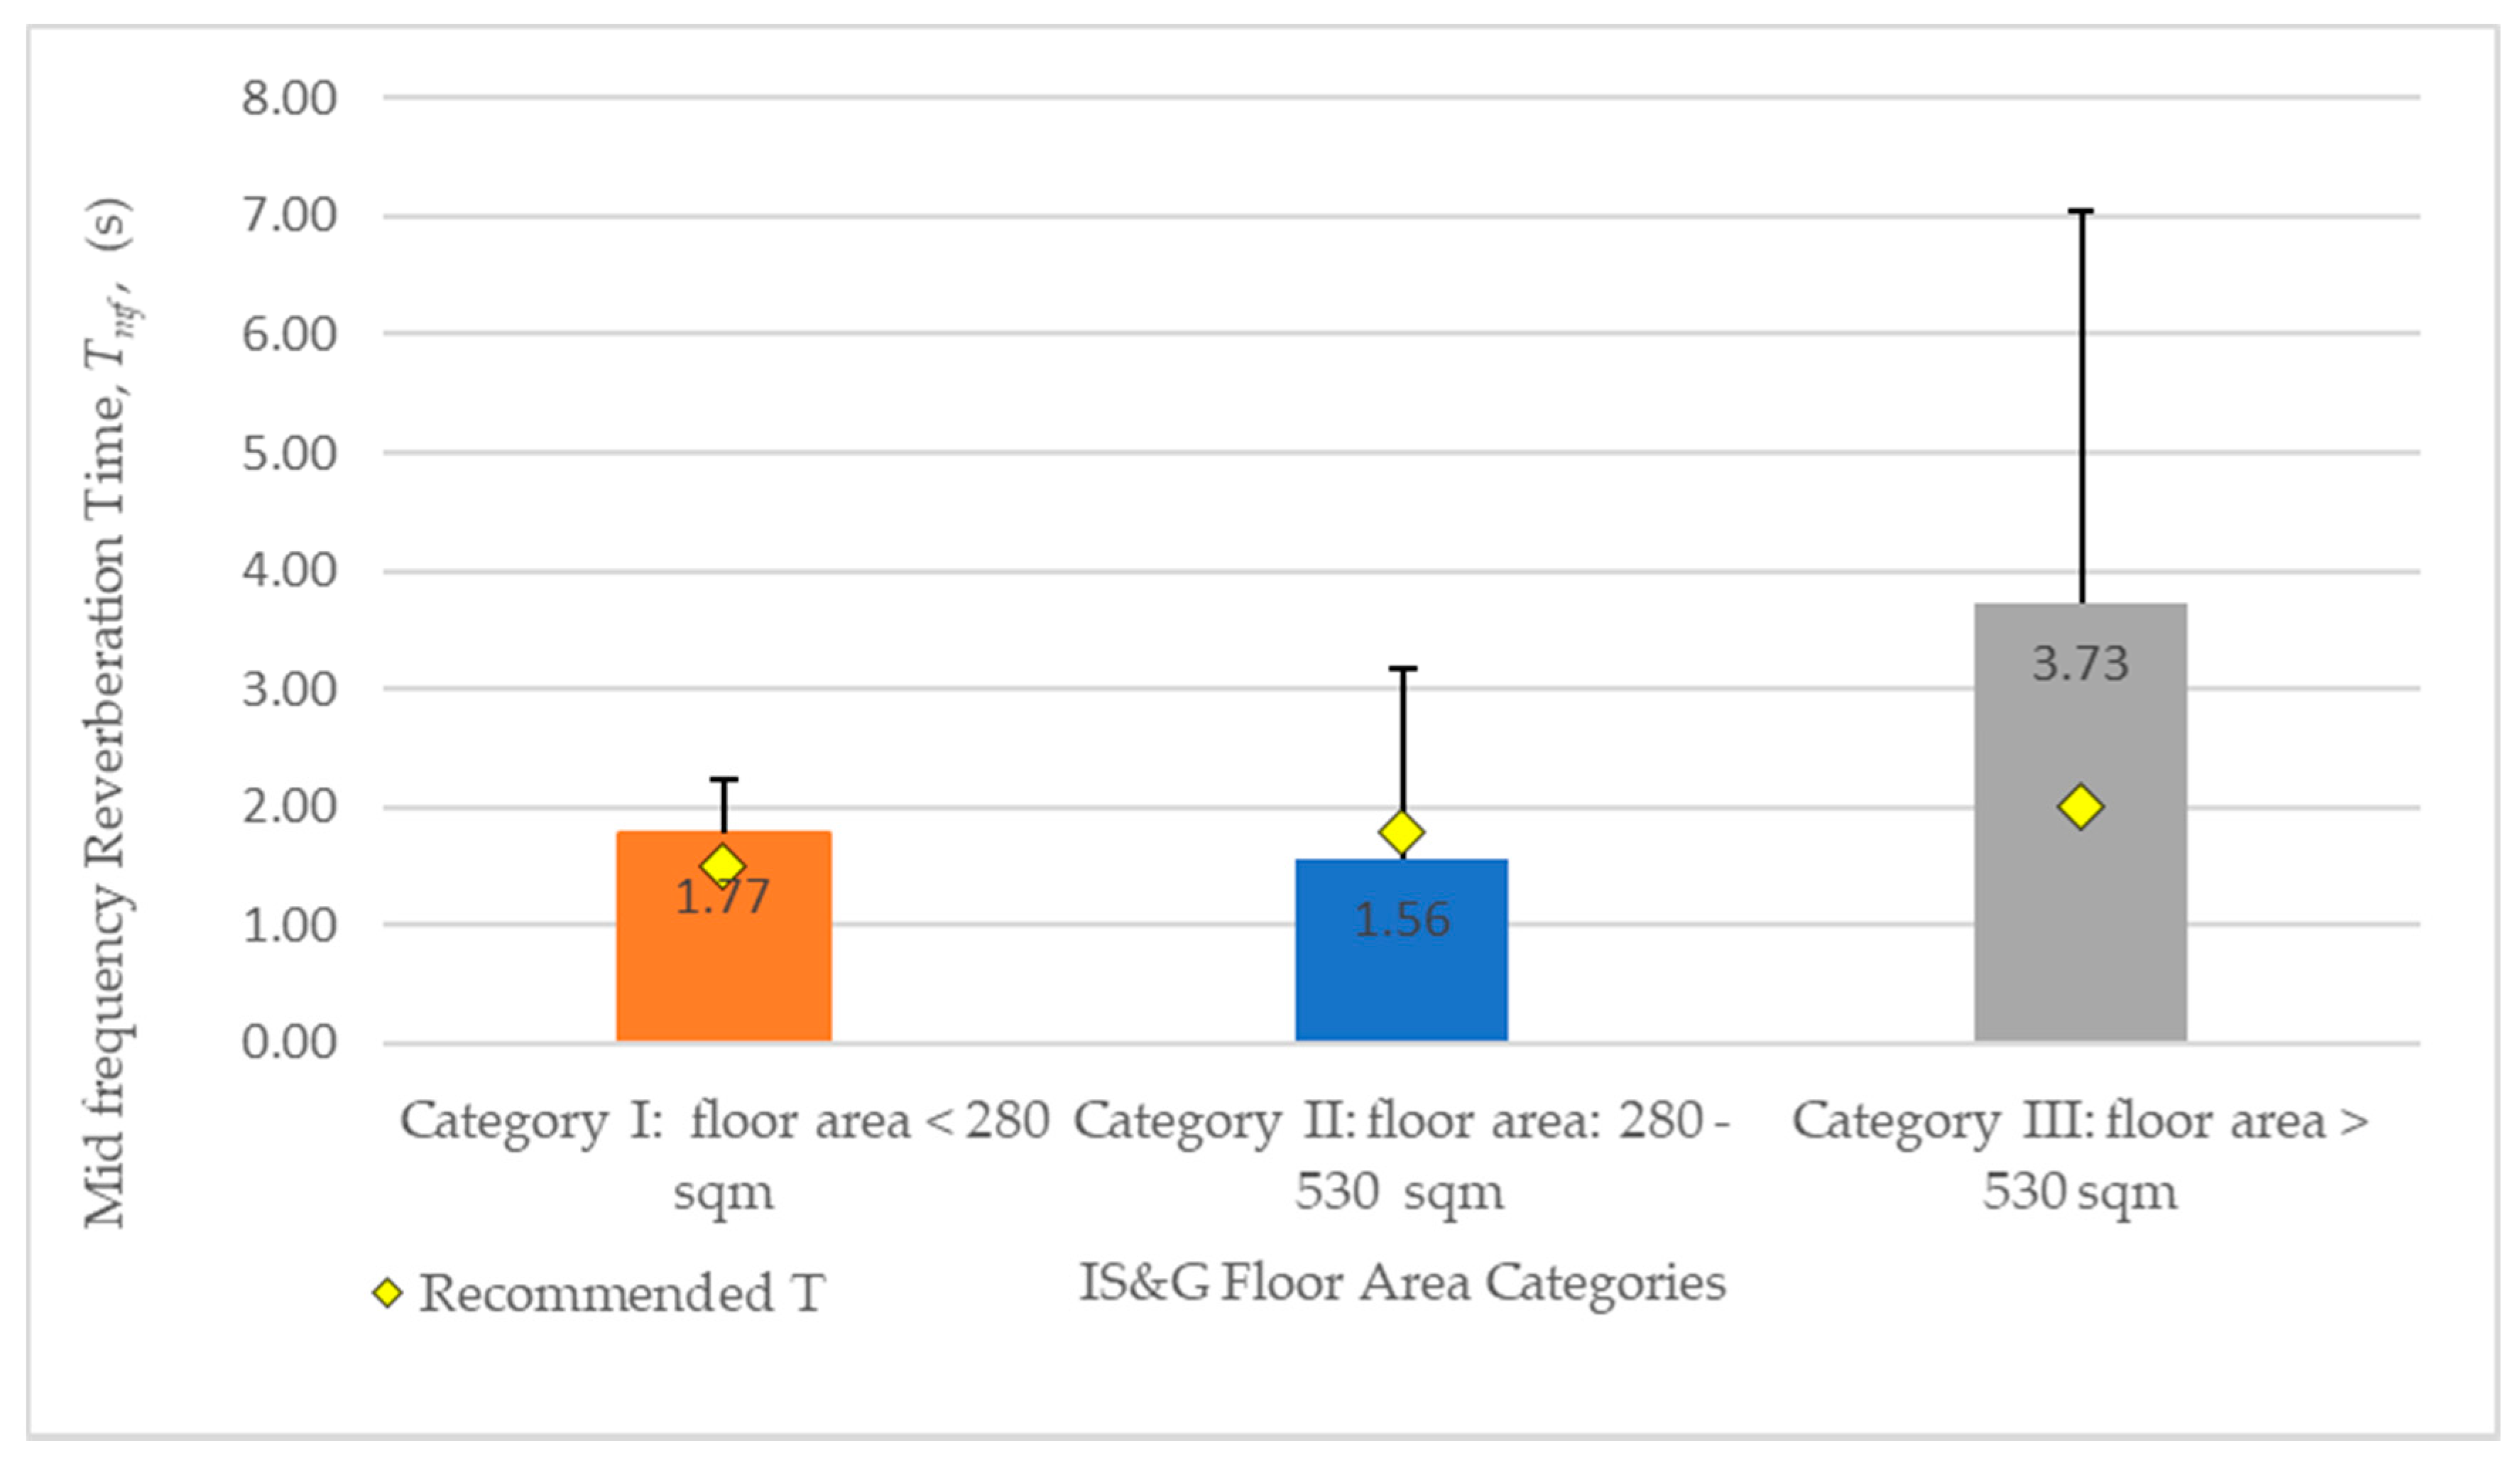
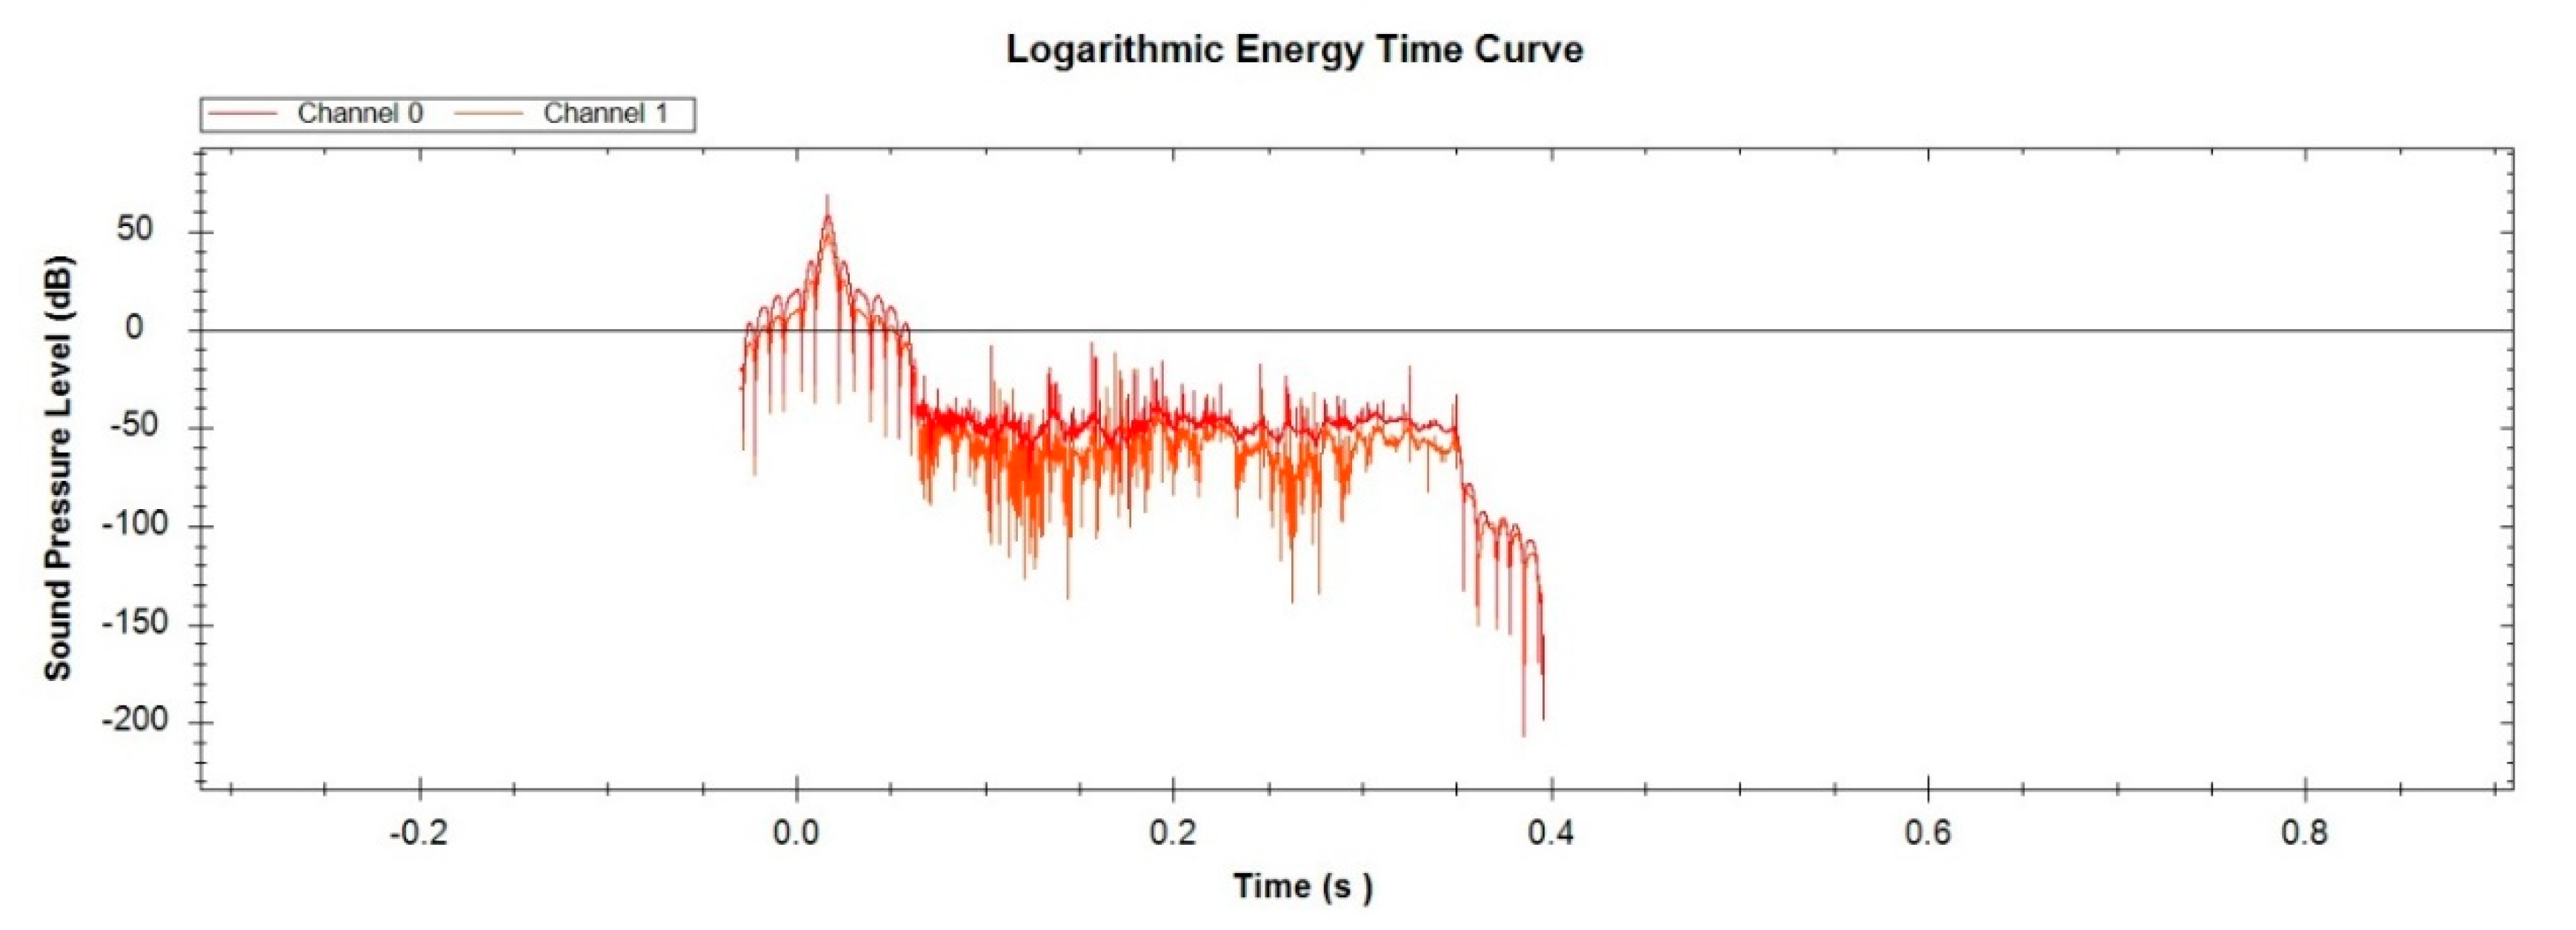
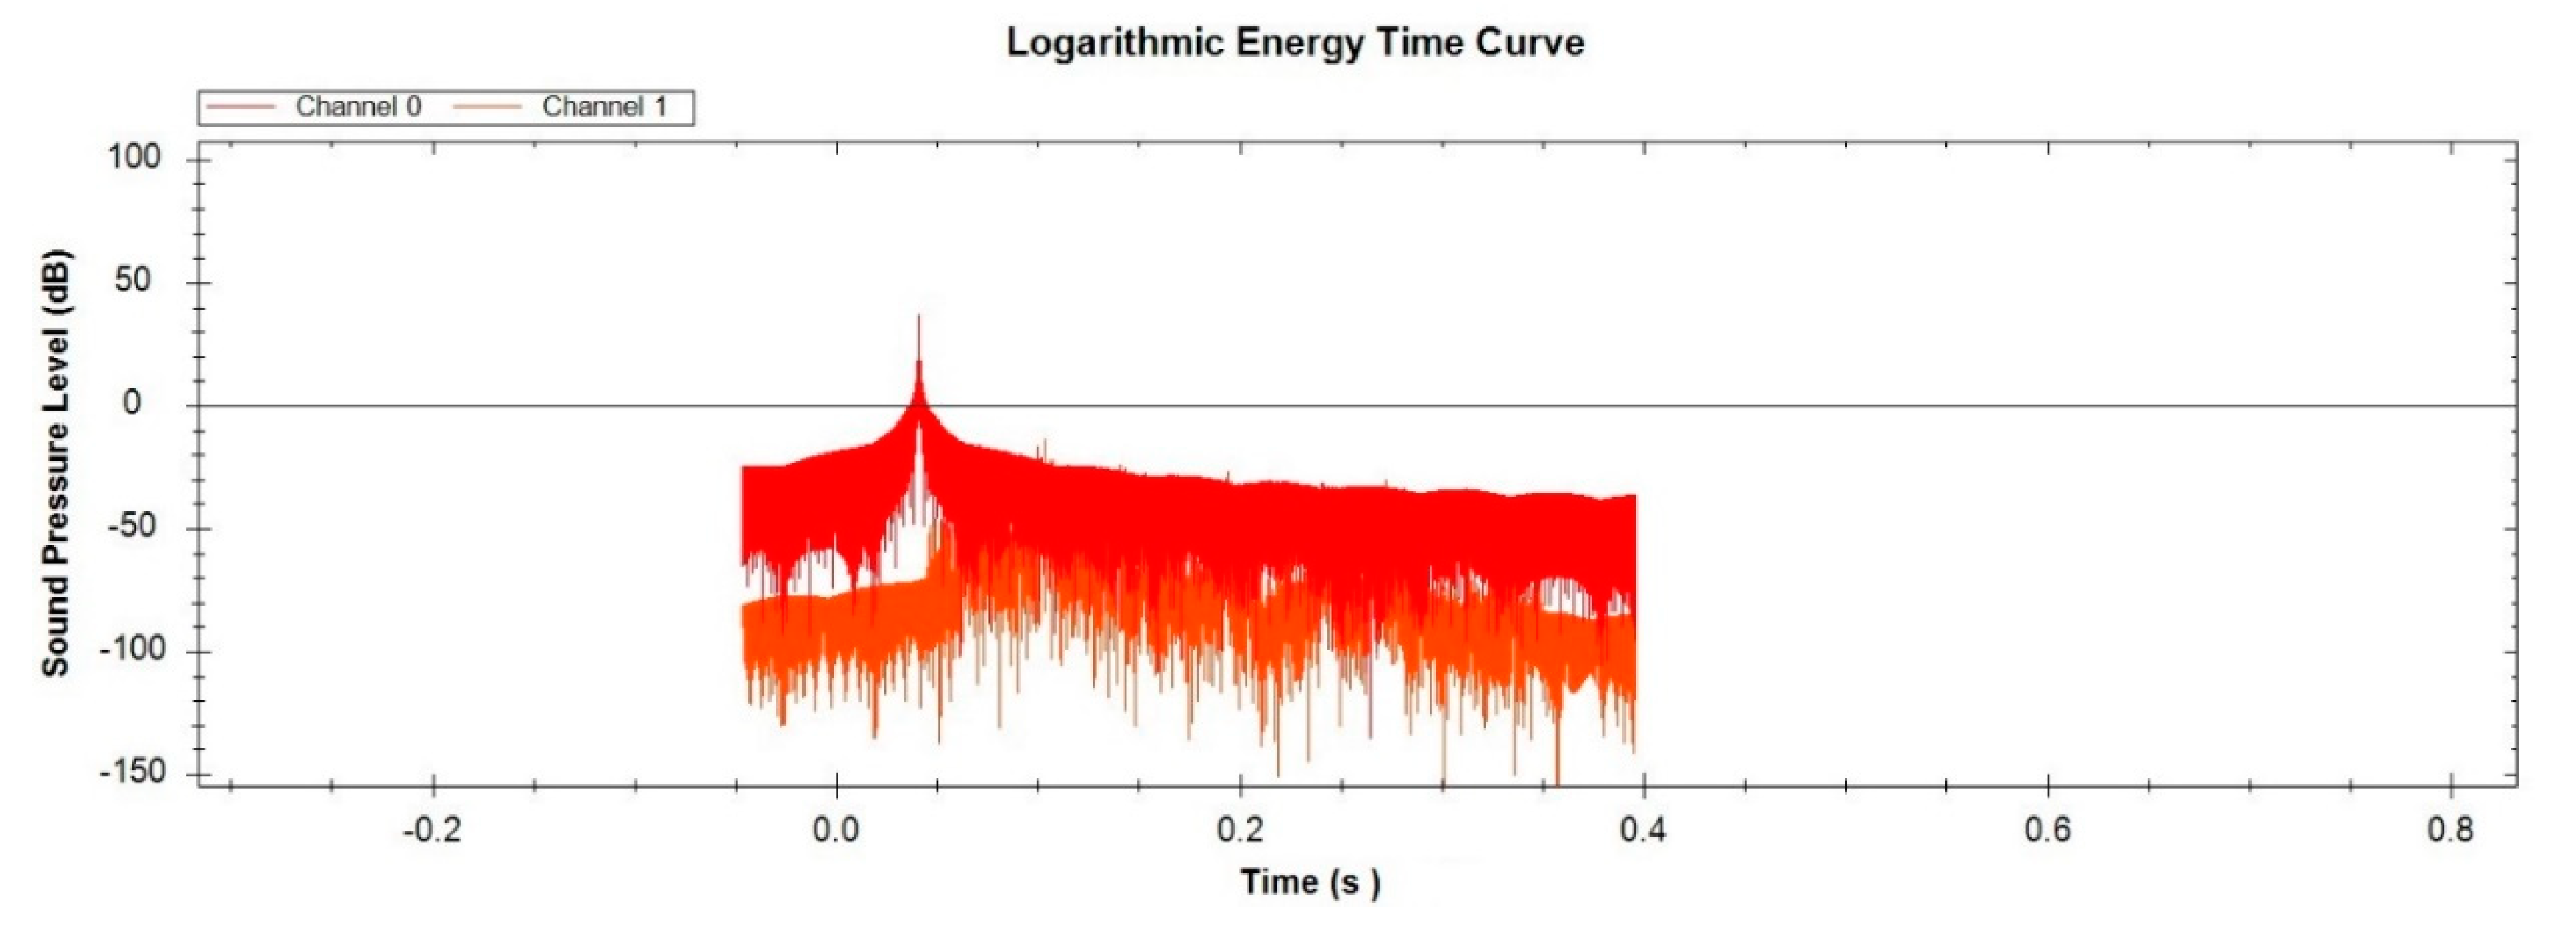
3.2. Reverberation Time

Recommended mid-frequency reverberation times, Tmf, were introduced by BB [1] as a function of floor area. They are illustrated in Table 6 and were used as a reference to evaluate the Tmf results of the fitness gyms obtained in this study. In BB, it is notable that the maximum Tmf for sports halls is reduced from 2 s for halls with floor area greater than 530 m2 to 1.5 s for those with floor area less than 280 m2.
For halls with a floor area range of 280–530 m2, the recommended mid-frequency reverberation time should be calculated. The measured reverberation time in all IS & G halls is shown in Table 7. The mid-frequency reverberation time Tmf values were calculated as the arithmetic means of respective reverberation times at frequencies of 500, 1000, and 2000 Hz. In general, considering all categories, it was found that 40% of the studied IS & G halls meet the criteria, 25% of the studied IS & G halls marginally meet the criteria, and 35% of the studied IS & G halls exhibit excessive Tmf.
The mid-frequency reverberation time measured in IS & G halls ranged from 1.09 to 5.38 s. The comparison between the measured mid-frequency reverberation time of IS & G halls with lower and upper limits of recommended Tmf according to [1] is shown in Figure 6. The lower limit of recommended Tmf is for Category I and upper limit of recommended Tmf is for Category III. As shown by the figure, 55% of the IS & G halls in Category I (orange) comply with the recommended specifications [1] compared with 78% of the halls in Category II (blue). However, 83% of the halls in Category III (grey) exceed the recommended reverberation time and do not comply with the BB specifications [1]. The lack of acoustic treatment in the vertical and horizontal directions (interior walls, floor, and ceiling) causes poor acoustic performance; adding soft materials can help, but does not solve the reverberant noise problem. Although hall Q in Category III had the greatest area in the category, it met the criteria because it has an acoustically absorbent ceiling. The recommended mid-frequency reverberation time for gymnasium halls in Category II is calculated according to BB [1]. For this category, all of the halls met the recommended Tmf. This is because the gymnasiums’ floors are covered with material characterized by a high absorption coefficient, for example, foam or vinyl, or the gymnasium has a low relative height, resulting in moderate volume because these buildings were rehabilitated to be used as gymnasia and were previously used for other purposes. The shorter reverberation times can be attributed to small volume and absorbent room surfaces. Reverberation time contributes to speech intelligibility and reverberation times above 1 s produce a loss in speech discrimination and make speech perception more difficult and strained [61,62]. The average of measured mid-frequency reverberation time, Tmf, values (average + standard deviation) for IS & G halls in the three categories compared with recommended Tmf is shown in Figure 7.

3.3. Cases-Study Simulation Application

The results of the simulation application of the studied IS & G halls (single case-study) are illustrated in Figure 8 and Figure 9. Figure 8 shows the energy time curve (ETC) of the untreated hall, while Figure 9 shows the ETC of the treated hall. ETC shows a decay of sound energy, where each peak after the direct sound represents a reflection. The level of reflections relative to the direct sound, and the time it takes the sound to decay within the hall, can be figured out from ETC. Figure 8 shows that the level changes over time, with each peak being attributable to a reflection from a nearby boundary such as the floor, ceiling, or side walls. Meanwhile, in Figure 9, most of these peaks vanished owing to the addition of sound absorptive panels.
Visualizations of sound pressure level using the 3D Smart Particle System are shown in Figure 10, where the impact of the addition of the absorptive panels on ceiling and walls causes the unwanted reflections to be substantially suppressed and no longer contribute to the sound field.
The results from this single case-study simulation application demonstrate that the room acoustic quality has been improved by the addition of the absorptive material. A study conducted on meeting rooms [3] showed the impact of adding absorptive material on the improvements of room acoustic quality, as in this study. In similar study [63], the addition of the absorptive panels improved the subjective perceived speech quality.

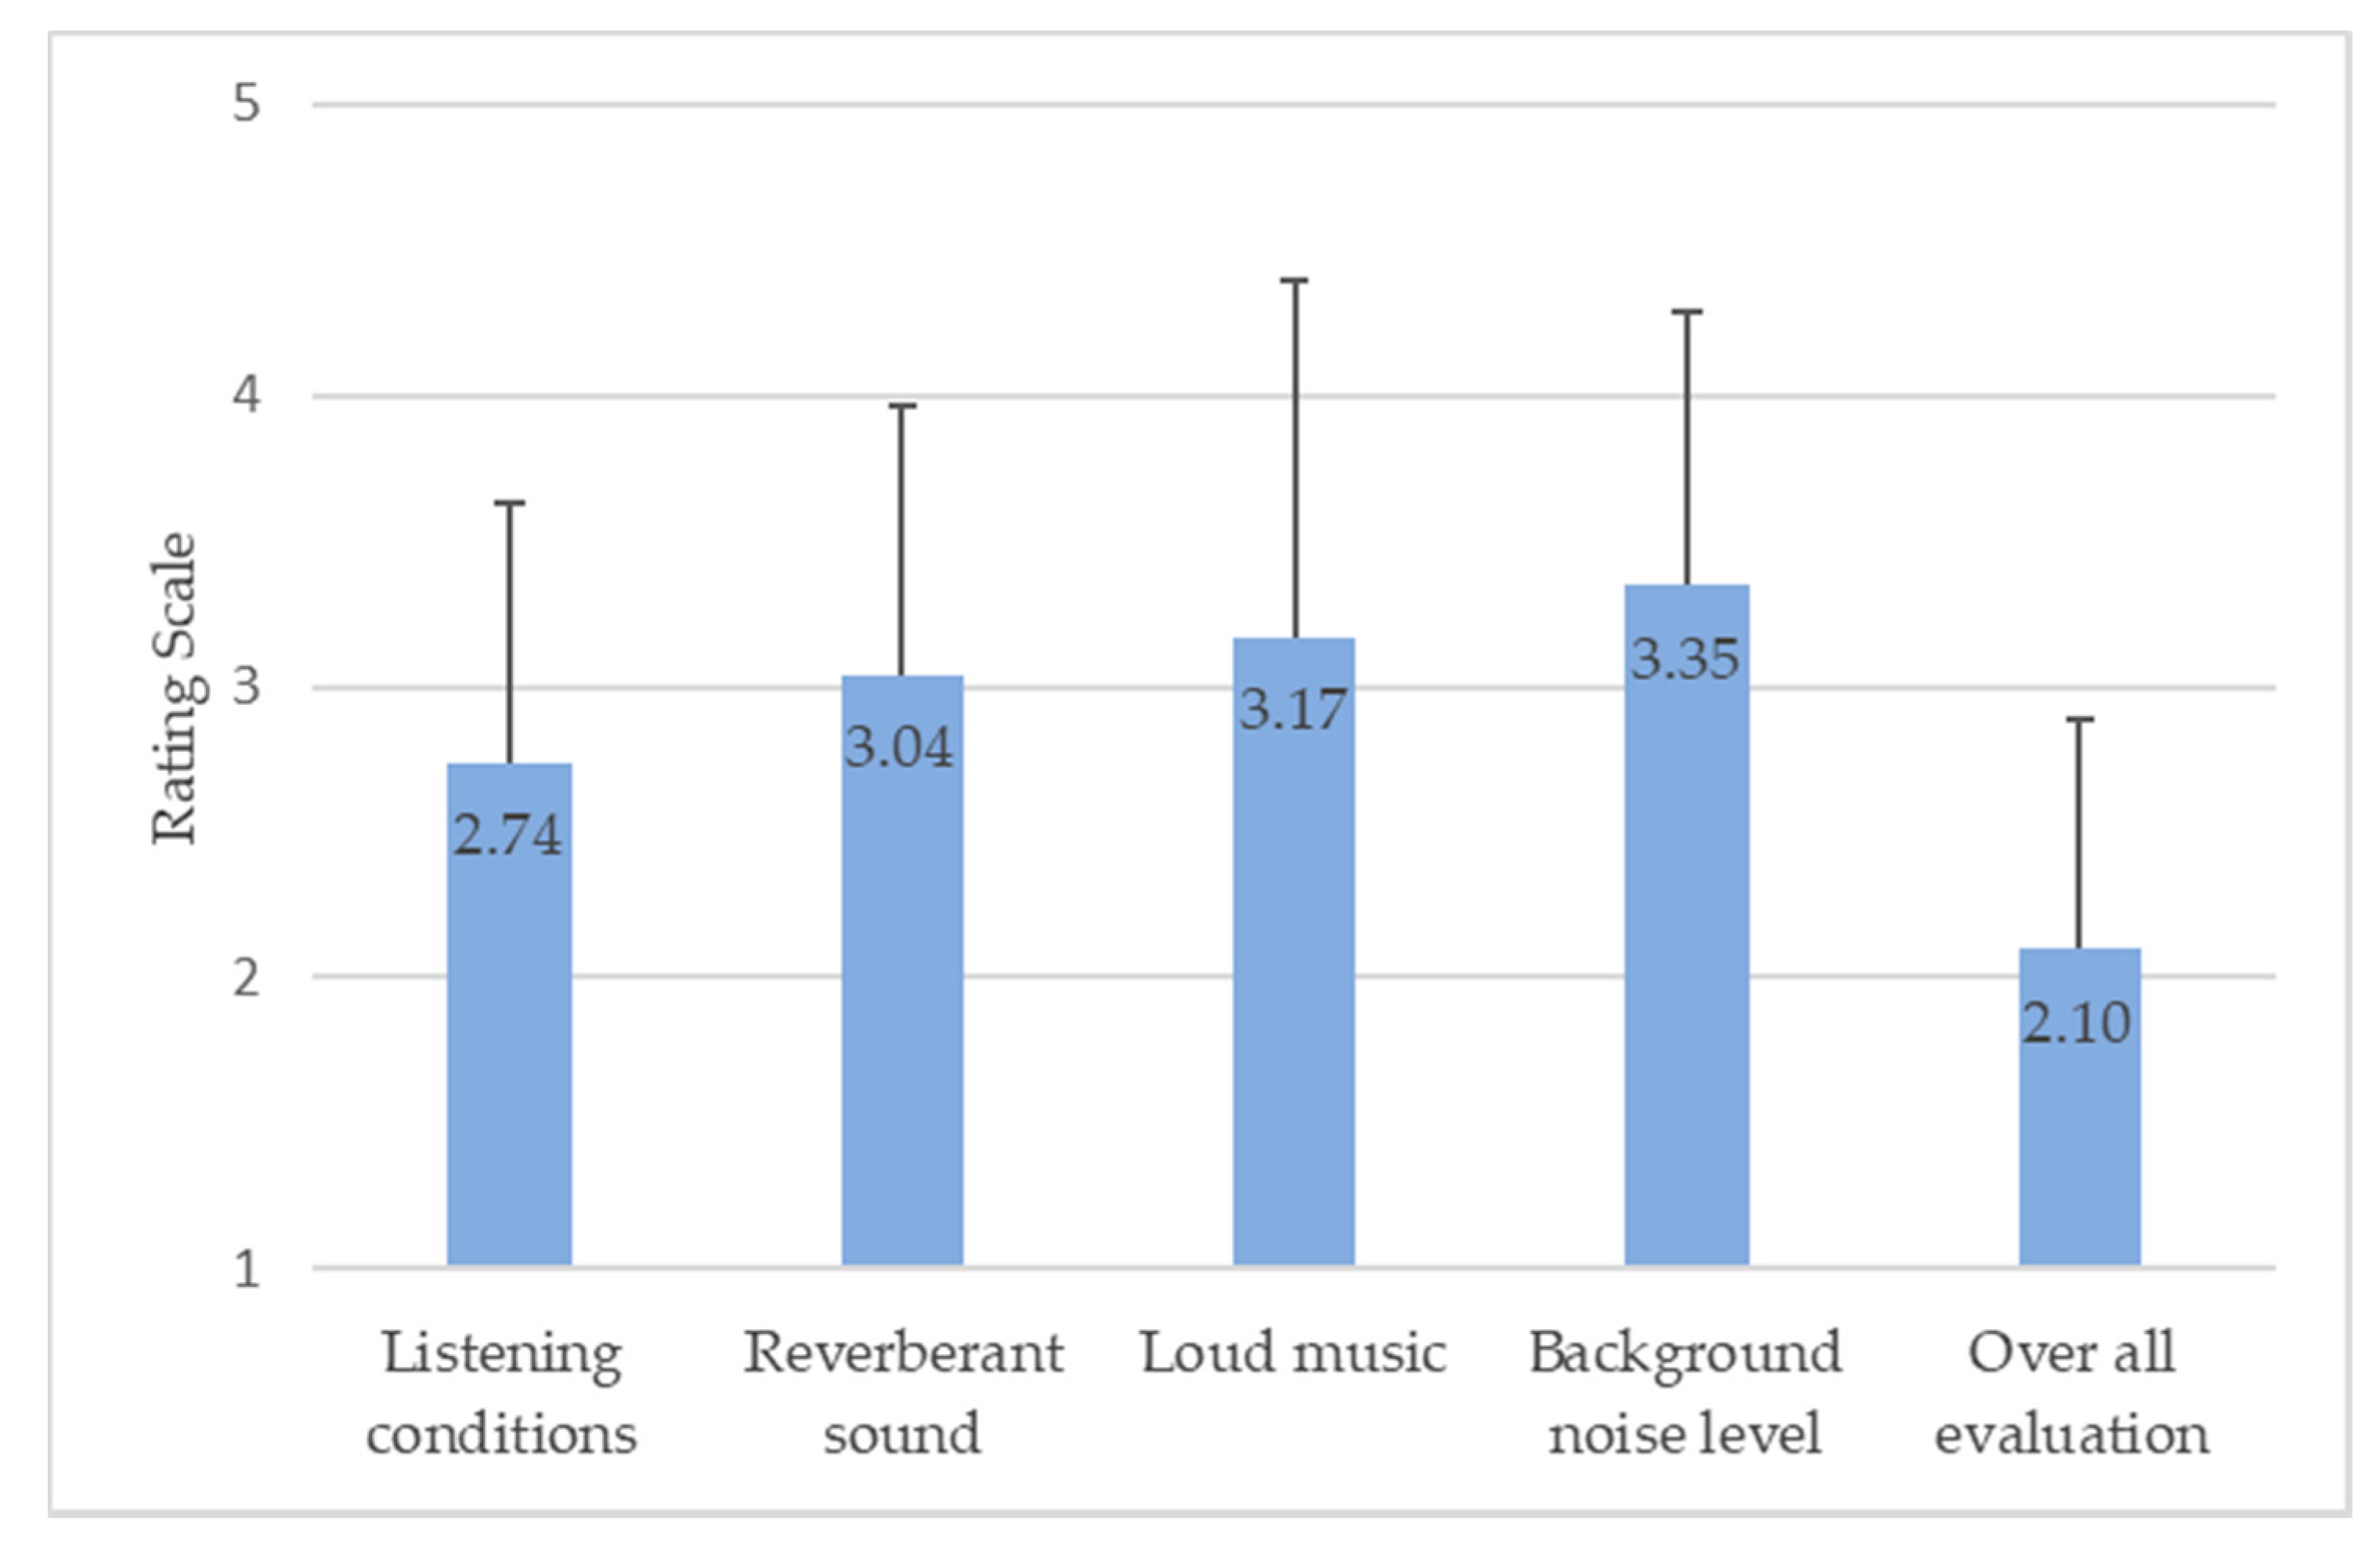
3.4. Subjective Evaluation of IS & G Acoustics

The questionnaire was filled out by 401 subjects visiting IS & G halls, none of whom suffered from hearing problems based on their own report. The group was divided into 210 men (52.4%) and 191 women (47.6%). The sample consisted of 137 instructors (34.2%) and 264 participants (trainees) (65.8%); the instructors’ average working time in the gym was 4.0 h daily and the trainees’ average time spent in the gym was 2.0 h daily. The instructors at IS & G halls delivered an average of three workout lessons per day, while spending 4 h on average at the gymnasium; participants attended the gymnasium for 2 h per day on average. Instructors spent an average of 24 h per week in fitness classes; in addition, 30% performed other work that involved noise exposure most of the time for an average of 27 h per week, thus extending their daily load and noise exposure.
The results related to user satisfaction with the acoustic conditions in the IS & G halls are shown in Figure 11. As shown in the figure, the average rating of the parameters (listening conditions, reverberant sounds, music loudness, and background noise level) ranged from 2.74 to 3.35, which belongs to the fair rating. However, the figure shows that the overall acoustic environment in the fitness hall was comfortable (2.10). Regarding activity and ambient noise levels, Table 3 and Figure 4 and Figure 5 clearly illustrate that the values exceeded the internationally recommended limits; however, this is not reflected in the subjective evaluation. These results correspond to a study conducted in Jordan of young adults’ awareness of hearing problems [64]. The study has shown that 35.9% of subjects considered hearing loss as not a significant problem or no problem at all, and only 10% used earplugs to protect their ears from loud sounds. These results clearly indicate a lack of concern about hearing and hearing problems.
When comparing the responses of instructors with those of participants, it can be noted that there is a significant difference in their evaluation of overall acoustical comfort (p < 0.01); instructors tended to rate the acoustic environment as more fair (2.52), while participants rated it as comfortable (1.88). This could be related to the time each group spends in the gym, which is longer for instructors (4 h on average) than for participants (2 h on average), which exposes them to loud sounds for a longer time. The instructors consider loud music in the gym as a motivating factor during training sessions; however, the participants’ opinion differs significantly (p < 0.01), considering it to be a stress factor. In the remainder of the questions, there were no significant differences between the two groups (p > 0.05), as shown in Table 7. A comparison between the answers of male and female subjects showed no significant differences in their responses.

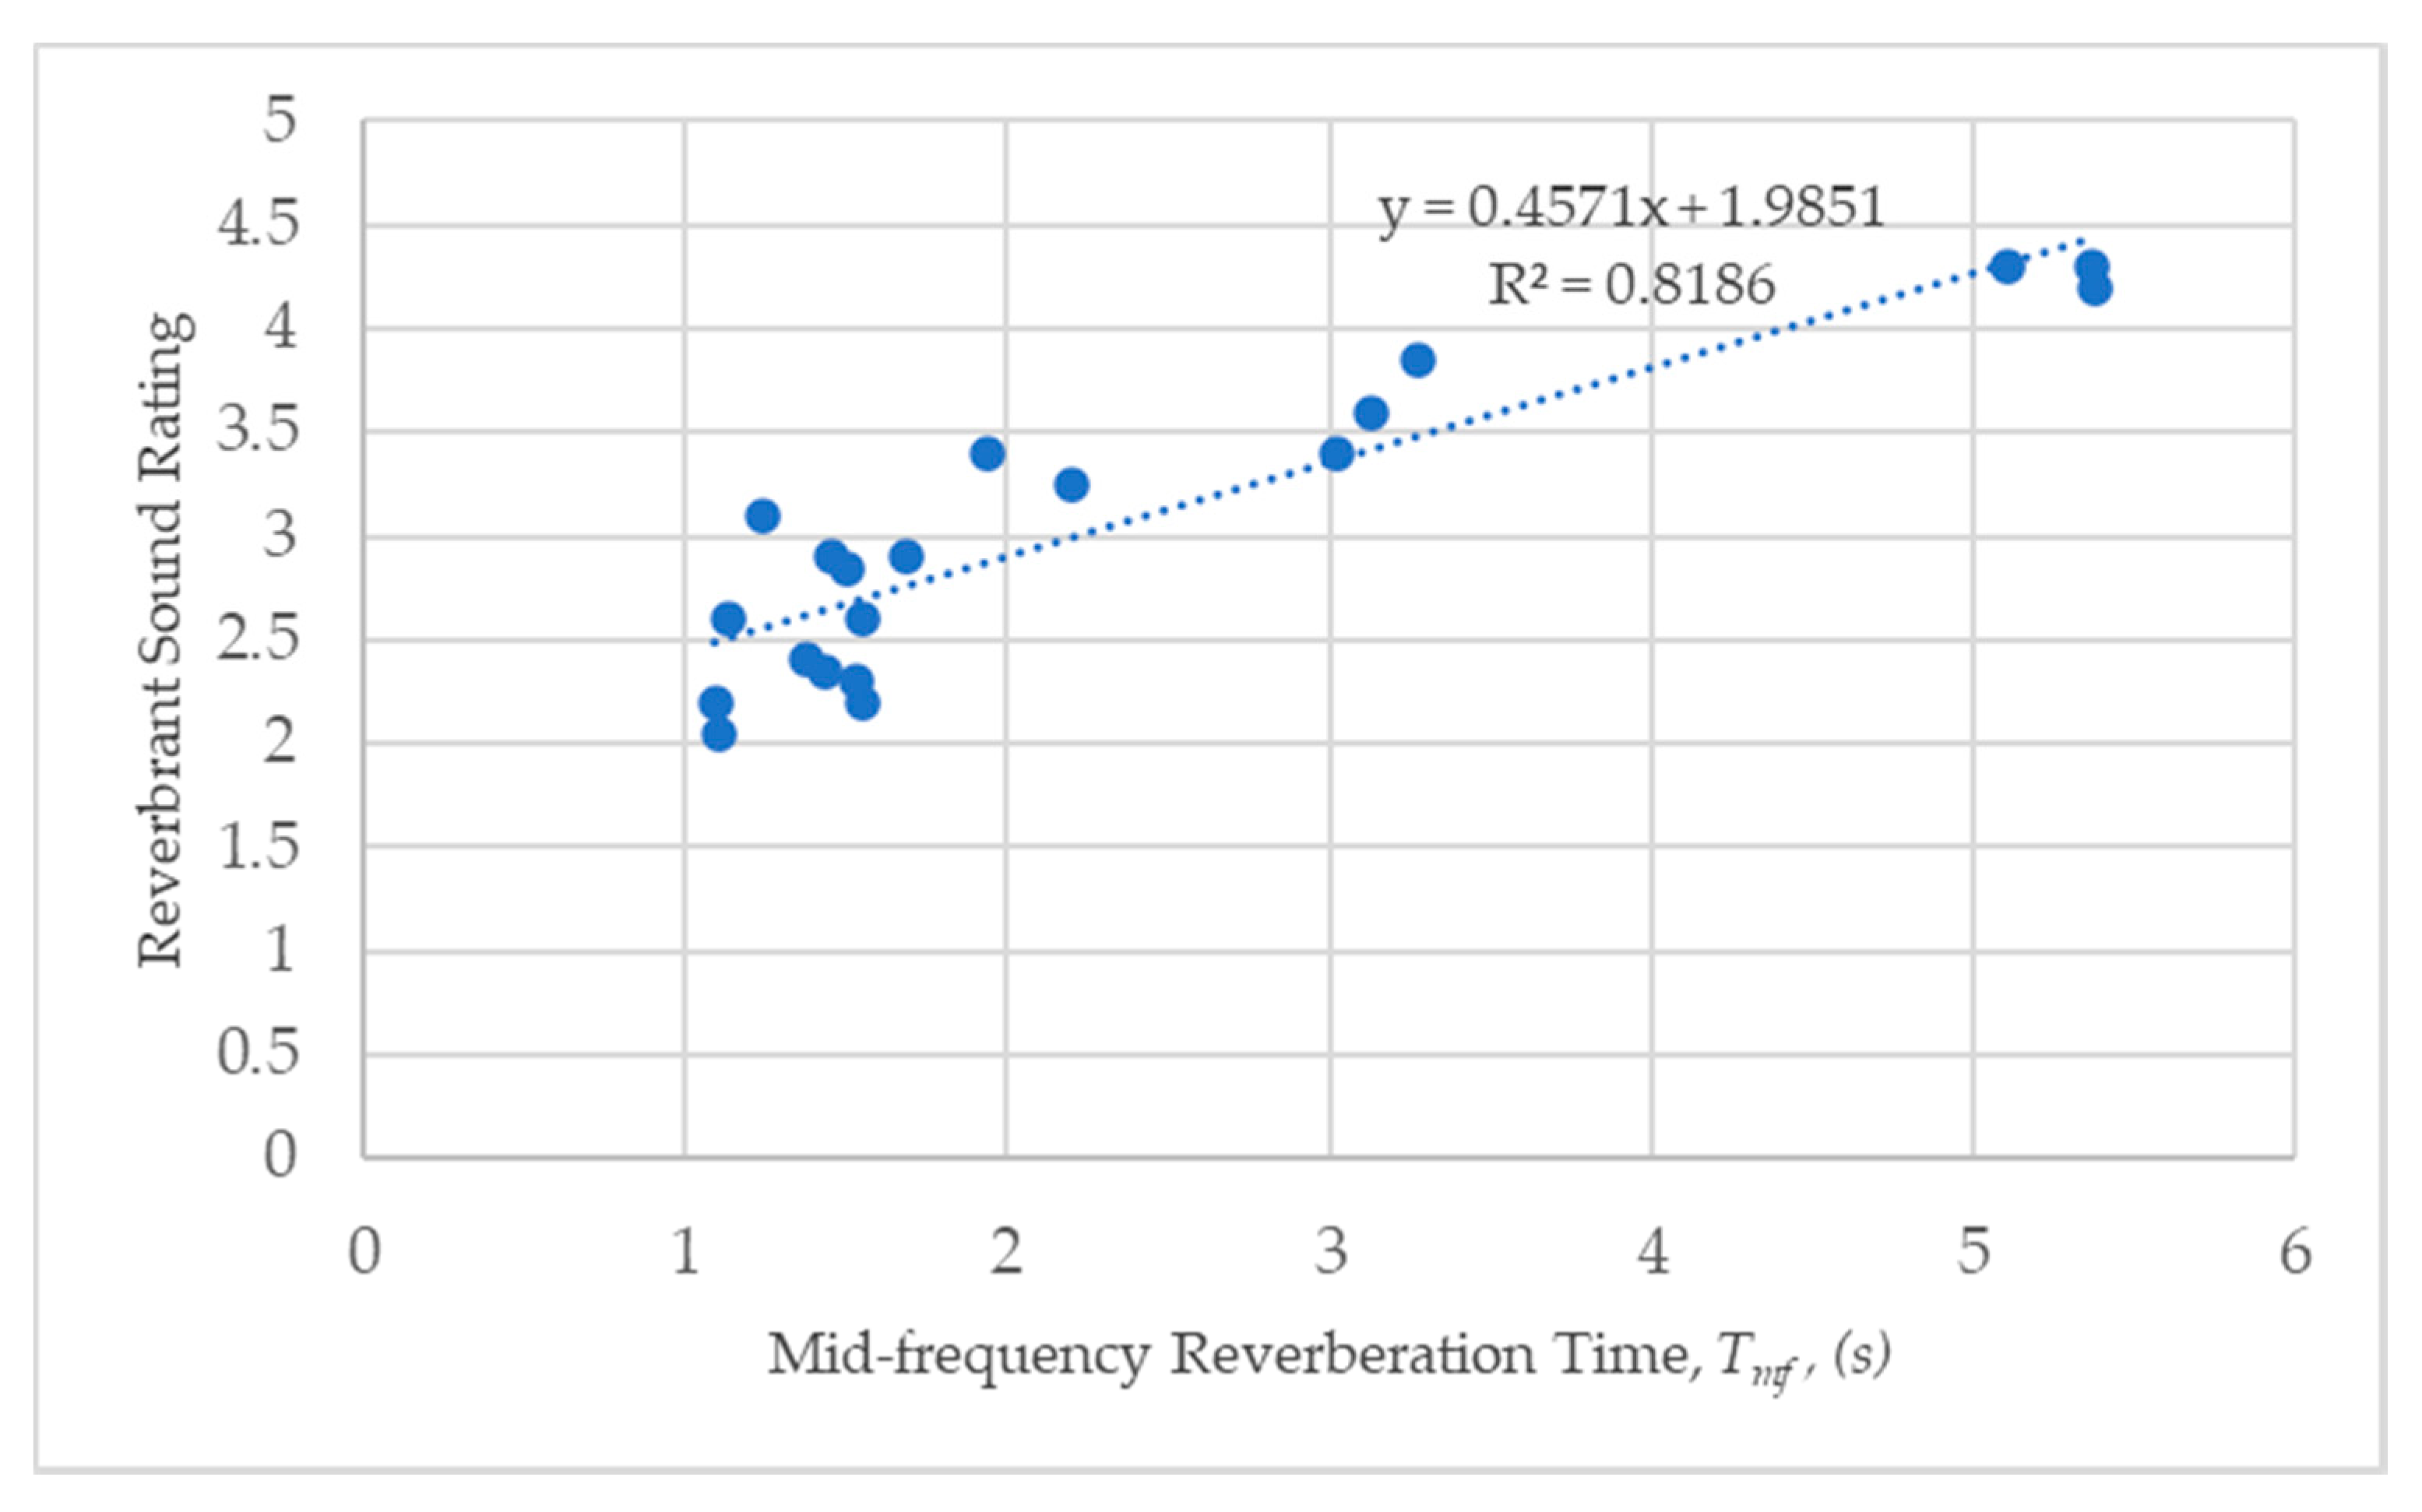
3.5. Subjective Evaluation of IS & G Hall Acoustics and its Relationship to Measured Values

Figure 12 illustrates the relationship between the reverberation time at each IS & G hall with the average subjective rating of listening conditions. The figure shows a statistically strong positive correlation between reverberation time and listening conditions (p < 0.01). The longer the reverberation time, the more unsatisfactory the hearing conditions, with a linear correlation coefficient (R² = 0.69) indicating the reverberation time as an important factor influencing the listening conditions. However, analyzing the relationship between LA,eq and listening conditions, no correlation was found. In a study conducted on a shopping mall [65], the employees’ responses showed a correlation between the loudness in the mall and the reverberation time, as in this study, without any relationship with noise levels.
In addition, T values correlated positively with the subjective rating of reverberant sounds in IS & G halls (p < 0.01) with a high linear correlation coefficient of R² = 0.8186 (Figure 13). These results indicate that the measured T values, which are already large, are sufficiently large to be recognized by users even though 41.9% (n = 168) of users considered the level as fair. Similarly, subjects rated the background noise as high for IS & G halls with higher background noise levels, with a correlation coefficient R² = 0.6985 (p < 0.01), as shown in Figure 14. Within Figure 14, it is noticed that the first two points of the background noise level were less than 45 dB(A) (41.4 and 43.2 dB(A)) in two gyms and the corresponding subjective rating of the background noise was also significantly lower than the rest of the gyms; this can be correlated to the Lombard effect, where an increase in background noise levels higher than 43.3 dB(A) is followed by a higher magnitude of vocal discomfort in comparison with values less than that change-point limit [66]. Other researchers have reported that factors such as personal reasons, satisfaction with working conditions, temperature, humidity, and lighting may also influence subjects’ answers, and further investigation is necessary to understand all conditions [56,67].

4. Conclusions and Recommendations

Indoor sports and gymnasium halls located in Amman, Jordan were studied with regard to the comfort level of the acoustic environment and occupational noise exposure of instructors. The first part involved a review of the literature, which aimed to collect data about the acoustic environment in large indoor environments and its influence on users comfort. The second part covered the methods, measurements, and interviews and questionnaires. Measurements of reverberation time and equivalent sound pressure levels were carried out in 20 IS & G halls. The third part covered the results of the measured reverberation time, and ambient and activity noise levels. The results from this study show that the majority of IS & G halls have a long reverberation time that exceeds the local and international recommended levels. There is a need for improvement and addition of absorptive acoustic materials. The study shows a strong relationship between measured reverberation time and the subjective rating of reverberant sounds in IS & G halls. An improvement in the values of reverberation time will improve the acoustic comfort. Improving the reverberation time could be done by selecting interior finishing materials on walls, floors, and ceilings that do not represent optimal acoustic design in the studied IS & G halls. The measured activity noise level values in this study show that the majority of these spaces have high noise levels; however, the annoyance of these activity noise levels to instructors was moderate, and they were rated as fair. This may be because the instructors have adapted and are used to these sounds as part of their work environment [56]. The study highlights the participants’ annoyance at music played throughout sport lessons. Moreover, the author subjectively experienced discomfort in the acoustic environment; this is consistent with the interviewees’ evaluations, in which 40% of the studied IS & G halls were reported to be excessively reverberant.
The average personal noise exposure for instructors at IS & G halls was 92.6 dB(A), whereas 90% of measurement results were above the occupational exposure limit (OEL) of 85.0 dB(A), to which 40% of instructors were potentially exposed. More actions should be taken to reduce the noise. Subjective ratings of listening conditions showed a statistically strong (p < 0.01) relationship with reverberation time rather than noise level. Although there are studies concerning noise exposure for sport instructors, few studies investigated the acoustic comfort of the participants in the fitness halls; moreover, few consider the satisfaction of participants who are the customers of the fitness halls.
Raising awareness of hearing problems for instructors working at IS & G halls requires understanding that the noise levels generated in the studied facilities constitute a possible workplace noise hazard. It is important to communicate the risks of loud music in IS & G halls with media outlets to publicize research findings and raise awareness among those at risk. The acoustic design was not given sufficient consideration in the building design. Thus, enforcement of the recommended reverberation times is necessary and can be addressed by adding acoustic treatments and sound-absorbing materials to reduce the reverberation time.

Funding

This research received no external funding.

Acknowledgments

The author acknowledges the financial support of the Deanship of Scientific Research at the German Jordanian University under research grant number 1/SABE/2018. Moreover, the author is grateful to Arch. Samer Rahma for his efforts in preparing the simulation of the case study. In addition, the author is grateful to the management and users of the fitness gym centers for their collaboration in conducting this study.

Conflicts of Interest

The author declares no conflict of interest.

References

  1. Building Bulletin. Acoustic Design of Schools: Performance Standards; The National Archives London: London, UK, 2015. [Google Scholar]
  2. Gómez Escobar, V.; Barrigón Morillas, J.M. Analysis of intelligibility and reverberation time recommendations in educational rooms. Appl. Acoust. 2015, 96, 1–10. [Google Scholar] [CrossRef]
  3. Labia, L.; Shtrepi, L.; Astolfi, A. Improved Room Acoustics Quality in Meeting Rooms: Investigation on the Optimal Configurations of Sound-Absorptive and Sound-Diffusive Panels. Acoustics 2020, 2, 25. [Google Scholar] [CrossRef]
  4. Hodgson, M.; Steininger, G.; Razavi, Z. Measurement and prediction of speech and noise levels and the Lombard e ect in eating establishments. J. Acoust. Soc. Am. 2007, 121, 2023–2033. [Google Scholar] [CrossRef] [PubMed]
  5. Lane, H.; Tranel, B. The Lombard Sign and the Role of Hearing in Speech. J. Speech Hear. Res. 1971, 14, 677–709. [Google Scholar] [CrossRef]
  6. Zucki, F.; Lacerda, A.B.M. The noise in physical education activities. In Hearing Health-Risk Assessment and Prevention, 1st ed.; Plexus: São Paulo, Brazil, 2010. [Google Scholar]
  7. Elliott, D.; Carr, S.; Orme, D. The effect of motivational music on sub-maximal exercise. Eur. J. Sport Sci. 2005, 5, 97–106. [Google Scholar] [CrossRef]
  8. Edworthy, J.; Waring, H. The effects of music tempo and loudness level on treadmill exercise. Ergonomics 2006, 49, 1597–1610. [Google Scholar] [CrossRef] [PubMed]
  9. Karageorghis, C.I.; Priest, D. Music in the exercise domain: A review and synthesis (Part I). Int. Rev. Sport Exerc. Psychol. 2012, 5, 44–66. [Google Scholar] [CrossRef] [Green Version]
  10. John, G.W.; Grynevych, A.; Welch, D.; McBride, D.; Thorne, P.R. Noise exposure of workers and the use of hearing protection equipment in New Zealand. Arch. Environ. Occup. Health 2014, 69, 69–80. [Google Scholar] [CrossRef]
  11. Darby, N.A.M.; Brueck, E.J. Noise Exposure of Physical Education, Music, and Craft, Design and Technology Teachers; Health and Safety Laboratory: Buxton, UK, 2001. [Google Scholar]
  12. Conetta, R.; Shield, B.; Cox, T.; Mydlarz, C.; Dockrell, J.; Connolly, D. Acoustics of indoor sports halls and gymnasia. Gymnasium 2012, 40, 1–5. [Google Scholar]
  13. Jiang, T. Risks of noise-induced hearing loss for physical education teachers. J. Occup. Environ. Med. 1997, 39, 925–926. [Google Scholar] [CrossRef]
  14. Masullo, M.; Lenzuni, P.; Maffei, L.; Nataletti, P.; Ciaburro, G.; Annesi, D.; Moschetto, A. Assessment of noise exposure for basketball sports referees. J. Occup. Environ. Hyg. 2016, 13, 464–475. [Google Scholar] [CrossRef] [PubMed]
  15. Maffei, L.; Iannace, G.; Masullo, M.; Nataletti, P. Noise exposure in school gymnasia and swimming pools. Noise Control. Eng. J. 2009, 57, 603–612. [Google Scholar] [CrossRef]
  16. Torre, P., III; Howell, J. Noise levels during aerobics and the potential effects on distortion product otoacoustic emissions. J. Commun. Disord. 2008, 41, 501–511. [Google Scholar] [CrossRef] [PubMed]
  17. Yaremchuk, K.; Kaczor, J. Noise levels in the health club setting. Ear Nose Throat J. 1999, 78, 54–57. [Google Scholar] [CrossRef] [Green Version]
  18. Lia, K.; Anjelo, H.; Henrique, P.; Zannin, T. Résumé 1 Introduction Canadian Acoustics/Acoustique canadienne. Can. Acoust. Acoust. Can. 2015, 43, 19–24. [Google Scholar]
  19. Piotr Pękala, P.L. Reverberation noise exposure in Polish school gyms. Arch. Acoust. 2005, 30, 209–212. [Google Scholar]
  20. Nie, V.; Beach, E. Fitness Instructors and Noise Exposure: Spreading the Hearing Health Message. Acoust. Aust. 2016, 44, 87–93. [Google Scholar] [CrossRef]
  21. Jonsdottir, V.I. Connection between unfavourable acoustics in sports halls and high prevalence of voice problems in sport teachers. In Proceedings of the Euronoise 2009, Edinburgh, UK, 26–28 October 2009. [Google Scholar]
  22. Fontan, L.; Fraval, M.; Michon, A.; Déjean, S.; Welby-Gieusse, M. Vocal Problems in Sports and Fitness Instructors: A Study of Prevalence, Risk Factors, and Need for Prevention in France. J. Voice 2017, 31, 261.e33–261.e38. [Google Scholar] [CrossRef] [Green Version]
  23. Astolfi, A.; Bottalico, P.; Accornero, A.; Garzaro, M.; Nadalin, J.; Giordano, C. Relationship between vocal doses and voice disorders on primary school teachers. In Proceedings of the European Conference on Noise Control, Prague, Czech Republic, 10–13 June 2012; pp. 55–60. [Google Scholar]
  24. Zhao, F.; Manchaiah, V.K.; French, D.; Price, S.M. Music exposure and hearing disorders: An overview. Int. J. Audiol. 2010, 49, 54–64. [Google Scholar] [CrossRef]
  25. Schmidt, J.H.; Pedersen, E.R.; Paarup, H.M.; Christensen-Dalsgaard, J.; Andersen, T.; Poulsen, T.; Bælum, J. Hearing Loss in Relation to Sound Exposure of Professional Symphony Orchestra Musicians. Ear Hear. 2014, 35, 448–460. [Google Scholar] [CrossRef]
  26. Susan, L.; Henrich, V.C.; Mace, S.T. Prevalence of noise-induced hearing loss in student musicians. Int. J. Audiol. 2010, 49, 309–316. [Google Scholar] [CrossRef] [Green Version]
  27. Beach, E.; Gilliver, M.; Williams, W. Leisure noise exposure: Participation, trends, symptoms of hearing damage and perceptions of risk. Int. J. Audiol. 2013, 52, 20–25. [Google Scholar] [CrossRef] [PubMed]
  28. Hee, S.; Jik, P.; Ho, J. E ff ects of noise sensitivity on psychophysiological responses to building noise. Build. Environ. 2018, 136, 302–311. [Google Scholar] [CrossRef]
  29. Puglisi, G.E.; Astolfi, A.; Cutiva, L.C.C.; Carullo, A. Assessment of indoor ambient noise level in school classrooms. In Proceedings of the 10th European Congress and Exposition on Noise Control Engineering, Euronoise, Maastricht, The Netherlands, 31 May–3 June 2015; pp. 715–720. [Google Scholar]
  30. Greier, K.; Drenowatz, C.; Ruedl, G.; Riechelmann, H. Noise Exposure of Physical Education Teachers—Empirical Study Using Measurement of Sound Pressure Level (SPL). J. Health Sci. Educ. 2018, 2, 1–6. [Google Scholar] [CrossRef]
  31. Mei, H.; Kang, J. An experimental study of the sound field in a large atrium. Build. Env. 2012, 58, 91–102. [Google Scholar] [CrossRef]
  32. Chen, X.; Kang, J. Acoustic comfort in large dining spaces. Appl. Acoust. 2017, 115, 166–172. [Google Scholar] [CrossRef]
  33. Wang, C.; Ma, H.; Wu, Y.; Kang, J. Characteristics and prediction of sound level in extra-large spaces. Appl. Acoust. 2018, 134, 1–7. [Google Scholar] [CrossRef] [Green Version]
  34. Ananthaganeshan, K.A.; Gastmeier, W.J. Acoustical Performance Criteria, Treatment and Guidelines for Multifunctional School Gymnasia. Can. Acoust. 2007, 35, 25–30. [Google Scholar]
  35. NIOSH. Criteria for a Recommended Standard Occupational Noise Exposure, National Institute for Occupational Safety and Health; NIOSH: Washington, DC, USA, 1998. [Google Scholar]
  36. ISO 1999:2013 International Organization for Standardization (ISO). Acoustics—Determination of Occupational Noise Exposure and Estimation of Noise Induced Hearing Impairment (Standard No. ISO 1999:2013); ISO: Geneva, Switzerland, 2013. [Google Scholar]
  37. European Union. European Union Directive 2002/49/EC relating to the assessment and management of environmental noise (END). Off. J. Eur. Commun. 2002, 12–25. [Google Scholar] [CrossRef]
  38. MOPWH. Jordanian Acoustic Code, Ministry of Public Works and Housing, Jordan National Building Council JNBC; MOPWH: Amman, Jordan, 2019. [Google Scholar]
  39. Martin, B. Specialty fitness centre noise issues—Case study. J. Acoust. Soc. Am. 2018, 144, 1788. [Google Scholar] [CrossRef]
  40. Dokmeci, P.N.; Kang, J. Objective parameters for acoustic comfort in enclosed spaces. In Proceedings of the 20th International Congress on Acoustics, ICA 2010, Sydney, Australia, 23–27 August 2010; Volume 5, pp. 3488–3491. [Google Scholar]
  41. South, T. Managing Noise and Vibration at Work; Elsevier Butterworth-Heinemann: Oxford, UK, 2004; ISBN 0750663421. [Google Scholar]
  42. Gastmeier, W.J.; Aitken, D.R. Reverberation Time in Gymnasia. J. Can. Acoust. Assoc. 1999, 27, 3–7. [Google Scholar]
  43. Maekawa, Z.; Rindel, J.H.; Lord, P. Environmental and Architectural Acoustics, 2nd ed.; Taylor and Francis Group: Abingdon-on-Thames, UK, 2010; ISBN 13: 978-0-203-93135-6. [Google Scholar]
  44. Kuttruff, H. Room Acoustics, 6th ed.; CRC Press (Taylor and Francis): Boca Raton, FL, USA, 2017; ISBN 0-203-18623-0. [Google Scholar]
  45. ISO 3382-2. International Organization for Standardization (ISO), Acoustics-Mesurement of Room Acoustic Parameters—Part 2: Reverberation Time in Ordinary Room; ISO: Geneva, Switzerland, 2016. [Google Scholar]
  46. Rhinoceros 3D User Documentation. Available online: http://docs.mcneel.com/rhino/6/usersguide/en-us/index.htm (accessed on 29 August 2020).
  47. Microsoft Visual Studio, Programming Using Csharp. Available online: https://docs.microsoft.com/en-us/visualstudio/get-started/csharp/visual-studio-ide?view=vs-2019 (accessed on 29 August 2020).
  48. RhinoCommon (Dynamic Link Library), Tamplate Using Microsoft Visual Studio. Available online: https://marketplace.visualstudio.com/items?itemName=McNeel.RhinoCommontemplatesforv6 (accessed on 29 August 2020).
  49. Matplotlib User Documentation. Available online: https://matplotlib.org/3.3.1/contents.html (accessed on 29 August 2020).
  50. Grasshopper 3D in Rhinoceros3D (Python) Developer Documentation. Available online: https://developer.rhino3d.com/guides/rhinopython/ (accessed on 29 August 2020).
  51. PedSIM Plugin in Grasshopper. Available online: https://www.pedsim.net/pedsim/ (accessed on 29 August 2020).
  52. Nvidia Developer. PhysX and Fluid Simulation (Smart Particles). Available online: https://developer.nvidia.com/particles (accessed on 29 August 2020).
  53. Web Absorption Data (English). Available online: http://www.acoustic.ua/st/web_absorption_data_eng.pdf (accessed on 29 August 2020).
  54. Chen, J.; Ma, H. An impact study of acoustic environment on users in large interior spaces. Build. Acoust. 2019, 26, 139–153. [Google Scholar] [CrossRef]
  55. Dökmeci, P.N.; Yýlmazer, S. Relationships between Measured Levels and Subjective Ratings: A Case Study of the Food-Court Area in CEPA Shopping Center, Ankara. Build. Acoust. 2012, 19, 57–73. [Google Scholar] [CrossRef]
  56. Meng, Q.; Kang, J. Influence of Social and Behavioural Characteristics of Users on their Evaluation of Subjective Loudness and Acoustic Comfort in Shopping Malls. PLoS ONE 2013, 8, e54497. [Google Scholar] [CrossRef]
  57. Al-arja, O.A.; Awadallah, T.S. Assessment of occupational noise exposure in coffee grinding shops. Appl. Acoust. 2020, 158, 107047. [Google Scholar] [CrossRef]
  58. EPA. Environmental Protection Agency Report; EPA: Washington, DC, USA, 1974. [Google Scholar]
  59. Shaikh, G.H. Occupational noise exposure limits for developing countries. Appl. Acoust. 1999, 57, 89–92. [Google Scholar] [CrossRef]
  60. Cranston, J.C.; Brazile, W.J.; Sandfort, D.R.; Gotshall, R.W. Occupational and recreational noise exposure from indoor arena hockey games. J. Occup. Environ. Hyg. 2013, 10, 11–16. [Google Scholar] [CrossRef]
  61. Nowos’wiat, A.; Olechowska, M. Fast estimation of speech transmission index using the reverberation time. Appl. Acoust. 2016, 102, 55–61. [Google Scholar] [CrossRef]
  62. World Health Organization. In Proceedings of the WHO Technical Meeting on Exposure Response Relationships of Noise on Health, Bonn, Germany. 2003. Available online: https://windfarmrealities.org/wp-content/uploads/wfr-docs/who-technical-meeting-noise-health-2002.pdf (accessed on 11 September 2020).
  63. Sanavi, A.; Schäffer, B.; Heutschi, K.; Eggenschwiler, K. On the Effect of an Acoustic Diffuser in Comparison with an Absorber on the Subjectively Perceived Quality of Speech in a Meeting Room. Acta Acust. United Acust. 2017, 103, 1037–1049. [Google Scholar] [CrossRef]
  64. Alnuman, N.; Ghnimat, T. Awareness of Noise-Induced Hearing Loss and Use of Hearing Protection among Young Adults in Jordan. Int. J. Environ. Res. Public Health 2019, 16, 2961. [Google Scholar] [CrossRef] [Green Version]
  65. Alnuman, N.; Altaweel, M.Z. Investigation of the acoustical environment in a shopping mall and its correlation to the acoustic comfort of the workers. Appl. Sci. 2020, 10, 1170. [Google Scholar] [CrossRef] [Green Version]
  66. Bottalico, P.; Passione, I.I.; Graetzer, S.; Hunter, E.J. Evaluation of the starting point of the Lombard Effect. Acta Acust United Acust. 2017, 103, 169–172. [Google Scholar] [CrossRef] [PubMed] [Green Version]
  67. Meng, Q.; Kang, J.; Jin, H. Field study on the influence of spatial and environmental characteristics on the evaluation of subjective loudness and acoustic comfort in underground shopping streets. Appl. Acoust. 2013, 74, 1001–1009. [Google Scholar] [CrossRef] [Green Version]
Figure 1. Representative photos taken during measurements of reverberation time and noise levels inside the studied indoor sports and gymnasium (IS & G) halls.
Applsci 10 06349 g001
Figure 2. Layout of the measurement set-up in the fitness gym (P); red stars represent the location of measurement points of activity noise level (LA,eq) and blue points represent the locations of the gymnasium’s loudspeakers.
Applsci 10 06349 g002
Figure 3. Layout of the indoor sport hall (Q); the average height was 10.2 m; the volume was 25,792.0 m3; red circles represent the location of measurement points of reverberation time; red stars represent the locations of sound source (omnidirectional loudspeaker).
Applsci 10 06349 g003
Figure 4. Unoccupied ambient noise level (UANL) equivalent sound pressure level LA,eq dB(A) at unoccupied indoor sports and gymnasium halls. Orange bars represent Category I, blue bars represent Category II, and grey bars represent Category III.
Applsci 10 06349 g004
Figure 5. Personal daily dose (LEX, 8 h) at indoor sports and gymnasia halls compared with occupational exposure level (OEL) of 85 dB(A). Orange bars represent Category I, blue bars represent Category II, and grey bars represent Category III.
Applsci 10 06349 g005
Figure 6. Measured mid-frequency reverberation time, Tmf (s), for the studied IS & G halls. Orange bars represent Category I, blue bars represent Category II, and grey bars represent Category III. According to BB [1], the lower limit of recommended Tmf is for IS & G halls of Category I and upper limit of recommended Tmf is for Category III.
Applsci 10 06349 g006
Figure 7. Average of measured mid-frequency reverberation time, Tmf, values (average + standard deviation) for indoor sports and gymnasium (IS & G) halls in the three categories compared with recommended Tmf.
Applsci 10 06349 g007
Figure 8. Logarithmic energy time curve for the hall without acoustic treatment, with channel 0 for hall in unoccupied mode and channel 1 for occupied mode.
Applsci 10 06349 g008
Figure 9. Logarithmic energy time curve for the hall with acoustic treatment, with channel 0 for hall in unoccupied mode and channel 1 for occupied mode.
Applsci 10 06349 g009
Figure 10. Visualizations of sound pressure level using the 3D Smart Particle System: (a) visualization of the hall without acoustic treatment and (b) visualization of the hall when adding acoustic treatment (absorptive panels).
Applsci 10 06349 g010
Figure 11. Results of questionnaire for all 401 subjects.
Applsci 10 06349 g011
Figure 12. Relationship between reverberation time and subjective rating of listening conditions.
Applsci 10 06349 g012
Figure 13. Rating of reverberant sounds and mid-frequency reverberation time, Tmf (s), measurements.
Applsci 10 06349 g013
Figure 14. Subjective rating of background noise and ambient noise level measurements.
Applsci 10 06349 g014
Table 1. Interior finishing materials used on the floors, ceilings, and walls in studied indoor sports and gymnasium (IS & G) halls.
No.IS & G HallMaterial Used in Interior Design
FloorCeilingWalls
1AW **GB *CP *
2BEP *CP *CP *
3CW **CP *CP *
4DW **GB *CP *
5EV **GB *CP *
6FP **GB *CP *
7GW **MD *G *
8HW **AT **G & CP *
9IW **CP *CP & G *
10JV **GB *CP & G *
11KW **GB *CP *
12LW **CP *CP *
13MF **CP *CP *
14NF **CP *CP & G *
15OEC *MD *G *
16PEC *GB *G & CP *
17QEC *AT **CP *
18RF **MD *G & P *
19SV **MD *G & P *
20UF **MD *G & P *
(1) MD, metal deck; CP, cement plaster; GB, gypsum boards; G, glass; EC, epoxy paint on concrete; W, wood; F, foam; P, PVC; V, vinyl; AT, absorptive tiles. (2) * Reflective material; ** absorptive material.
Table 2. Sound absorption coefficients (α) as a function of frequency for materials used in the simulation [53].
Material125
(Hz)
250
(Hz)
500
(Hz)
1000
(Hz)
2000
(Hz)
4000
(Hz)
Cement plastering0.020.020.030.040.050.05
Gypsum boards0.450.700.800.800.650.45
Epoxy on concrete0.100.250.650.550.700.70
Wrapped panels and baffles0.250.741.501.801.500.98
Table 3. A-weighting equivalent continuous sound pressure level for indoor ambient noise levels and activity noise levels, daily noise dose (D (%)) for 50 min workout session, average daily noise exposure of 3 h (D (%)), and personal daily dose; A-weighting LEX, 8 h in dB(A).
No.Fitness HallIndoor
Ambient Noise
Level,
30 min LA,eq
(dB(A))
LA,eq
(dB(A))
50 min
Workout Session
LAFmax
(dB(A))
LAFmin
(dB(A))
Daily Noise
Dose
D (%)
Te = 50 min
(Workout Session Duration)
Daily Noise
Dose D (%)
Te = 3 h
(or 180 min
(Mean Daily
Exposure
Time)
Personal Daily Dose
A-Weighting
LEX, 8 h
(dB(A))
1A43.089.098.046.026.278.686.0 *
2B55.090.083.050.032.898.487.0 *
3C83.085.0 *102.056.016.649.884.0
4D73.083.088.070.08.425.281.0
5E42.080.083.050.03.29.677.0
6F70.088.092.070.020.862.485.0
7G50.086.0103.050.013.239.683.0
8H50.087.0105.051.016.649.884.0
9I50.085.077.046.010.431.282.0
10J63.0111.0141.062.0>>100>>100108.0 *
11K55.095.0110.057.0105.2315.692.0 *
12L55.091.0106.053.041.6124.888.0 *
13M77.093.089.069.066.2198.690.0 *
14N74.087.089.056.016.649.884.0
15O63.0103.0111.058.0>>100>>100100.0 *
16P70.094.0104.067.083.4250.291.0 *
17Q61.085.092.075.010.431.282.0
18R62.0105.0130.055.0>>100>>100102.0 *
19S61.0106.0132.058.0>>100>>100103.0 *
20U66.0110.0135.060.0>>100>>100107.0 *
* Personal daily dose level above 85.0 dB(A). LAFmax: sound pressure level, A-weighted fast maximum. LAFmin: sound pressure level, A-weighted fast minimum. Te: exposure time, (minutes).
Table 4. Noise for indoor sports and gymnasia (IS & G) halls according to Building Bulletin (BB) [1].
Type of RoomUpper Limit for Indoor Ambient Noise Level
LEX, 8 h
New BuildingRefurbishment
Indoor sports hall40.045.0
Gymnasium/activity studio40.045.0
Highest 30 min equivalent noise level (dB(A) LA,eq, 30 min) occurring during normal working hours in unoccupied and unfurnished spaces arising from external sources and building services.
Table 5. Exposure action and limit values under Physical Agents (Noise) Directive [37].
LAEP,dLCpeak
Lower exposure action value80 dB135 dB or 112 Pa
Upper exposure action value85 dB137 dB or 140 Pa
Exposure limit value87 dB140 dB or 200 Pa
Table 6. Mid-frequency reverberation time (with SD) in indoor sports and gymnasium halls compared with recommended mid-frequency reverberation time (Tmf) from BB [1].
No. Fitness HallArea
( m 2 )
Volume
( m 3 )
T (s)Tmf
(s)
Recommended
Tmf, (s)
500 Hz1000 Hz2000 Hz
1Category IA721801.251.751.651.55 (±0.26)1.5
2B623116.254.954.135.11 (±1.07)
3C542701.011.11.281.13 (±0.14)
4D1343380.991.111.171.09 (±0.09)
5E1404560.991.131.171.10 (±0.09)
6F1102751.032.291.331.55 (±0.66)
7G662641.251.411.71.45 (±0.23)
8H702801.281.441.861.53 (±0.30)
9I803471.481.361.31.38 (±0.09)
10Category IIJ36711001.821.451.791.69 (±0.21)1.67 *
11K41014351.151.51.631.43 (±0.25)1.76 *
12L42114751.391.561.561.50 (±0.10)1.78 *
13M51623051.921.981.921.94 (±0.03)1.97 *
14N41618581.091.251.391.24 (±0.15)1.77 *
15Category IIIO84086535.15.495.545.38 (±0.24)2.0
16P82885304.985.545.65.37 (±0.34)
17Q253125,7922.132.312.162.20 (±0.10)
18R120090002.863.212.983.02 (±0.18)
19S123092253.053.33.053.13 (±0.14)
20U126010,0053.163.473.183.27 (±0.17)
* Mid-frequency reverberation time of Category II is calculated from Tmf = (2.0 − ((530 − floor area)/500).
Table 7. Results of acoustic comfort parameters of instructors’ and participants’ opinions.
ParameterInstructors (n = 137)Participants (n = 264)p-Value
MeanSDMeanSD
Listening conditions2.64±0.8552.78±0.9080.131
Reverberant sound3.13±0.9062.99±0.9350.155
Loud music2.05±0.8693.75±0.937p < 0.01
Background noise level3.31±0.7823.37±1.0120.539
Overall evaluation2.52±0.7961.88±0.687p < 0.01

