1. Introduction
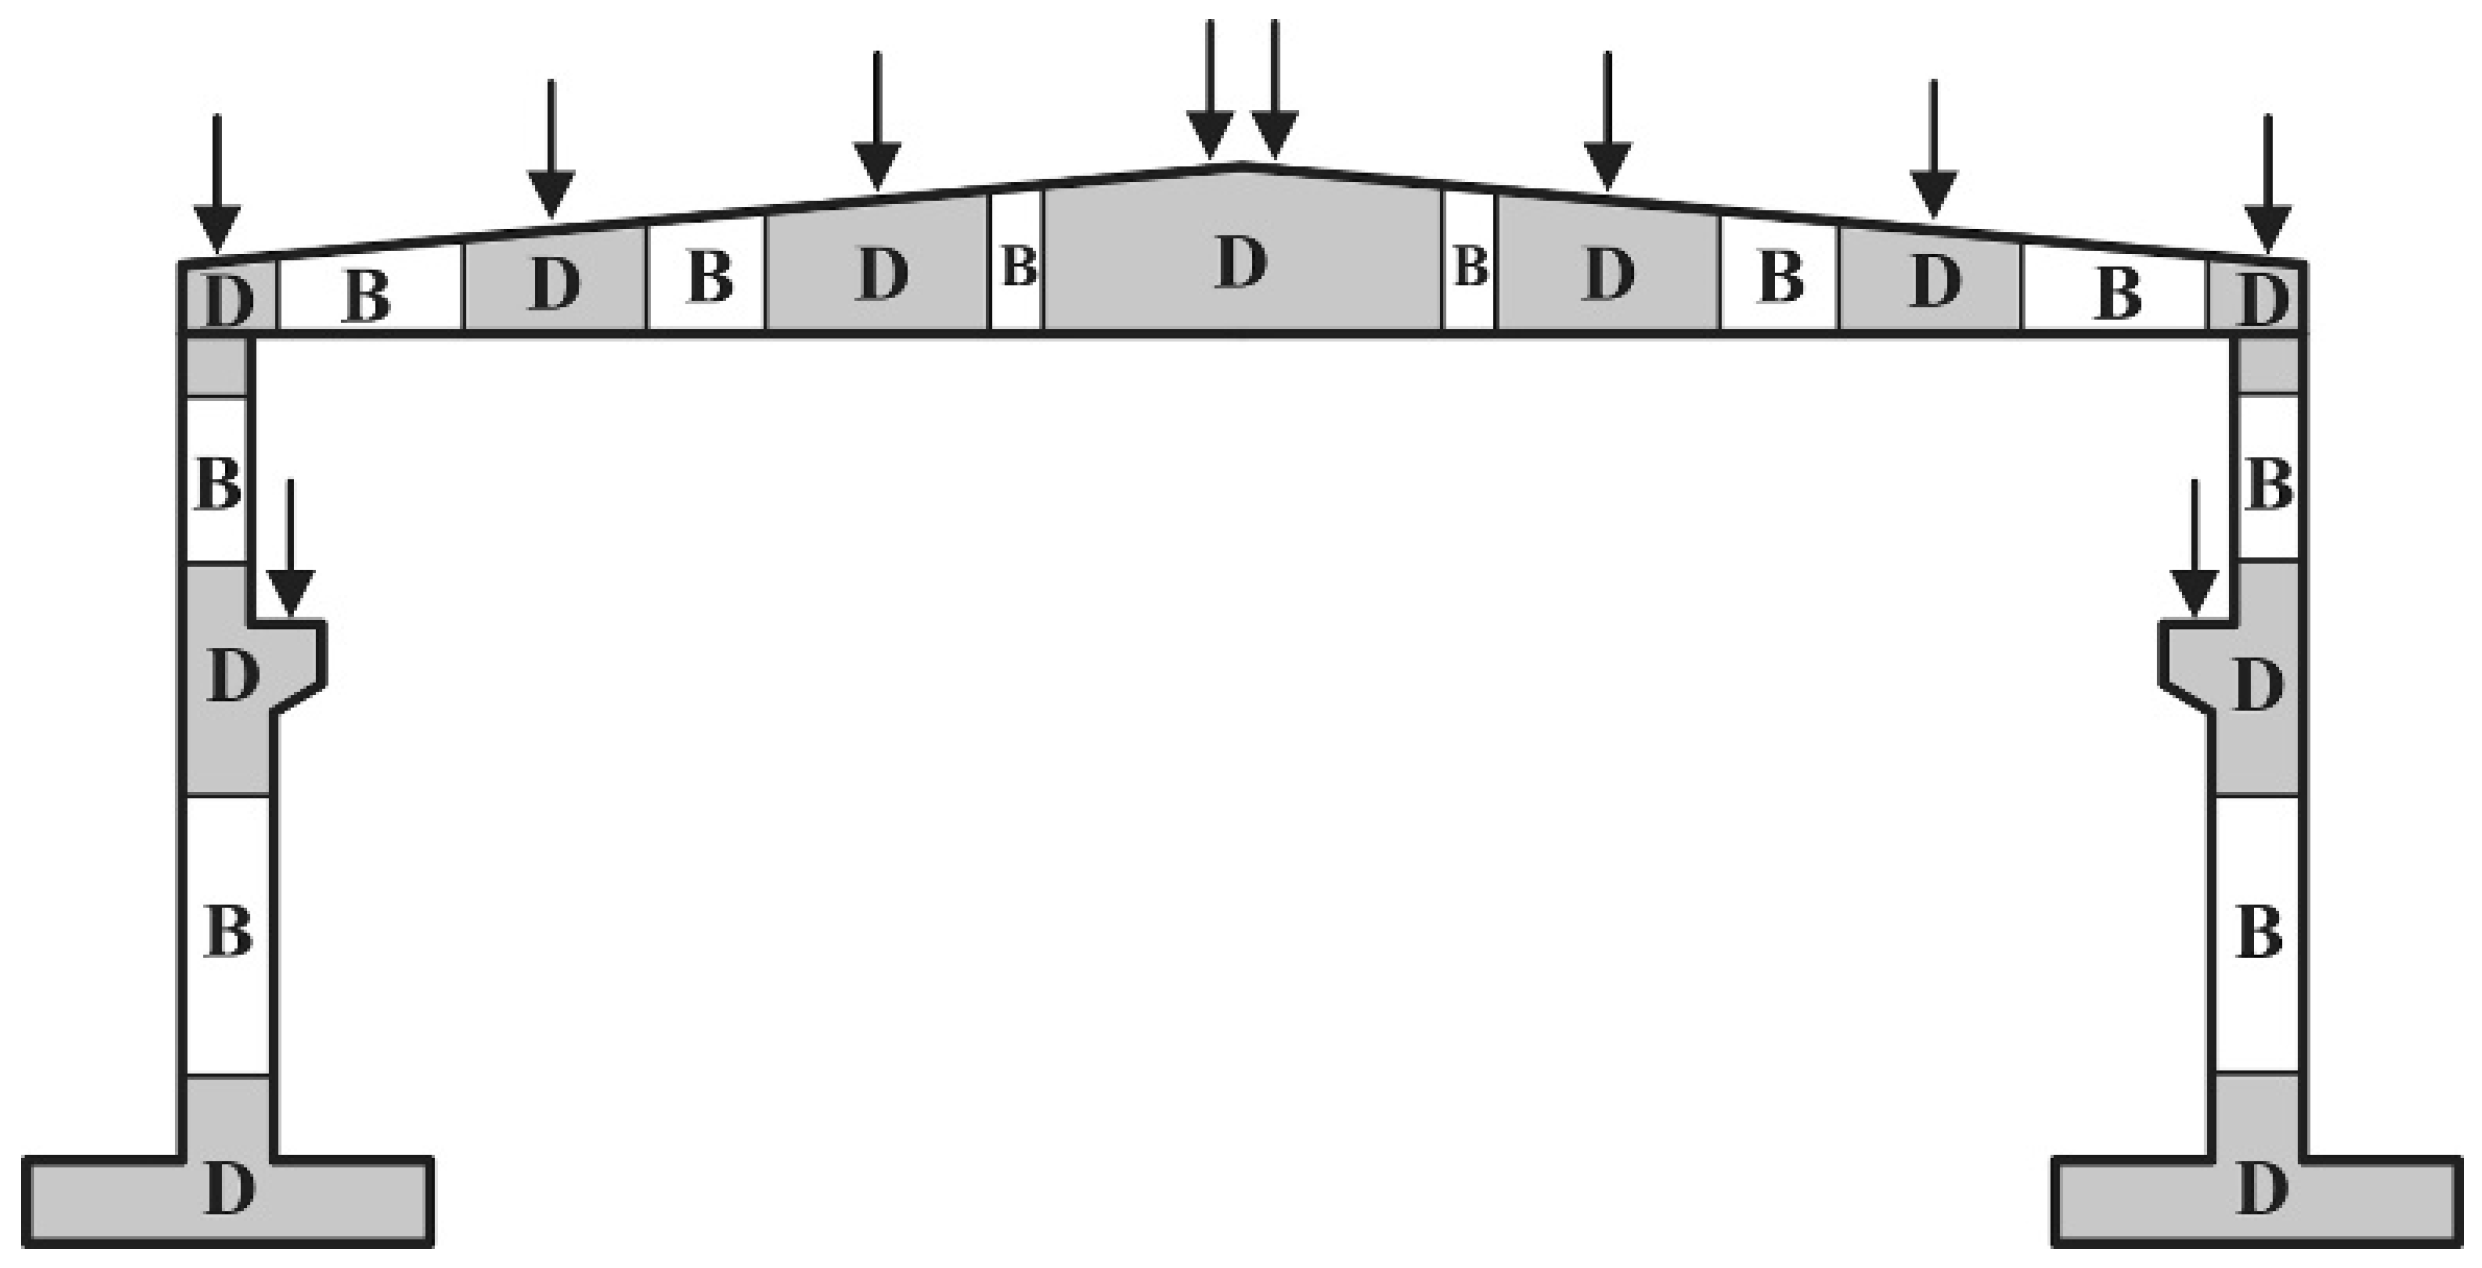
Strut-and-Tie is one of the methods that can be used for designing reinforced concrete members in which geometric and static discontinuities (D-regions) occur, and where the conventional design method does not apply, as it is the case with the whole or parts of the member, the so-called, B-region [
1],
Figure 1.
The advantage of this method is reflected in the simplicity of its design application, while one of the main disadvantages is that there is no single solution for the Strut-and-Tie model form. This disadvantage is a consequence of the possibility to form valid Strut-and-Tie models in many variations. The Strut-and-Tie model can be adapted to follow main stress trajectories, it can be conditioned by the reinforcement layout, and it can be determined intuitively, i.e., based on engineering assessment. Typical examples of the members where Strut-and-Tie models can be successfully applied are: pile cap, stiffening cross-sections diaphragm, wall members with and without openings, places with sudden static or geometrical changes (e.g., sudden reduction in a cross-section at the end of the member, places where large concentrated loads are applied), short elements, etc.
So far, a significant number of experimental studies have been carried out regarding the application of the Strut-And-Tie method for the design of a part or the whole of reinforced concrete members. In general, the objectives of this research relate to the verification of the method from the aspect of the Strut-and-Tie model and member strength, [
2,
3,
4,
5,
6].
The testing of deep concrete beams, designed by various methods, including the Strut-and-Tie method, is shown in the paper [
7]. Analytical predictions of the member strength were made and then compared with the results obtained by the experiment. Twenty members were tested, in two series of ten. The specimens had the same geometry, mechanical properties, and low shear span-to-depth ratio
a/
H = 0.27. The load was represented by two forces that were positioned at the thirds of the span length. The member supports were positioned symmetrically. Variations within specimens were made with respect to the position of the circular hole, the layout, and the quantity of reinforcement. Following the experimental investigations, Campione and Minafo [
7] came to the conclusion that the members’ failure shapes and the load values at the moment of the first crack appearance were dependent on the existence and position of the opening. When the hole was set in the region of the shear span, the load reduction was in the range of 18–30%, while the hole in the center of the member did not affect the behavior of the deep beam. The existence of vertical stirrups increased the load limit value by approximately 15% in the case of a solid member and in the member with an opening in the central part, while there was no significant impact when the opening was set in the region of the shear span. Horizontal reinforcement increased the member strength by approximately 20% in the region of the shear span, whereas there was no impact if the opening was in the center of the member. By comparing analytical and experimental results, similar strength values were obtained.
Morad and Reza Esfahani, [
8], experimentally examined two different types of wall members. One wall member featured ordinary reinforcement, while the other, besides reinforcement, had steel fibers added to the concrete mixture [
8]. The amount and arrangement of reinforcement for all wall members was determined using the Strut-and-Tie method. The wall members were loaded with one concentrated force. Two members had dapped heights and two members had constant heights. Each of the specimens had a rectangular opening positioned on the load transfer path from the application location to the support. The amount of reinforcement of the wall members with the addition of steel fibers was smaller when compared to the amount of reinforcement for the ordinary reinforced concrete wall members. The amount of added steel fibers in the concrete was 1.5% of the total amount of the concrete mixture. In the paper [
8], the appearance of the cracks and the behavior of wall members under the applied load were examined. After the experimental research was completed, it was concluded that the wall members which were made with the addition of steel fibers and a smaller amount of reinforcement, had much fewer cracks. The fibers cannot delay cracking, they can only control cracking, i.e., they can result in more cracks with smaller widths. Experimental testing showed that the directions of the compressed and tensioned Strut-and-Tie elements corresponded to the crack pattern. This supported the conclusion that the method proposed in the paper can be applied in practice.
Chen, Wang, and Zhong, [
9], tested two groups of concrete deep beams, four in each group, differently reinforced and designed by Strut-and-Tie method. The first group of beams includes simply supported deep beams with variable cross-sections and openings and is subjected to a concentrated force at the beam top. The second group of beams are simply supported concrete deep beams with an opening in the lower left part of the beam and is subjected to a concentrated force on the right side of the beam top. The beams were experimentally investigated under stepped loading. The differences in the reinforcement amount, the load-carrying capacity, and the failure pattern of the different specimens were analyzed. Reinforcement efficiency was given according to cost-effectiveness for better assessment of the economic feasibility of the reinforcement design guided by different optimal Strut-and-Tie models. All specimens had an ultimate load-carrying capacity that exceeded the corresponding design load, verifying the conservativeness of the Strut-and-Tie design method.
Zhang, Li, Xie, and Guo, [
10], tested the shear capacity performance for eight deep beams designed by the Strut-and-Tie method according to the provisions of different standards. All of the beams have the same dimensions and different layouts and amount of reinforcement and are made of high-strength concrete. The beams were loaded with two concentrated forces on the beam top. The analyses were conducted to enable a better understanding of the effects of shear span–depth ratio, longitudinal reinforcement ratio, and vertical stirrup ratio, as well as to improve design procedures. It was concluded that the shear span-depth is the most important parameter that controls the behavior and shear capacity of the beams, while the longitudinal reinforcement ratio has no effect on serviceability load, but has a greater impact on the ultimate load. At the same time, vertical stirrup ratio, because of its absence in some of the equations of regulations, has no effect on serviceability and ultimate load, and some of the applied provisions are mostly over-conservative and some have a reasonable degree of accuracy.
Brena and Morrison [
11] have experimentally tested four wall members with openings, using the Strut-and-Tie method to determine the required amount of reinforcement. All wall members had a rectangular shape. The two wall members had only one opening, while the other two had two rectangular openings. The layout of the reinforcement was different for all wall members in accordance with the directions of the struts and ties. The authors concluded that the strength of the elements designed by using the Strut-and-Tie method in relation to the experimentally obtained results is approximately three times higher, which supports the claim related to the conservative nature of the method.
The scaled reinforced concrete wall members designed by the Strut-and-Tie method were experimentally tested by Maxwell and Breen [
12]. They have examined four wall members with openings and the same geometry, but with the different reinforcement layouts. The authors concluded that the behavior of experimentally tested members was in accordance with the position of the compressed and tensioned elements of the chosen Strut-and-Tie models. Similarly to the conclusion in the paper [
11], it has been also shown that the strength determined by the Strut-and-Tie method is lower than the experimentally determined load capacity, which confirms that the Strut-and-Tie method is reliable.
Saho and others [
13] were examining the behavior of reinforced concrete wall members designed by means of the Strut-and-Tie method. Out of the total of four members, two were made with normal reinforced concrete and the other two were made from reinforced concrete with the addition of steel fibers in the amount of 1.5% of the total member volume. The members with steel fibers were reinforced so that the reinforcing bars, unlike ordinary reinforced members, were positioned only at certain critical locations in the member. The conclusions of the study in the paper [
13] indicated that the Strut-and-Tie method underestimates the ultimate limit strength of the tested specimens. The specimens with normal reinforced concrete reached the designed strength value, but without the failure. Similar to the previous research papers, this study also showed that the designed strength is three to four times lower than the experimentally determined load capacity. The behavior of specimens in experimental testing has shown that steel fibers can replace a certain amount of reinforcement bars.
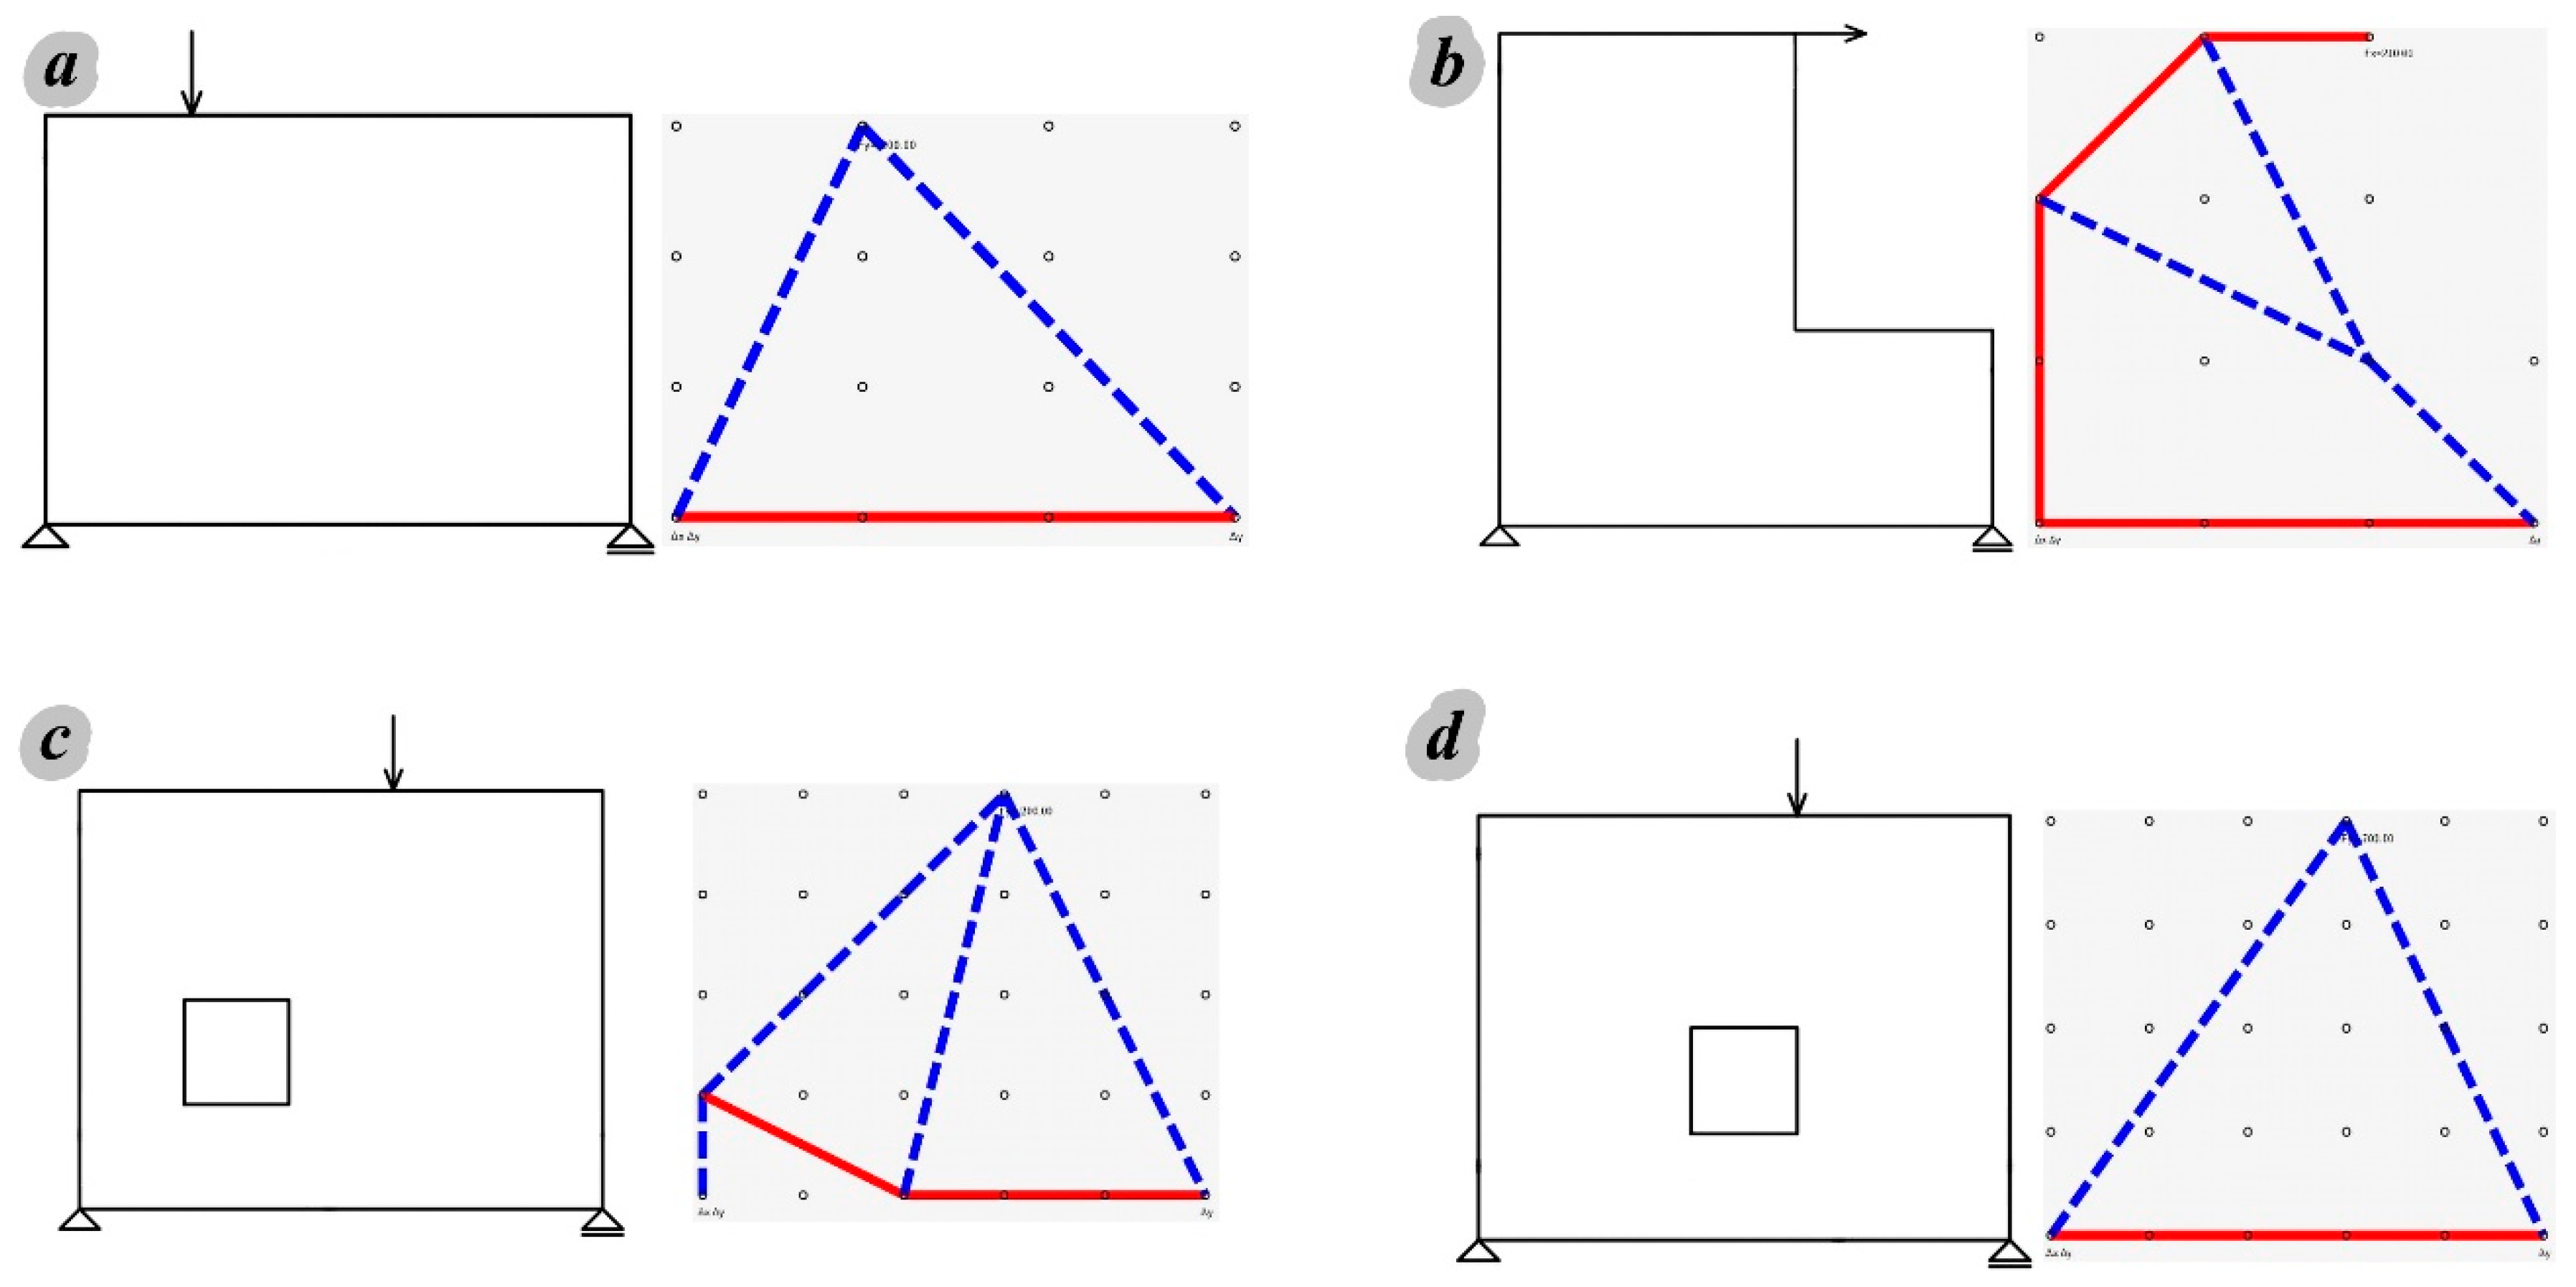
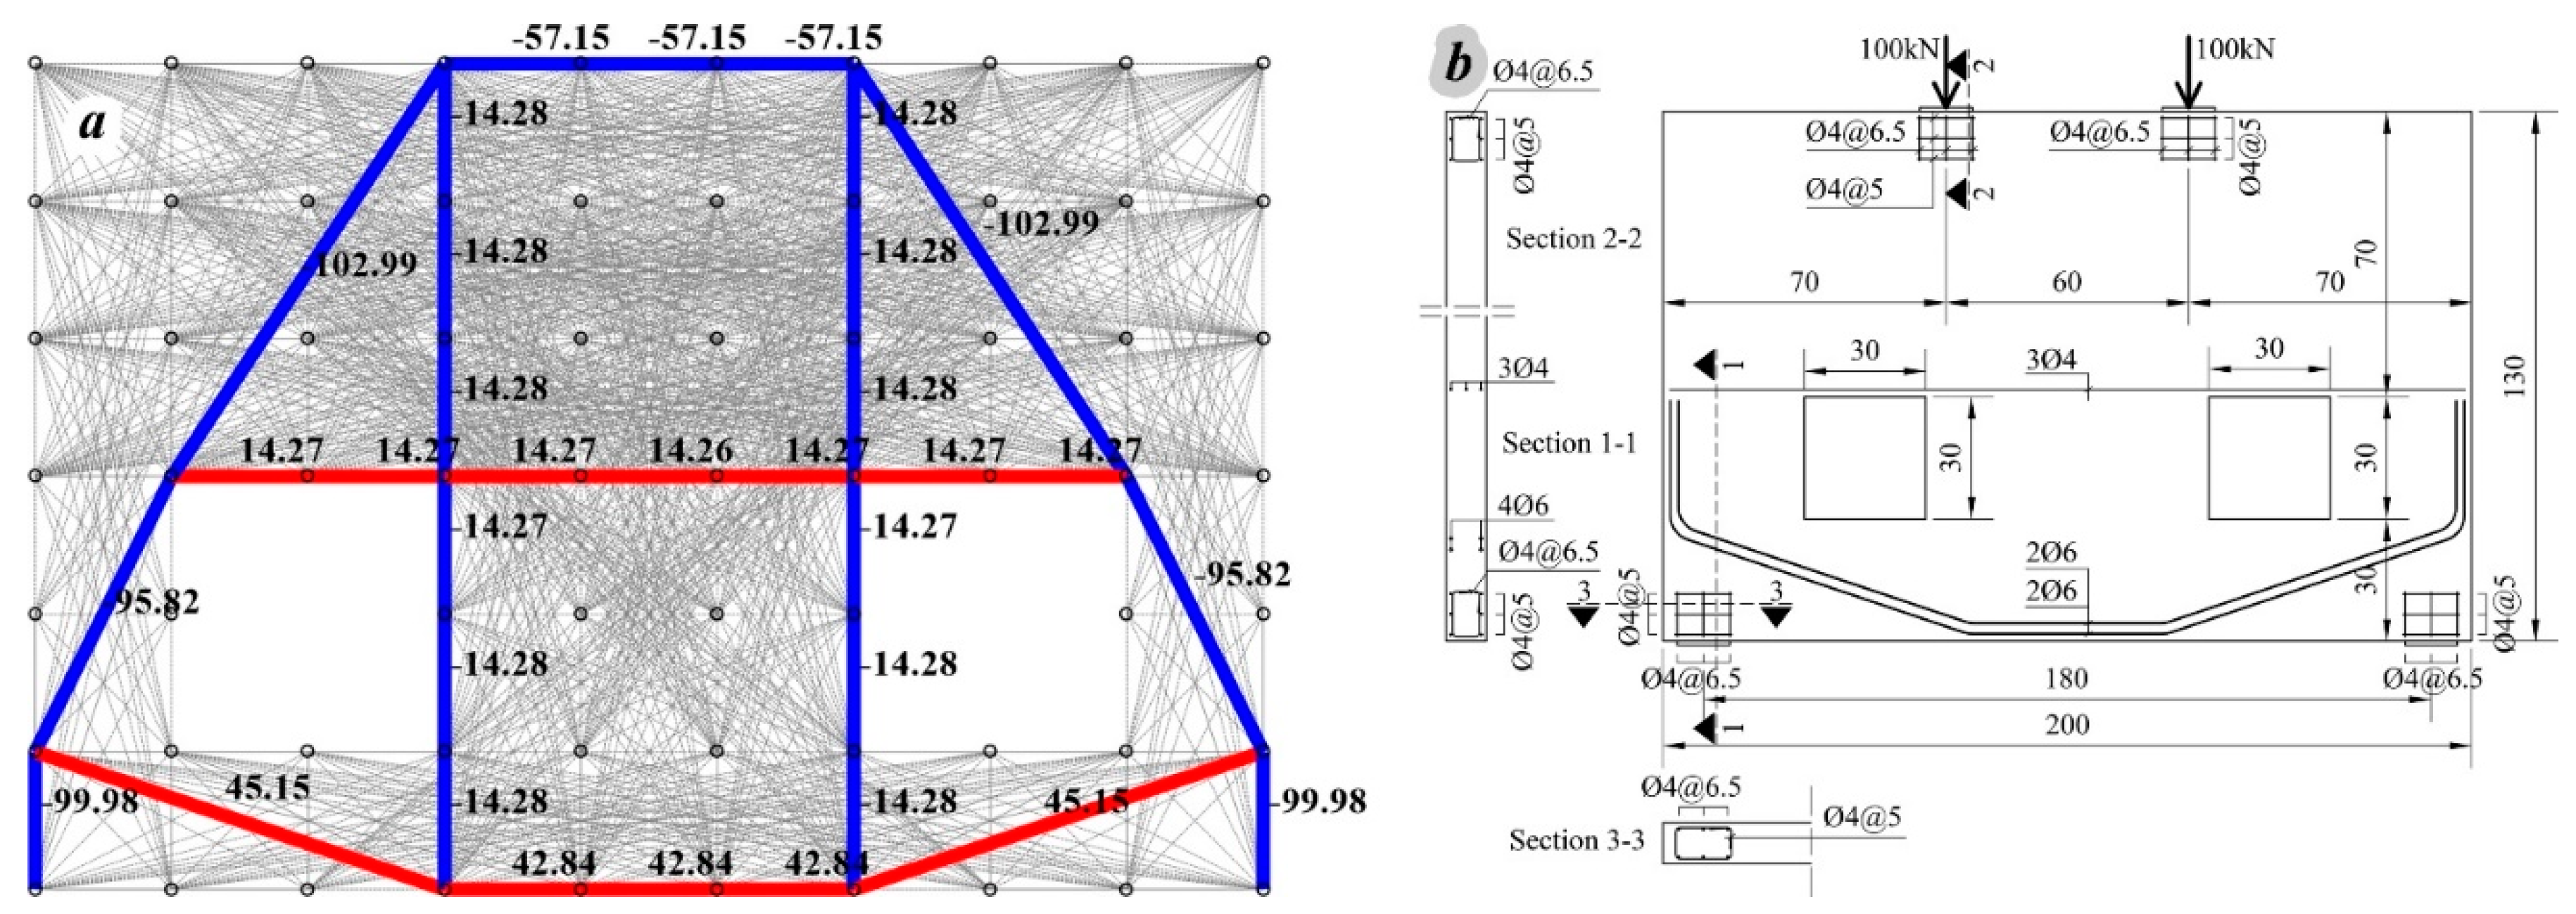
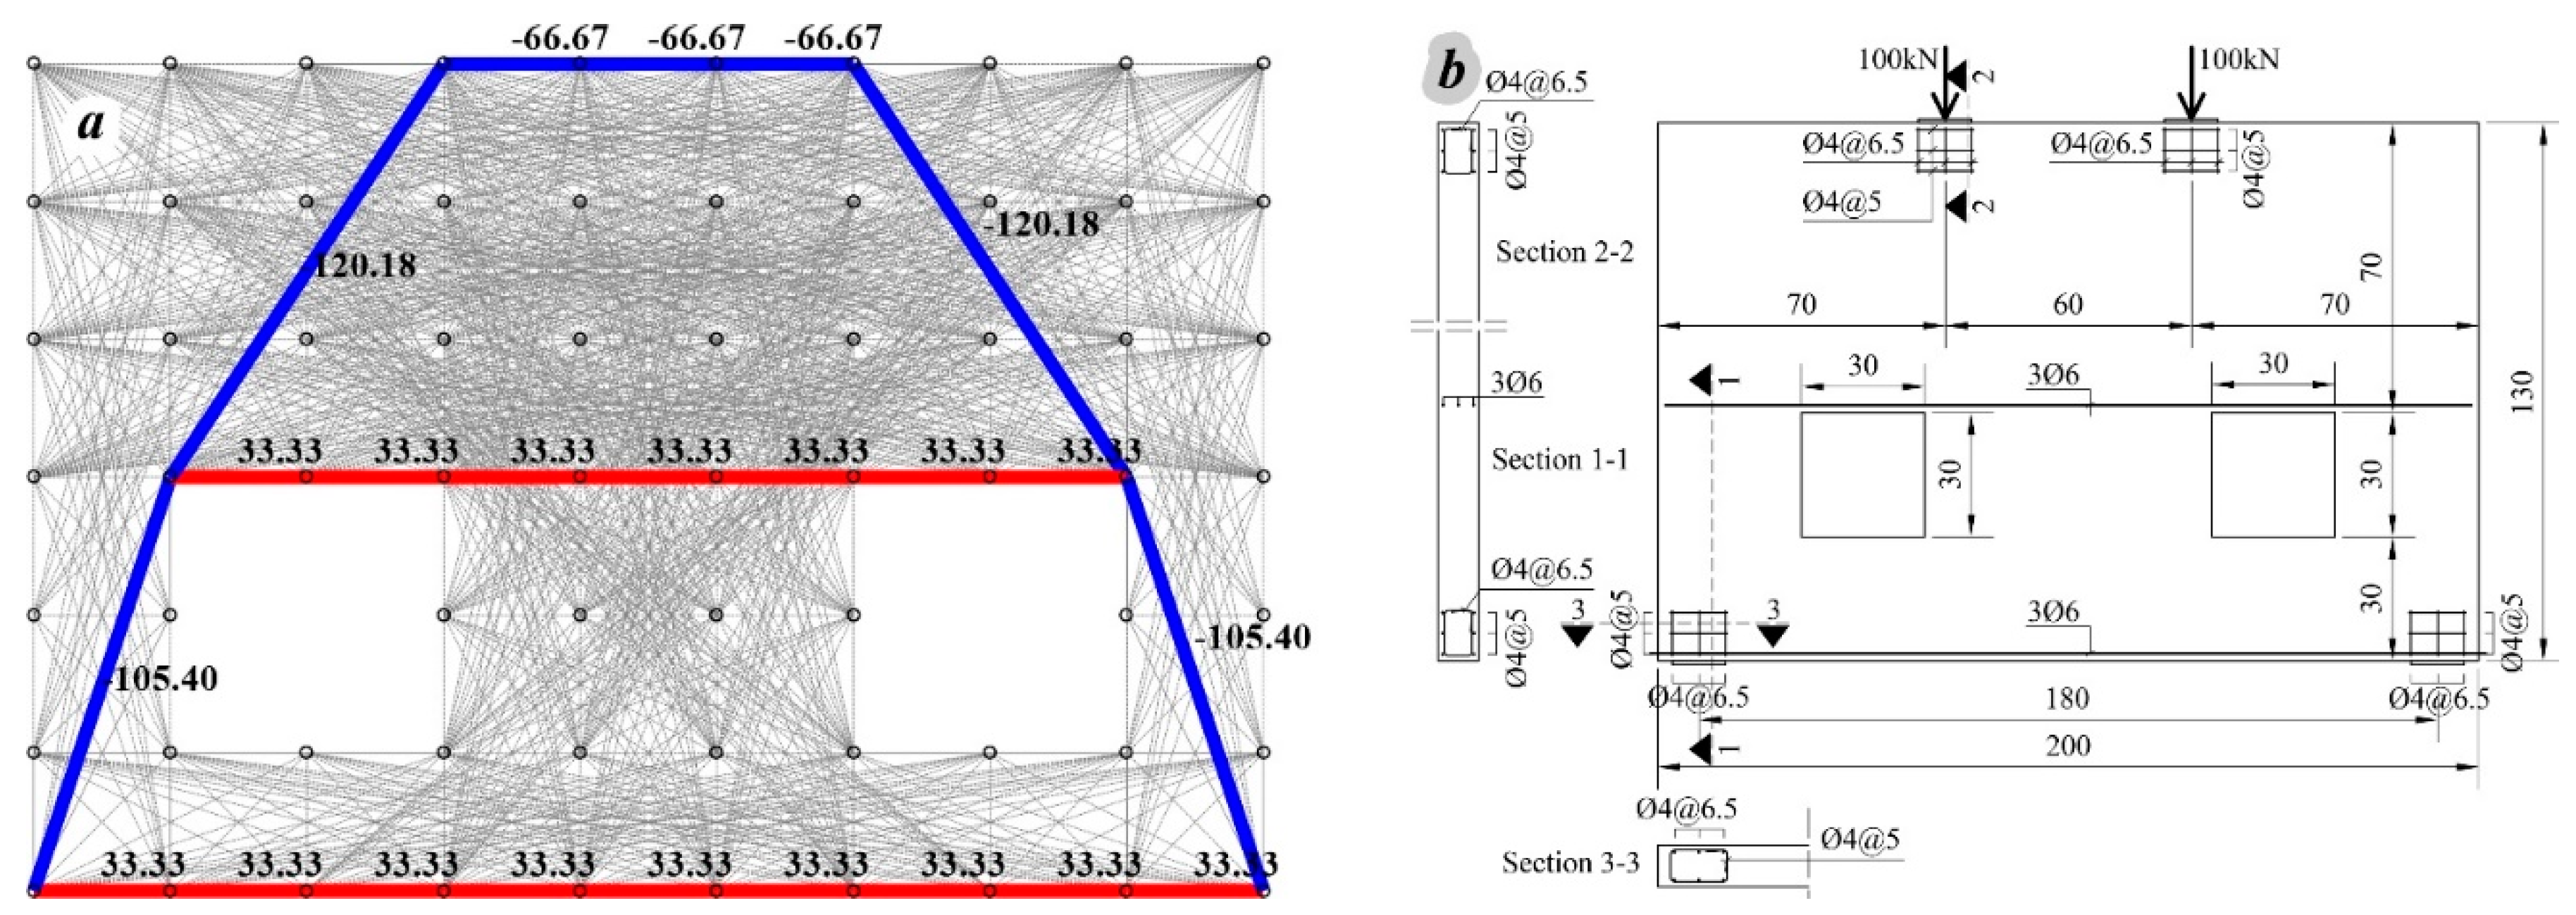
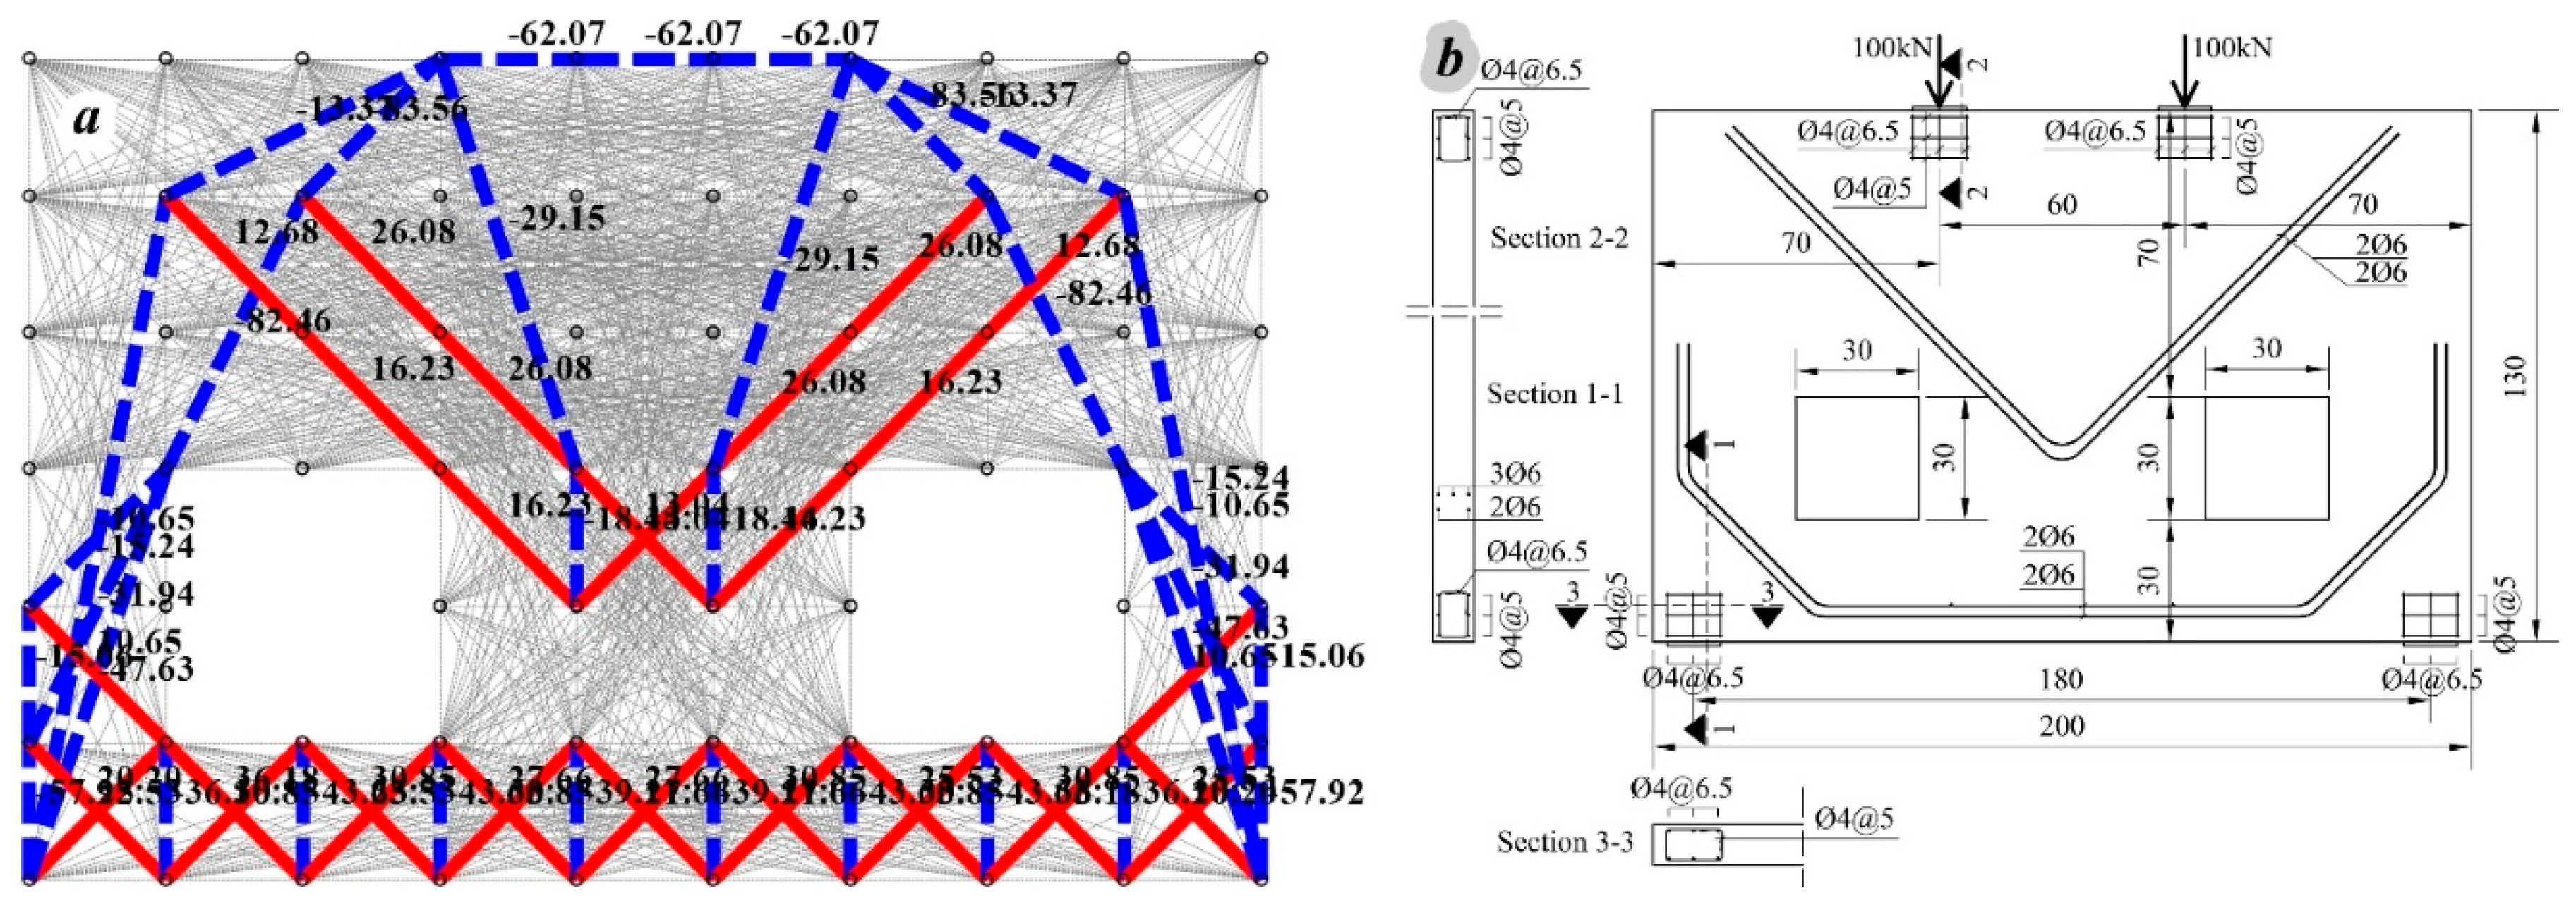
For the purpose of the researches presented in this paper, a software “ST method” for the automatic determination of Strut-and-Tie models and their application in the automatic design of reinforced concrete plane members has been developed by the authors of this paper. In
Figure 2 different members are given with corresponding Strut-and-Tie models, obtained with the software “ST method”. Deep beams loaded with vertical and horizontal concentrated forces are shown in
Figure 2a,b, and deep beams with openings loaded with vertical forces are shown in
Figure 2c,d. The main advantage of this program, which is described in detail in [
14], lies in the fact that based on the previously adopted parameters that affect the layout of the reinforcement in the element, it automatically determines the shape of the Strut-and-Tie model and its stress state. The obtained model is then used for automatic design. By varying the parameters that influence the layout of the reinforcement in the member, various forms of the Strut-and-Tie model can be obtained, whereupon the optimum shape can be achieved by establishing certain criteria, i.e., conditions, such as the simplicity of the reinforcement scheme or the amount of reinforcement.
The advantage of the program is reflected in the fact that, according to the proposed algorithm, replacing truss models of the real members, Strut-and-Tie models, can be obtained, with the corresponding values of axial forces in truss elements, which are required for the design according to the Strut-and-Tie method.
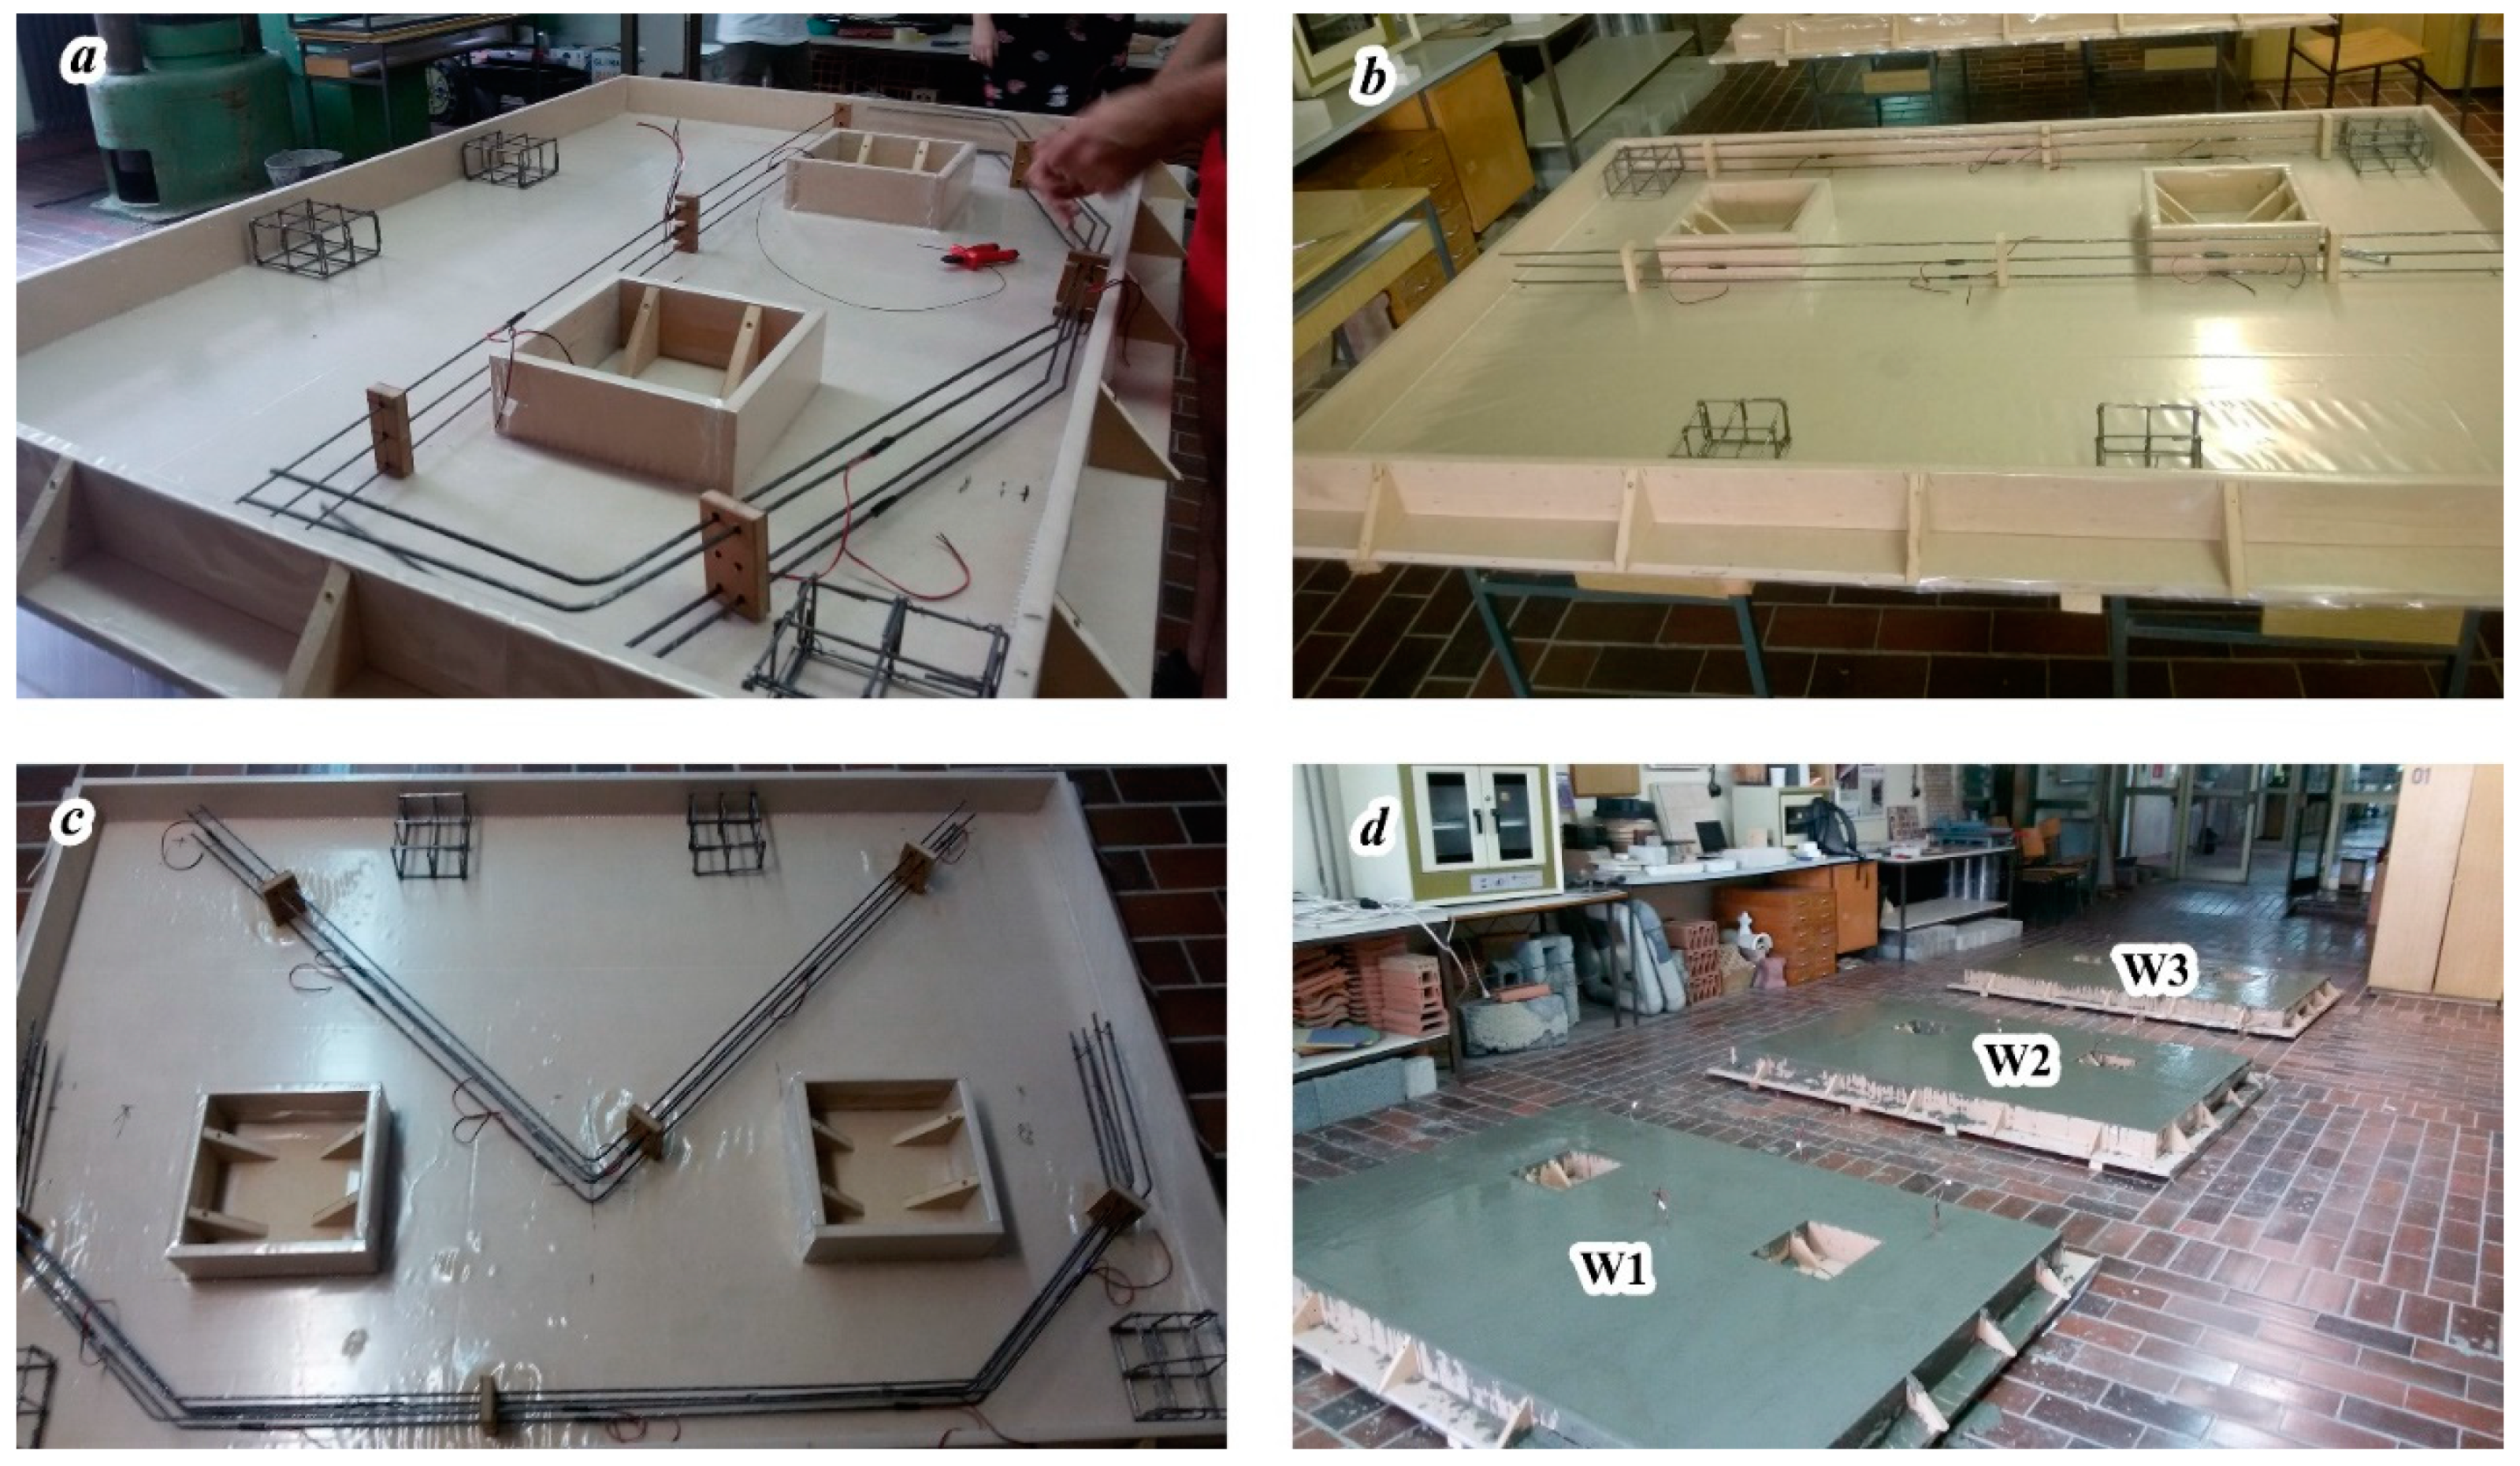
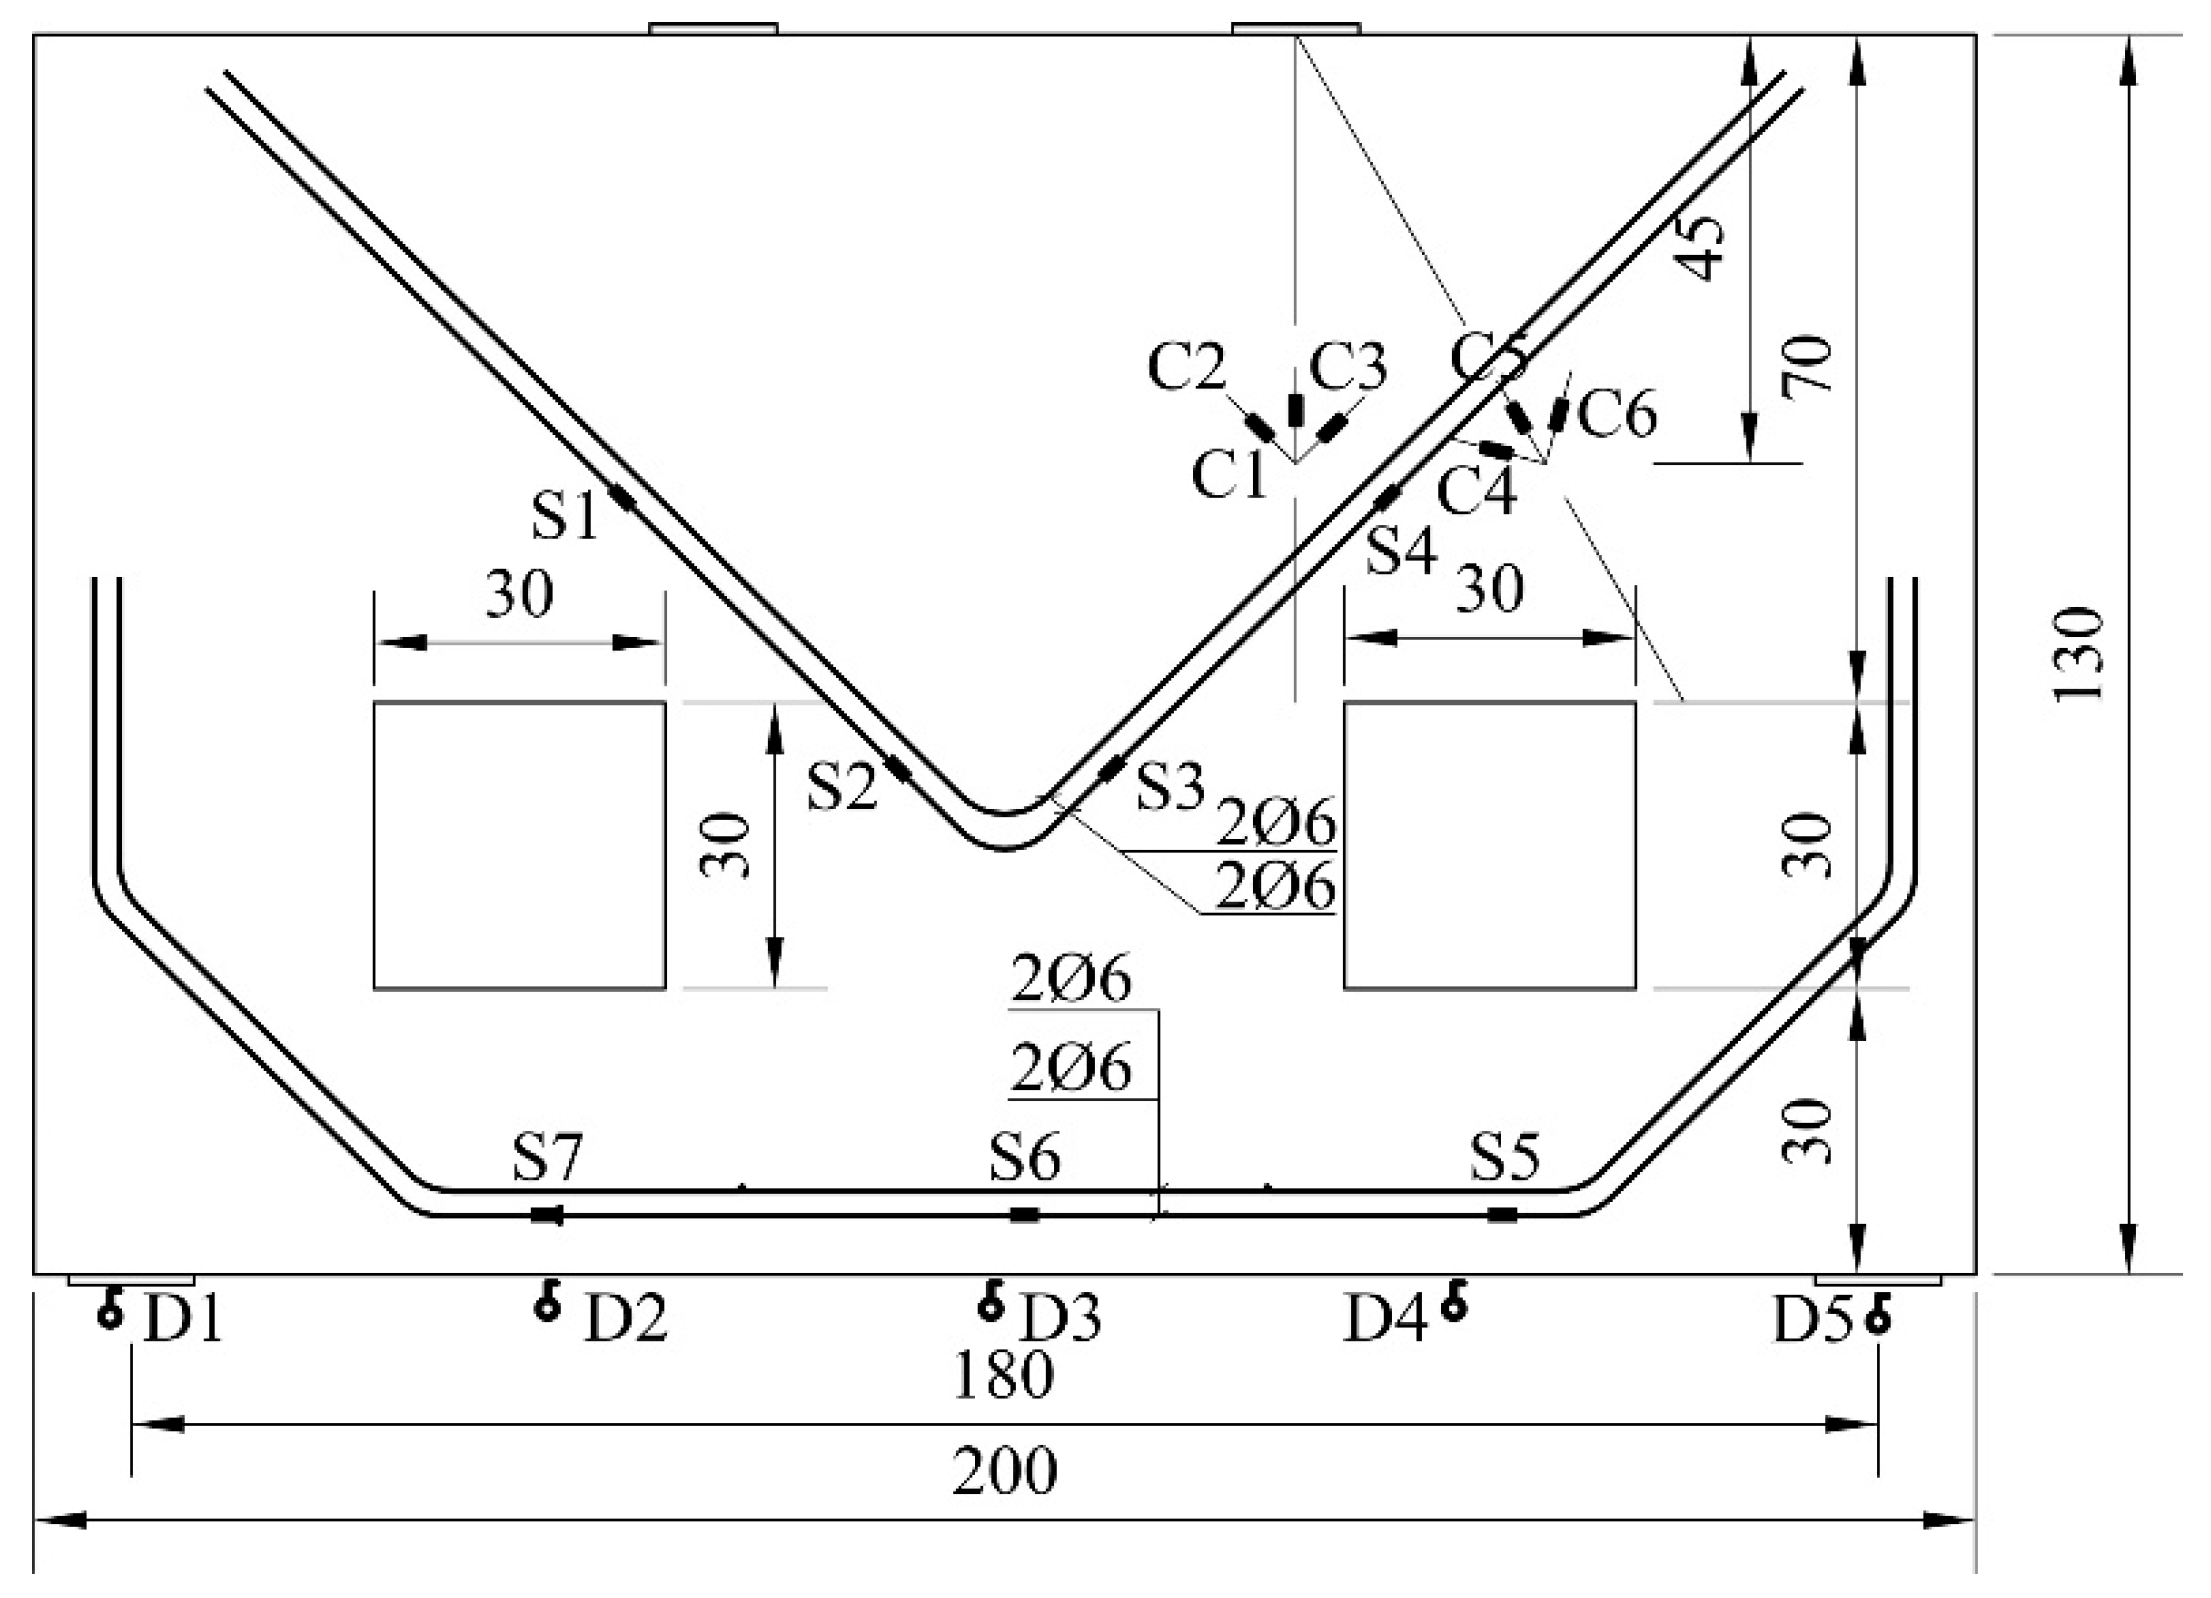
The main goal of the research presented in this paper is the experimental confirmation of the numerically defined forms of the Strut-and-Tie models obtained from the software “ST method”. These models were used for the design of the tested-reinforced concrete deep beams and the optimal model is selected on account of the simplicity of member reinforcement and its serviceability. Three reinforced concrete wall members with the length of 200 cm, the height of 130 cm and two openings measuring 30 × 30 cm were experimentally tested. The members were differentially reinforced and loaded with two concentrated forces of 2 × 100 kN. Based on the experimental results, it can be concluded that the proposal manner, implemented in the software ST method, is applicable for obtaining the Strut-and-Tie models.
For the analysis purposes in this paper, the finite element model (FEM) was developed in the commercial software Abaqus [
15] to simulate the behavior of the tested specimens, and was validated on the basis of the experimental results. This FEM model will provide opportunity for extrapolation of data on other, untested geometries of the members and reinforcement layouts in future research.
2. Determination of Strut and Tie Models Using Software “ST Method”
This chapter summarizes the procedure for determining the Strut-and-Tie models and is explained in detail in [
14,
16].
Strut-and-Tie models are suitable for the design of discontinuity regions in structural concrete elements, where the conventional analysis methods are incorrect, as the main modeling assumptions deviate significantly from the actual behavior (i.e., plane sections remain plane).
Discrete topology optimization [
17,
18], is implemented in the software “ST method”, which has the ability to analyze a reinforced concrete member in the plane. By discrete topology optimization, a member can be modeled with the truss system, such as the Strut-and-Tie model. One of the most common optimization conditions is the smallest amount of reinforcement.
In the software “ST method”, according to discrete topology optimization, the geometry of a member is represented with an initial network of nodes, which are interconnected by line elements (rods). The optimal density of this initial network is analyzed in detail in [
16]. The analysis for the determination of the Strut-and-Tie models is iterative, where the stiffness recalculation of individual elements is performed during each step, based on the analysis results from the previous step. The correction of cross-sectional stiffness depends on the sign and the intensity of the truss element force. The stiffness element is changed indirectly through changes in the cross-sectional area. The stiffness of the individual elements of the truss model is determined by the expression [
19,
20]:
The cross-sectional area of individual truss elements is determined with:
where
βi is the reduction factor which depends on the “desired” reinforcement layout in the member;
Ni,j − 1 is the force in the
ith simple element from
j − 1 iteration;
Ed is the modulus of elasticity for concrete (compression) or steel (tension);
fd is the design strength of the concrete or reinforcement depending on the nature of the axial force in the truss element (compression-concrete or tension-steel), and
Li is the length of the element. The value of the
β coefficient depends on the angle of the “desired” reinforcement inclination. The values of the
β coefficient for the compressed struts are always 1. For tensioned truss elements, according to the desired reinforcement, they can be 0 or 1. Adopting the value of 1 for one of the previously mentioned angles implies the “desired” reinforcement inclination. Usually, for the tensioned directions at an angle of 0°, 45°, or 90°, the
β coefficient has the value 1, and for other angles the value is 0, because in this way the simplest reinforcement layouts are obtained.
According to the axial force sign (compression–concrete or tension–steel), the modulus of elasticity of individual truss elements shall be adopted. In the zero iteration, a mesh of truss elements is created with boundary conditions and the external loads. All model elements have the same mechanical and geometrical characteristics of the cross-sections. The axial forces in the elements are determined on the established model. Based on the sign of the axial forces, the area of the cross-sections is determined for all the elements according to Equation (2). Simultaneously, the modulus of elasticity for each truss element is corrected. In this way, the truss model is formed for the next iteration. Iterations are repeated until the change of the cross-sectional areas of the truss model elements in two consecutive iterations is small enough. Recommendations for completing the iterative procedure and determining the Strut-and Tie model, as a truss model from the last iteration, are given in [
14,
16].
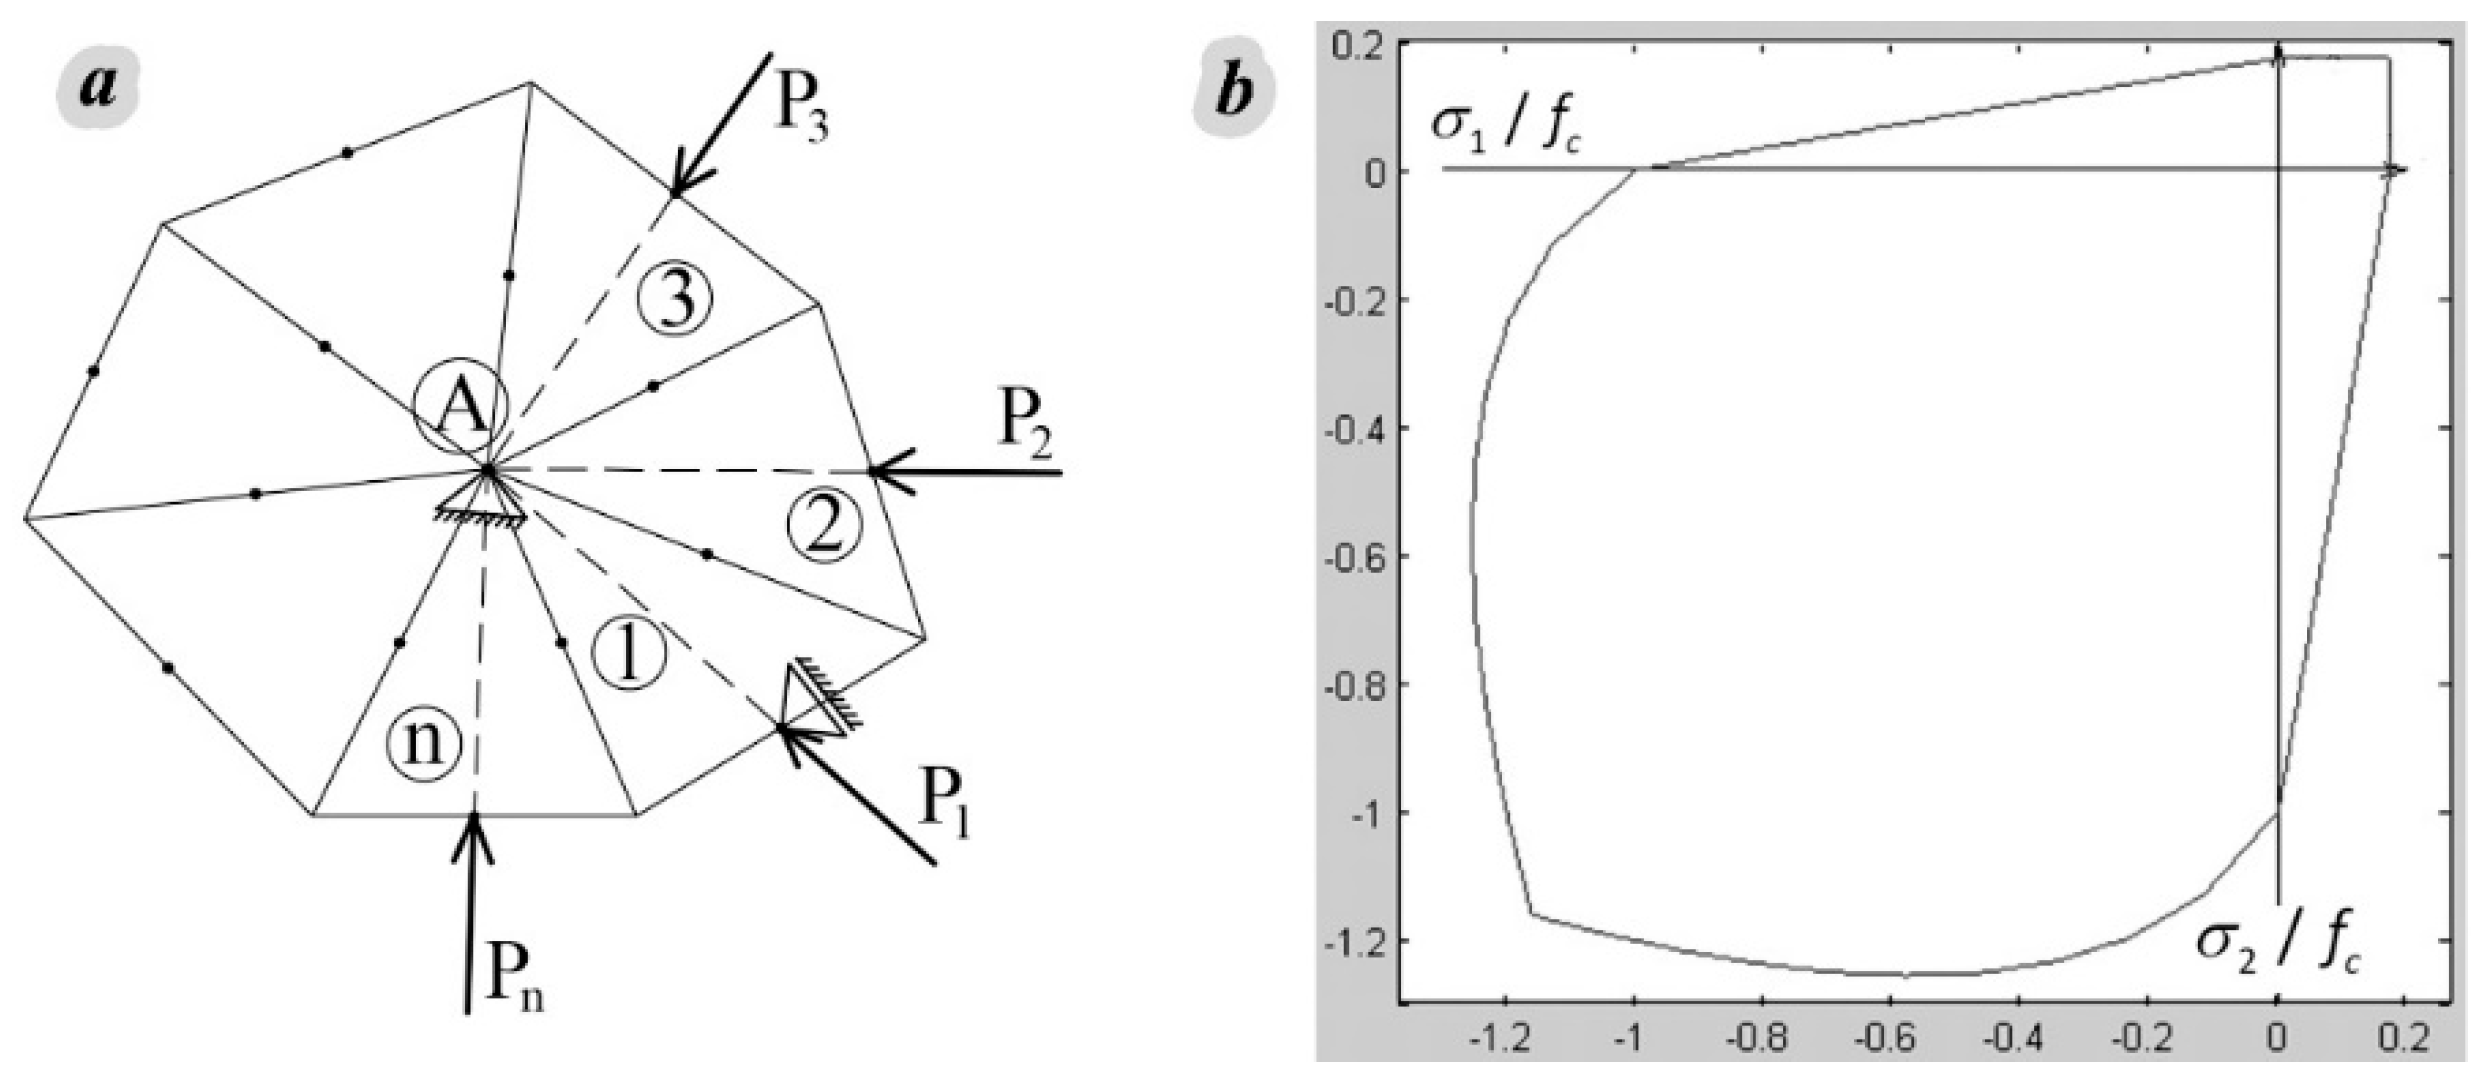
In the software “ST method”, the struts and ties are designed according to [
21] and the nodal zones are analyzed as non-hydrostatic, with the procedure defined by authors and presented in detail in [
16,
22]. The nodal zone is defined as a polygon, with geometry determined by the width of the rods that are crossing at the node,
Figure 3a. The stress state in a nodal zone defined in such way is controlled by the biaxial criterion of concrete, taken from the software “ST method”,
Figure 3b, according to [
23], and considering the use of efficiency factors depending on the type of the node according to [
21].
The nodal zone polygon is modeled with multiple LST triangular finite elements that have a common point, node A, where all main axes of corresponding Strut-and-Tie model rods cross. The axial forces of struts and ties are applied in the middle of the polygon edges (P1, P2, ... Pn). In order to solve the stress state of the node, one support is set in point A, and the second support is set in the middle of the one polygon edge,
Figure 3a. In this way displacements of the polygon, as a rigid body, are eliminated, and this behavior approximately corresponds to the behavior of the isolated node from the concrete volume of the member.
4. Finite Element Modeling
As part of this research, FEM models were developed in Abaqus 2016 [
15] for the simulation of the reinforced concrete deep beams behavior, which were validated on the basis of the experimental test results. In future researches, one of the FEM models will be useable for analyzing the behavior of this type of members, but with different geometric characteristics and reinforcement layouts. In the models, the analyses were performed assuming a plane stress state. An analysis involving geometric and material nonlinearity was applied.
In the numerical simulations of the behavior of the tested specimens, two FEM models were formed for each specimen individually. The first FEM model (FEM A) is shown in
Figure 16. The static system of model FEM A corresponds to the static system of a simple beam applied in the program “ST method” for the design of walls,
Figure 6,
Figure 7 and
Figure 8.
According to the results, crack arrangements, Figure 22, and mid-span deflection, Figure 24, determined on the numerical model FEM A and experimental results, it is shown that the differences were large. The main reason is the existence of an interaction between the steel frame and the tested specimens,
Figure 14, which is explained in detail in Chapter 5. Regarding this, a more complex FEM model (FEM B) was formed, which is shown in
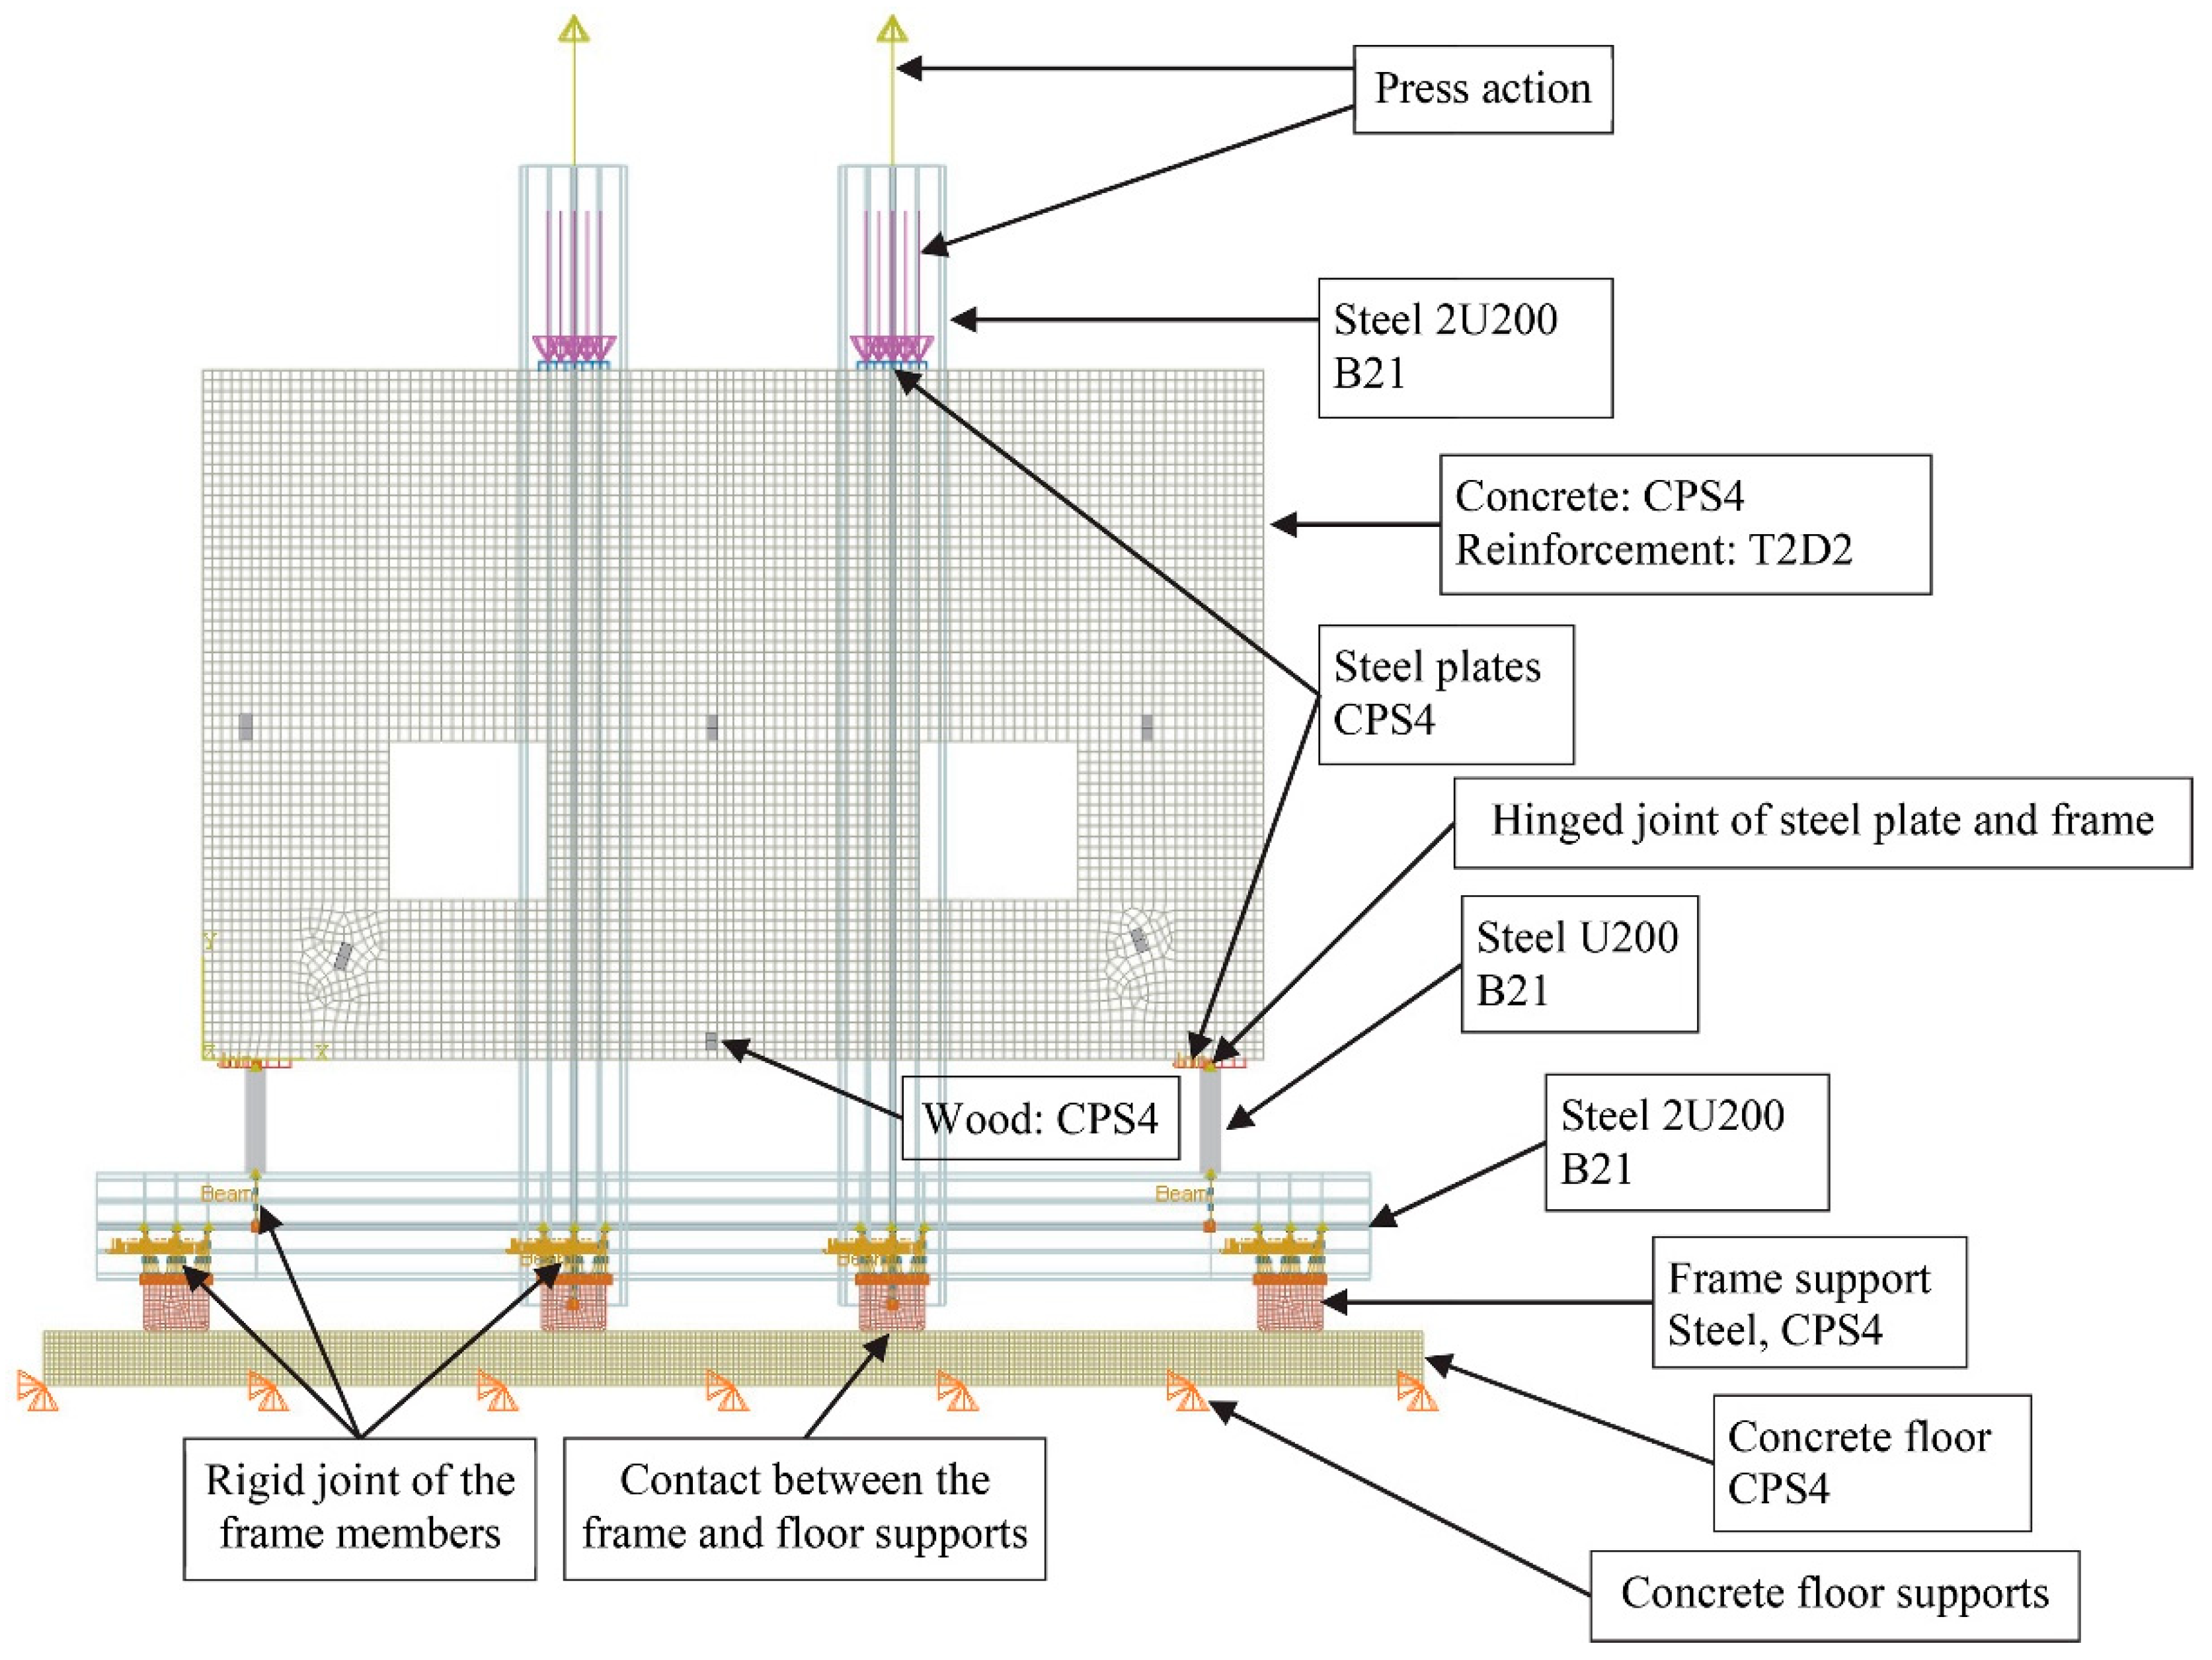
Figure 17. In the models FEM A and FEM B, the same dimensions of the tested samples were applied, as well as the same reinforcement layouts. Both models used the same constitutive model to simulate the nonlinear behavior of concrete and reinforcement, as well as the same load application scheme. The model FEM B is expanded with a model of steel frame, contact with the floor base, and the spacers for reinforcement.
The nonlinear behavior model for reinforced concrete, the so-called continuum mechanics-based model, was applied. In such model, concrete can be discretized with three-dimensional or two-dimensional solid finite elements, and the reinforcement is modeled with truss finite elements. The constitutive model for concrete is the concrete damaged plasticity (CDP) model, formed by a combination of plasticity theory and damage mechanics according to recommendations [
33,
34,
35,
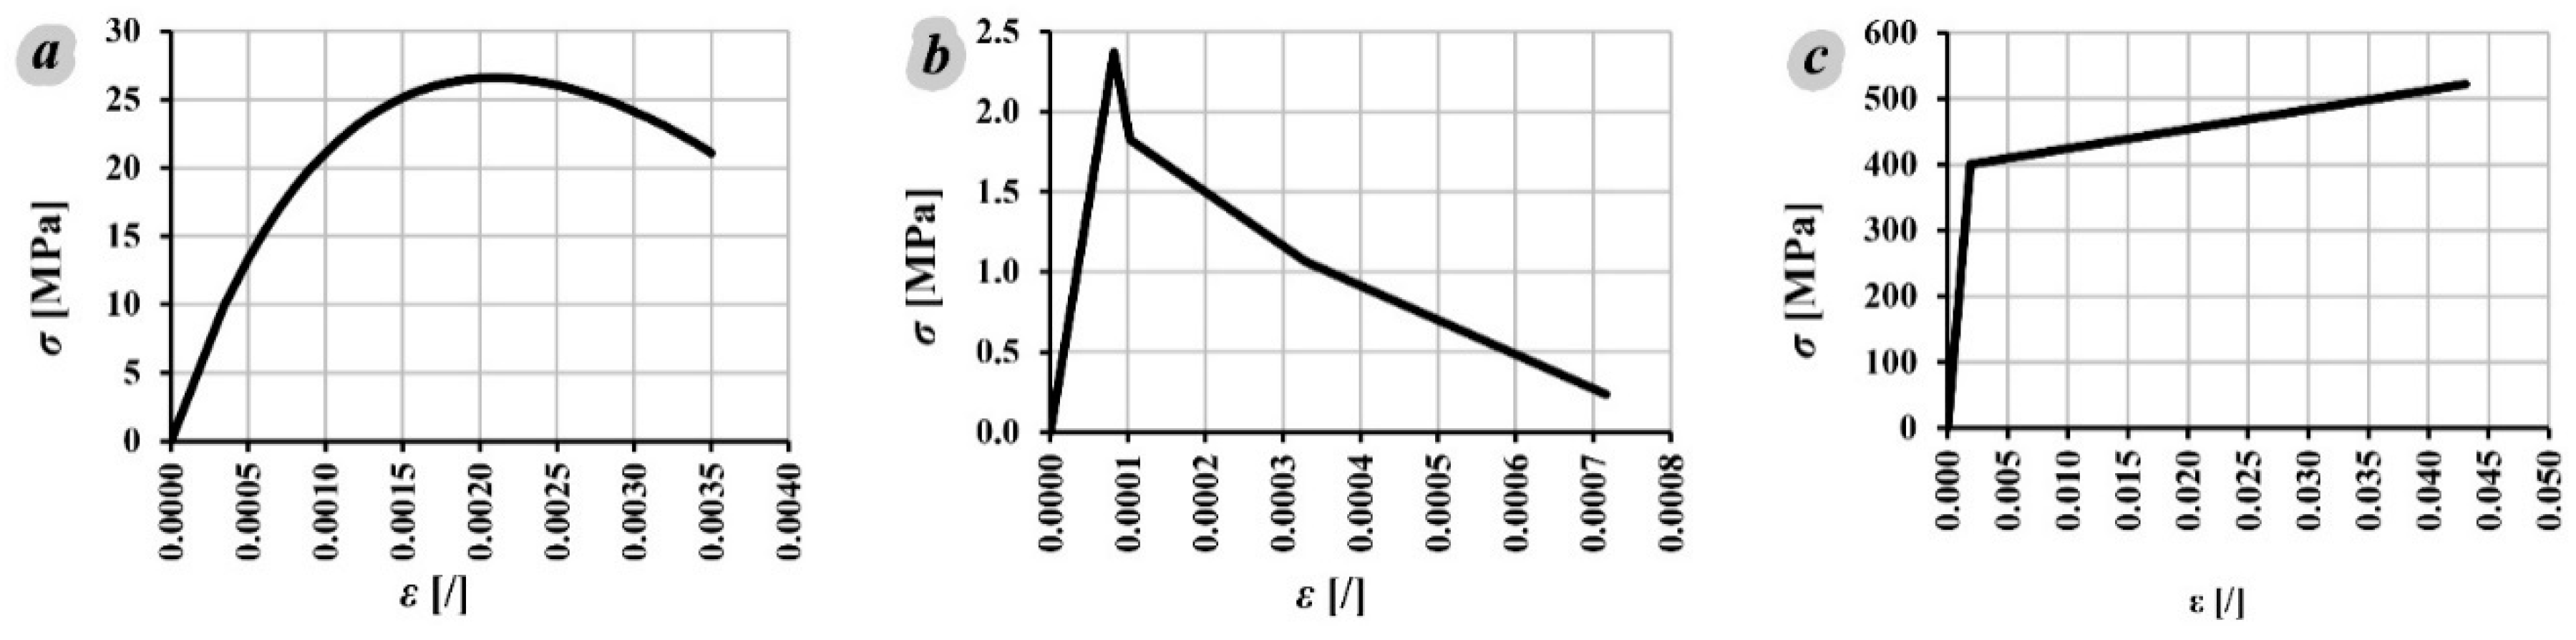
36]. In all nonlinear analyses, the relationship between stress and deformation in concrete at uniaxial pressure prescribed in EN1992-1-1 [
21] was applied.
Figure 17 shows the relationships between engineering stresses and strains at uniaxial pressure and tension for concrete and reinforcement.
The values of the constituent parameters of the CDP model were adopted based on the recommendations given [
37] and summarized as
Kc = 0.7,
ψ = 13°,
σbo/σco = 1.16, and
ϵ = 0.1.
Kc defines the relationship between the second invariant of the stress in the meridional plane at tensile and pressure,
ψ is dilatancy angle,
σbo/σco is the ratio of the biaxial to the uniaxial compressive strength of concrete and ϵ is the eccentricity of the plastic potential surface. Damage variables for compression and tension were determined according to the recommendations given in [
37]. The modulus of elasticity of the concrete was 30 GPa and the density 2500kg/m
3. CPS4 finite elements were used to model the concrete (C—continuum stress/displacement; PS—plane stress; 4–4-node) [
15], for the adopted uniform mesh size of 20 × 20 mm. The constitutive behavior of steel for reinforcement is modeled by a bilinear relationship between stress and strain. The modulus of elasticity was 210 GPa and the density 7850 kg/m
3. The reinforcement was modeled by T2D2 finite elements (two-dimensional truss element; T—truss, 2D—two-dimensional; 2—number of nodes) [
15], for the adopted uniform mesh size of 20 mm. The bond between concrete and reinforcement was modeled without slip. The values of compressive strength and tensile strength of concrete and the yielding strength of reinforcement were determined experimentally and given in
Section 3.1. In all analyses, the loading protocol was such that the weight effect of the reinforced concrete wall and the steel frame was analyzed first, and this condition was adopted as initial for the analysis of the press action.
In the FEM B model,
Figure 18, the linear elastic behavior of the steel frame for member testing was adopted (the modulus of elasticity was 210 GPa and the density 7850 kg/m
3). B21 finite elements were used for the steel frame modeling (Timoshenko beam; B—beam; 2—beam in plane; 1—linear interpolation”) [
15], for the adopted uniform mesh size of 50 mm. The contact between the supports of the steel frame and the concrete base,
Figure 13, was modeled with friction with the possibility of separating the elements in contact. The so-called “Hard” type of contact [
15] was applied, with defined behavior in the normal and tangential directions to surfaces in contact. In the case of contact (“zero” distance between surfaces in contact), the pressure was transmitted in the normal direction without restriction, and the option of rigorous penetration prevention was adopted. If the contact is not made, there is no transfer of pressure in the normal direction. The behavior in the tangential direction features the possibility of friction forces occurrence between the surfaces in contact. The coefficient of friction in all analyzes had a value of 0.2. Since the appearance of the first member cracks was influenced by the arrangement of the wooden spacers for fixing the reinforcement in this model FEM B model, on location of the spacers, the discontinuity of concrete volume was modeled so it can correspond to the experimental setup. Wooden spacers were modeled as CPS4 finite elements with linearly elastic behavior (the modulus of elasticity was 10 GPa and the density 500 kg/m
3).
5. Results and Discussion
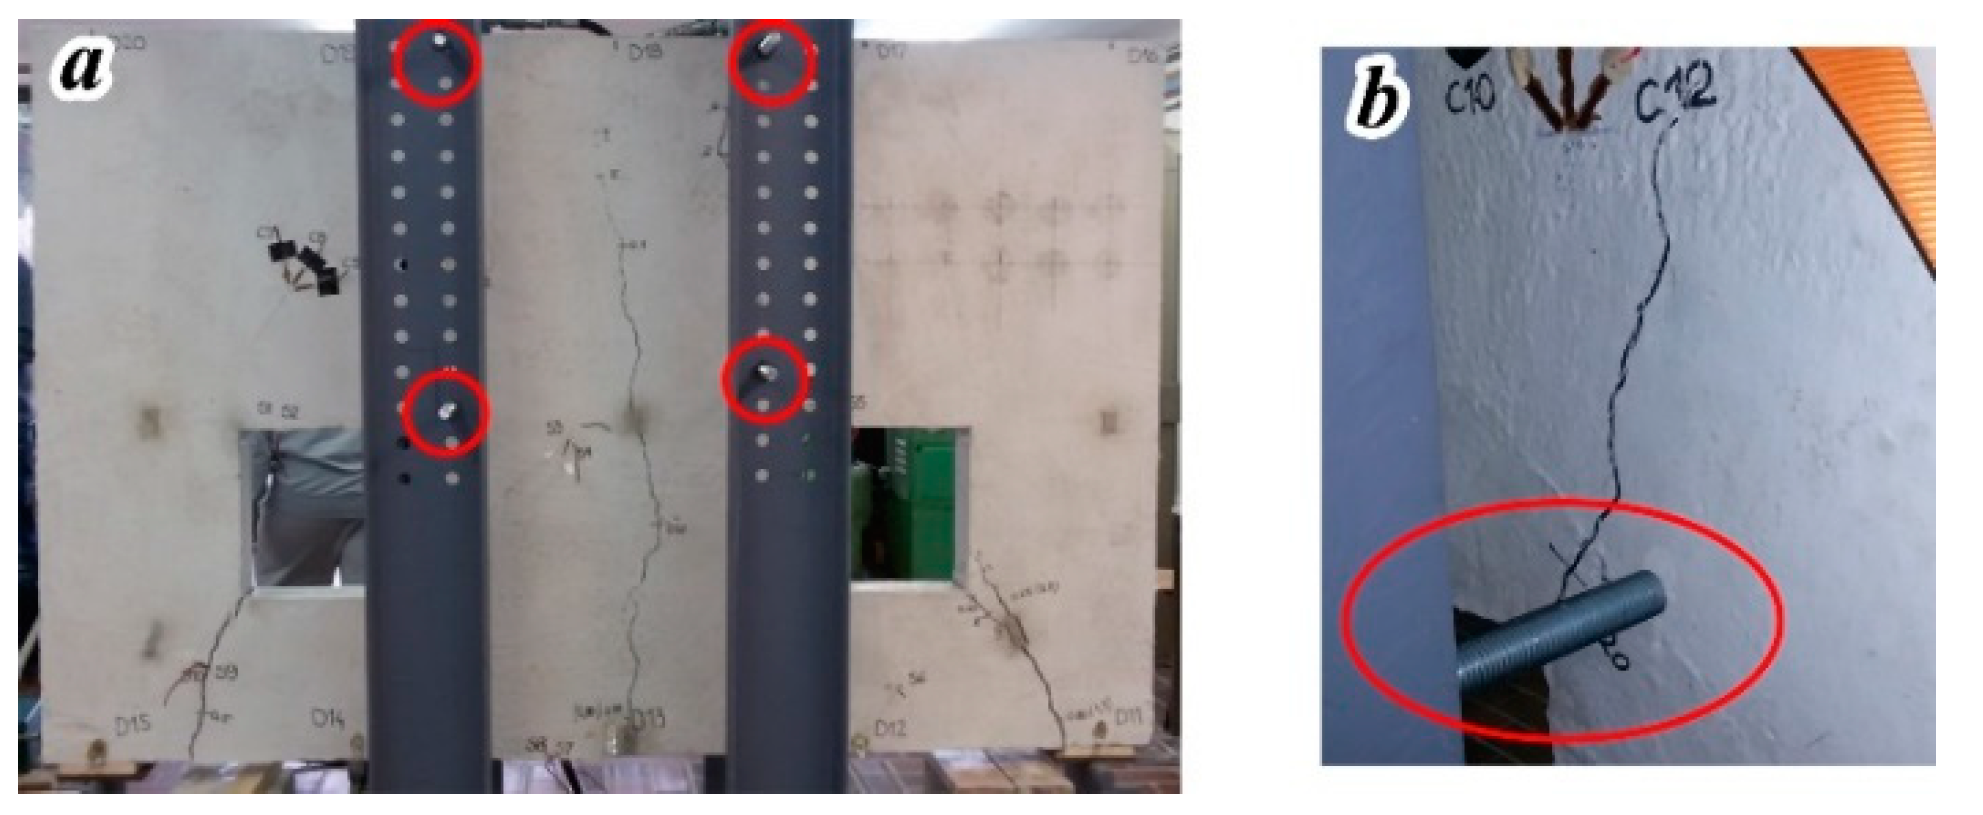
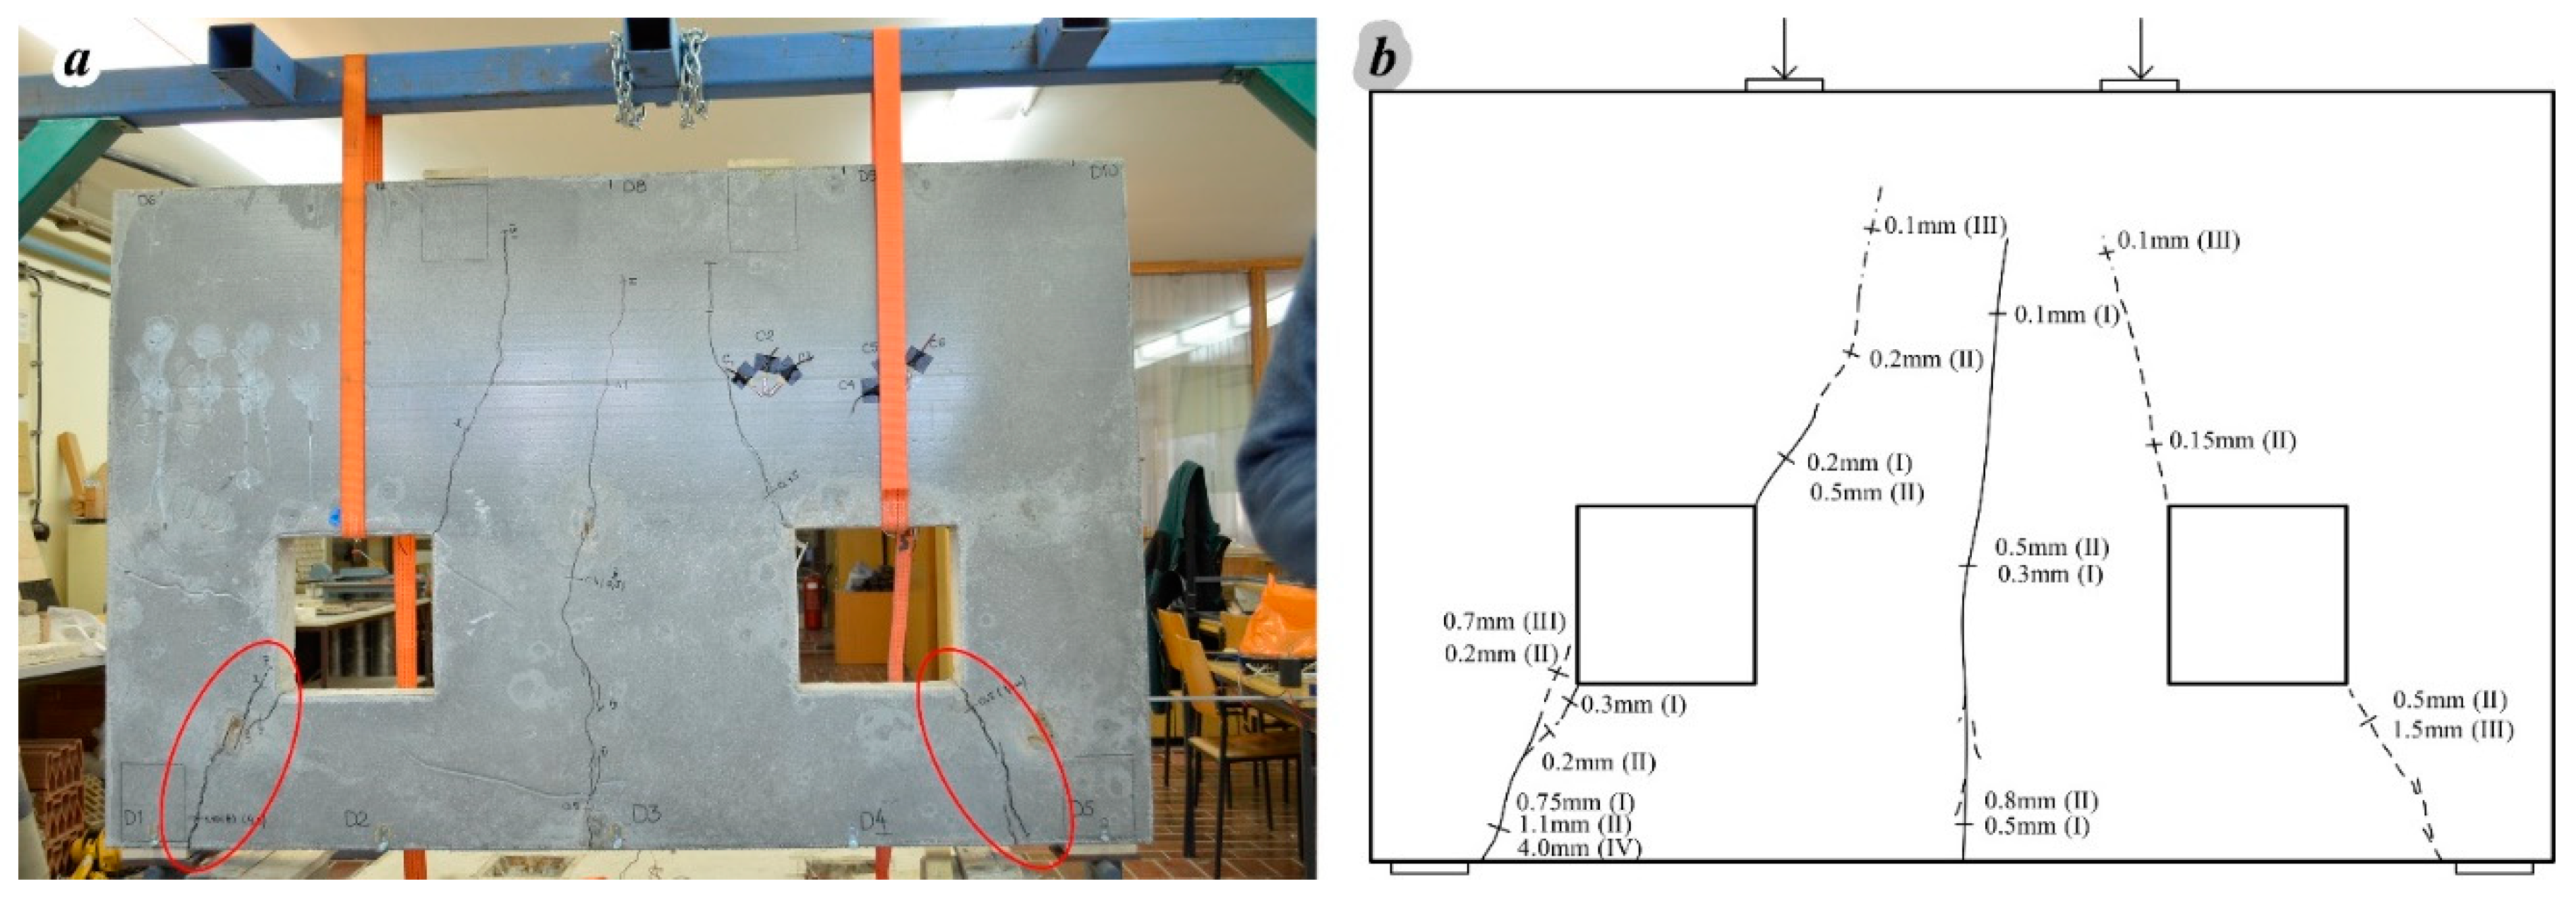
During the testing of the reinforced concrete member W1, the first cracks appeared at the load level of 2 × 90 kN, with the layout and widths as shown in
Figure 19, (cracks in Phase I). At the load of 2 × 10⁵ kN, new cracks appeared and the widths of the existing cracks increased (cracks in Phase II). By further load intensity increasing, no new cracks appeared, but the existing cracks continued to propagate in both length and width (cracks in Phase III, at the load intensity of 2 × 115 kN). At the maximum load level of 2 × 150 kN, only the increase in the width of the existing cracks was registered (cracks in Phase IV).
According to the failure pattern (circled cracks in red color,
Figure 19), the weak regions of the specimen were the inclined cracks between the supports and the holes.
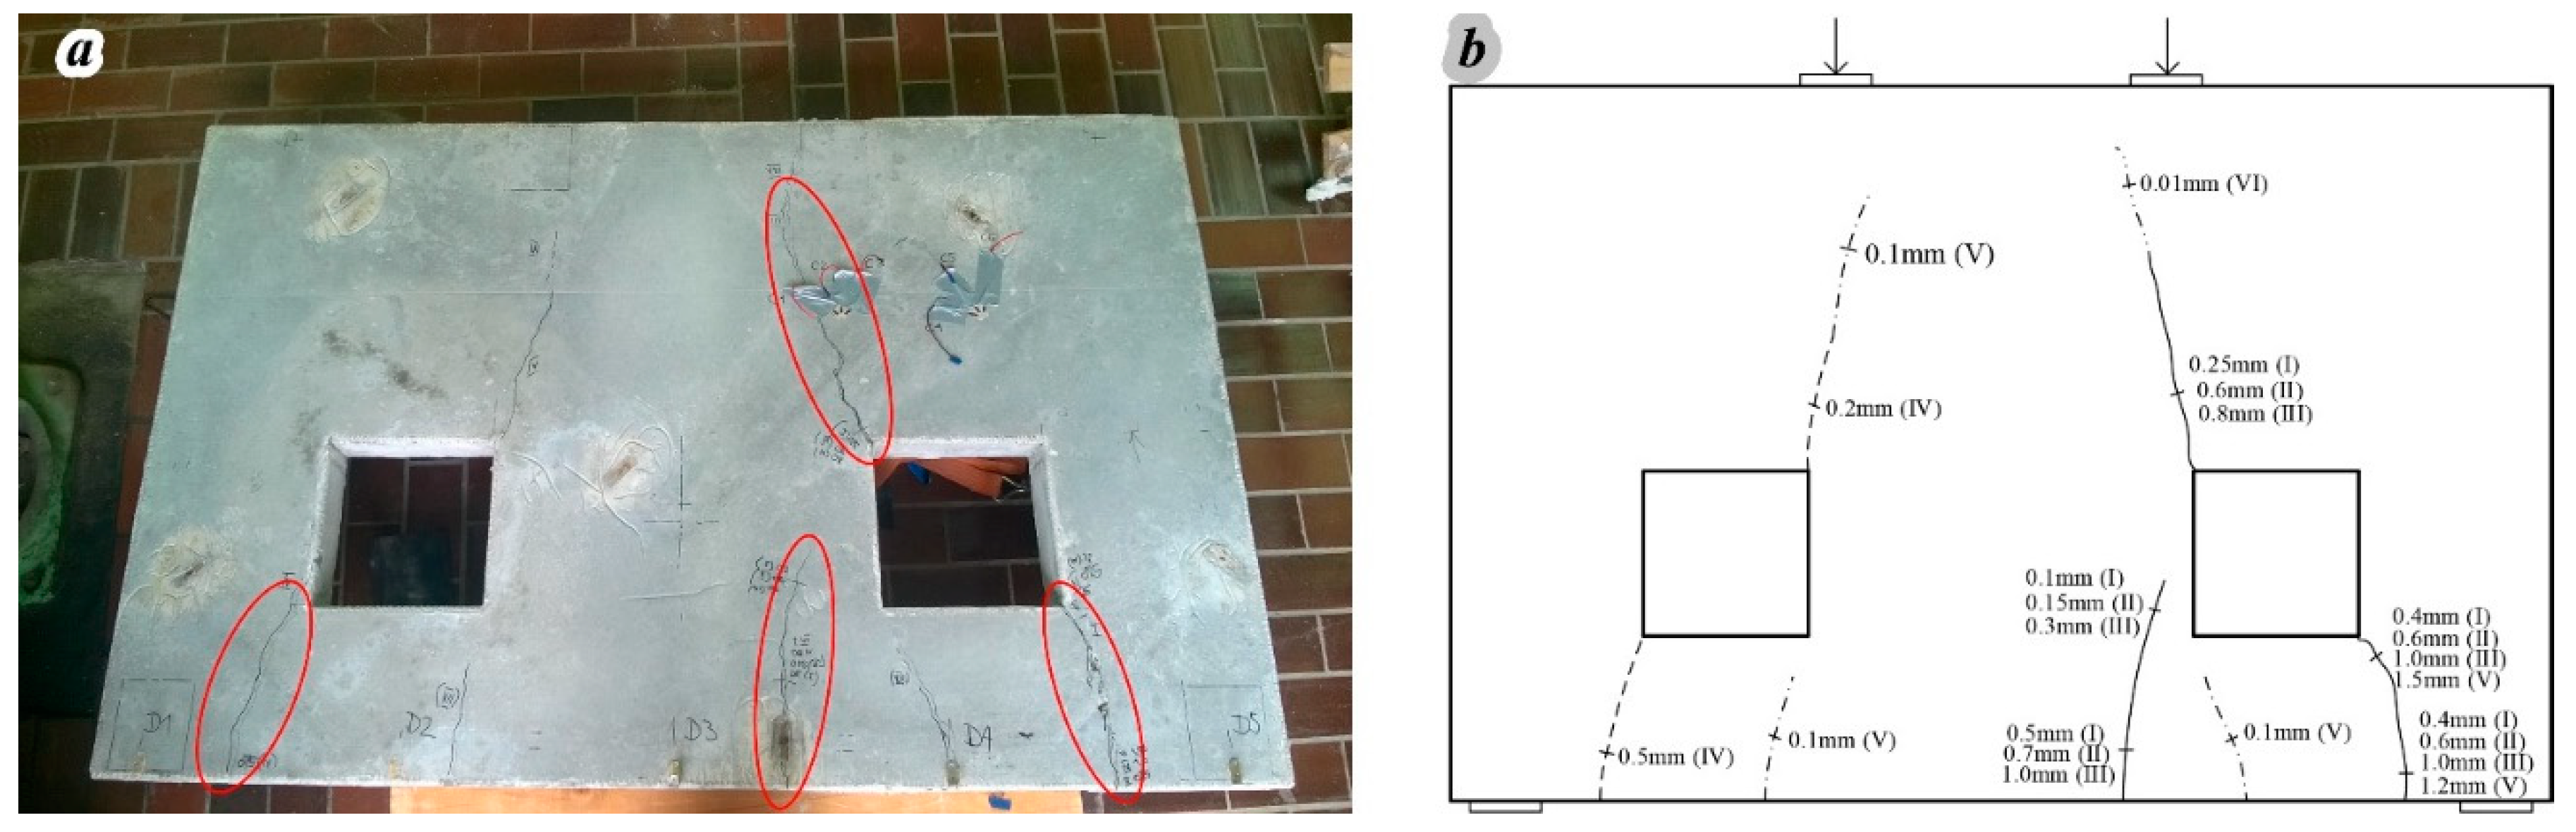
In the specimen W2, the first crack was formed at the load level of 2 × 90 kN. The position and width of this crack are shown in
Figure 20, (crack in Phase I). By increasing the load level during Phase II (at load intensity of 2 × 100 kN), the new cracks appeared and the propagation of the width of the existing crack was seen.
In Phase III (load level of 2 × 120 kN), the new cracks appeared and the existing cracks showed an increase in length and width. Similarly, further increasing of the load intensity caused new crack appearances while the existing cracks showed continuous propagation of their length and width (cracks in Phase IV, at a load level of 2 × 150 kN). The maximum load level for the specimen W2 was 2 × 150 kN. The failure pattern (circled cracks in red color,
Figure 20) shows that the weak regions of the specimen were the vertical mid-span crack and the inclined crack between the right support and the hole.
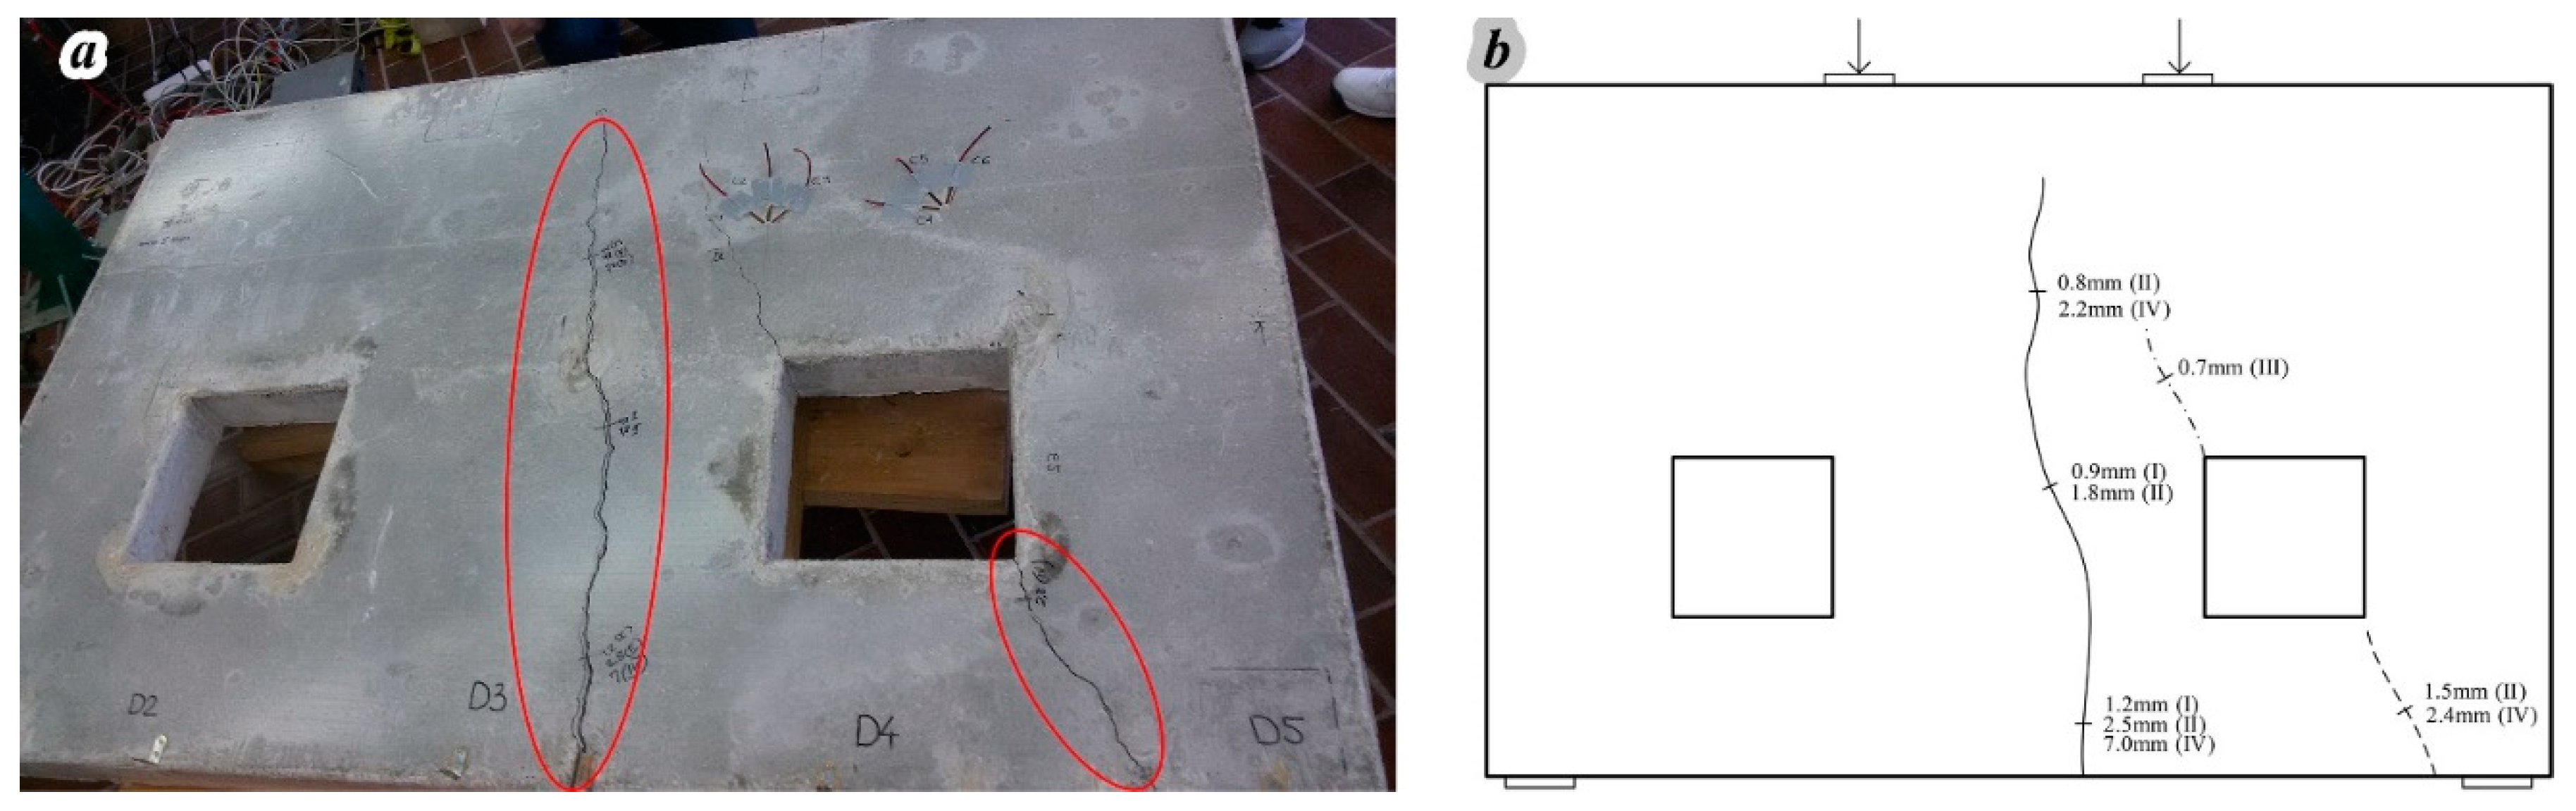
At the load level of 2 × 70 kN, the first cracks appeared in the reinforced concrete specimen W3 (the crack in Phase I),
Figure 21. As the load intensity increased, the width increase and length propagation of the existing cracks occurred (the crack in Phase II at the load level of 2 × 80 kN and the crack in Phase III at the load level of 2 × 90 kN). At the load level of 2 × 110 kN, new cracks appeared (cracks in Phase IV). By further increasing the load intensity, new cracks appeared and the existing cracks continued to propagate in length and width (cracks in Phase V at the load level of 2 × 140 kN). Further increase of the load intensity resulted in the appearance of new cracks, as well as in propagation and width increase of the existing cracks (cracks in Phase V at the load level of 2 × 140 kN). The maximum load level for the specimen W3 is 2 × 150 kN with crack patterns and widths in Phase VI, as shown in
Figure 21. Based on the failure pattern (circled cracks in red color,
Figure 21) the weak regions of the specimen were inclined cracks between the supports and the holes, the inclined crack in the upper zone of the right hole and the vertical crack near the right hole.
In the W1 and W2 members, the first cracks occurred at a load level of 2 × 90 kN, while in the member W3 they occurred at a load level of 2 × 70 kN, which is summarized in
Table 7. Regardless of the amount of embedded reinforcement, which is placed only in the directions of tensioned Strut-and-Tie elements of models obtained from the software “ST method”, the size of the formed cracks did not cause the disintegration of the members. In reality, they could carry more than the maximum applied load.
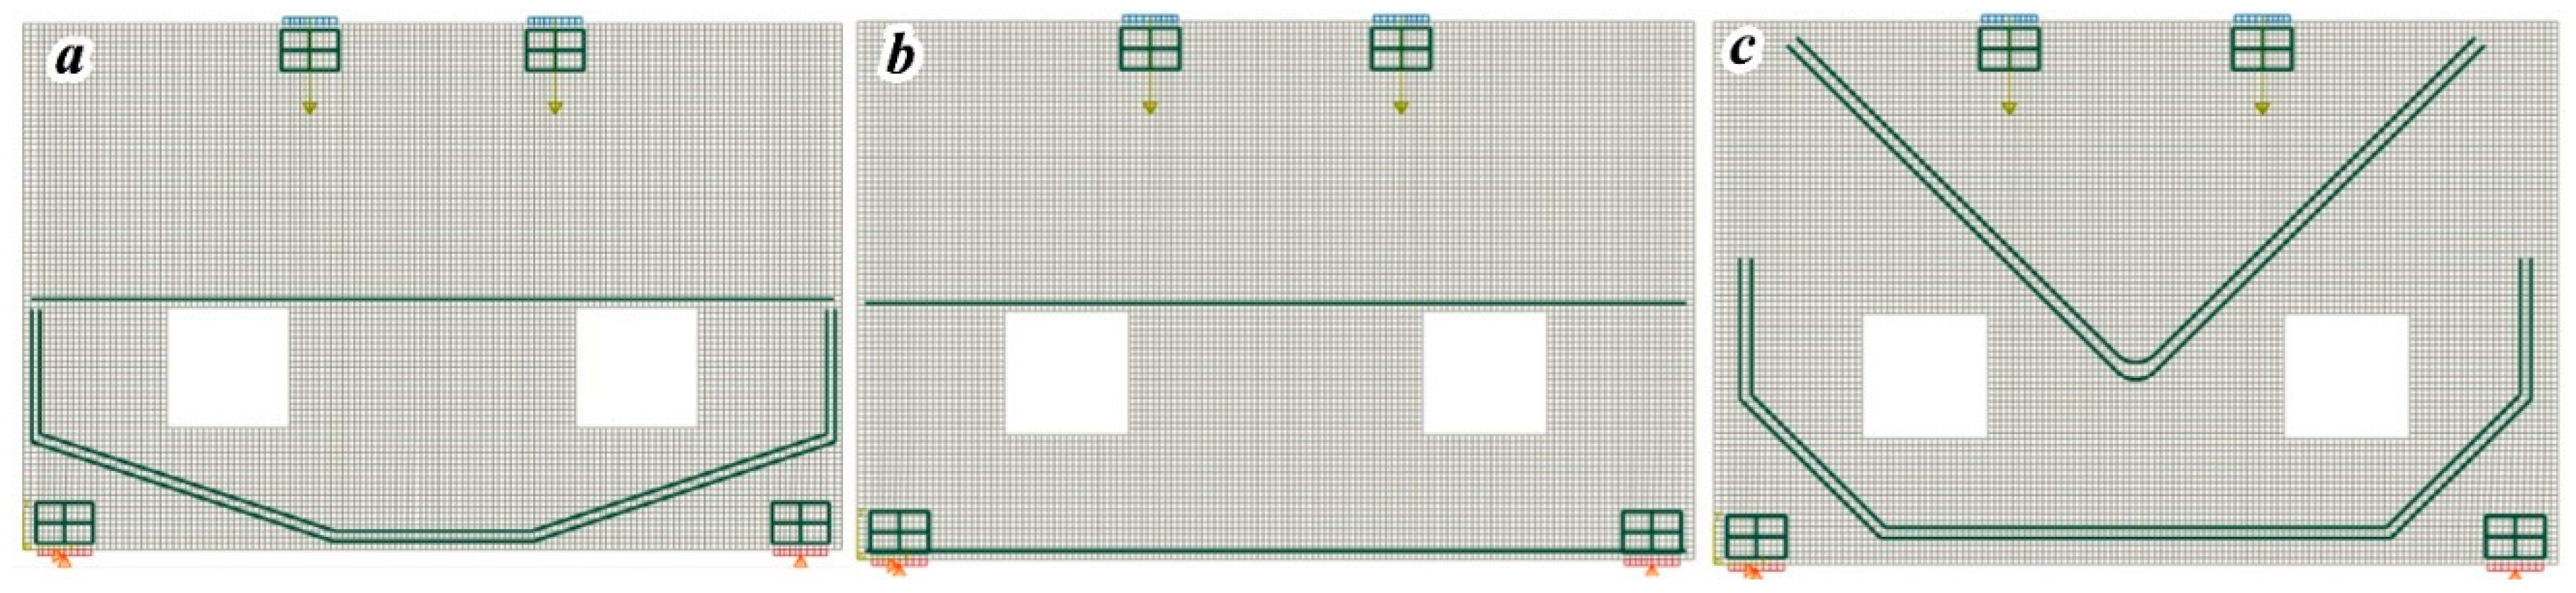
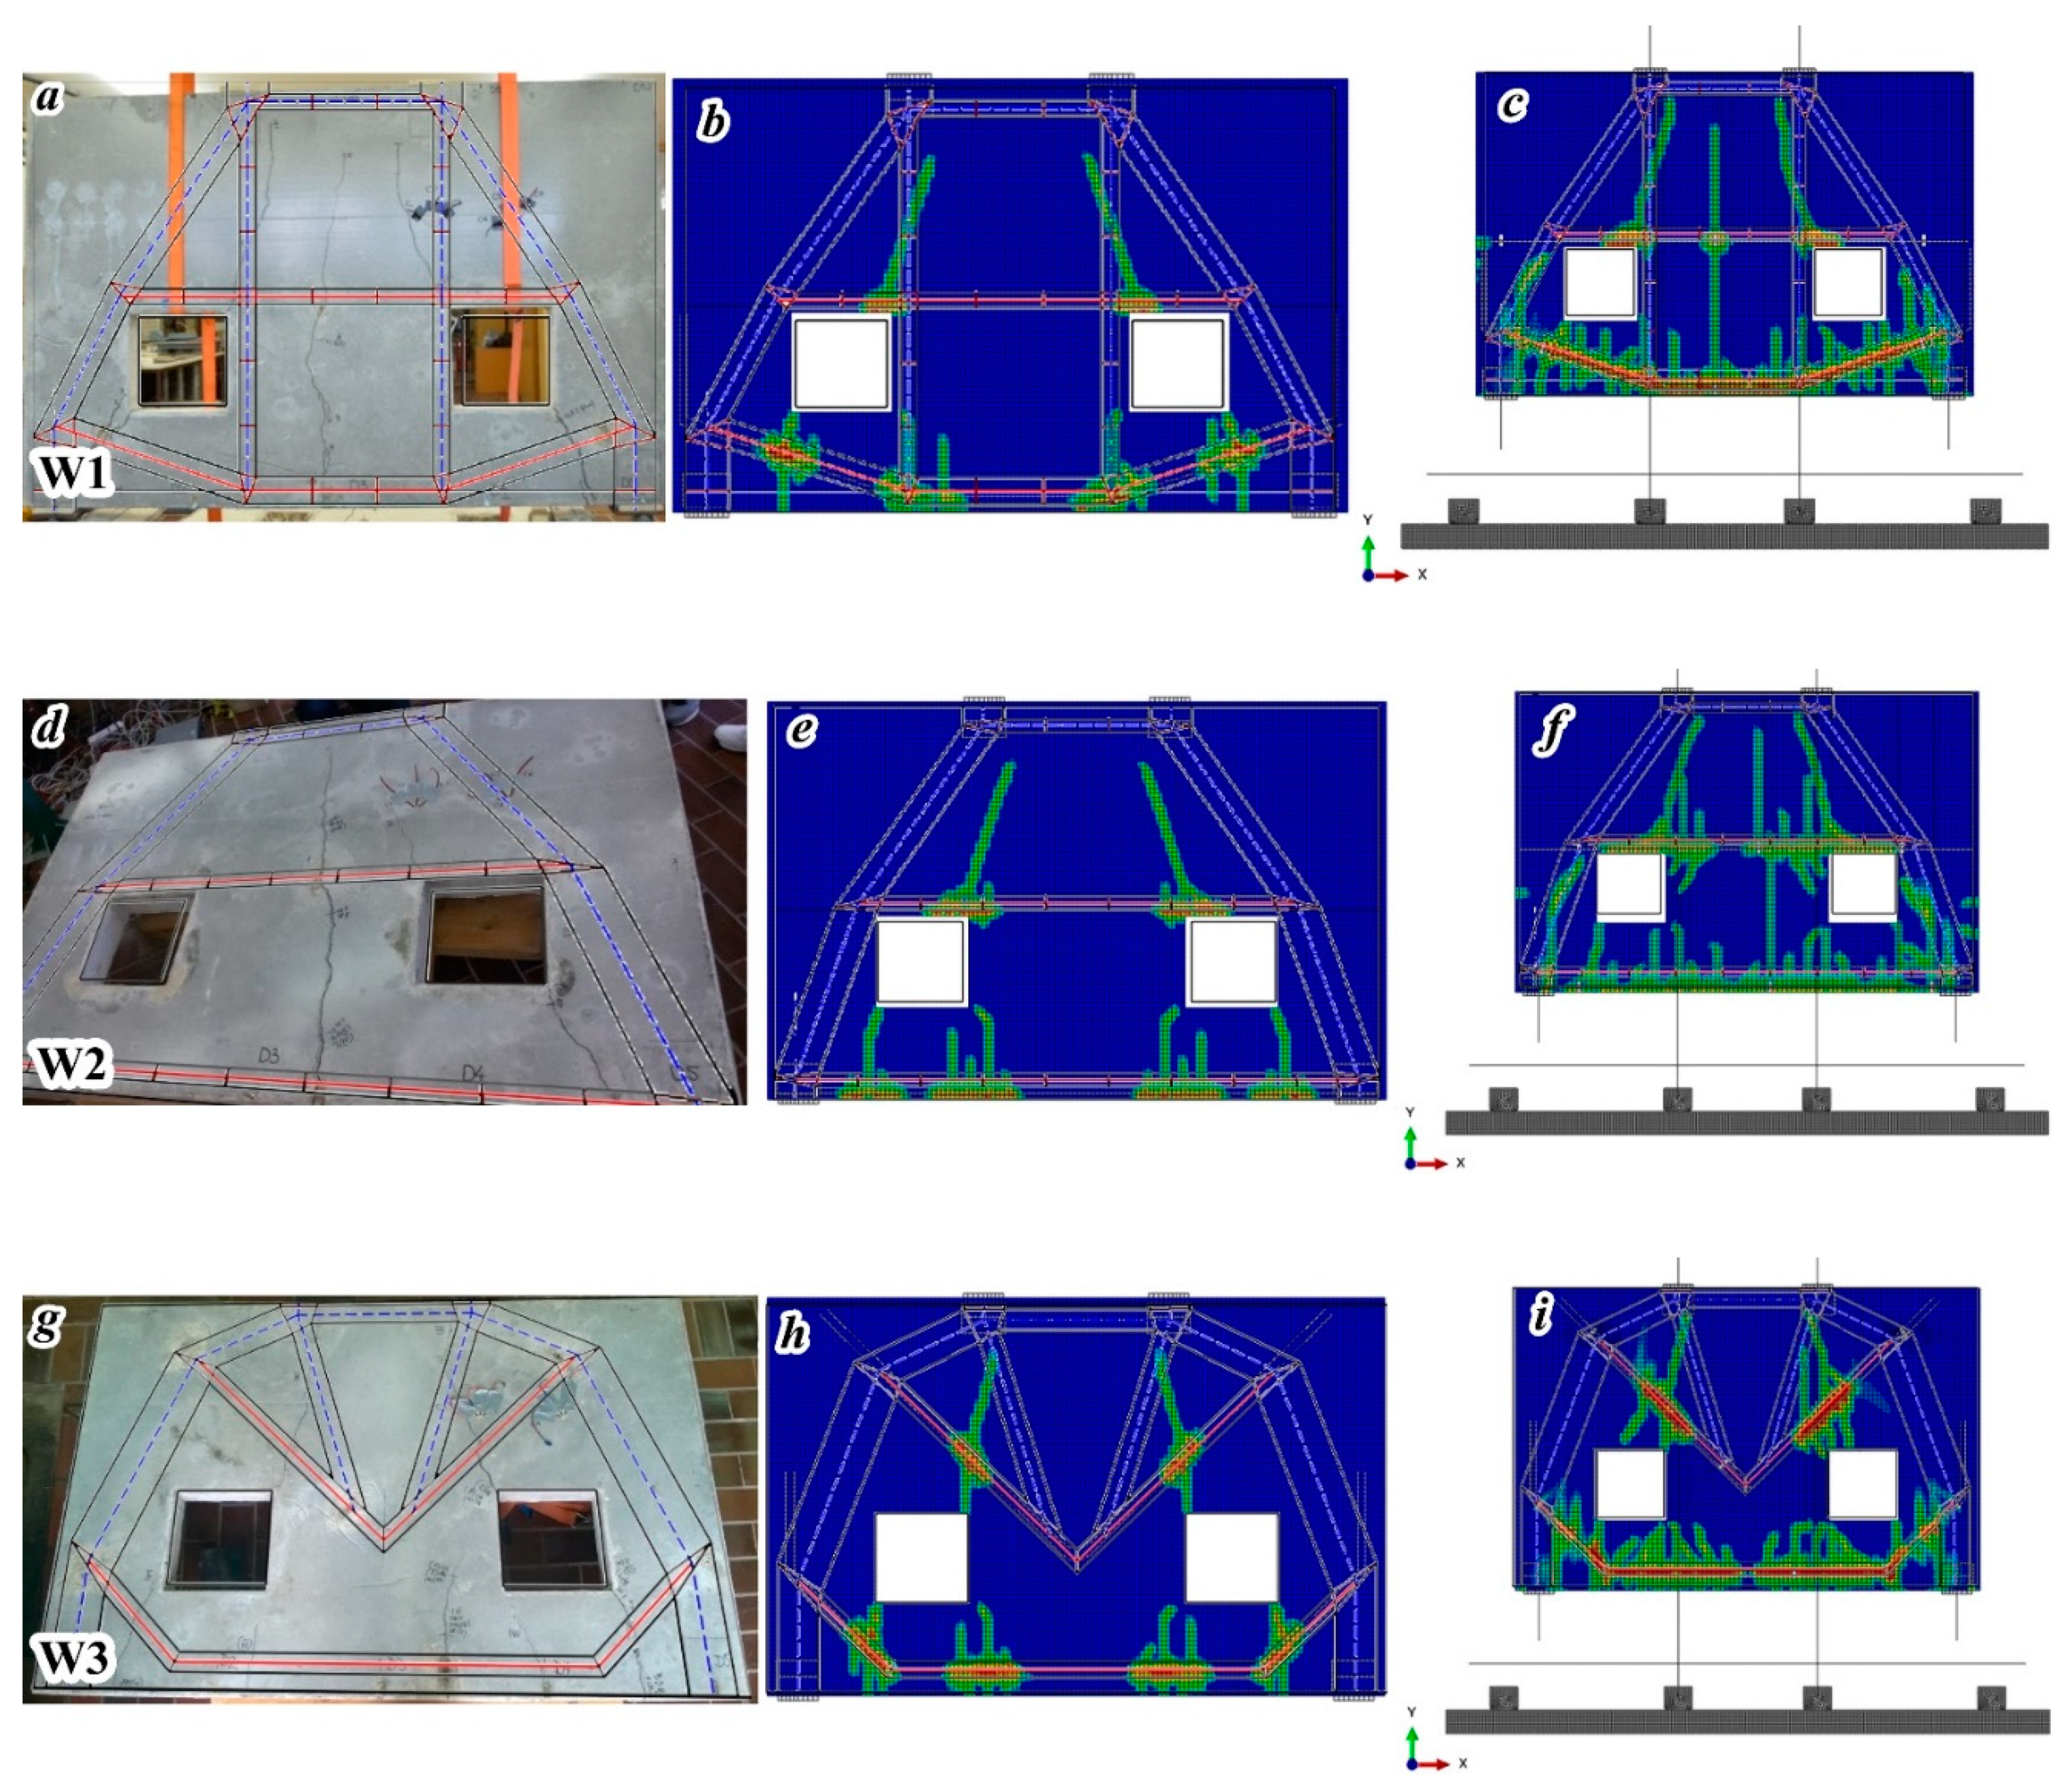
In the model FEM A, crack arrangements shown in
Figure 22b,e,h, corresponded to the adopted forms of the Strut-and-Tie models for design. For walls W1 and W2, the crack distributions obtained by experimental tests,
Figure 22a,d, did not correspond to the crack arrangement determined in the model FEM A, and at wall W3 the crack arrangement corresponded approximately,
Figure 22g. Also, the results of the mid-span deflection, Figure 24, showed differences in the behavior of the model FEM A in comparison with experimental results, for all three specimens. For the walls W1 and W2 the differences are smaller, while for the wall W3 they are larger. The reason for this behavior of the member is the interaction between the steel frame and the walls during the test. The consequence is the achievement of lower values of stresses and strains at the same load level compared to Strut-and-Tie models applied for the design.
According to the above-mentioned, the model FEM A was expanded and the model FEM B was formed. In addition to the tested specimens, the latter contains a steel frame and its contact with the ground and wooden spacers,
Figure 22c,f,i, and was used for further analyzes.
The distributions of tensioned damage obtained by model FEM B analyzes are shown in
Figure 22c,f,i, at the maximum load level. Distribution of cracks in tested elements is in accordance with the distribution of damage determined by model FEM B analysis, although it was observed that the arrangement of the cracks, especially the appearance of the first cracks, was influenced by the arrangement of the spacers for fixing the reinforcement. The dimensions of the spacers are such that they extend over the entire thickness of the specimen, so that the holes in concrete volume were formed in their places to initiate the cracks at the beginning.
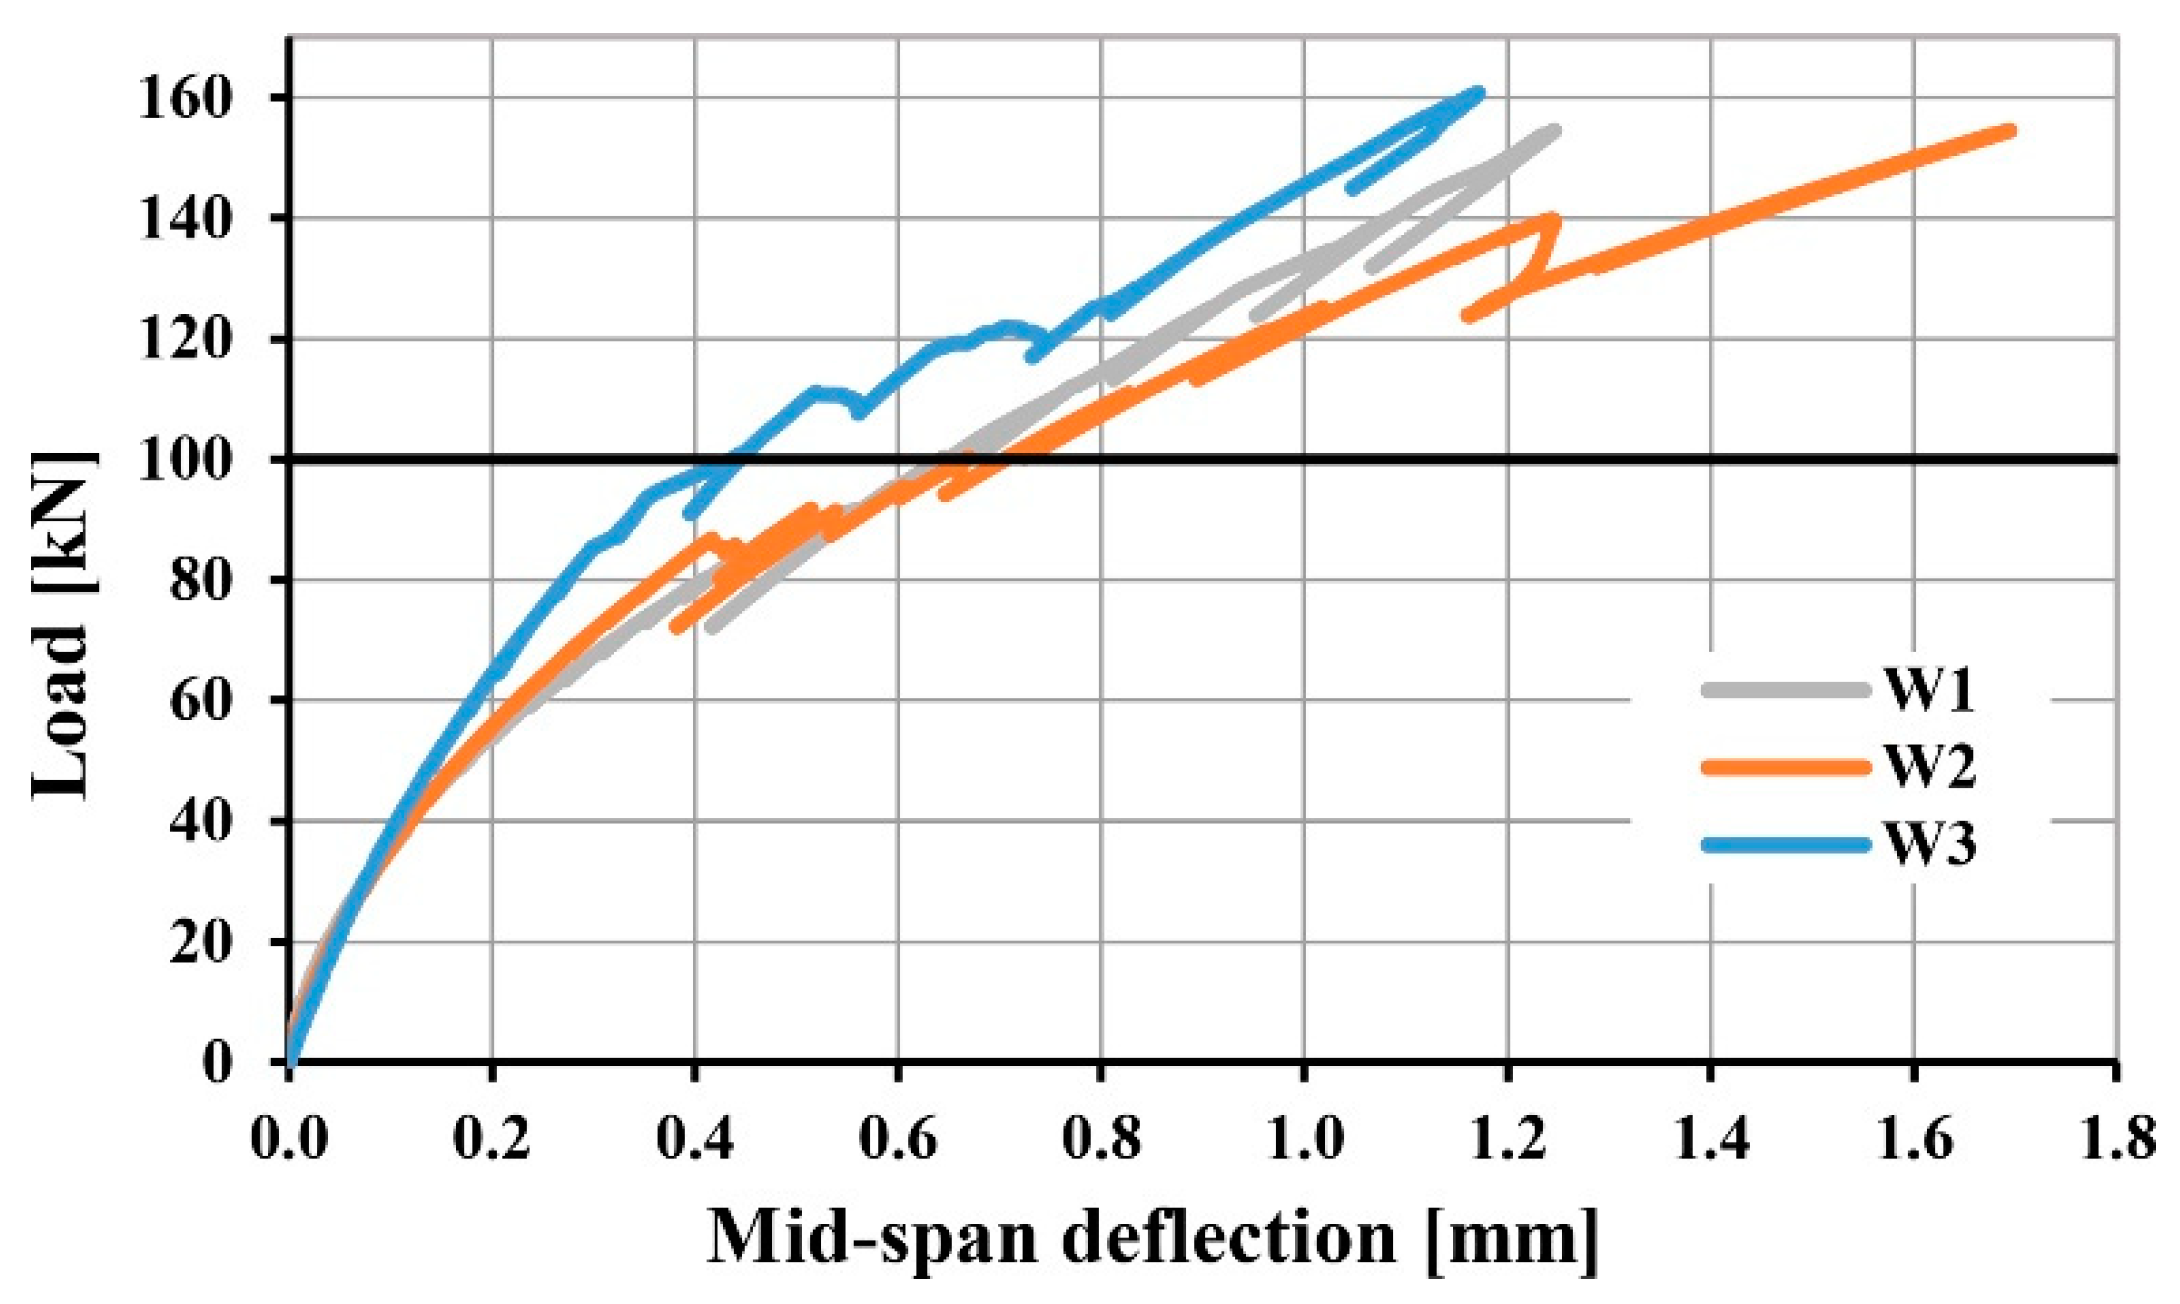
Based on the measured mid-span deflection at measuring points D1, D3, and D5 (
Figure 11,
Figure 12 and
Figure 13), a relative mid-span deflection was calculated at the measuring point D3. The diagrams of the relative mid-span deflections of the W1, W2, and W3 members are shown in
Figure 23. It can be concluded that the mid-span deflection of the W3 specimen at each load intensity is smaller than the mid-span deflections of the other specimens. At the load level of 2 × 100 kN the mid-span deflections of specimens W1 and W2 are approximately the same and larger by about 37% when compared to the mid-span deflection of the W3 specimen. At the load level of 2 × 150 kN, which is close to the maximum load intensity for all three specimens, the mid-span deflection of the specimen W1 is approximately 20%, and of the specimen W2 is approximately 60% higher than the mid-span deflection of the W3 specimen. It can be concluded that the bending rigidity of the W3 specimen is higher than those of the specimens W1 and W2. It can also be concluded that specimens W1 and W2 have approximately the same mid-span deflections up to the load level of 2 × 100 kN, and at the load level of 2 × 150 kN, the mid-span deflection of the specimen W1 is by approximately 36% smaller than the one of the specimen W2.
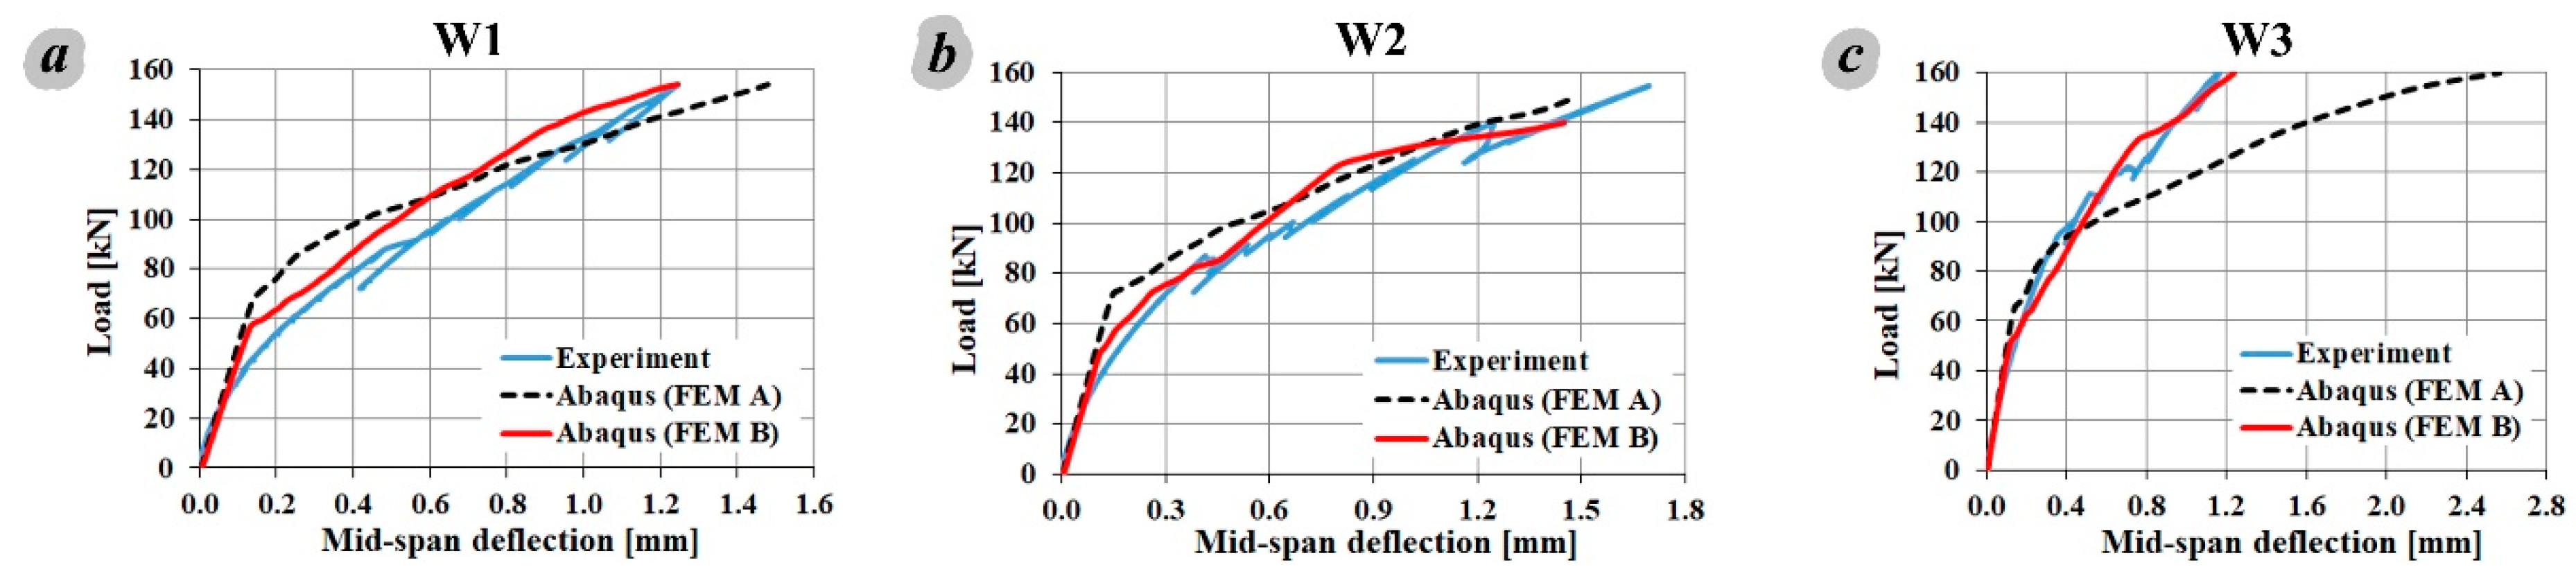
It is observed that the deflection change trend determined experimentally and by model FEM B analysis is the same for all three walls individually.
The displacement values at designed loads of 2 × 100 kN obtained by numerical analysis are greater than those obtained by experimental testing for walls W1 and W2 and these differences are approximately 24% and 21% respectively,
Figure 24a,b. For the wall W3, the displacement value determined by numerical analysis at design load is less than 8% of the displacement obtained by the experimental testing,
Figure 24c.
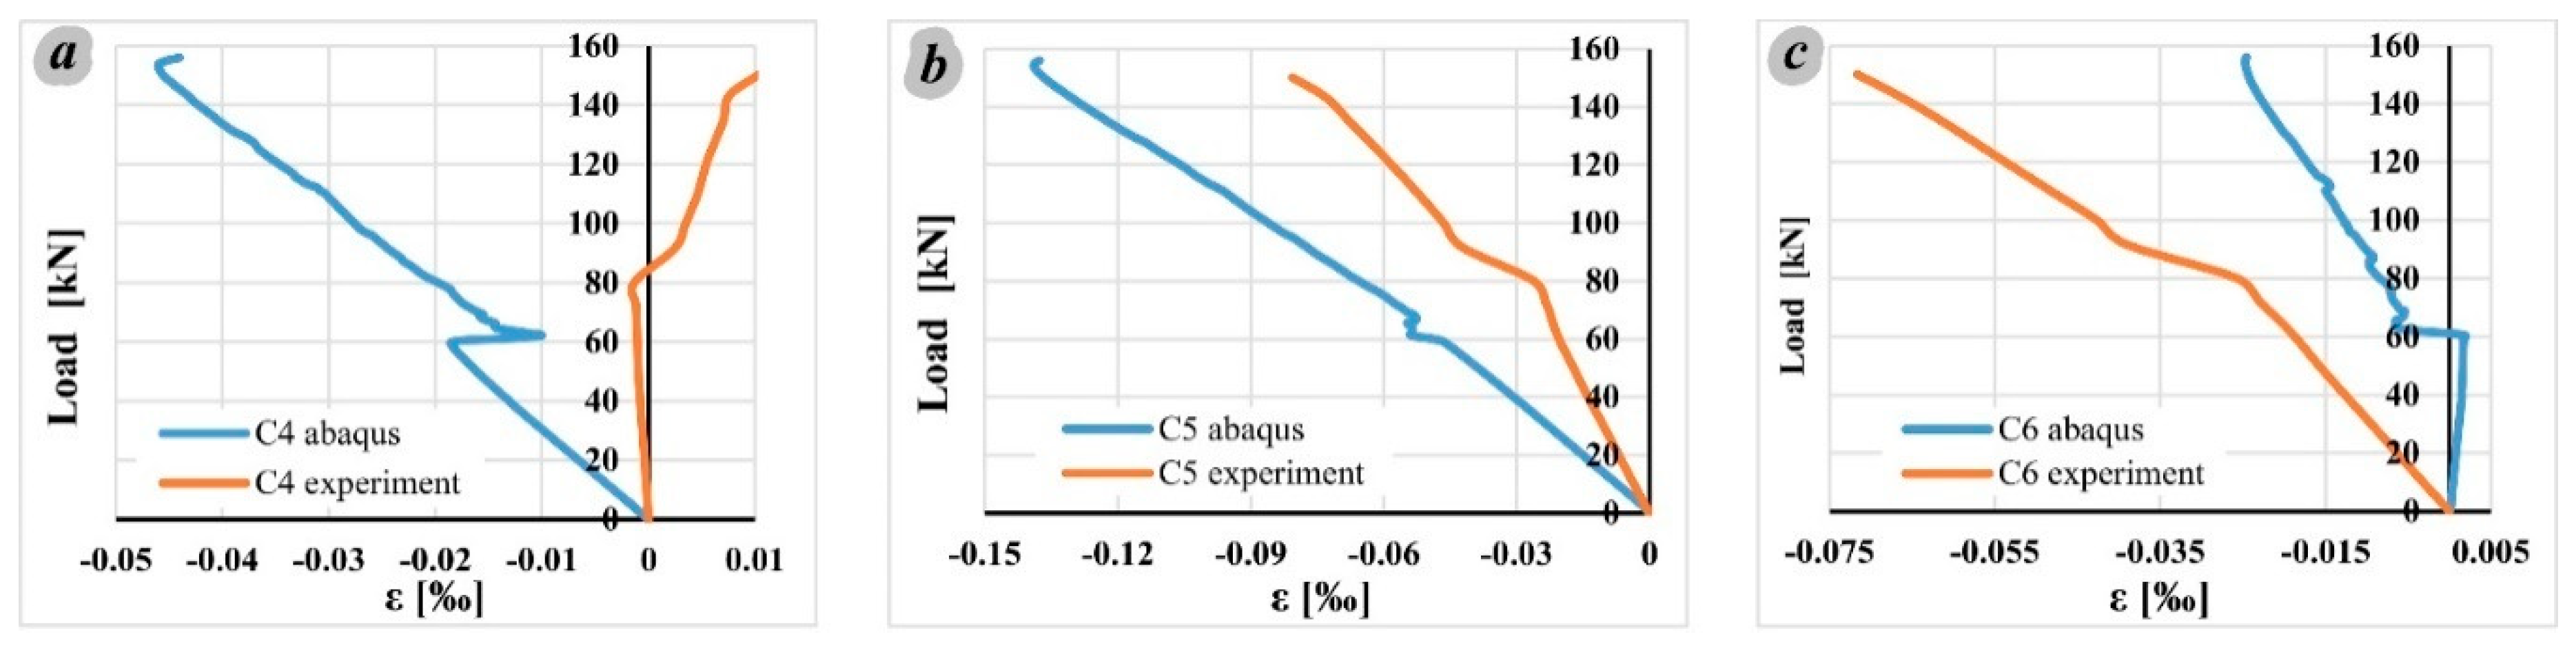
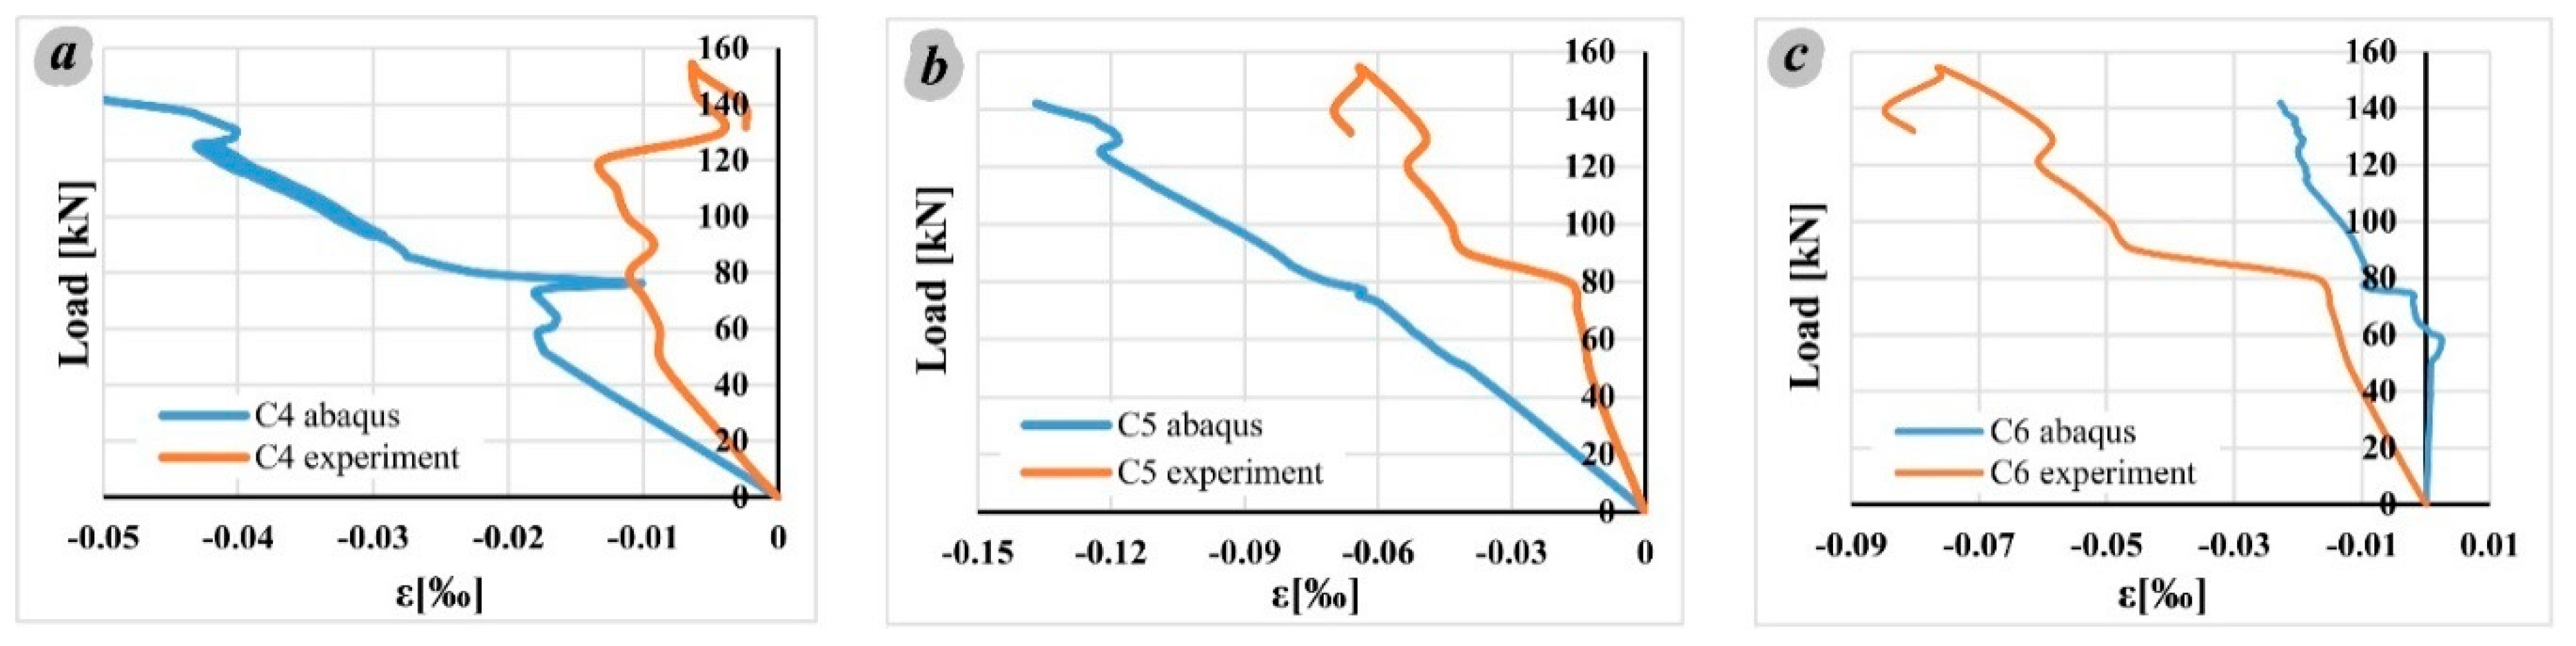
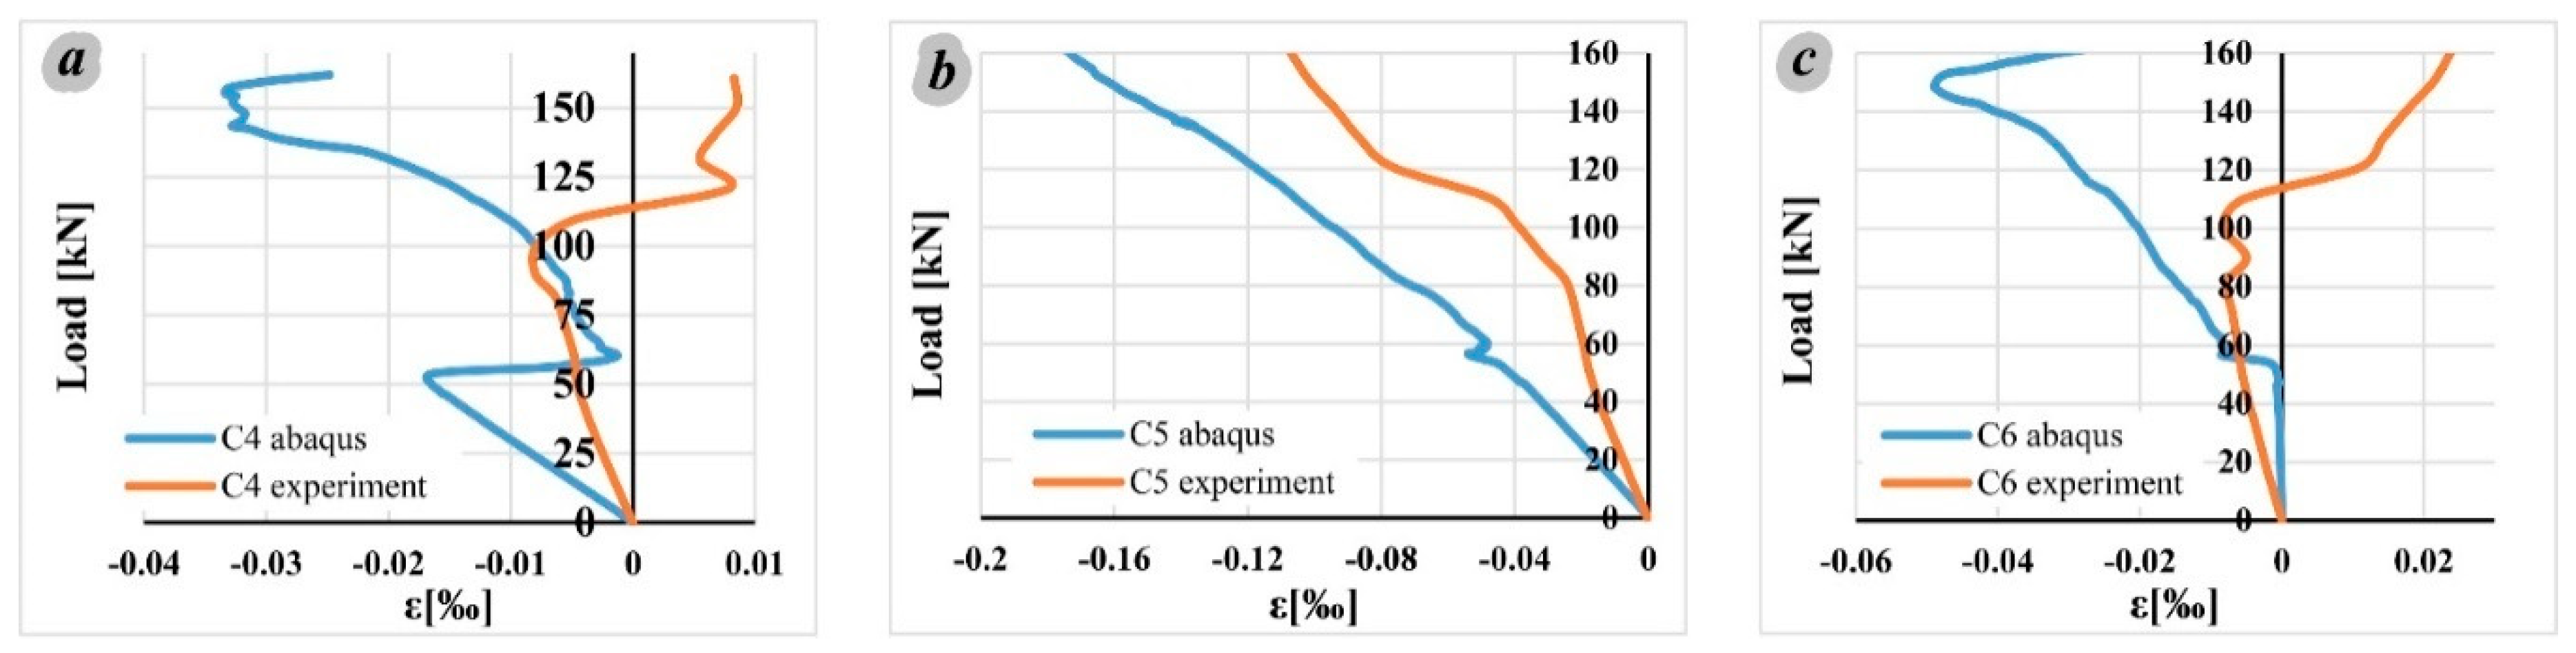
It is observed that the trend of dependence between loads and strains, measured and numerically determined, is approximately the same for all three measuring sites and for all three specimens, before the appearance of the first crack, i.e., up to a load level of approximately 2 × 60 kN in the numerical model. Subsequently, significant differences between numerical and experimentally determined results for measurement sites C4 and C6 occur. In contrast, for the measuring position site C5, whose direction roughly corresponds to the direction of the strut, the same trend of dependence between load and strain even after reaching the first crack is maintained. At the maximum load intensity during the test, the maximum measured compression strains were observed at the measuring points C4-C5-C6 and did not exceed 0.15‰ in all three specimens. Although the results of crack distribution and mid-span deflection determined in the FEM B model were close to the test results, the results for strains in concrete differ significantly, i.e., the model proved to be insufficiently reliable for estimating these values in the tested members.
The maximum values of the tensile strains in the reinforcement at the mid-span of the lower edge of the member are: 0.27‰ (at the measuring point S8 of the specimen W1,
Figure 11), 1.35‰ (at the measuring point S4 of the member W2,
Figure 12), and 1.1‰ (at the measuring point S6 of the member W3,
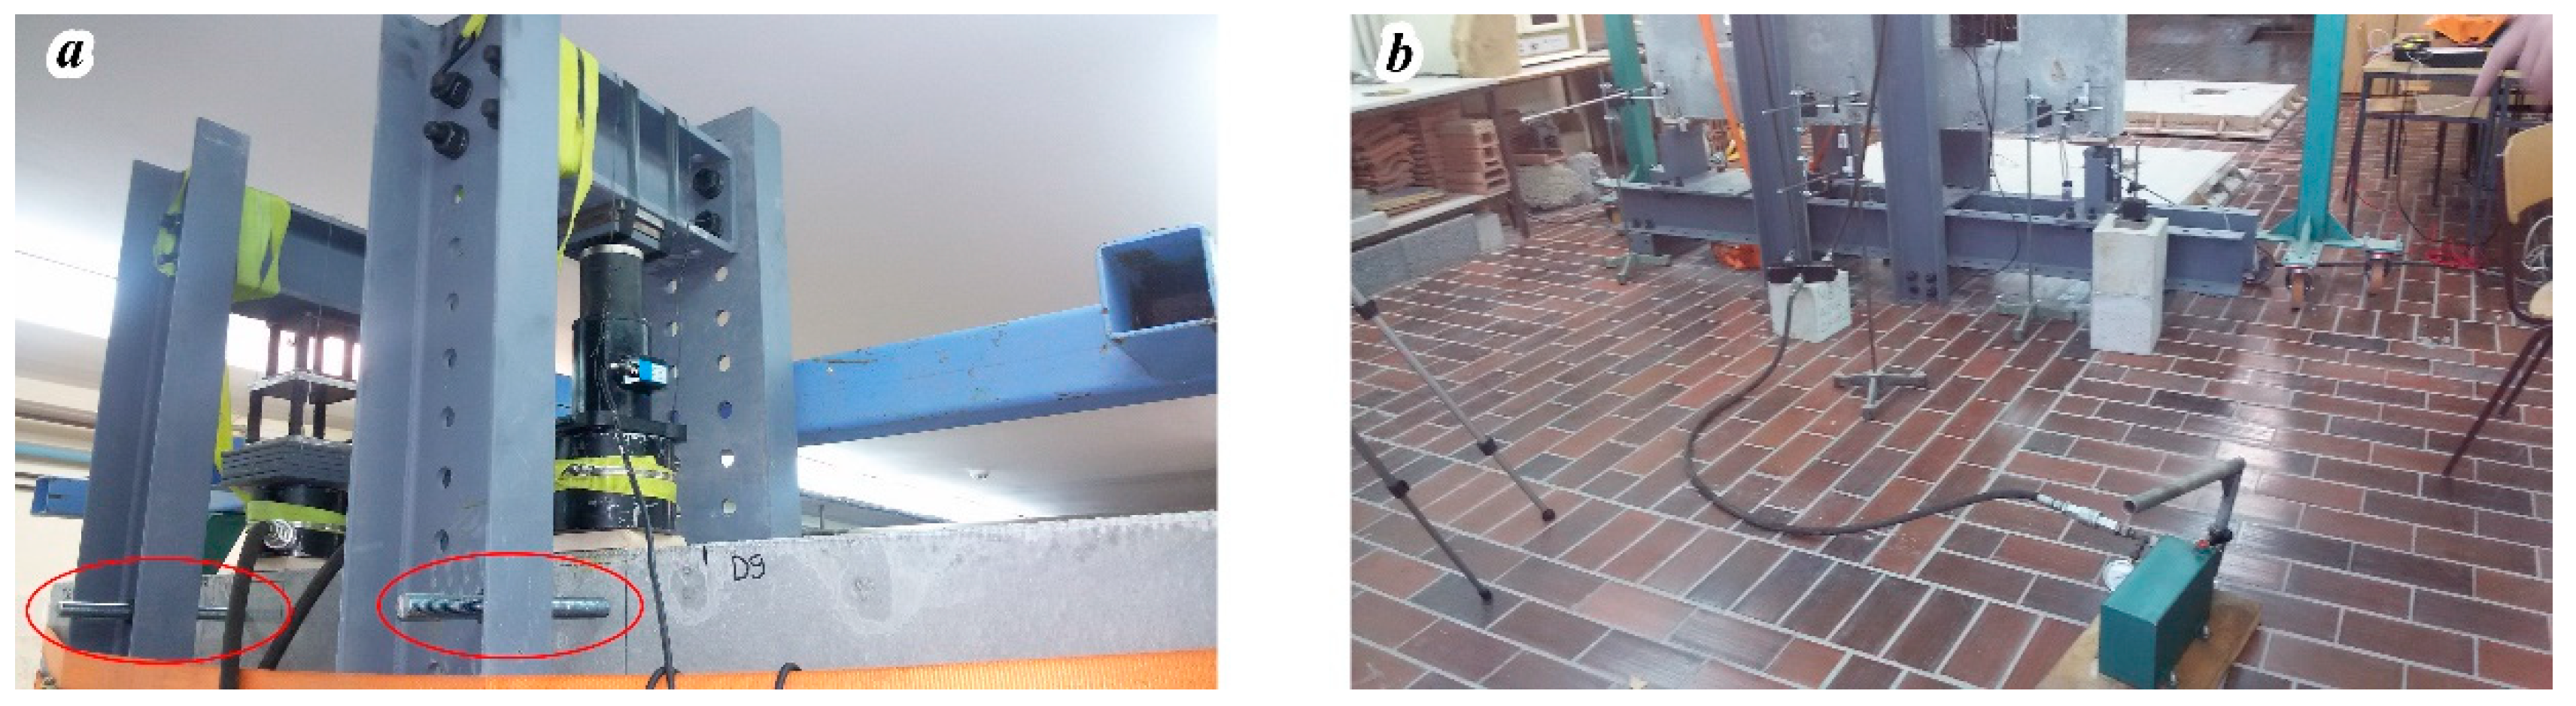
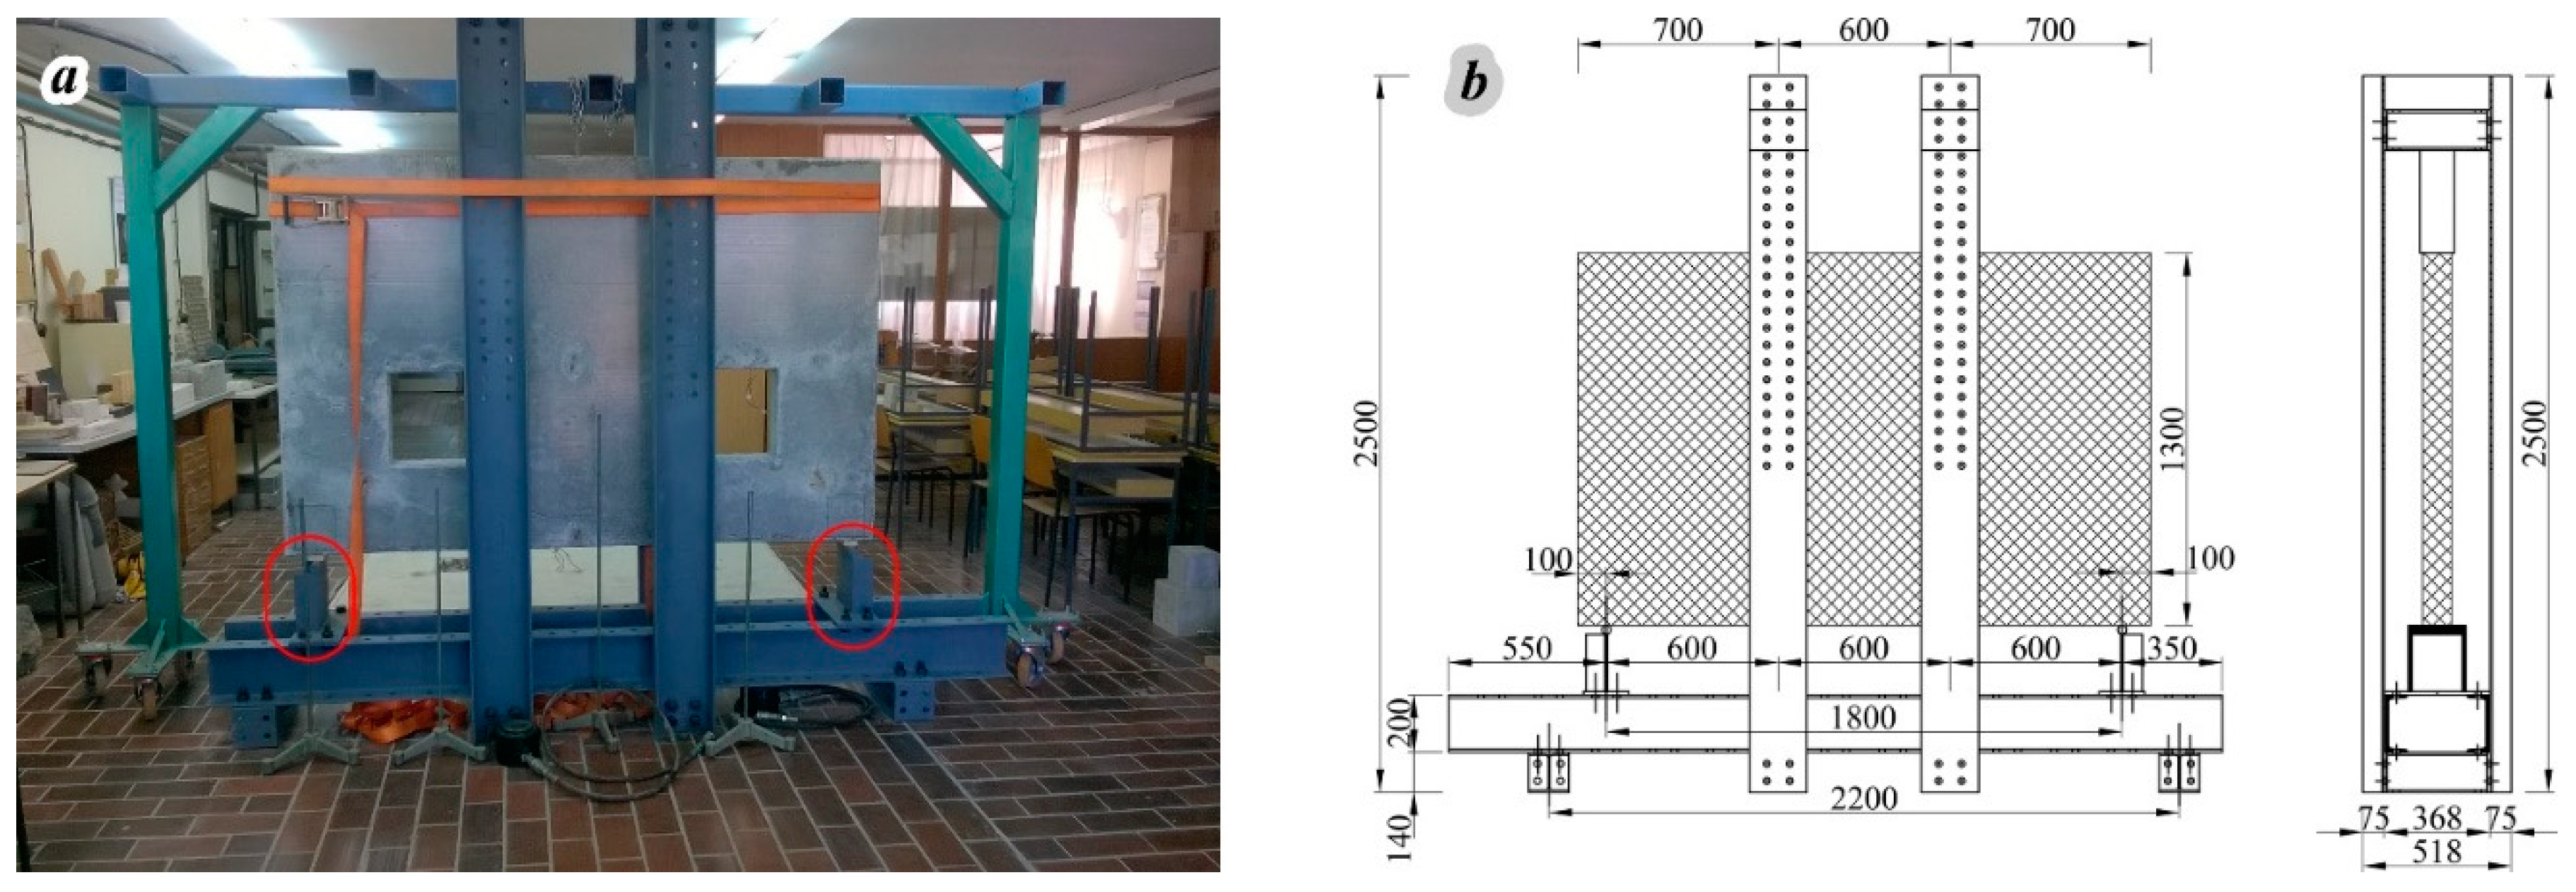
Figure 13). At other measuring points, in the member W1, the measured maximum value of the tensile strain did not exceed 1.8‰, the maximum value of the tensile strain measured in the member W2 was not greater than 1.25‰, while for the specimen W3, the measured maximum tensile strain value did not exceed 0.16‰. The maximum values of the tensile strains in the reinforcement at the measuring points S8, S4, and S6 of specimens W1, W2, and W3 respectively, did not reach the ultimate limit strain values. The reason is in the fact that the steel frame with its rigidity reduced stresses and deformations in the member. The member is designed in the software “ST method” under the assumption of a static simple beam system. However, during the test, because of the interaction between the frame and the specimen, the spreading between the points at the contact of the frame and the specimen (
Figure 14, zones circled in red) was partially prevented because of the stiffness of the frame. This phenomenon will be explained for specimen W2, and the other samples behaved analogously. Based on experimentally measured strains at half the height of the “U” profile (
Figure 14, zones circled in red color, and
Figure 28), the values of normal force, bending moment, and transverse force were determined. At designed loads of 2 × 100 kN, the normal force, bending moment, and transverse force were—129.91 kN, 7.36 kNm, and 17.24 kN, respectively. By experimental measurement of strains in the reinforcement along the lower edge of the member (measuring point S3/S4,
Figure 12), the axial force in the reinforcement was calculated, which at a load value of 2 × 100 kN is 11.77 kN. The axial force in the tie, along the lower edge of the support, of the Strut-and-Tie model for design, determined in the program “ST method”, is 33 kN. The difference between this axial force and the axial force calculated on the basis of experimental results is 33 − 11.77 = 21.23 kN. One part of this difference in the amount of 17.24 kN is the consequence of the stiffness of the steel frame (transverse force in the “U” profile), and the rest of 21.23 − 17.24 = 3.99 kN is the force due to the effective area of concrete in tension.
Based on the maximum measured values of strains in concrete and reinforcement, it can be concluded that the ultimate limit strain values have not been reached at the maximum intensity of the applied load during the test.
Optimal Strut-And-Tie Model of Reinforced Concrete Members
Since different Strut-and-Tie models can be used for the design of the member, it has to be considered which of them presents the optimal model. The selection of the optimal Strut-and-Tie model certainly depends on the engineering estimation as well as on the adopted criteria. The criteria could be classified as: the quantity of reinforcement (models with a smaller amount of reinforcement have priority), the “complexity” of the reinforcement scheme (the models in which the reinforcement is placed only in orthogonal directions, parallel to the edges of the element, have the advantage), the size and arrangement of the cracks (preferred models are those with smaller crack widths), and maximum mid-span deflection. In this research, all considered criteria are covered with the same importance. The criteria for all three specimens are given in
Table 8. The plus sign (+) indicates that the specimen is optimal, according to one of the criteria listed above.
Member specimen W3 has the smallest crack widths and mid-span deflection at the maximum load intensity, but also the largest amount of reinforcement. However, it must be admitted that in the same specimen, the reinforcement layout is the most complex one. On the other hand, member W2 has the smallest amount of reinforcement and the simplest reinforcement layout, but has the greatest crack widths and mid-span deflection at the maximum load intensity. Although specimens W2 and W3 have the same number of plus (+) marks, the authors of this paper nevertheless suggest, regardless of the criteria taken with the equal importance, that the optimal solution is the one applied in specimen W3 since in its case the smallest crack widths occur.
The current situation in the field of research is such that the solutions for the shapes of Strut-and-Tie models are not unambiguous. There is no single view on how to obtain an optimal shape. For example, in order to obtain a minimum amount of reinforcement or minimal displacement or the simplest reinforcement layout, different shapes of the Strut-and-Tie models can be determined. The same conclusion is reached by analyzing the research in references [
2,
3,
4,
5,
6,
7,
8,
9,
10,
11,
12,
13]. It is also concluded that the used shapes of the Strut-and-Tie models, regardless of the way they were adopted, have been experimentally verified.


 ,
, 


