Article

An Attention-Based Network for Textured Surface Anomaly Detection

School of Automation, Northwestern Polytechnical University, Xi’an 710129, China
*
Author to whom correspondence should be addressed.
Appl. Sci. 2020, 10(18), 6215; https://doi.org/10.3390/app10186215
Submission received: 27 July 2020 / Revised: 27 August 2020 / Accepted: 3 September 2020 / Published: 8 September 2020
(This article belongs to the Special Issue Novel Approaches for Nondestructive Testing and Evaluation)

Abstract

:
Textured surface anomaly detection is a significant task in industrial scenarios. In order to further improve the detection performance, we proposed a novel two-stage approach with an attention mechanism. Firstly, in the segmentation network, the feature extraction and anomaly attention modules are designed to capture the detail information as much as possible and focus on the anomalies, respectively. To strike dynamic balances between these two parts, an adaptive scheme where learnable parameters are gradually optimized is introduced. Subsequently, the weights of the segmentation network are frozen, and the outputs are fed into the classification network, which is trained independently in this stage. Finally, we evaluate the proposed approach on DAGM 2007 dataset which consists of diverse textured surfaces with weakly-labeled anomalies, and the experiments demonstrate that our method can achieve 100% detection rates in terms of TPR (True Positive Rate) and TNR (True Negative Rate).

1. Introduction

Automatic surface-anomaly detection is one of the most vital tasks in manufacturing processes to guarantee that the end product is visually free of anomalies. It is mostly relevant in various domains of industrial production, such as steels [1,2], fibers [3], and plastics [4]. As a matter of fact, surface anomaly detection is usually carried out manually due to the constraints of technical conditions, which is very inefficient and errors are apt to occur due to fatigue. Over the past two decades, automated surface inspection approaches based on computer vision have been proven to be very effective and are attracting more research attentions. In particular, deep learning techniques have achieved great success in the domain of visual inspections.
In the early years, classical image processing approaches were often applied to controlled environments, such as stable lighting conditions. Sanchez-Brea et al. [5] put forward a thresholding technique to detect the anomaly according to the intensity variations of rings which is caused when laser beams illuminate the wire. However, such methods are no longer applicable for complex backgrounds or the strong interference of noises. More appropriate methods should be designed for these challenging tasks. Later approaches can be mainly divided into two categories: models based on selective features, and deep learning-based methods [6,7]. Feature-based approaches such as visual saliency map [8], gray level co-occurrence matrix [9], and statistical projection [10] are usually appropriate for specific tasks. These features are not only hard to design, but being hand-crafted features, they are also not useable for other applications, which causes the extension of development cycles to adapt different products. The emergence of deep learning-based models has significantly improved this issue, as such methods are data-driven, and can automatically seek optimal features which avoids the special feature-design processes for different applications.
In recent years, there have emerged more and more excellent convolutional neural network models, such as FPN [11], ResNet [12], and SegNet [13]. Apart from these models mentioned above, FCN [14] is the first network applied to semantic segmentation tasks in an end-to-end manner. In this method, an encoder–decoder module and skip connections are used to combine deep with more shallow features. Attention U-Net [15] highlights the foreground via the supplement of more semantic information in the encoder parts. Hi-Net [16] utilizes more information from different modalities via the fusion of each learned feature representations. Liu et al. [17] present a sample balancing strategy via the assignment different weights to the edge and background pixels to further improve the extraction accuracy.
Early work on textured surface anomaly detection where deep learning is utilized can be found in Ref. [18], which investigated the performance differences generated by different hyper-parameter settings. Racki et al. [19] presented a compact convolutional neural architecture for the detection of surface anomalies. This network firstly acquires good features via segmentation network, then all the parameters are frozen, and only the classification network is trained. Mei et al. [20] proposed an unsupervised algorithm for fabric anomaly detection. It reconstructs image patches via convolutional denoising autoencoder networks under multi-scale gaussian pyramid levels, and the residual maps of each image patch are used for pixel-wise prediction.
In order to further improve the surface anomaly detection performance on the DAGM 2007 dataset, this paper presents an attention-based network inspired by the works mentioned above. On one hand, feature extraction module be used to capture detailed information. On the other hand, anomaly attention module is designed to strengthen the potential objects and simultaneously weaken the background noises. The validity of the proposed method is confirmed by a series of experiments.
The remainder of this paper is organized as follows. The proposed model is elaborately described in Section 2. The experiment and discussion are presented in Section 3. Finally, Section 4 draws the conclusion of this paper.

2. Materials and Methods

For the dataset with limited samples, overfitting is prone to occur when detection or classification approaches are employed directly. However, segmentation-based two-stage models can settle this issue, and the methods of this type generally follow the same paradigm, i.e., segmentation network is applied to extract good feature representations, then the classification network is trained upon these features. The validity of this mode can be explained that for segmentation tasks, overfitting problems can be largely improved as image segmentation belongs to pixel-level classifications, enabling effective samples to be added in the training process [21].

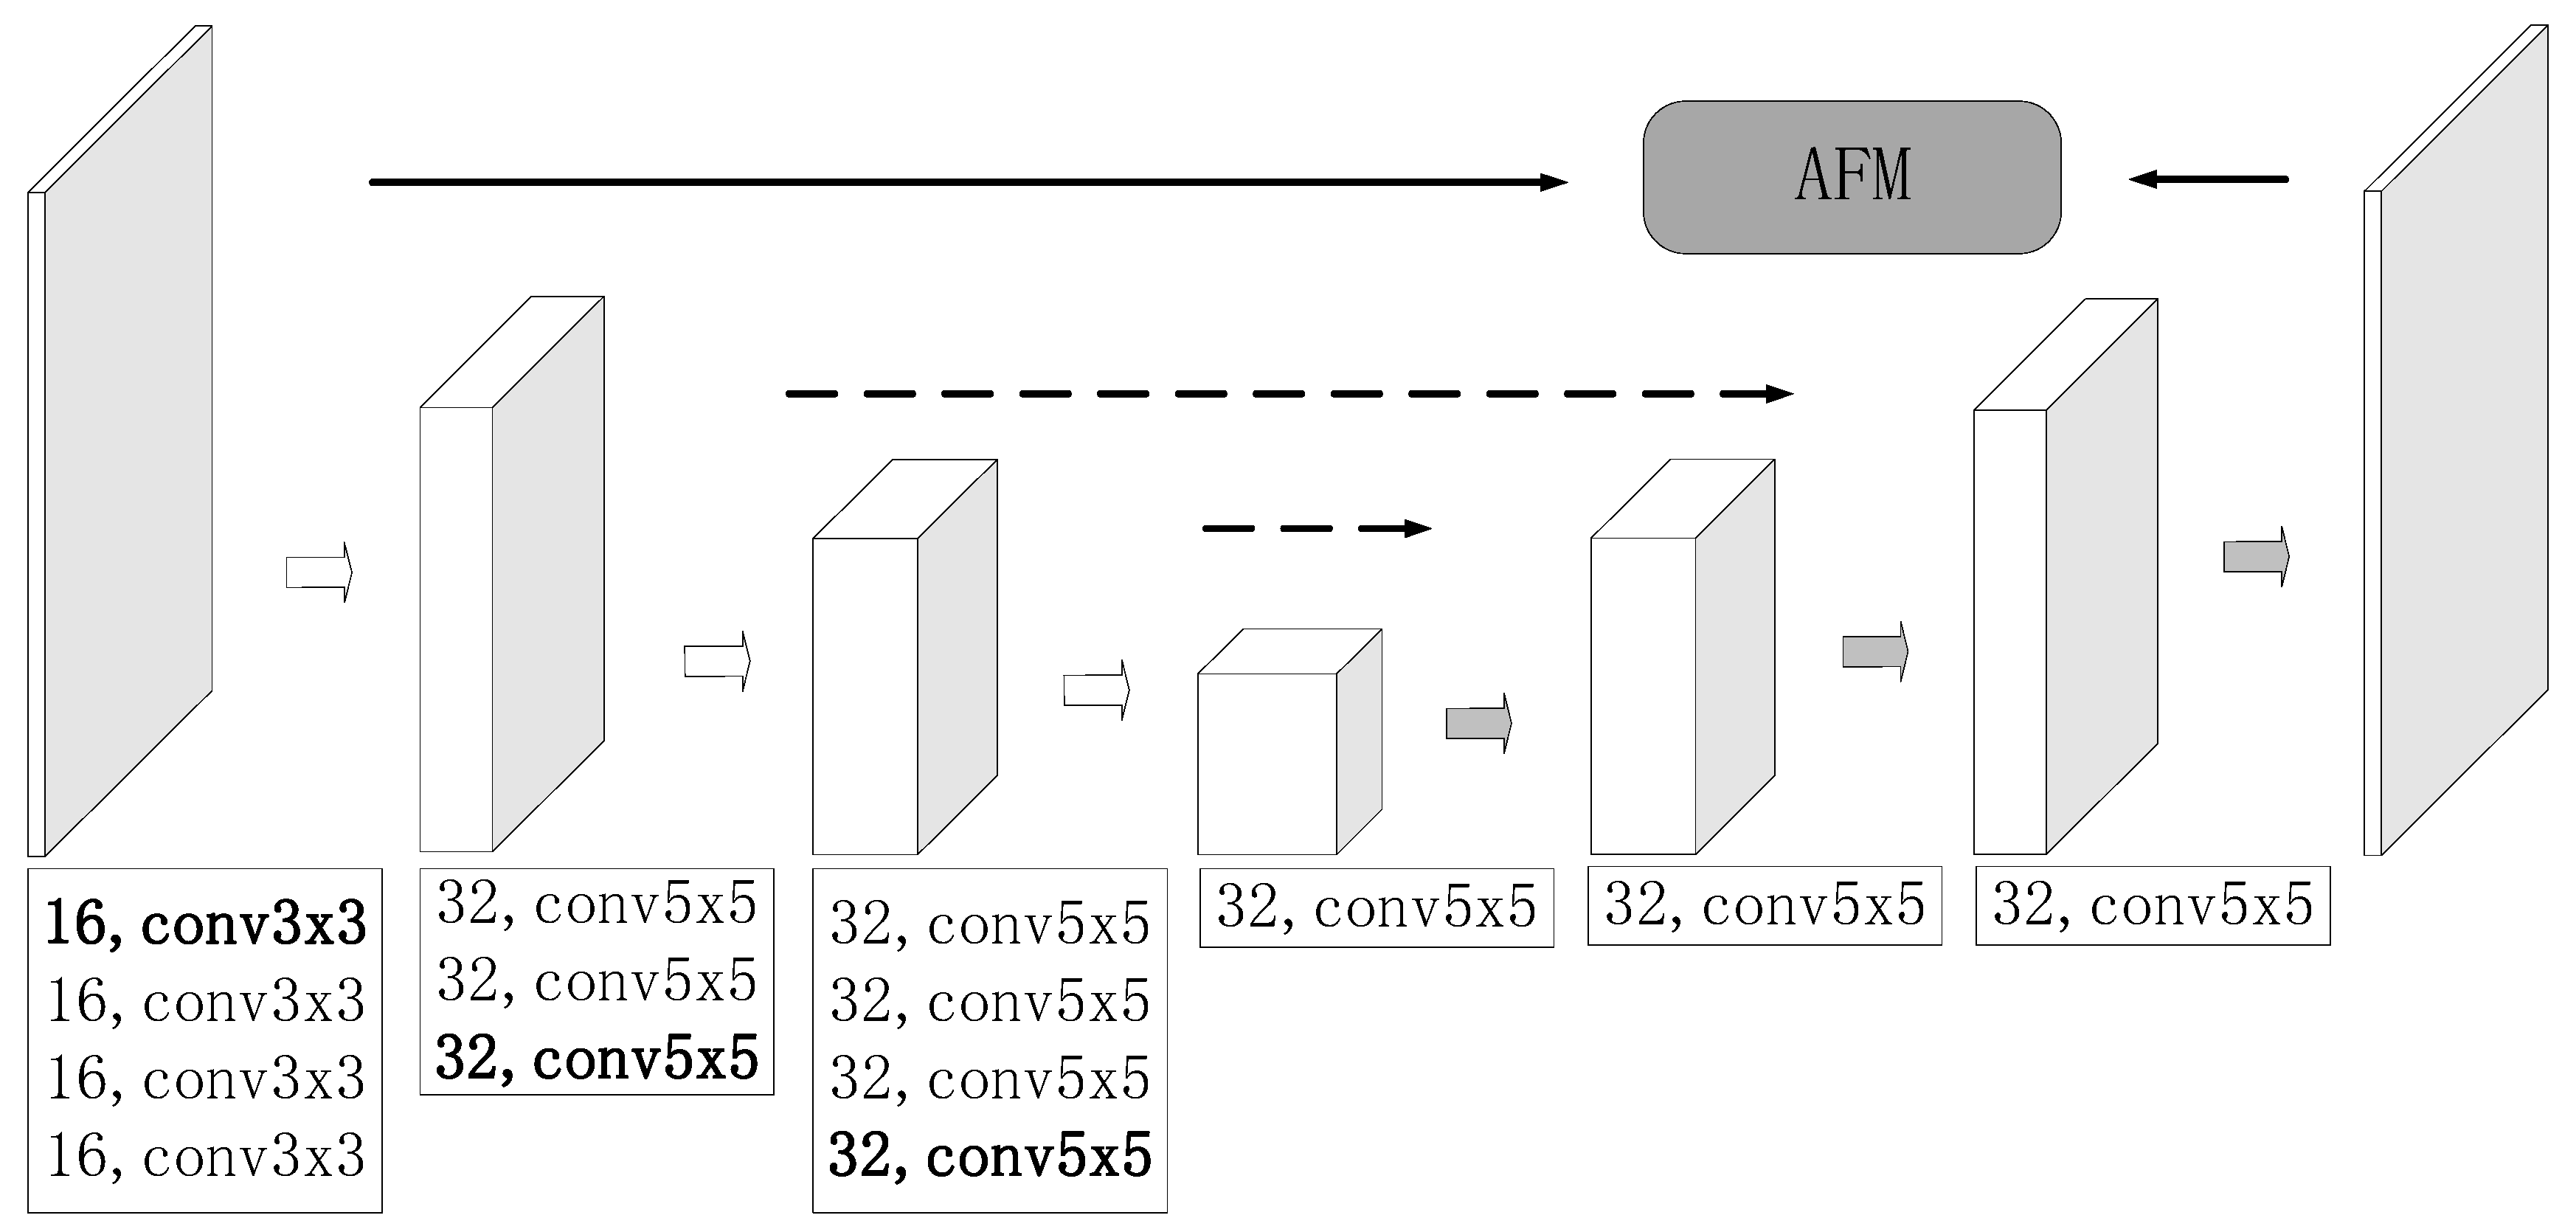
2.1. Segmentation Model

An encoder–decoder architecture is adopted to capture the detailed information [22] as much as possible, especially for the small anomaly structure used in this paper. However, unlike U-Net network [22], we also design an attention-based fusion module to focus on the potential objects.
The overall segmentation part is shown in Figure 1, which consists of the encoder, decoder, skip connections, and the proposed fusion block. Specifically, pool and corresponding transpose convolution operations divide the whole process into four stages, and in the second and third stages, the relevant layers from encoder and decoder are combined via skip connections. As a whole, we integrate encoder and decoder information of the first stage via the attention-based fusion module to realize background weakness and anomaly reinforcement.

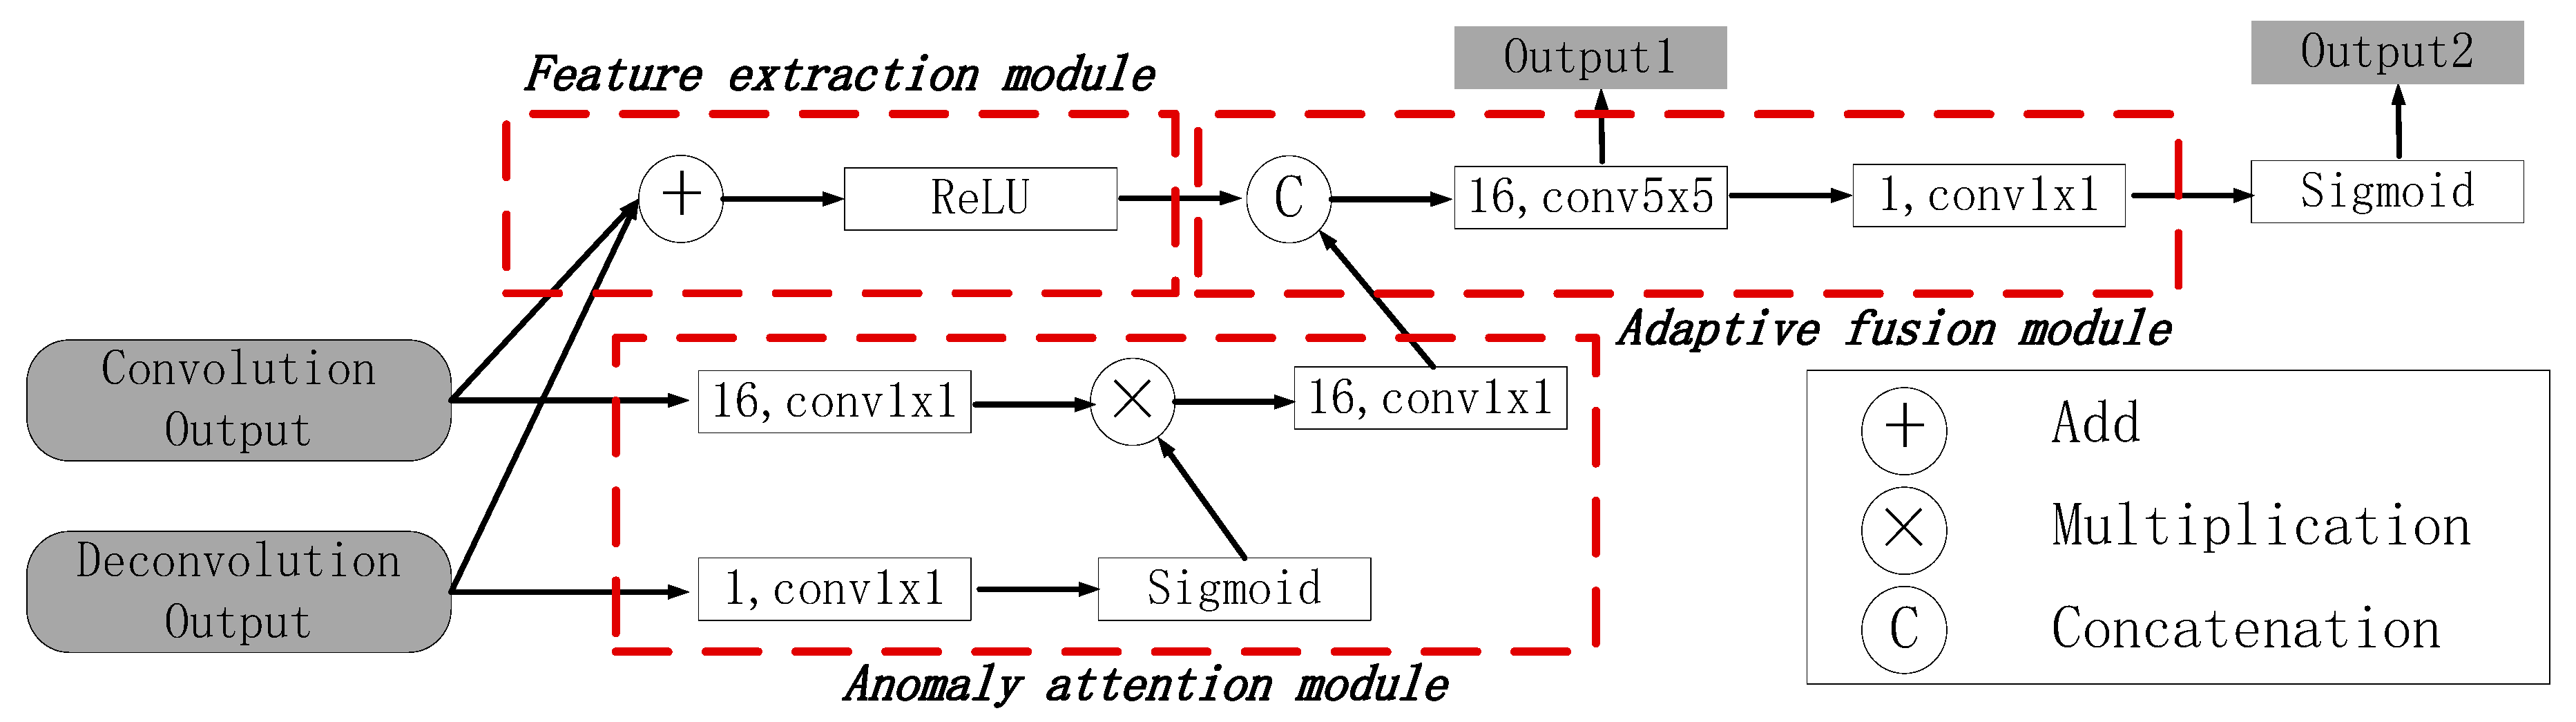
2.2. Attention-Based Fusion Module

The attention-based fusion module is designed to capture the detailed information, meanwhile strengthen the salient features and weaken irrelevant and noisy responses as well. The detailed procedure is presented in Figure 2.
In the feature extraction module, the information from encoder and decoder are merged by add operation and ReLU activation function, which ensures that detailed features can be retained, and visual saliency maps are highlighted to some extent. Moreover, the semantic gap between the feature extraction module and following anomaly attention module is narrowed when semantic information is supplemented in this section, which is more conducive to the training process.
Anomaly attention module provides a more comprehensive perspective to focus on the potential objects and weaken background information. Specifically, on one side, the information of the encoder from the first stage is input into a convolution layer to increase nonlinearity and feature depth. On the other side, the corresponding part from the decoder is exerted by the convolution operation and sigmoid function to obtain an attention coefficient. Then the output of these two sides are integrated via pixel-wise multiplications, which are followed by convolution operation to further increase nonlinearity and feature depth.
In order to weigh the detailed information and visual saliency extraction, an adaptive fusion module is designed to combine the two information from feature extraction and anomaly attention modules in a learning manner, and the weight parameters can be updated adaptively to maximally meet the demands of the different applications. As shown in Figure 2, the output of the feature extraction and anomaly attention modules above are concatenated firstly, then the result is executed by 5 × 5 and 1 × 1 convolution calculations respectively, which can learn the weight parameters from channel inners and inters. The output 1 and output 2 are reserved for the following classification module.
In addition, for the imbalance issue of samples, the loss of each pixel is formulated as Equation (1) to attach more weight for positive samples.
( X i ) = 1 N i = 1 N ( α l o g ( 1 P ( y i = 0 | X i ) ) + β l o g P ( y i = 1 | X i ) )
Here X i , y i denote feature vector and label at pixel i respectively. P represents the sigmoid activation function, and α = 1 , β = 3 in this paper.

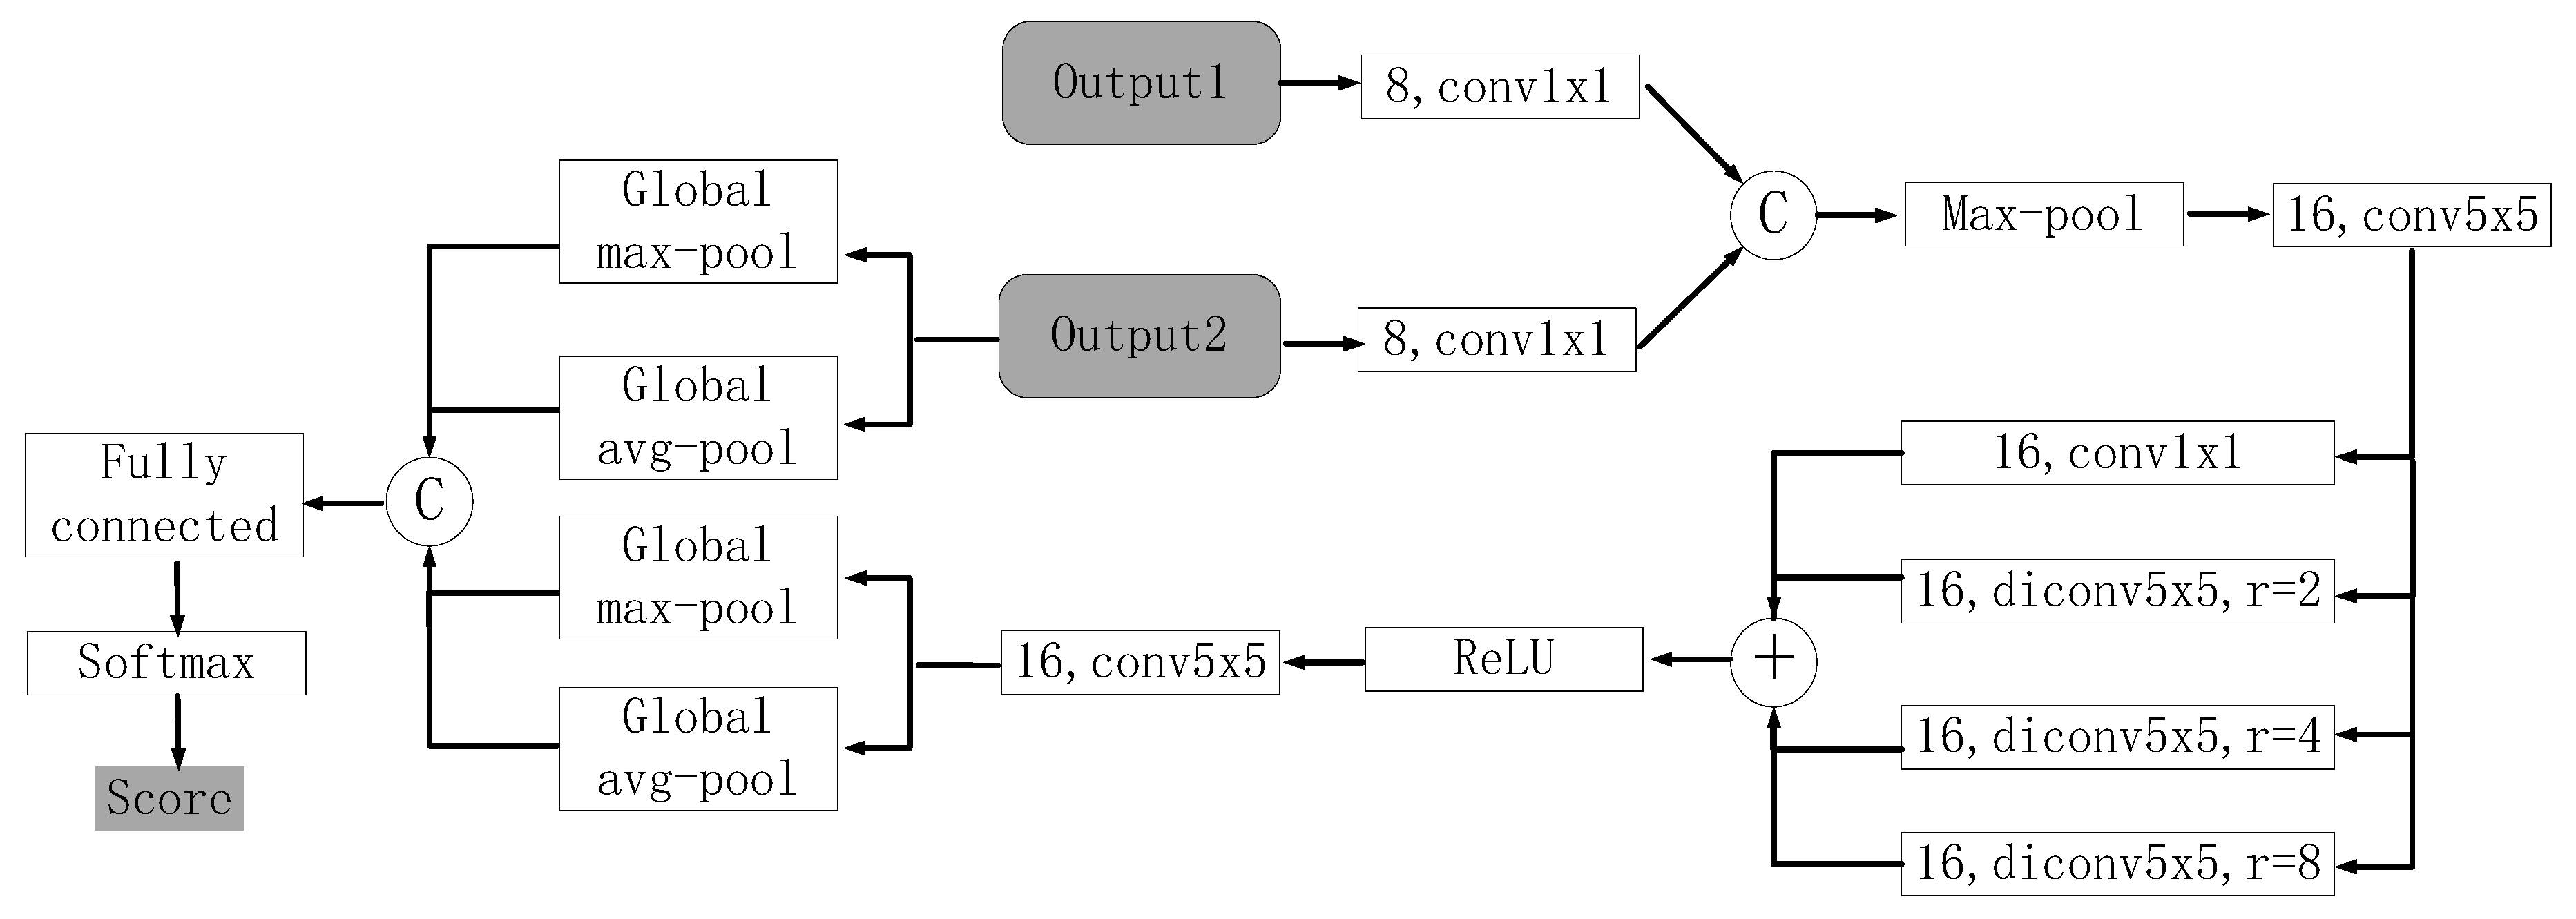
2.3. Classification Network

The classification part relies on the outputs of segmentation network where all the parameters are frozen. As shown in Figure 3, we introduce this module according to Ref. [21]. The main difference is that a mergence operation of multiple dilated convolutions similar to deeplabv3+ [23] is employed to acquire enough receptive field and mitigate the loss of detailed information as much as possible. Moreover, the ReLU activation function after add operation [15] is utilized to be conductive to increasing the network sparsity and alleviating the overfitting issue, in the same manner as in the segmentation model.
Similarly, the loss of each sample in classification network can be calculated by softmax cross-entropy function as follows,
( S j ) = 1 M j = 1 M ( S j + l o g k = 1 C S j k )
where S j indicates the input of softmax function for sample j . C , M refer to the number of categories and samples.

2.4. DAGM Textured Dataset

The proposed approach is evaluated on the open textured surface dataset DAGM 2007 (https://hci.iwr.uni-heidelberg.de/node/3616) for industrial optical inspection. It consists of 10 sub-datasets with different classes of anomalies, the distribution condition of training and testing samples with the size of 512 × 512 is listed in Table 1, and the positive means the textured samples with defects, while the negative represents the defect-free samples. All the defective areas are roughly labeled with an encircling ellipse.
Considering the imbalance of positive and negative samples in training set, we generate another three samples for each positive training example via rotating with 180 degree, mirroring along horizontal and vertical axis in the same manner as in Ref. [19], and a series of relevant experiments for the augmented dataset are also carried out for further analysis.

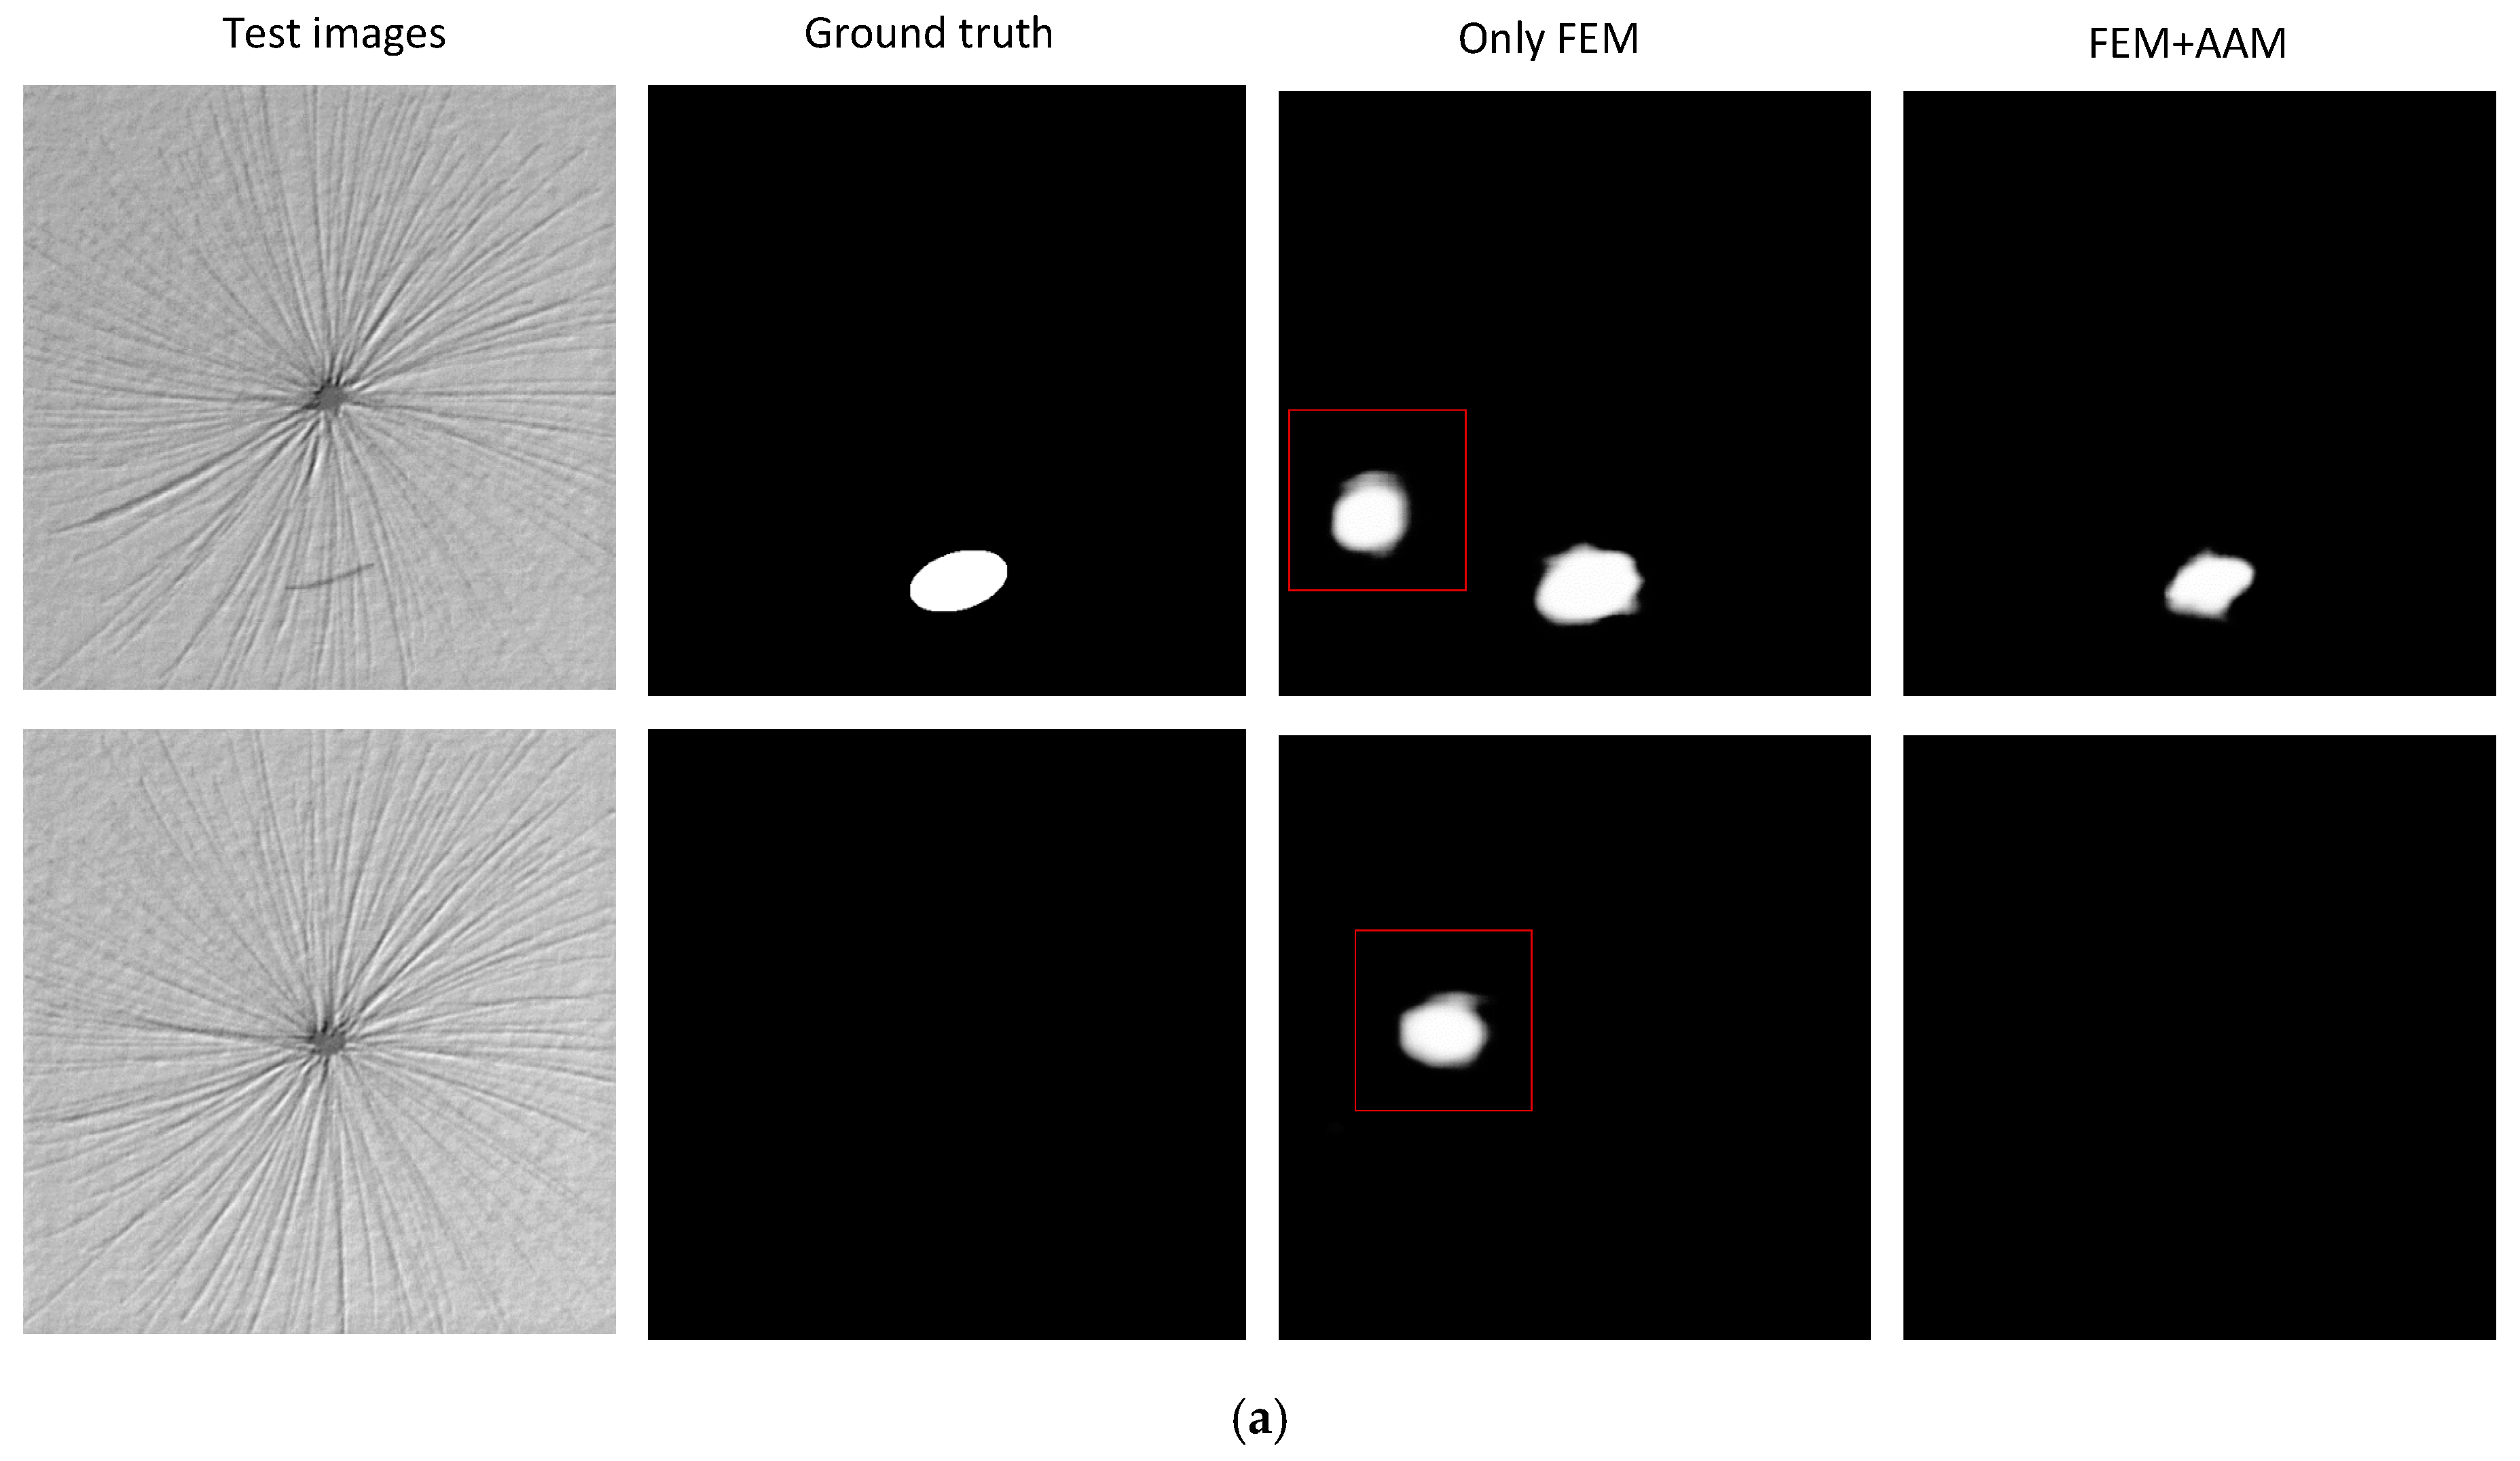
3. Result and Discussion

All experiments are implemented using Tensorflow [24] and the process is divided into two steps. Firstly, the segmentation network is trained independently, then these optimized parameters are frozen and only classification network are trained in the second stage. Batch normalization [25] is implemented in each convolutional layer. The Adam [26] optimizer and a learning rate of 0.1 are used in this paper.
Firstly, the effectiveness of the anomaly attention module is verified from the views that the segmentation results should provide good interpretability as human experts and the optimal performance is liable to achieve. Figure 4a illustrates two examples when the anomaly attention module is used or not used, and the relevant variations of classification score on the test dataset is shown in Figure 4b.
It can be explained that on one side, it can better focus on the object regions for the anomaly attention module than that when only the feature extraction module is applied, and improve the condition that background noises are apt to be erroneously identified as anomalies. On the other hand, due to the interference of the false-alarm blocks, the difficulty in differentiating anomalies from background noises is increased for classification model, which causes us to conclude that the classification network is harder to be optimize as Figure 4b.
Then, we report the results of comparative experiments with Compact CNN in Ref. [19] on the original and augmented datasets as depicted in Table 2.
From Table 2 we can see that Compact CNN is apt to be affected by the imbalance of positive and negative samples, while our model is not very sensitive to this quantity difference and can work well under the two conditions. Therefore, the proposed approach is quite applicable to practical industrial scenarios where defective samples are hard to acquire but numerous defect-free samples are usually available.
Finally, more comparative results are listed in Table 3 for widespread comparison and comprehensive analysis. It is clear that deep learning-based approaches bring about significant performance improvements relative to feature selection methods, which can be explained by the fact that deep learning models can extract more high-level feature representations which are similar to the intrinsic properties of defects and backgrounds, while hand-crafted features merely describe the coarse or middle-level information, and the ability of feature expression is largely limited. Moreover, the proposed model can achieve better results than previous deep learning-based works on DAGM 2007. We hold that the proposed attention-based fusion module plays a crucial role in it. Specifically, it is known that the classification network is highly dependent on the frozen segmentation parameters, and the presented attention-based fusion approach can further optimize them to improve segmentation outputs in the ways of highlighting the potential anomalies and weakening background noises. A number of examples are shown in Figure 5. Figure 6 shows some samples compared with Compact CNN.

4. Conclusions

We put forward an attention-based approach to improve textured surface anomaly detection. A number of experiments demonstrate that our approach is quite insensitive to the imbalance of positive and negative samples; meanwhile, 100% detection results can be achieved without false alarms and missing detections on the original as well as the augmented DAGM 2007 dataset. Consequently, it can be expected that the proposed model will be further applied in the practical industrial scenes where the quantity of anomaly samples is usually limited. Finally, how to implement the quantitative comparison for the segmentation result under weak supervised labels will be the focus of our next work.

Author Contributions

Conceptualization, G.L. and N.Y.; methodology, G.L.; software, G.L.; resources, L.G.; writing-original draft preparation, G.L.; project administration and writing–review & editing, N.Y. All authors have read and agreed to the published version of the manuscript.

Funding

This research received no external funding.

Acknowledgments

We sincerely appreciate the contribution of the DAGM and GNSS institutions for the open dataset to promote the development of textured surface anomaly detection.

Conflicts of Interest

The authors declare no conflict of interest.

References

  1. Masci, J.; Meier, U.; Ciresan, D.; Schmidhuber, J.; Fricout, G. Steel Defect Classification with Max-Pooling Convolutional Neural Networks. In Proceedings of the IEEE International Joint Conference on Neural Networks (IJCNN), Brisbane, Australia, 10–15 June 2012; pp. 1–6. [Google Scholar]
  2. Ghorai, S.; Mukherjee, A.; Gangadaran, M.; Dutta, P.K. Automatic defect detection on hot-rolled flat steel products. IEEE Trans. Instrum. Meas. 2013, 62, 612–621. [Google Scholar] [CrossRef]
  3. Napoletano, P.; Piccoli, F.; Schettini, R. Anomaly detection in nanofibrous materials by cnn-based self-similarity. Sensors 2018, 18, 209. [Google Scholar] [CrossRef] [PubMed] [Green Version]
  4. Liu, G.K.; Yang, N.; Guo, L.; Guo, S.P.; Chen, Z. A One-Stage Approach for Surface Anomaly Detection with Background Suppression Strategies. Sensors 2020, 20, 1829. [Google Scholar] [CrossRef] [PubMed] [Green Version]
  5. Sanchez-Brea, L.M.; Siegmann, P.; Rebollo, M.A.; Bernabeu, E. Optical technique for the automatic detection and measurement of surface defects on thin metallic wires. Appl. Opt. 2000, 39, 539–545. [Google Scholar] [CrossRef] [PubMed] [Green Version]
  6. LeCun, Y.; Bengio, Y.; Hinton, G. Deep learning. Nature 2015, 521, 436. [Google Scholar] [CrossRef] [PubMed]
  7. Dumoulin, V.; Visin, F. A guide to convolution arithmetic for deep learning. arXiv 2016, arXiv:1603.07285. [Google Scholar]
  8. Song, K.; Yan, Y.H. Micro surface defect detection method for silicon steel strip based on saliency convex active contour model. Math. Probl. Eng. 2013, 2013, 1–13. [Google Scholar] [CrossRef]
  9. Shanmugamani, R.; Sadique, M.; Ramamoorthy, B. Detection and classification of surface defects of gun barrels using computer vision and machine learning. Measurement 2015, 60, 222–230. [Google Scholar] [CrossRef]
  10. Gong, R.; Chu, M.; Wang, A.; Yang, Y. A fast detection method for region of defect on strip steel surface. Isij Int. 2015, 55, 207–212. [Google Scholar] [CrossRef] [Green Version]
  11. Lin, T.Y.; Dollár, P.; Girshick, R.; He, K.M.; Hariharan, B.; Belongie, S. Feature pyramid networks for object detection. In Proceedings of the IEEE Conference on Computer Vision and Pattern Recognition (CVPR), Honolulu, HI, USA, 21–26 July 2017; pp. 2117–2125. [Google Scholar]
  12. He, K.M.; Zhang, X.Y.; Ren, S.Q.; Sun, J. Deep residual learning for image recognition. In Proceedings of the IEEE Conference on Computer Vision and Pattern Recognition (CVPR), Las Vegas, NV, USA, 26 June–1 July 2016; pp. 770–778. [Google Scholar]
  13. Badrinarayanan, V.; Kendall, A.; Cipolla, R. SegNet: A deep convolutional encoder-decoder architecture for image segmentation. IEEE Trans. Pattern Anal. Mach. Intell. 2017, 39, 2481–2495. [Google Scholar] [CrossRef]
  14. Long, J.; Shelhamer, E.; Darrell, T. Fully convolutional networks for semantic segmentation. In Proceedings of the IEEE Conference on Computer Vision and Pattern Recognition (CVPR), Boston, MA, USA, 7–12 June 2015; pp. 3431–3440. [Google Scholar]
  15. Oktay, O.; Schlemper, J.; Folgoc, L.L.; Lee, M.; Heinrich, M.; Misawa, K.; Mori, K.; McDonagh, S.; Hammerla, N.Y.; Kainz, B.; et al. Attention U-Net: Learning Where to Look for the Pancreas. arXiv 2018, arXiv:1804.03999. [Google Scholar]
  16. Zhou, T.; Fu, H.; Chen, G.; Shen, J.; Shao, L. Hi-net: Hybrid-fusion network for multi-modal MR image synthesis. IEEE Trans. Med. Imaging 2020. [Google Scholar] [CrossRef] [PubMed] [Green Version]
  17. Liu, Y.; Cheng, M.M.; Hu, X.; Wang, K.; Bai, X. Richer convolutional features for edge detection. In Proceedings of the IEEE Conference on Computer Vision and Pattern Recognition (CVPR), Honolulu, HI, USA, 21–26 July 2017; pp. 3000–3009. [Google Scholar]
  18. Weimer, D.; Scholz-Reiter, B.; Shpitalni, M. Design of deep convolutional neural network architectures for automated feature extraction in industrial inspection. CIRP Ann. Manuf. Technol. 2016, 65, 417–420. [Google Scholar] [CrossRef]
  19. Racki, D.; Tomazevic, D.; Skocaj, D. A compact convolutional neural network for textured surface anomaly detection. In Proceedings of the IEEE Winter Conference on Applications of Computer Vision (WACV), Lake Tahoe, CA, USA, 12–15 March 2018; pp. 1331–1339. [Google Scholar]
  20. Mei, S.; Wang, Y.; Wen, G. Automatic fabric defect detection with a multi-scale convolutional denoising autoencoder network model. Sensors 2018, 18, 1064. [Google Scholar] [CrossRef] [PubMed] [Green Version]
  21. Tabernik, D.; Šela, S.; Skvarč, J.; Skočaj, D. Segmentation-based deep-learning approach for surface-defect detection. J. Intell. Manuf. 2019, 31, 759–776. [Google Scholar] [CrossRef] [Green Version]
  22. Ronneberger, O.; Fischer, P.; Brox, T. U-net: Convolutional networks for biomedical image segmentation. In Proceedings of the International Conference on Medical Image Computing and Computer-Assisted Intervention, Munich, Germany, 5–9 October 2015; pp. 234–241. [Google Scholar]
  23. Chen, L.C.; Zhu, Y.; Papandreou, G.; Schroff, F.; Adam, H. Encoder-decoder with atrous separable convolution for semantic image segmentation. In Proceedings of the European Conference on Computer Vision, (ECCV), Munich, Germany, 8–14 September 2018; pp. 801–818. [Google Scholar]
  24. Abadi, M.; Barham, P.; Chen, J.; Chen, Z.; Davis, A.; Dean, J.; Devin, M.; Ghemawat, S.; Irving, G.; Isard, M. Tensorflow: A system for large-scale machine learning. In Proceedings of the Symposium on Operating Systems Design and Implementation (OSDI), Savannah, GA, USA, 2–4 November 2016; pp. 265–283. [Google Scholar]
  25. Ioffe, S.; Szegedy, C. Batch Normalization: Accelerating Deep Network Training by Reducing Internal Covariate Shift. arXiv 2015, arXiv:1502.03167. [Google Scholar]
  26. Kingma, D.P.; Ba, J. Adam: A method for stochastic optimization. arXiv 2014, arXiv:1412.6980. [Google Scholar]
  27. Scholz-Reiter, B.; Weimer, D.; Thamer, H. Automated surface inspection of cold-formed micro-parts. CIRP Ann. Manuf. Technol. 2012, 61, 531–534. [Google Scholar] [CrossRef]
  28. Timm, F.; Barth, E. Non-parametric texture defect detection using Weibull features. In Proceedings of the SPIE—The International Society for Optical Engineering, San Francisco, CA, USA, 25–27 January 2011; p. 78770J. [Google Scholar]
Figure 1. Segmentation network (AFM: Attention-based fusion module).
Applsci 10 06215 g001
Figure 2. Attention-based fusion module.
Applsci 10 06215 g002
Figure 3. Classification network (diconv: dilated convolution).
Applsci 10 06215 g003
Figure 4. (a) Test samples of segmentation network (FEM: feature extraction module; AAM: anomaly attention module). The red squares represent the areas erroneously detected due to background interference; (b) Relevant test f-score variations in training process of classification network (the initial value is set as 0.9).
Applsci 10 06215 g004aApplsci 10 06215 g004b
Figure 5. Examples of segmentation and classification.
Applsci 10 06215 g005
Figure 6. Examples compared with Compact CNN. The red circles and squares denote information loss owing to the lack of detailed features and the areas erroneously detected due to background interference, respectively.
Applsci 10 06215 g006
Table 1. Sample distribution of the DAGM dataset.
TrainTest
ClassPositiveNegativePositiveNegative
17949671504
26650984491
36650984491
48249368507
57050580495
68349267508
715010001501000
815010001501000
915010001501000
1015010001501000
Table 2. Comparative experiments with Compact CNN on original and augmented datasets (Our results are marked with square brackets. TPR: True Positive Rate; TNR: True Negative Rate).
Original Augmented
ClassTPRTNRTPRTNR
1100[100]96.4[100]100[100]98.8[100]
298.8[100]99.6[100]100[100]99.8[100]
3100[100]97.1[100]100[100]96.3[100]
477.9[100]95.7[100]98.5[100]99.8[100]
5100[100]99.6[100]100[100]100[100]
6100[100]100[100]100[100]100[100]
7100[100]98.9[100]100[100]100[100]
8100[100]99.9[100]100[100]100[100]
9100[100]100[100]100[100]99.9[100]
10100[100]99.7[100]100[100]100[100]
Table 3. Classification performance of the proposed model vs. others (TPR: True Positive Rate; TNR: True Negative Rate).
ProposedCompact CNN [19]FC-CNN [18]SIF [27]Weibull [28]
Class TPR(TNR)
1100(100)100(98.8)100(100)98.9(100)87.0(98.0)
2100(100)100(99.8)100(97.3)95.7(91.3)-
3100(100)100(96.3)95.5(100)98.5(100)99.8(100)
4100(100)98.5(100)100(98.7)--
5100(100)100(100)98.8(100)98.2(100)97.2(100)
6100(100)100(100)100(99.5)99.8(100)94.9(100)
7100(100)100(100)---
8100(100)100(100)---
9100(100)100(99.9)---
10100(100)100(100)---

