1. Introduction
One of the crucial problems accompanying the automotive sector development are road accidents resulting in human and material loss. Such events involve material loss and a loss of life. In 2018, in Poland, as many as 31,674 road accidents were reported, in which 2862 people were killed and 37,359 were injured. However, in the corresponding period, the total of 436,414 road collisions resulted only in material loss. The events classified as collisions of vehicles in motion, which accounted for 53.8% of all the accidents, were found to be most common. As many as 44.3% of all the people were killed in car crashes, and 58.6% were injured. There were 3104 head-on collisions, resulting in 510 deaths and 4676 people suffering injuries. In Poland, the death rate for every 100 accidents was found to be the highest in all the European Union member states in 2017 (8.6). The country which came right after Poland is Greece, with the rate of 6.7, whereas Germany had the lowest rate, at 1.1 [
1], which suggests that Poland faces a serious road traffic safety problem to be urgently addressed.
Next to the human loss, one must also remove the material damage, repair the vehicles damaged in road accidents and collisions. Usually, only accidents involving material losses of road accidents and collisions are considered, whereas insurance companies are involved in compensation of both material and human loss related to the outcomes of accidents delayed in time. As such, they do not focus only on road accidents but also on road collisions and the subsequent costs of repairs. The costs of spare parts, painting, and man-hours for the post-accident vehicle repair are calculated from the car damage analysis.
In Europe, the USA, and Canada one must follow the requirements providing for the impacts of cars with a rigid barrier. Another study [
2] discusses the vehicle superstructure designing method to develop the guidelines for the application of bumper beams and impact energy absorbers. The study also covered the head-on collision with rigid barriers. The low-speed collision requirements by the Insurance Institute for Highway Safety (IIHS) and Dunner tests, considered in this study, are demonstrated in
Figure 1.
For insurance companies, prior to the payment of damages for the car to be repaired, it is also very important to determine whether they are liable for damages or not. For that reason, in the process of insurance claim settlement, insurance companies usually use professional assessments provided by experts ordered by courts and public prosecutors to establish liability for the consequences of road accidents. Currently, the assessors use simulation programs to reconstruct road accidents, so manual calculations are hardly used. Adequate simulation results are of key importance as using incorrect simulation results leads to inadequate decisions in terms of liability for damages, which also triggers some legal effects for the parties to a car repair damages court case. The highest calculation accuracy is provided by programs with finite elements method modeling; the FEM convention, e.g., Abaqus, and LS-Dyna. Another study [
3] uses LS-Dyna program for researching the vehicle structure stiffening elements during head-on collision. The test involved a Sport Utility Vehicle (SUV), very popular in China. The vehicle Finite Element (FE) model was initially validated against a full-frontal rigid barrier impact test by National Crash Analysis Center (NCAC). The study included also a head-on collision with a rigid barrier. A satisfactory compliance of the test and simulation deformations for each such collision was found (
Figure 2).
Other authors [
4] report on using LS-Dyna program for the vehicle front protection system (VFPS). The study has been launched to address the problem of animals crashing into vehicles in Australia, causing damage to headlights, engine coolant radiators, and engines. The VFPS changes the vehicle crush characteristics during a head-on collision and affects the airbag activation characteristics. An inadequate VFPS structure results in a greater vehicle damage, hence resulting in higher repair costs and potential passenger injuries. Applying the FEM convention modeling program, a structure eliminating such defects has been developed (
Figure 3).
The FEM convention modeling programs are most commonly used in research facilities. However, they have not been commonly applied for the reconstruction of road accidents as geometric and material data must be introduced, which is discussed also by other authors [
5,
6]. The authors of this study have performed numerical research in the LS-Dyna environment. The results of that research was experimentally validated with crash tests using a full-size road infrastructure support structure dimension. The structure satisfied the Polish PN standard - PN-EN 12767 requirements: “Passive safety of road infrastructure support structures—Study requirements and methods”. The study has demonstrated as a good compliance of the simulation with the experiment.
In practice, however, programs for modeling impacts and post-impact movement of vehicles in multi-body system convention (MBS) are used for analysis of vehicle collisions. They are not so precise as FEM programs; however, they offer significantly shorter calculation time and easier operation without the need to enter geometric and material constants. In consequence, modeling with the use of these programs is simplified. As practice shows, the users of these programs, who are commissioned to provide the court with assessment of road accidents, are not aware of it and make mistakes accepting incorrect simulation results as final. Programs for modeling in MBS convention include, for example, V-SIM, PC Crash, and Virtual Crash. Another study [
7] reports on the tests of head-on collision with a rigid barrier at 13–95 km/h and full overlap, as compared with the experimental results. V-SIM, however, has not been verified with a full-frontal rigid barrier impact test. In other studies [
8,
9], contact parameters and other data were identified from crash tests and used in simulation. The articles present both the results of computer simulation of a passenger cars crash with a non-deforming barrier and a pole with V-SIM and the experimental results published by Allgemeiner Deutscher Automobil-Club and AUTOBILD. The results were received for the same initial conditions, which has facilitated evaluating the credibility of computer simulation. The V-SIM program can also be applied to verify damage using the SDC (Static, Dynamic, Characteristic) analysis method to prevent the payments of undue damages for vehicle repairs. It uses the results of geometrical parameters and the appearance of damage, as well as the results of a dynamic collation of the collision. A practical application of this method is described in another study [
10], presenting research methods which facilitate an efficient verification of the vehicle collision to determine whether the crash actually occurred or not. It also presents an IT tool automating the decision-making process and supporting the expert’s operations, verifying the impact with the SDC method.
The application of this program in Poland is common. Since it is so common to use the V-SIM program for the reconstruction of accidents and for insurance claim settlements, the problem of reliability of the simulation and the effect of the input data on the simulation results is addressed.
2. Materials and Methods
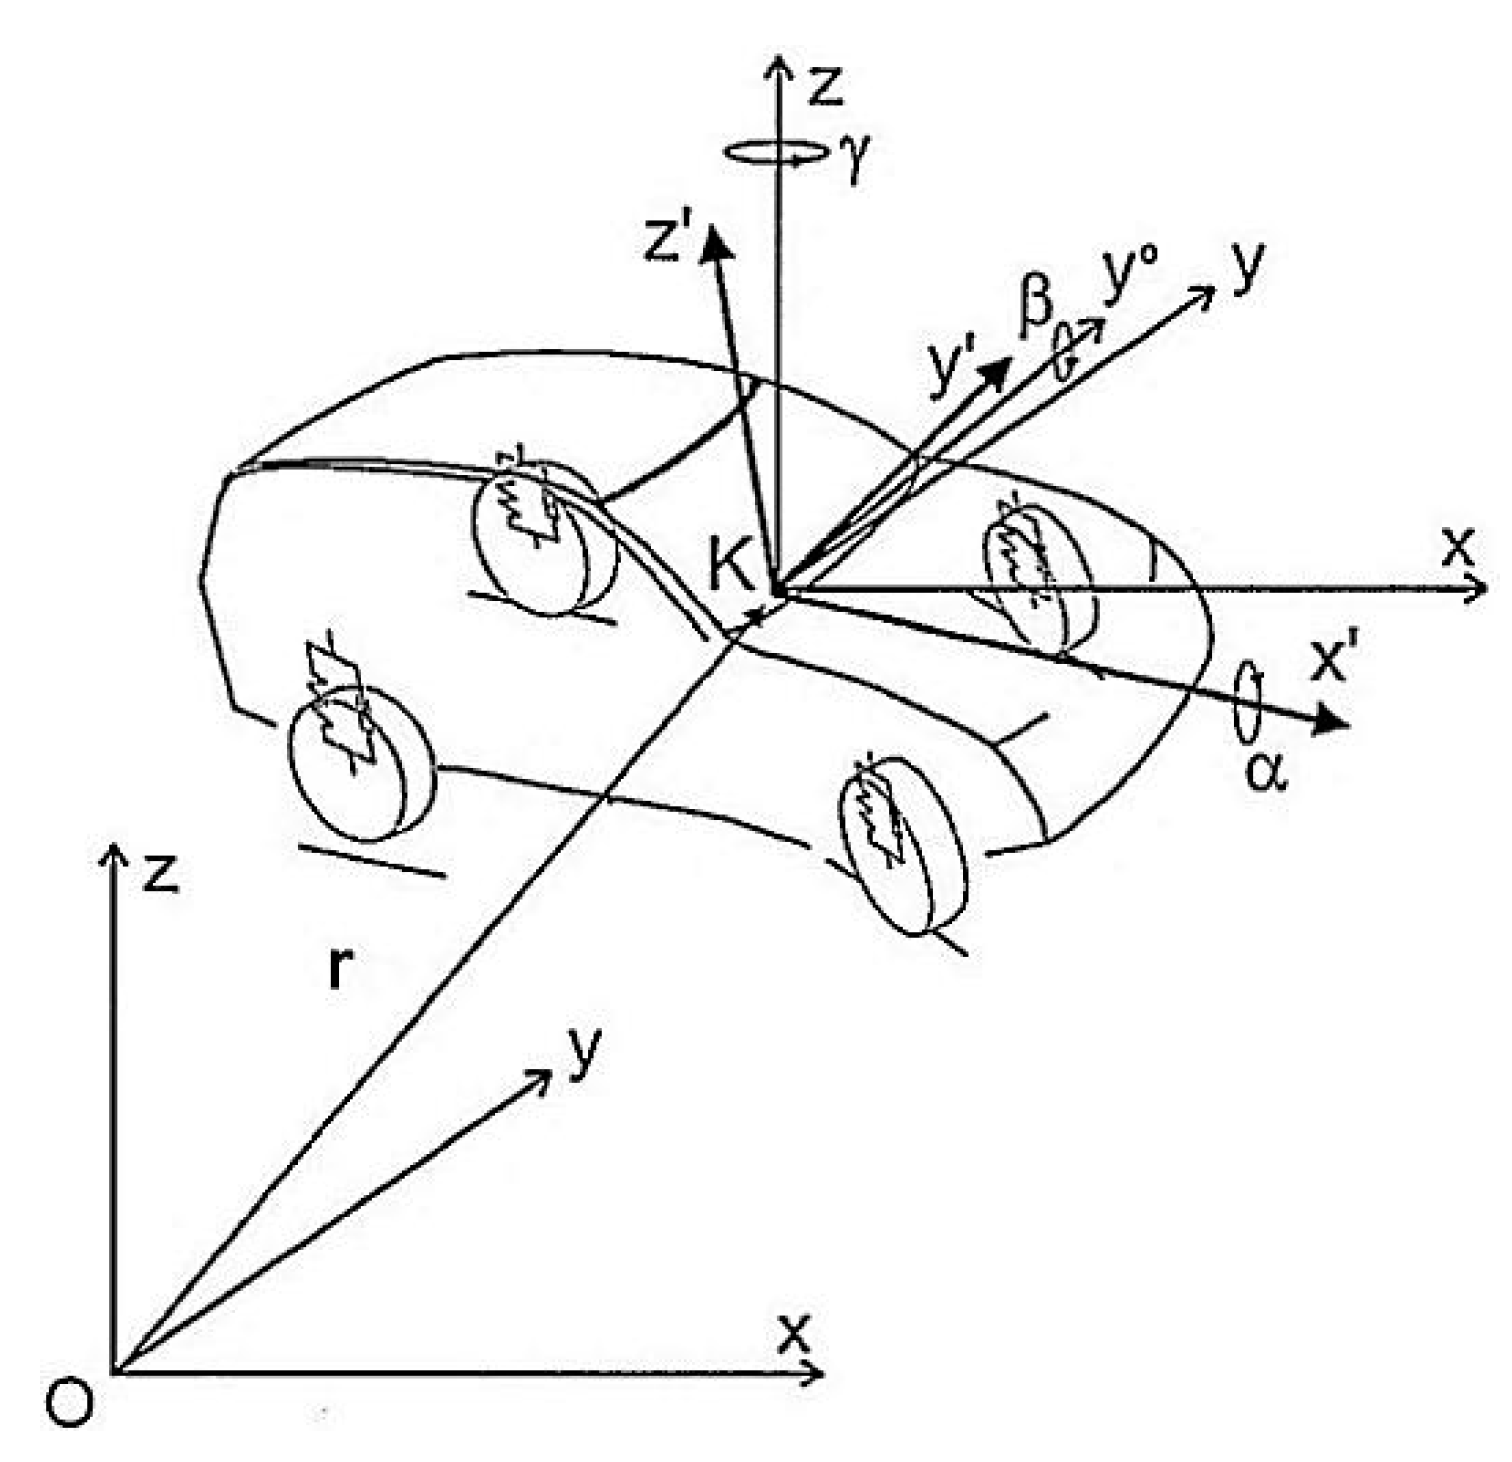
The V-SIM code is designed for the analysis of the impacts of mechanical vehicles (passenger cars, trucks, semi-trailer trucks, and semi-trailers and trailers). It also facilitates the analysis of the impact of vehicles with rigid barriers, such as a wall. The program models the movement of the vehicle, which is treated as a solid with 10 degrees of freedom, moving as a result of the external forces acting on it. The model involved the application of two systems of reference. The first is the global one, which describes the momentary positions of the simulation objects and the position of the movement environment elements designed, e.g., the terrain barriers. The coordinate axes of the reference system are marked
x,
y,
z. The axis is oriented opposite to the force of gravity, and the beginning of the reference system is selected by the program operator. The second system of reference is related to the simulated vehicle, and its axes are marked
x’,
y’,
z’. In that system, the external forces acting on the vehicle are determined. Axis
x’ in that system is directed according to the movement of the vehicle, while axis
z’ is directed vertically upwards the unladen vehicle, and its direction and sense result from the orthogonality and clockwise nature of the system. The positioning of the center of the vehicle mass is determined by radius vector
. (
Figure 4).
Equations of motion for the vehicle in the reference system related to the center of mass of the vehicle have been provided with the following formulas [
11]:
where:
—radius vector,
—rotational speed of the vehicle in the system connected to the vehicle, and
—tensor of the mass moment of inertia.
For the rotational movement, there has been assumed the tensor of mass moment of inertia with zero mass moments of inertia, besides the main moments, which has resulted in the system of scalar equations describing the rotational movement, presented below [
11]:
where:
—the main moments of inertia of the vehicle,
—components of the moment of external forces acting on the vehicle in the system connected to the vehicle, and
—components of the rotational speed velocity of the vehicle against the axes selected.
The total force acting on the vehicle is the force of gravity, the forces of aerodynamics resistances, and the forces brought by the suspension of the vehicle wheels, which has been described with the following formula [
11]:
The gravitational force has been determined by transforming from the global system of reference according to the following formula [
11]:
where:
The forces of aerodynamic resistance are determined irrespective of the frontal and side area of the vehicle from the speed of the vehicle, while considering wind speed
according to the formulas provided below [
11]:
where:
—air density,
Cx, y—coefficients of the frontal and side air resistance,
Ax, y—frontal and side areas of the vehicle,
—linear velocities of the vehicle in the system connected with the vehicle, and
wx, y—component wind speeds in the system connected with vehicle.
The vehicle suspension model also considers the independent vertical movement for each wheel of the vehicle. From the positioning of the vehicle and the local configuration of the road surface, deflection of the suspension S
i is determined, whereas the normal force of the response of the suspension considering the elasticity with progressive characteristics and the damping values is calculated from the momentary deflection and the velocity of its changes according to the formula [
11]:
where:
—vertical component of the response of the vehicle suspension,
—reduced value of deflection of the vehicle wheel suspension,
—reduced coefficient of progression of stiffness of the vehicle wheel suspension,
—reduced coefficient of stiffness of the vehicle wheel suspension,
—normal force of the response of the vehicle wheel suspension,
—reduced damping coefficient for the compression of the vehicle wheel suspension, and
—reduced damping coefficient for the stretching of the vehicle wheel suspension.
The program for determining the interaction of the tires with the road surface used a nonlinear model developed at the Highway Safety Research Institute (HSRI), University of Michigan, by the Dugoff team and TM-Easy. The forces of the tire reactions are calculated in the system connected with the tangent point of the tire with the road surface, and the normal force of the tire is assumed as the normal force of the reaction of the suspension. The normal force of the tire, the rotational speed of the wheel, and the parameters of the road surface are used to determine the forces of the reaction of the tire in the other axes of the system. For each wheel of the vehicle, additional degree of freedom has also been considered, and rotational movement has been considered. The model considers the driving torque and the movement resistances according to the formula [
11]:
where:
—mass moment of inertia of the vehicle wheels,
—rotational speed of the vehicle wheels,
—reduced driving torque of the vehicle wheels,
—component of the force of the response of the tire in the system connected with the tangent point of the vehicle tires with the road surface,
—rolling radius of the vehicle wheels,
—break torque of the vehicle wheel brake,
—reduced engine brake torque which occurs on the vehicle wheels,
—road surface rolling resistance torque which occurs on the vehicle wheels, and
—vehicle-wheels own resistances torque.
The model of the brake system of the vehicle considers the corrector of the braking force of the rear axle for each load of the vehicle, and, optionally, it can consider also the effect of the anti-blocking system (ABS).
However, the driving torque of the engine is determined from its external characteristics from the following formula [
11]:
where:
—driving torque of the vehicle engine,
—rotational speed of the vehicle engine,
—maximum torque of the vehicle engine,
—maximum power of the vehicle engine,
—speed for the maximum power of the vehicle engine, and
—rotational speed for the maximum torque of the vehicle engine.
The operation of the steering system of the vehicle was analyzed using the kinematic model following the Ackermann steering principles, considering the susceptibility of the real-life system and the correction of shearing forces of the reaction of the tires of the wheels of the steered axle. The program can also model additional tasks for the vehicle and for the driver; the vehicle acceleration and a turn with the steering wheel, braking with the foundation and secondary brakes, using the clutch and blocking the wheel, a pressure drop in the tire, and the deformation of suspension.
A force-based model has been developed for an impact with the impact forces developing in a constant manner while two objects are in contact [
12]. The impact of vehicles is detected with a 2D or 3D model developed for collision detection, depending on the choice of the operator. This choice, however, should be informed and adequate to the collision analyzed. It mostly applies to the impacts of vehicles the geometric compatibility of which is inconsistent, which has also been discussed in other studies [
13]. Solving problems of collision modeling is also discussed in Reference [
14,
15,
16].
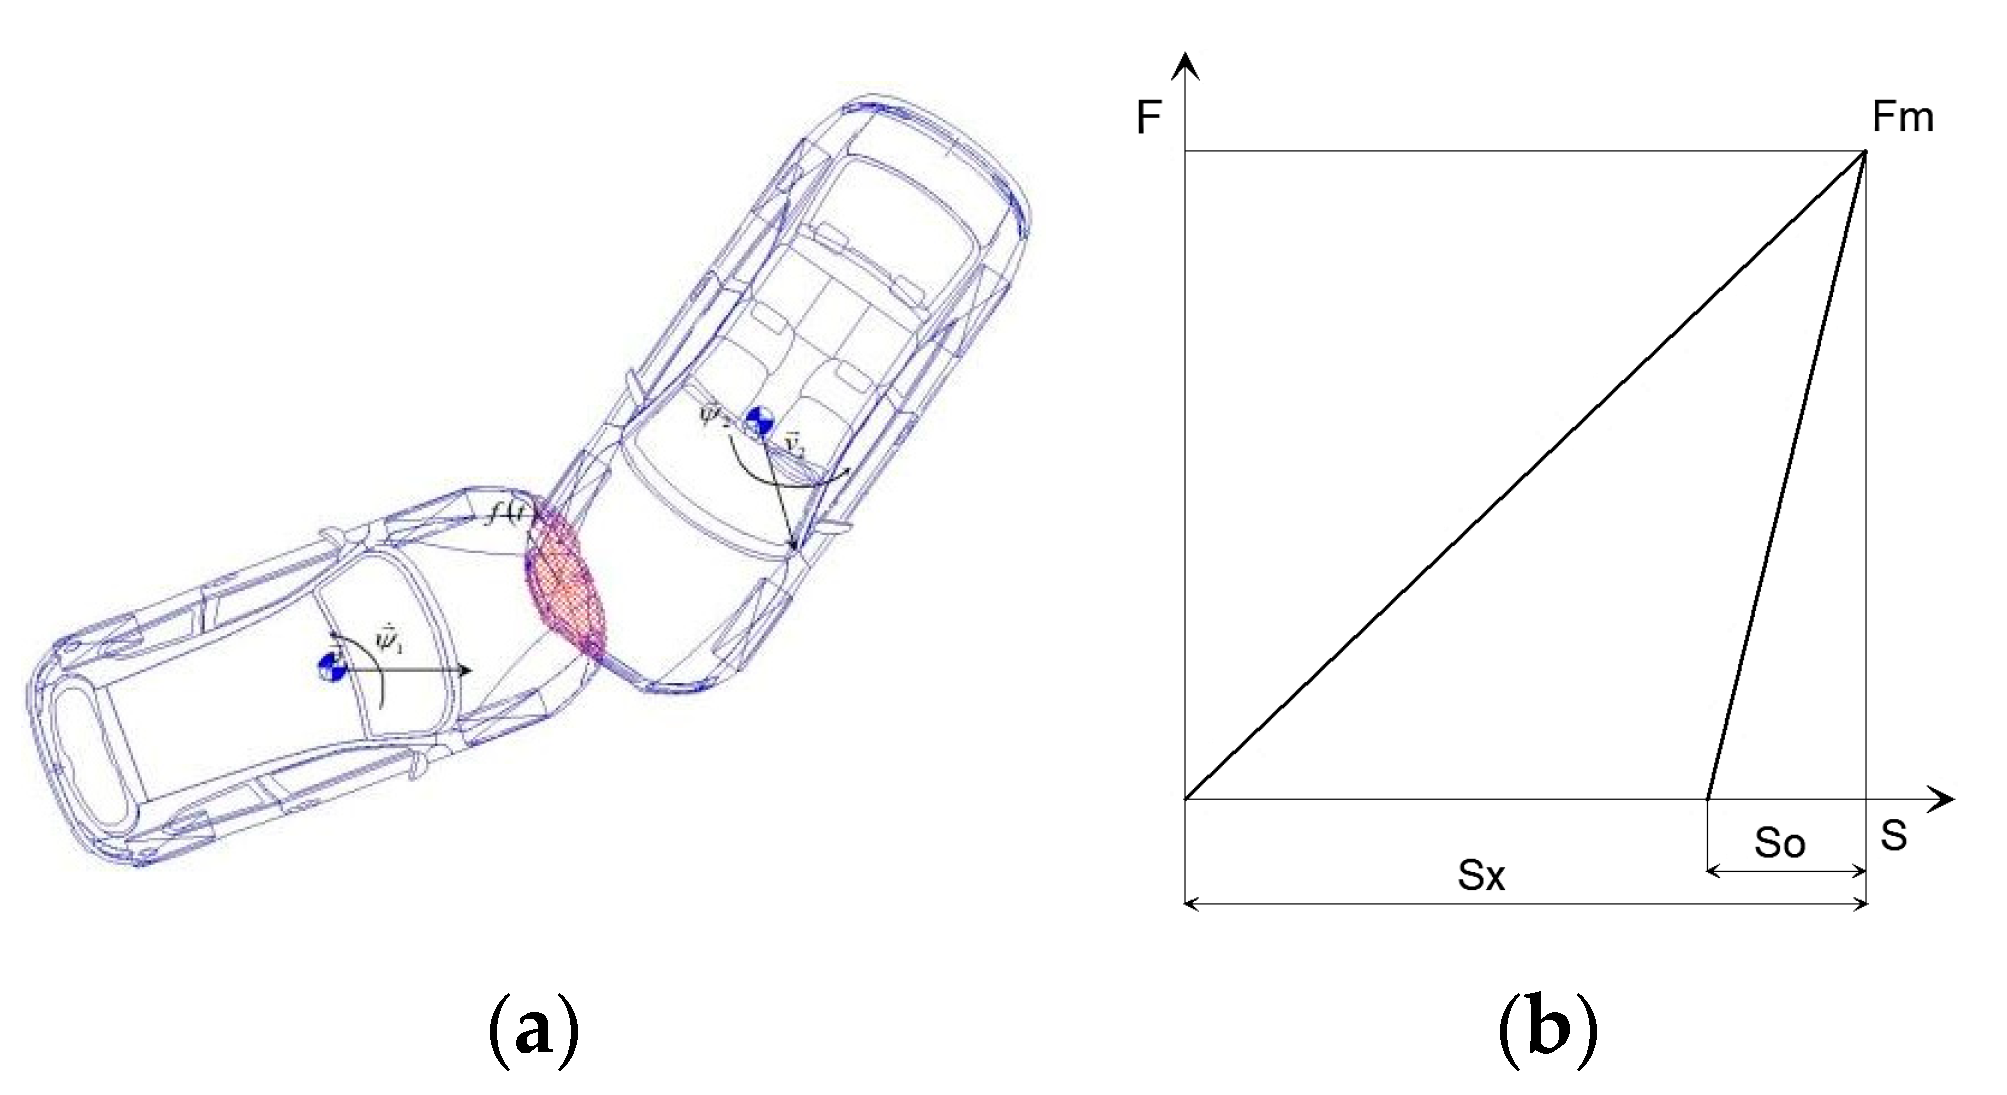
An impact force model of the V-SIM program suggests a development of force
F in time during the impact compression, and then its collapsing, according to a certain function in the restitution phase. Such an approach assumes that all the external and mass forces, provided by the vehicle model and by the model of a wheel, occur during an impact [
17,
18]. Detailed methods for a vehicle impact modeling with a rigid barrier are used in another study and presented below.
Such modeling considers changes of force which appear during an impact and its influence on the vehicle movement, as well as the occurrence of two impact phases: the first is a compression phase (when the value of momentary F force increases), whereas the second one is a restitution phase (when the value of momentary F force decreases), and according to Newton’s hypothesis, the above phases are associated with restitution coefficient k.
On the basis of the concept of force impulse for the compression and restitution phases, formulas for both phases are used [
19]:
where:
—represents impulse of force for the compression phase,
—represents the compression phase beginning time,
—represents the compression phase end time, and
—represents a momentary force of impact.
The total impulse of the impact force is presented as the sum of force impulses for the phases of compression and restitution, expressed using the formula [
19]:
In turn, joining the values of both impulses of the force by applying the restitution coefficient is described by the formula [
19]:
The applied impact model assumes that, during the impact, the value of temporary impact force
F is proportional to the volume of overlapping contours of the colliding simulation objects (
Figure 5a) by the below formula [
19]:
where:
—stands for stiffness coefficient of the impact area [N/m3], and
—stands for the impact area volume [m3].
After linearization of the course of action of forces that occur during the two earlier indicated phases, the impact force is presented with a diagram in
Figure 5b. Modeling also includes the mean value of the force in the states of compression and restitution, expressing the coefficient of restitution by the following formula [
19]:
where:
—stands for the mean value of force F in the compression phase,
—stands for the mean value of impact force F in the restitution phase,
—stands for the restitution phase duration time, and
—stands for the compression phase duration time.
For the uniformly variable motion, the deformation depth has been described with the following formula [
19]:
where:
The course of action of impact force
F during restitution is written by formula [
19]:
For k = 0 → F(t) = 0, where:
—stands for maximal value of the impact force, and
—stands for depth of deformation at the end of the compression phase.
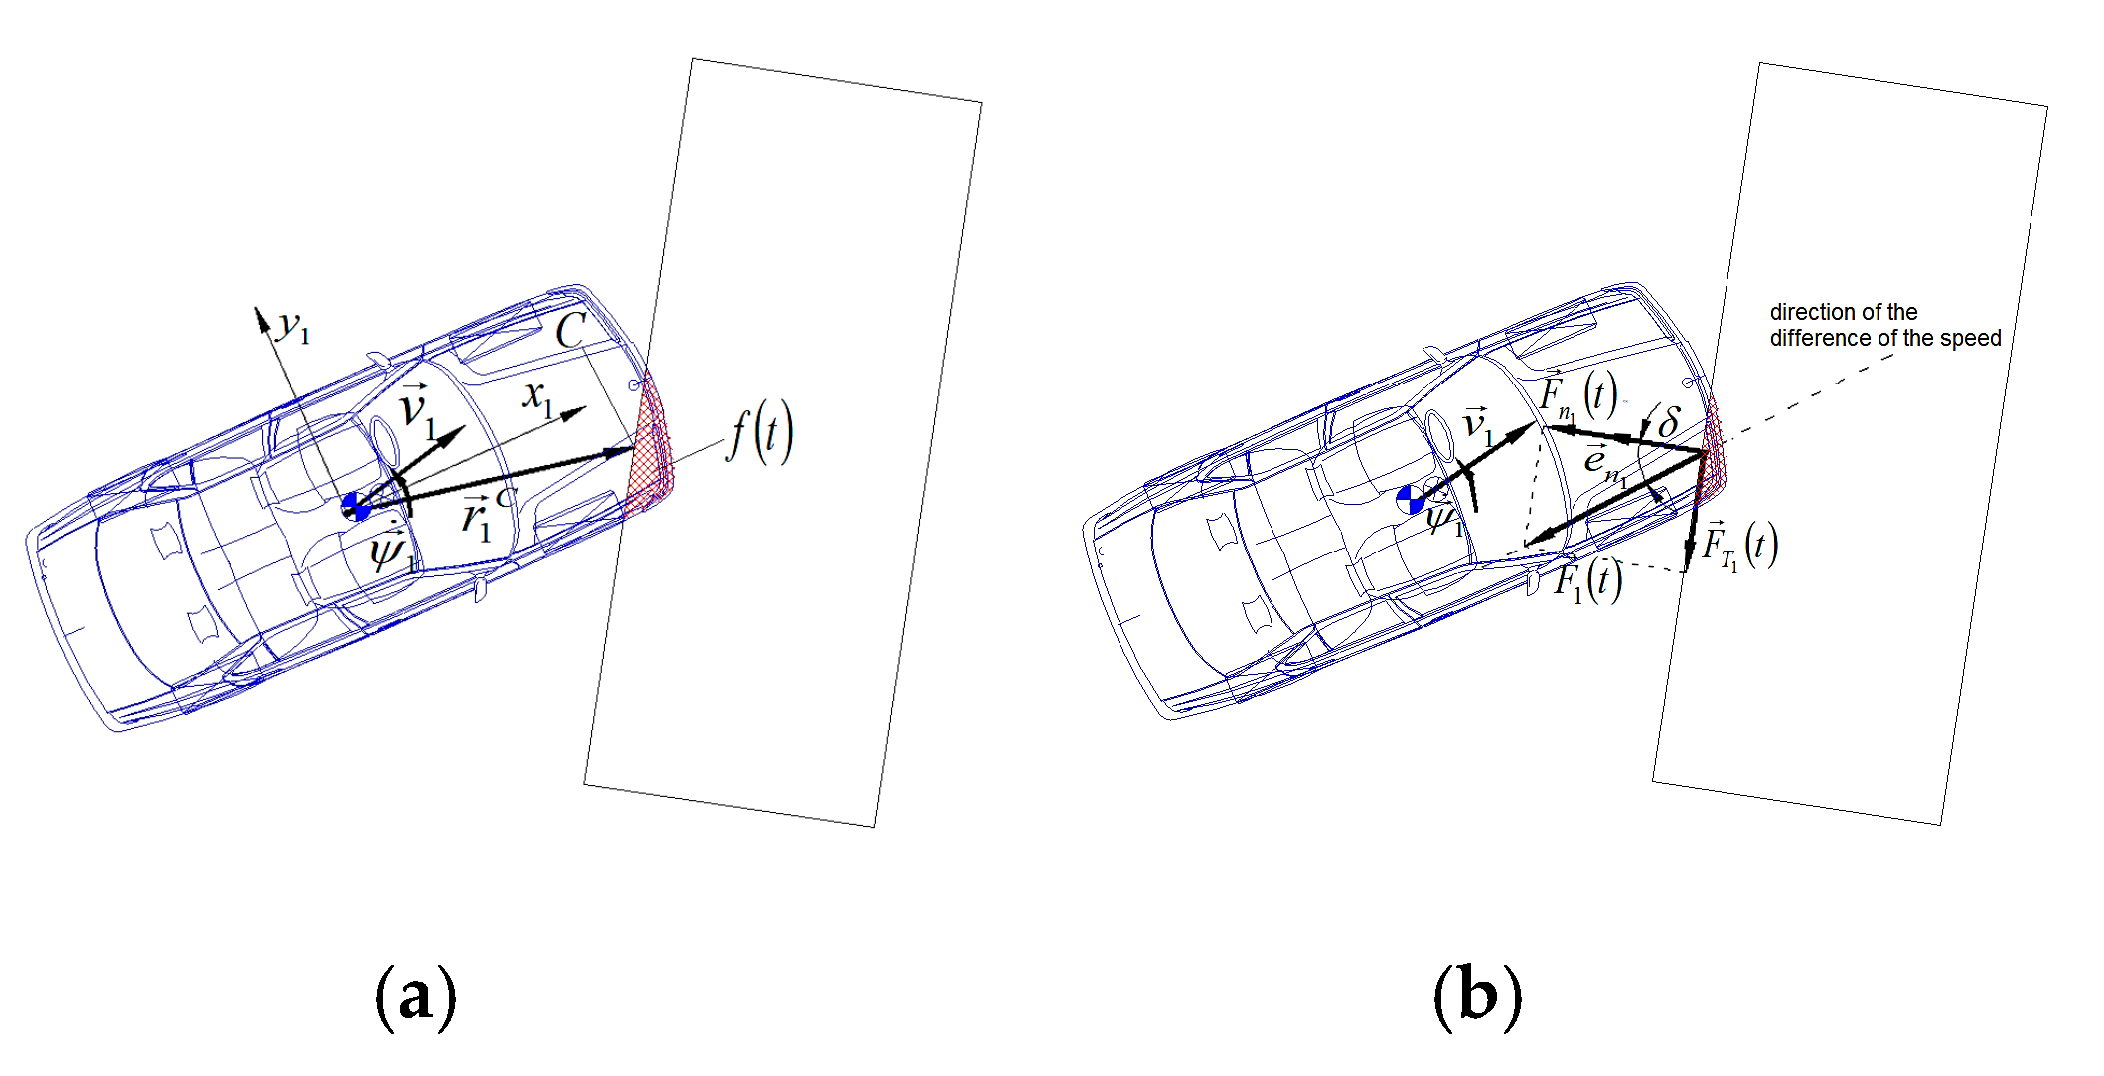
It has been assumed that having been hit by a vehicle, the wall does not undergo deformation. Following that approach, the vector of momentary impact force
is on the margin of a non-deforming barrier, in point
C, found in the middle of the barrier length, in the area (
Figure 6a), whereas, the position of this point for the vehicle is defined by radius vector.
Momentary impact force
F is represented by the following components: tangent and normal to the surface of the non-deforming area. In its application point, the direction of normal component is perpendicular to the surface on the non-deformable area. The unit vector which defines the direction of this component is marked (
Figure 6b)
, and it is defined as follows [
19]:
where:
stands for the normal component value.
In this model, friction force occurring in the place of impact is represented by tangential component
. Its value must be such that the direction of the speed difference is consistent with the direction of impact force resultant
. In
Figure 6b, the angle between the direction of impact force component and the speed difference direction is marked as δ. It was also accepted that the value of tangent component cannot exceed the product of normal component and friction coefficient
µ.
The value of tangent component is expressed with the formulas [
19]:
The compression phase finishes when the impact area f (t) ceases to increase and the restitution phase begins. The value of normal component decreases from the maximal one down to zero, with the assumption of the above linear change in momentary impact force F to be a function of time and restitution coefficient k.
3. Results
A crash test of Mercedes Benz C300 4Matic AWD from 2013, published by National Highway Traffic Safety Administration [
20] was used to identify the impact parameters. The car tested was involved in a head-on collision with a rigid barrier (overlap 100%) with the speed of 56.3 km/h. The total mass of the vehicle was 1703 kg, its length: 4.581 m, its width: 1.770 m, its wheel base: 2.760 m, the front axle: 1.549 m and the rear axle: 1.552 m, the height above the ground: 0.552 m, the moments of inertia: roll 605 kgm
3, pitch: 2700 kgm
3, and yaw: 2771 kgm
3. The test was recorded from above and from the right and left sides of the vehicle, as well as from the bottom.
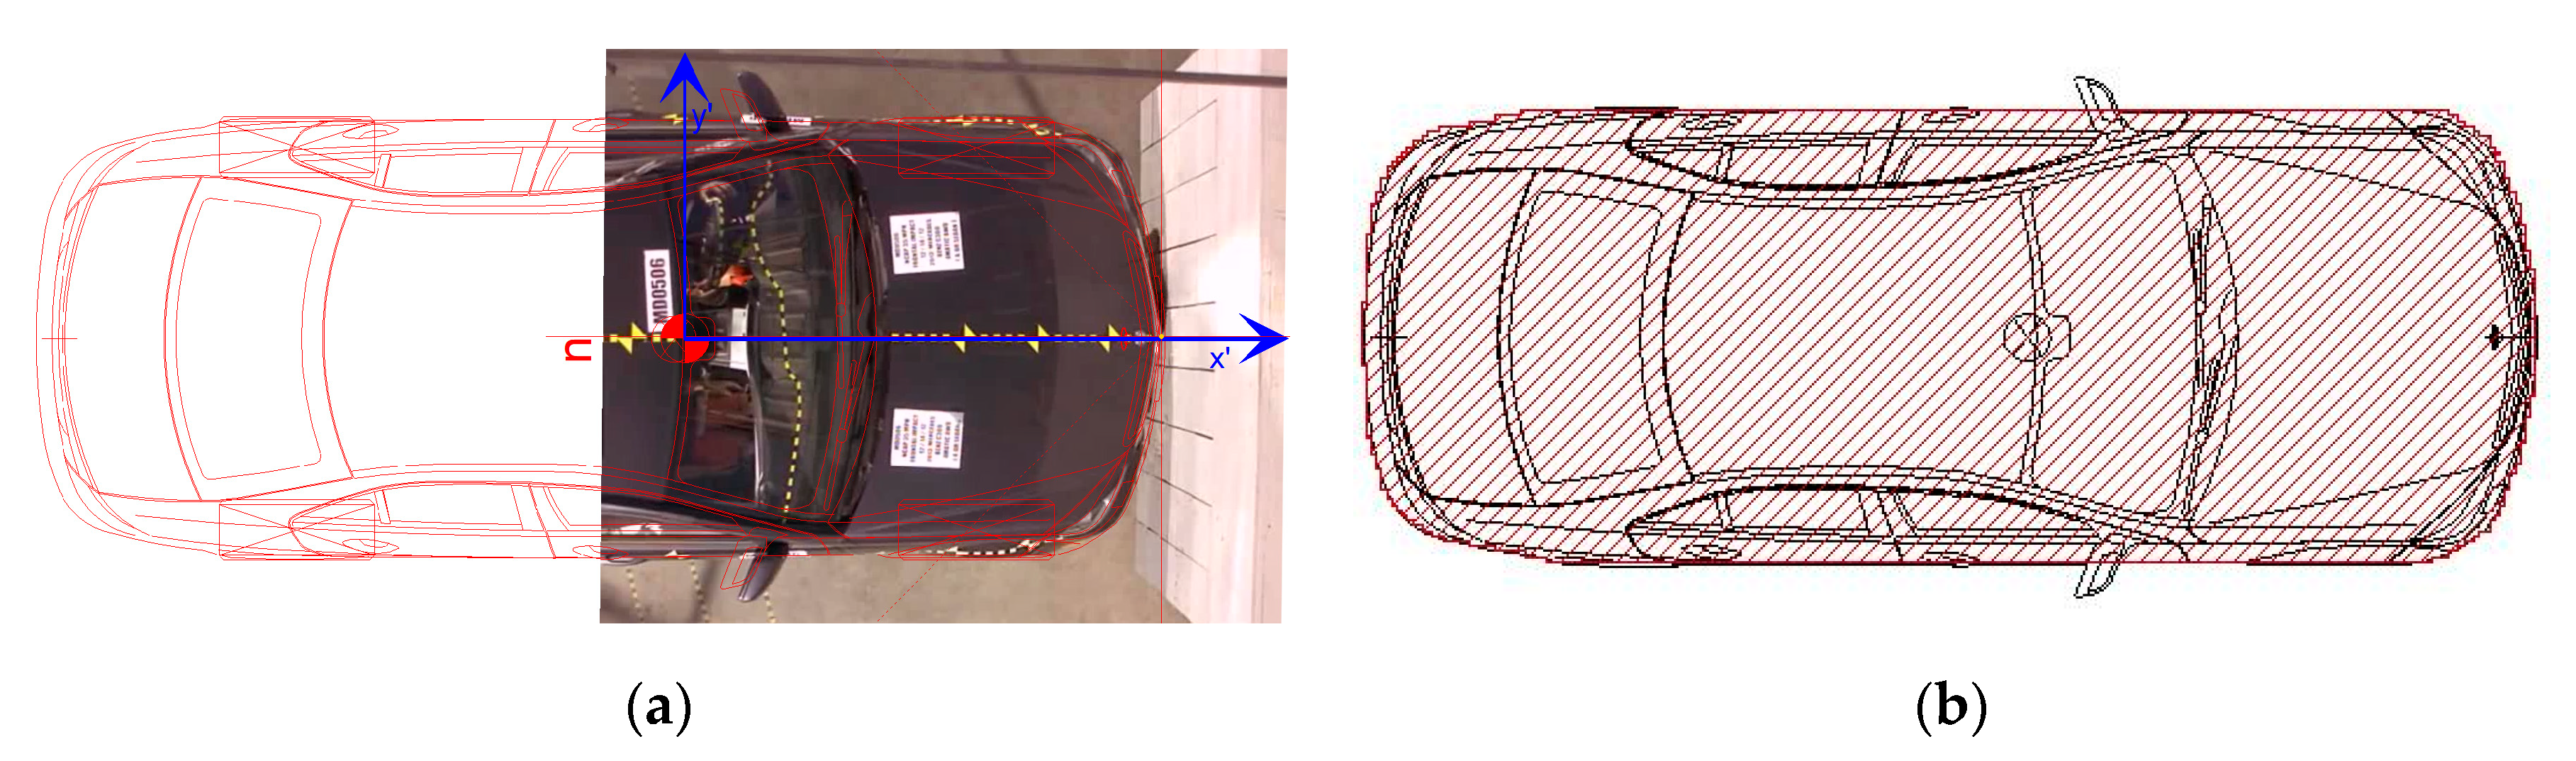
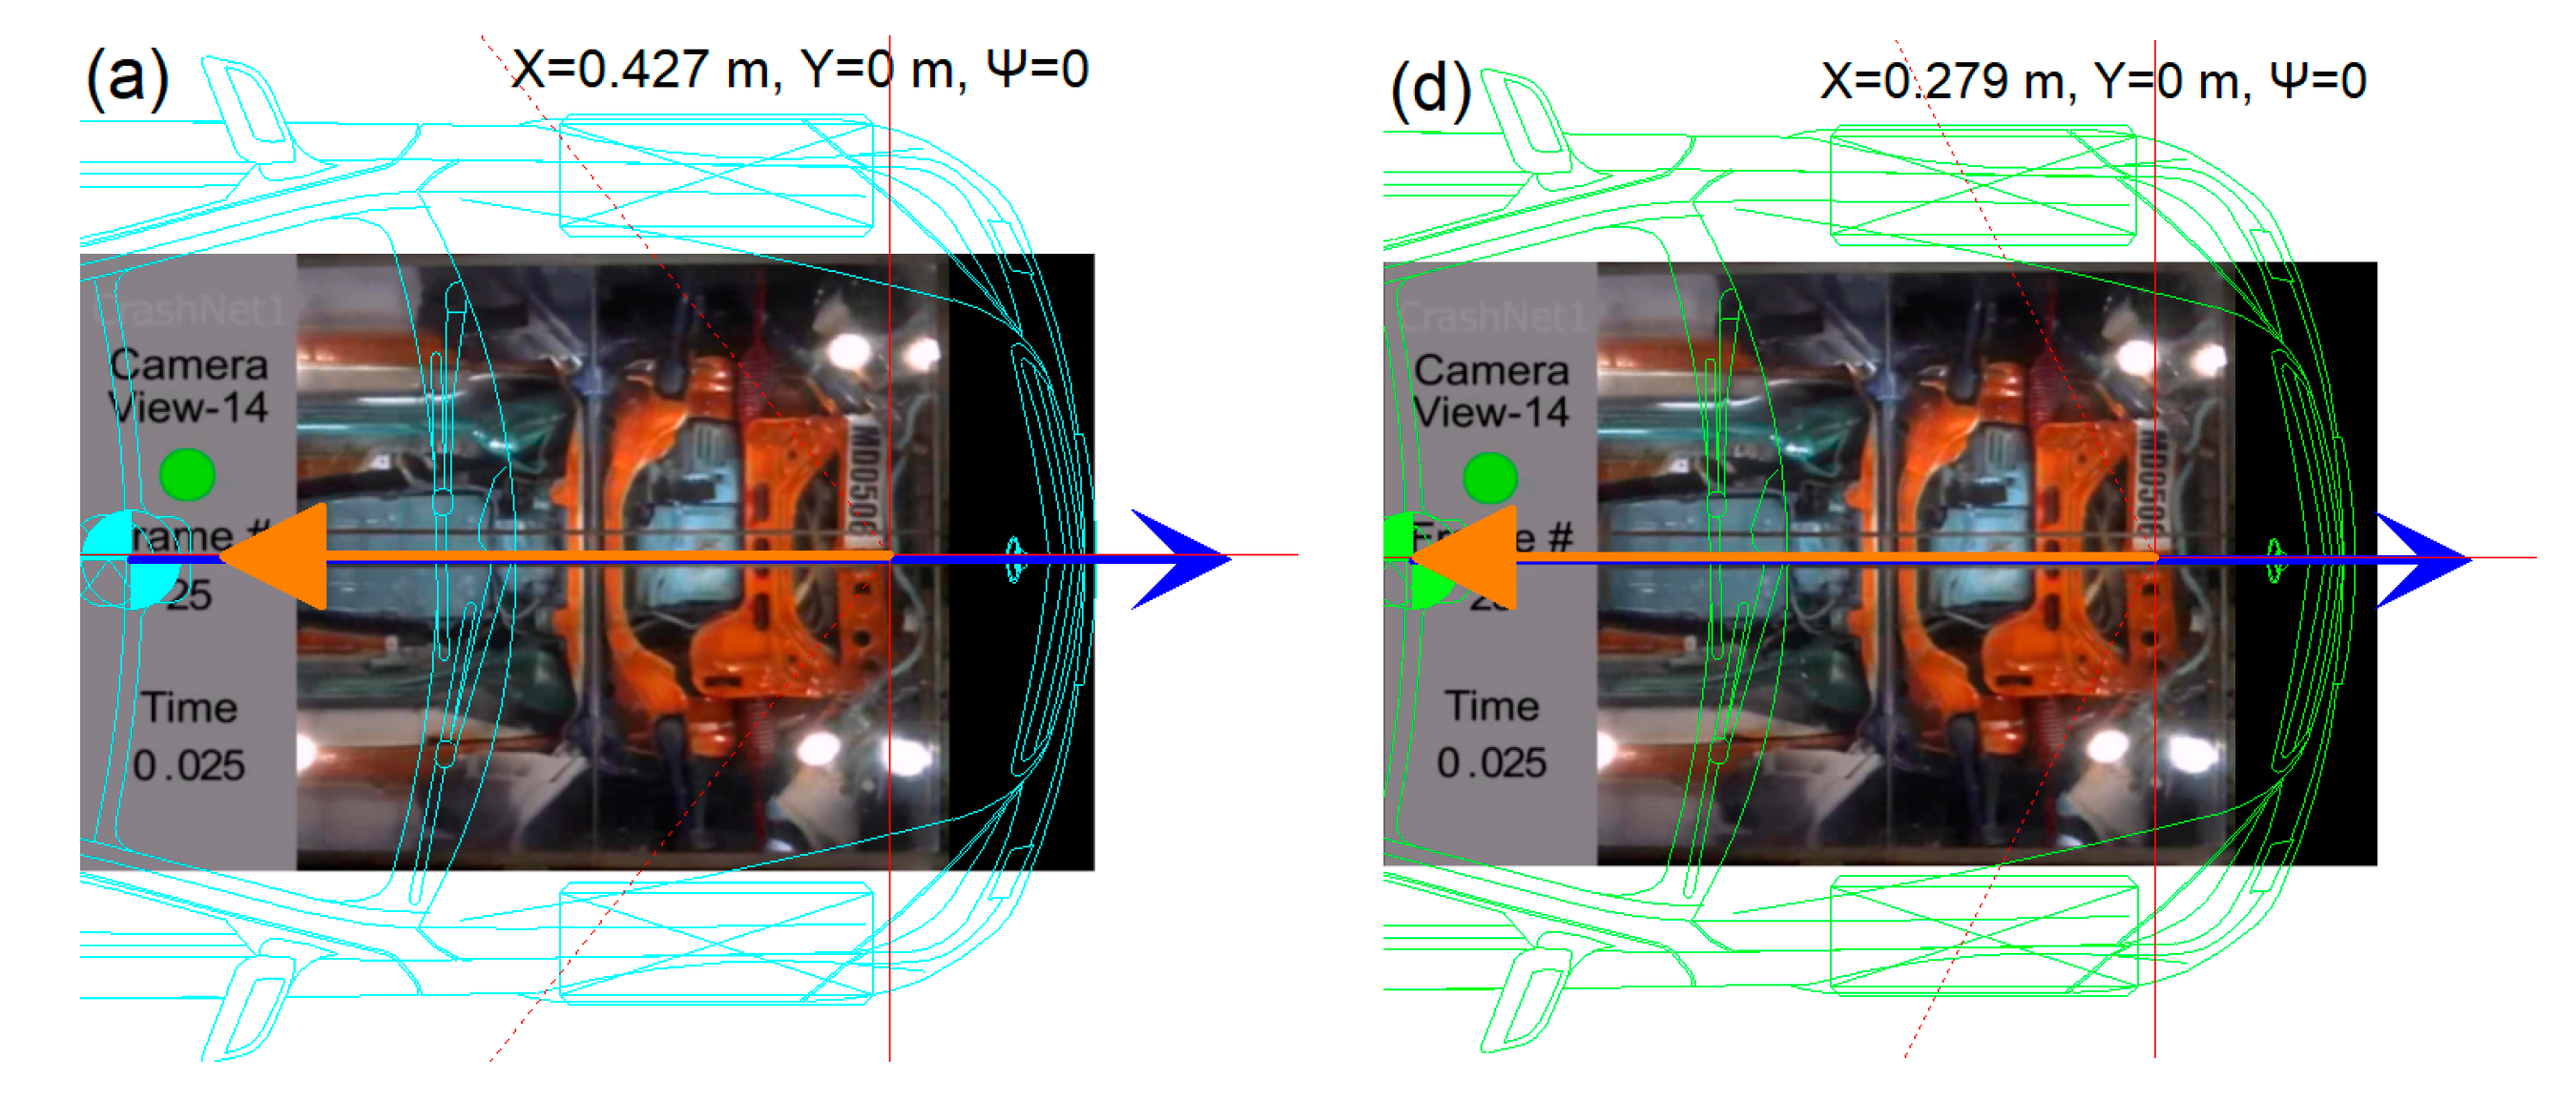
In practice, the experts and assessors have problems obtaining the experimental data to be used in the simulation calculation of a reconstructed road accident. To acquire the data, a research method involving measurements of the vehicle body position during an impact from the crash test film has been proposed. Crash tests are recorded with fast video cameras facilitating the separation of particular frames (images) of the moving vehicle, even every 1 ms. First, the assessor should, of course, establish precise technical data of the vehicle involved in the accident. A precise data determination is very important as, according to the author, it is the assessor’s further task to find a crash test of a vehicle with structure similar to the one which was involved in the accident. Only then can they go on to separate all the single images from the video, preferably, every 1 ms. Next, they should adjust the scale of the vehicle images to its vector styling, which is in scale and depicts details of the car body. A division into images (frames) can be performed with programs designed for this kind of film processing, whereas precise scaling is possible with the use of the V-SIM program. For this purpose, a single image needs to be imported to the program, and the size of a vehicle image needs to be matched with its vector styling; those stylings, in turn, are imported from external databases. For the purpose of this study, the styling of the Mercedes available in the AutoView database was used. The vehicle scale tapes can be applied in crash tests, as well as technical data, including the width, length, and the axle base.
According to the research procedure proposed, after scaling, it is necessary to start the analysis with the image depicting the moment of contact consistent with simulation time being
t = 0 ms. The results of the image scaling at the moment of contact corresponding to the beginning of simulation are presented in
Figure 7a. Measuring the vehicle body position changes, it is necessary to consider the vehicle elements which do not undergo deformation in the picture; the analysis accepts the roof edge near the windscreen. No universal rule can be used here due to different kinds of impacts and different zones of body deformation. It is more difficult to scale the image of the undercarriage, and one must focus on a selected well-visible element. The rear part of the engine supporting frame, close to the gear box, was selected for analysis.
In
Figure 7b, a rigid area preview is presented on a projection of a vector styling of a Mercedes. However, in this program, the changes in the vehicle body positions were measured in a system, the center of which is in the middle of the vehicle mass. Axis
x’ of this system is directed in the forward-facing position of the car, axis
y’ runs left clockwise, and axis
z’ runs vertically, upward.
After scaling the images, according to the proposed research procedure, a simulation with default impact parameters, proposed by the V-SIM program, started. The results are presented in
Figure 8a–c. After the measurements, an impact simulation was performed for the crash test parameters, and the results are presented in
Figure 8d–f.
A comparison of the simulation results for the program default data with data identified from the crash test shows that the positions of vehicles were similar only in the initial phase. In time
t = 50 ms, the stylings of the simulated vehicles are similar, and they overlap with the image of the real vehicle at the edge of the roof, near the windscreen (
Figure 8a–d). However, over time, an error of the vehicle position develops for the program default data. In time
t = 150 ms, the vehicle simulated for default data is definitely shifted forward in relation to the actual one; the edges of the roof near the windscreen do not overlap (
Figure 8b), whereas, for a vehicle simulated for the data identified, entered into the program, a consistence of the position with the real vehicle was obtained (
Figure 8e). In turn, in the case of post-impact movement, the simulated vehicle for default data is moved backward in relation to the real one, after the vehicle rebound from the obstacle, in time
t = 300 (
Figure 8c), and, for a vehicle simulated with the data identified, the consistence of its position with the real vehicle was found (
Figure 8f).
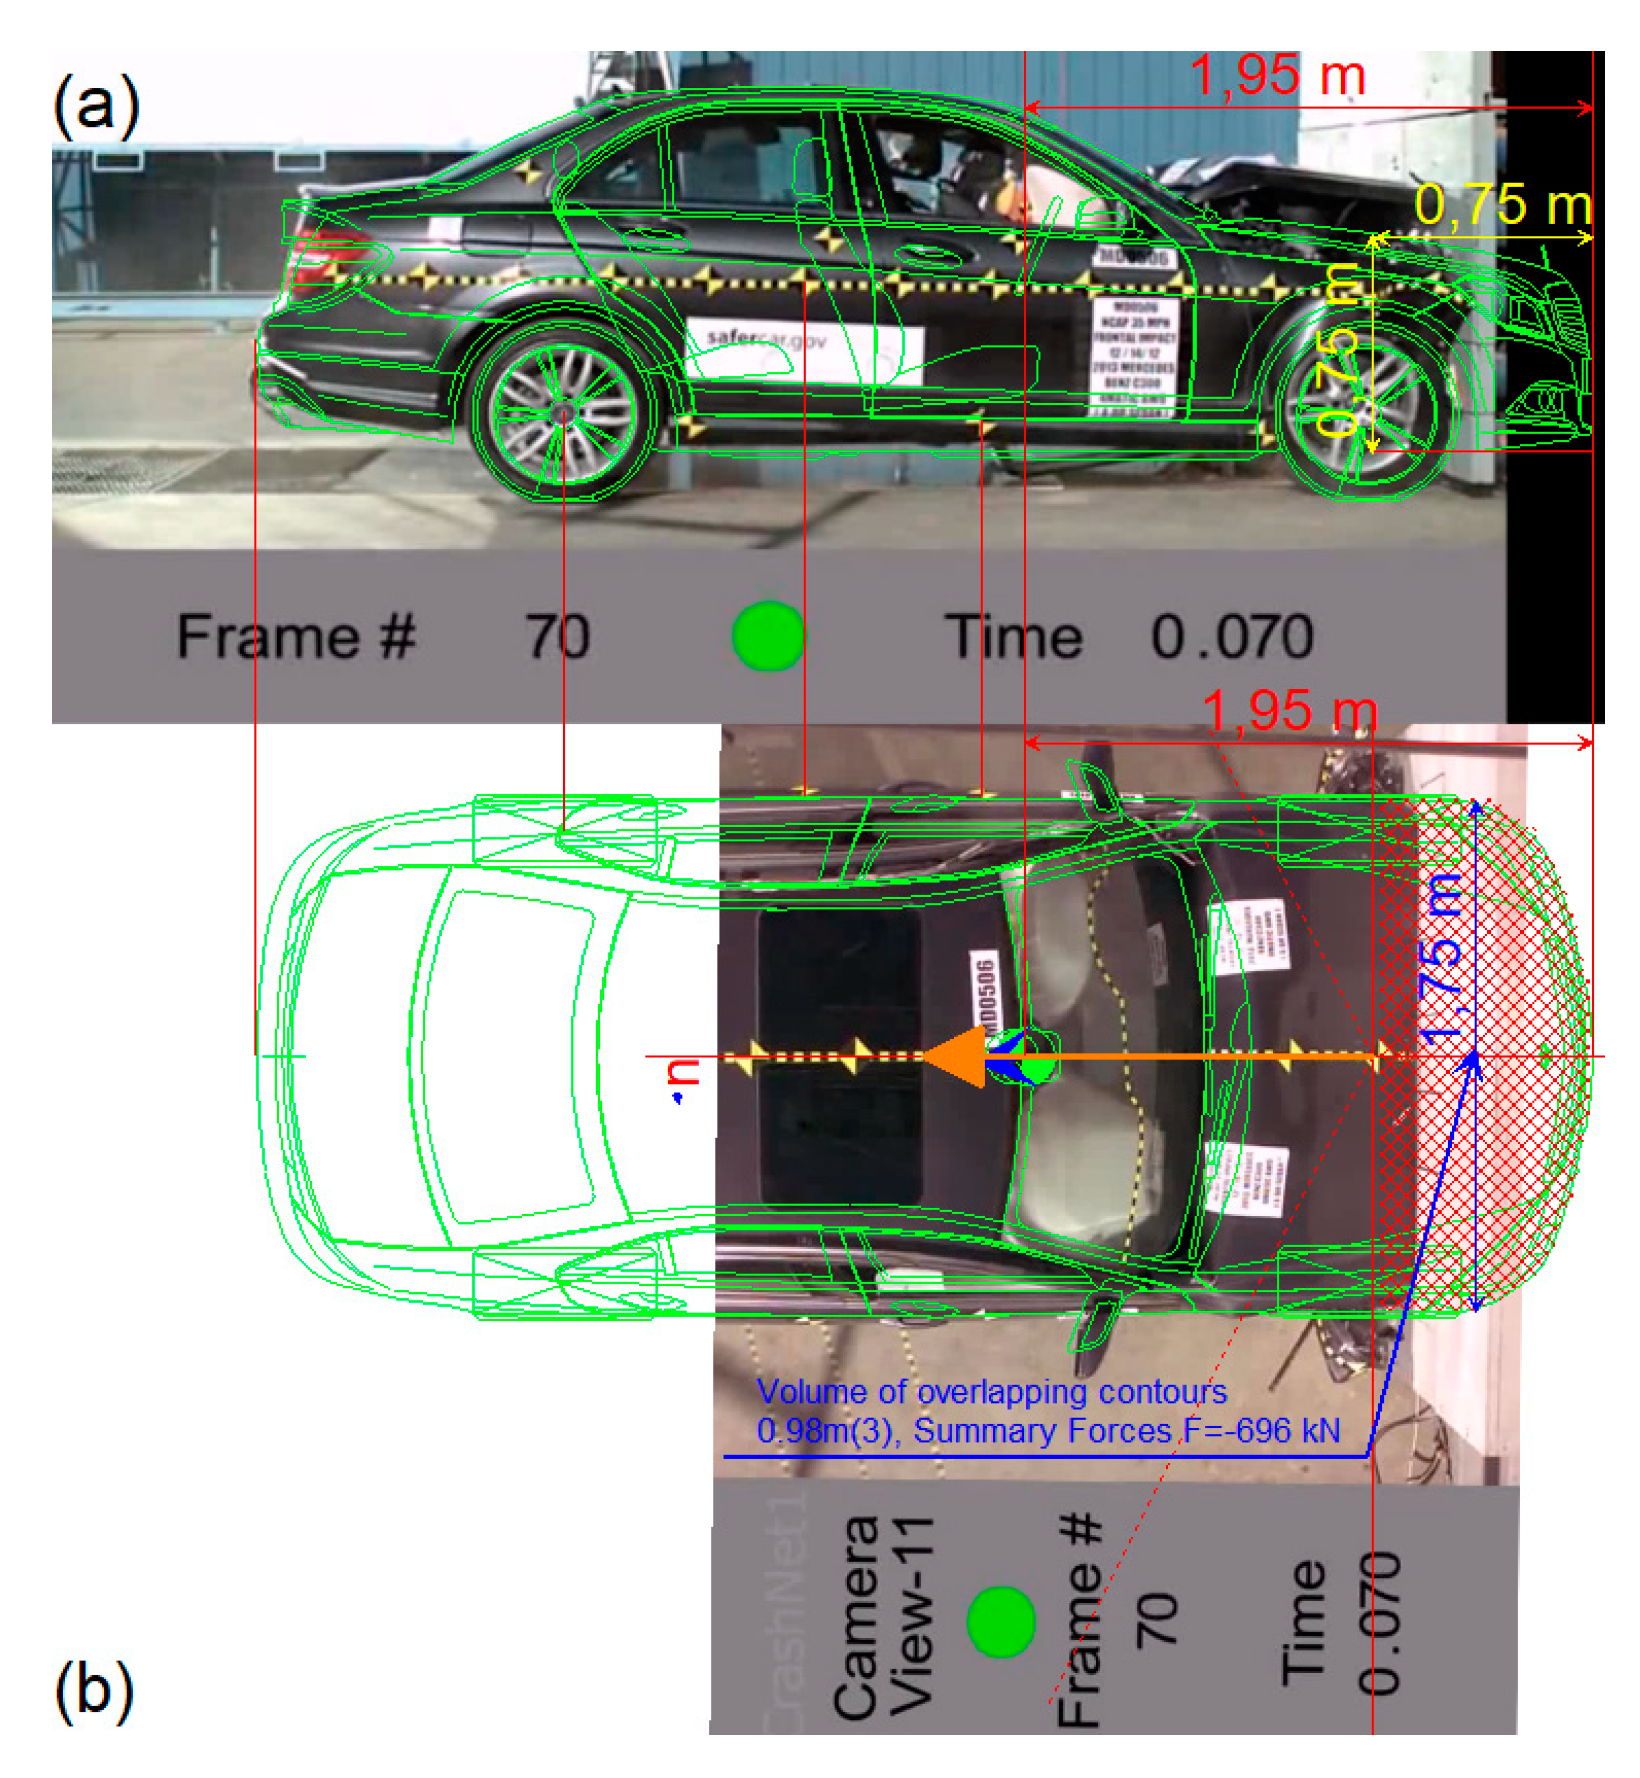
It was also observed that during the impact, elements of different stiffness undergo deformation which affects the compression and restitution phases. The scaled images of the vehicle undercarriage were used to analyze the deformation of those elements (
Figure 9a–f).
Initially, in the compression phase in time
t = 25 ms, while the bumper lining and its cross beam are being deformed, interferences in the impact reconstruction simulation for default parameters are acceptable in comparison with the ones received for the data identified, as shown in
Figure 9a,d. The impact consistence for accident reconstruction using the program lasted until time
t = 50 ms, when the engine support frame and the engine had not been crushed yet. Further, in time
t = 61 ms, it can be observed that the wheel suspension, engine supporting frame, and engine are crushed; however, the deformations do not increase any more, as shown in
Figure 9b,e). The vehicle body stiffening occurred during the impact. The phenomenon is discussed in other studies [
21,
22], which shows the effect of the engine chamber elements (engine, drive block) on the stiffness and deformation of the vehicle body and discusses the simplifications accepted in linear characteristics of the body deformations during the impact.
The vehicle body zones show a different stiffness, which additionally changes during the impact due contact with those elements, susceptible to deformation, with a barrier. When, after deformation of the bumper lining, the rigid barrier hit the engine supporting frame, the stiffness of the vehicle body increased, which was not precisely reconstructed by the V-SIM program for default parameters. Therefore, in order to reconstruct the collision, it was necessary to identify the crash test parameters and to enter them for simulation. The increase in stiffness in the compression phase facilitated reducing the error in simulation reconstruction for the compression phase. A change in the restitution coefficient and the body stiffness increase in the restitution phase were due to the program-modeled stiffness increase by a crushed engine with its support frame. However, having entered the task to block the wheels, their braking was reconstructed, which made the vehicle pull back after the impact. A change in the plane of contact force
Δy’ was also entered to ensure a better overlap of the simulated vehicle for crash test images. To show the differences in the course of the impact simulation for other V-SIM default data and identify them following the above methods, a crash test was used to develop a video [
23].
The research method presented also facilitates determining the value of the coefficient of unitary body stiffness
k following the formula below [
24]. In that approach, the measure of the body deformation is assumed to be its width, depth, and height. For the case considered, the parameters of the body deformation are presented in
Figure 10a,b, whereas, obtained with those parameters, the value of unitary stiffness coefficient k is 564 243 N/m∙m
2.
where:
—gross vehicle mass,
—velocity of the impact into the barrier, and
—width, height, and depth of the vehicle undercarriage deformation.
Table 1 shows default parameters proposed in the V-SIM program and changed according to the data identified from the Mercedes crash test.
The stiffness of the car body for compression phase was increased to decrease the depth of the penetration of the barrier into the car body. Right after the compression phase
t = 70 ms, the car impact speed is already low, so the coefficient of restitution decreased, and stiffness for the restitution phase increased. During the restitution phase, stiffness is high, and some energy is released. In V-SIM, the car body stiffness for the phase of compression and restitution is the same, which is a simplification in the impact model applied. Once the program default parameters were changed into the ones identified in time
t = 70 ms, the same depth deformation of the vehicle simulated in the top and side projections were also obtained, as compared with the actual car filmed (
Figure 10).
The analysis has also demonstrated that for time t = 35 ms the front wheels of the Mercedes were blocked, which can be clearly seen in the crash test recording, showing the vehicle from the left and the right side, which is caused by a progressing deformation of the vehicle front, and the V-SIM program does not reconstruct it for default data. The problem of uncertainty which occurs in car crash reconstruction, with models of the same physical phenomenon providing different results, is described in another study [
25,
26]. In Reference [
27], problems related to various types of car impacts and the impact of road surface condition on the reconstruction of object movement are discussed, while, in Reference [
28,
29], a discussion of problems of autonomous differential lock in a truck during movement in different terrain conditions is presented.
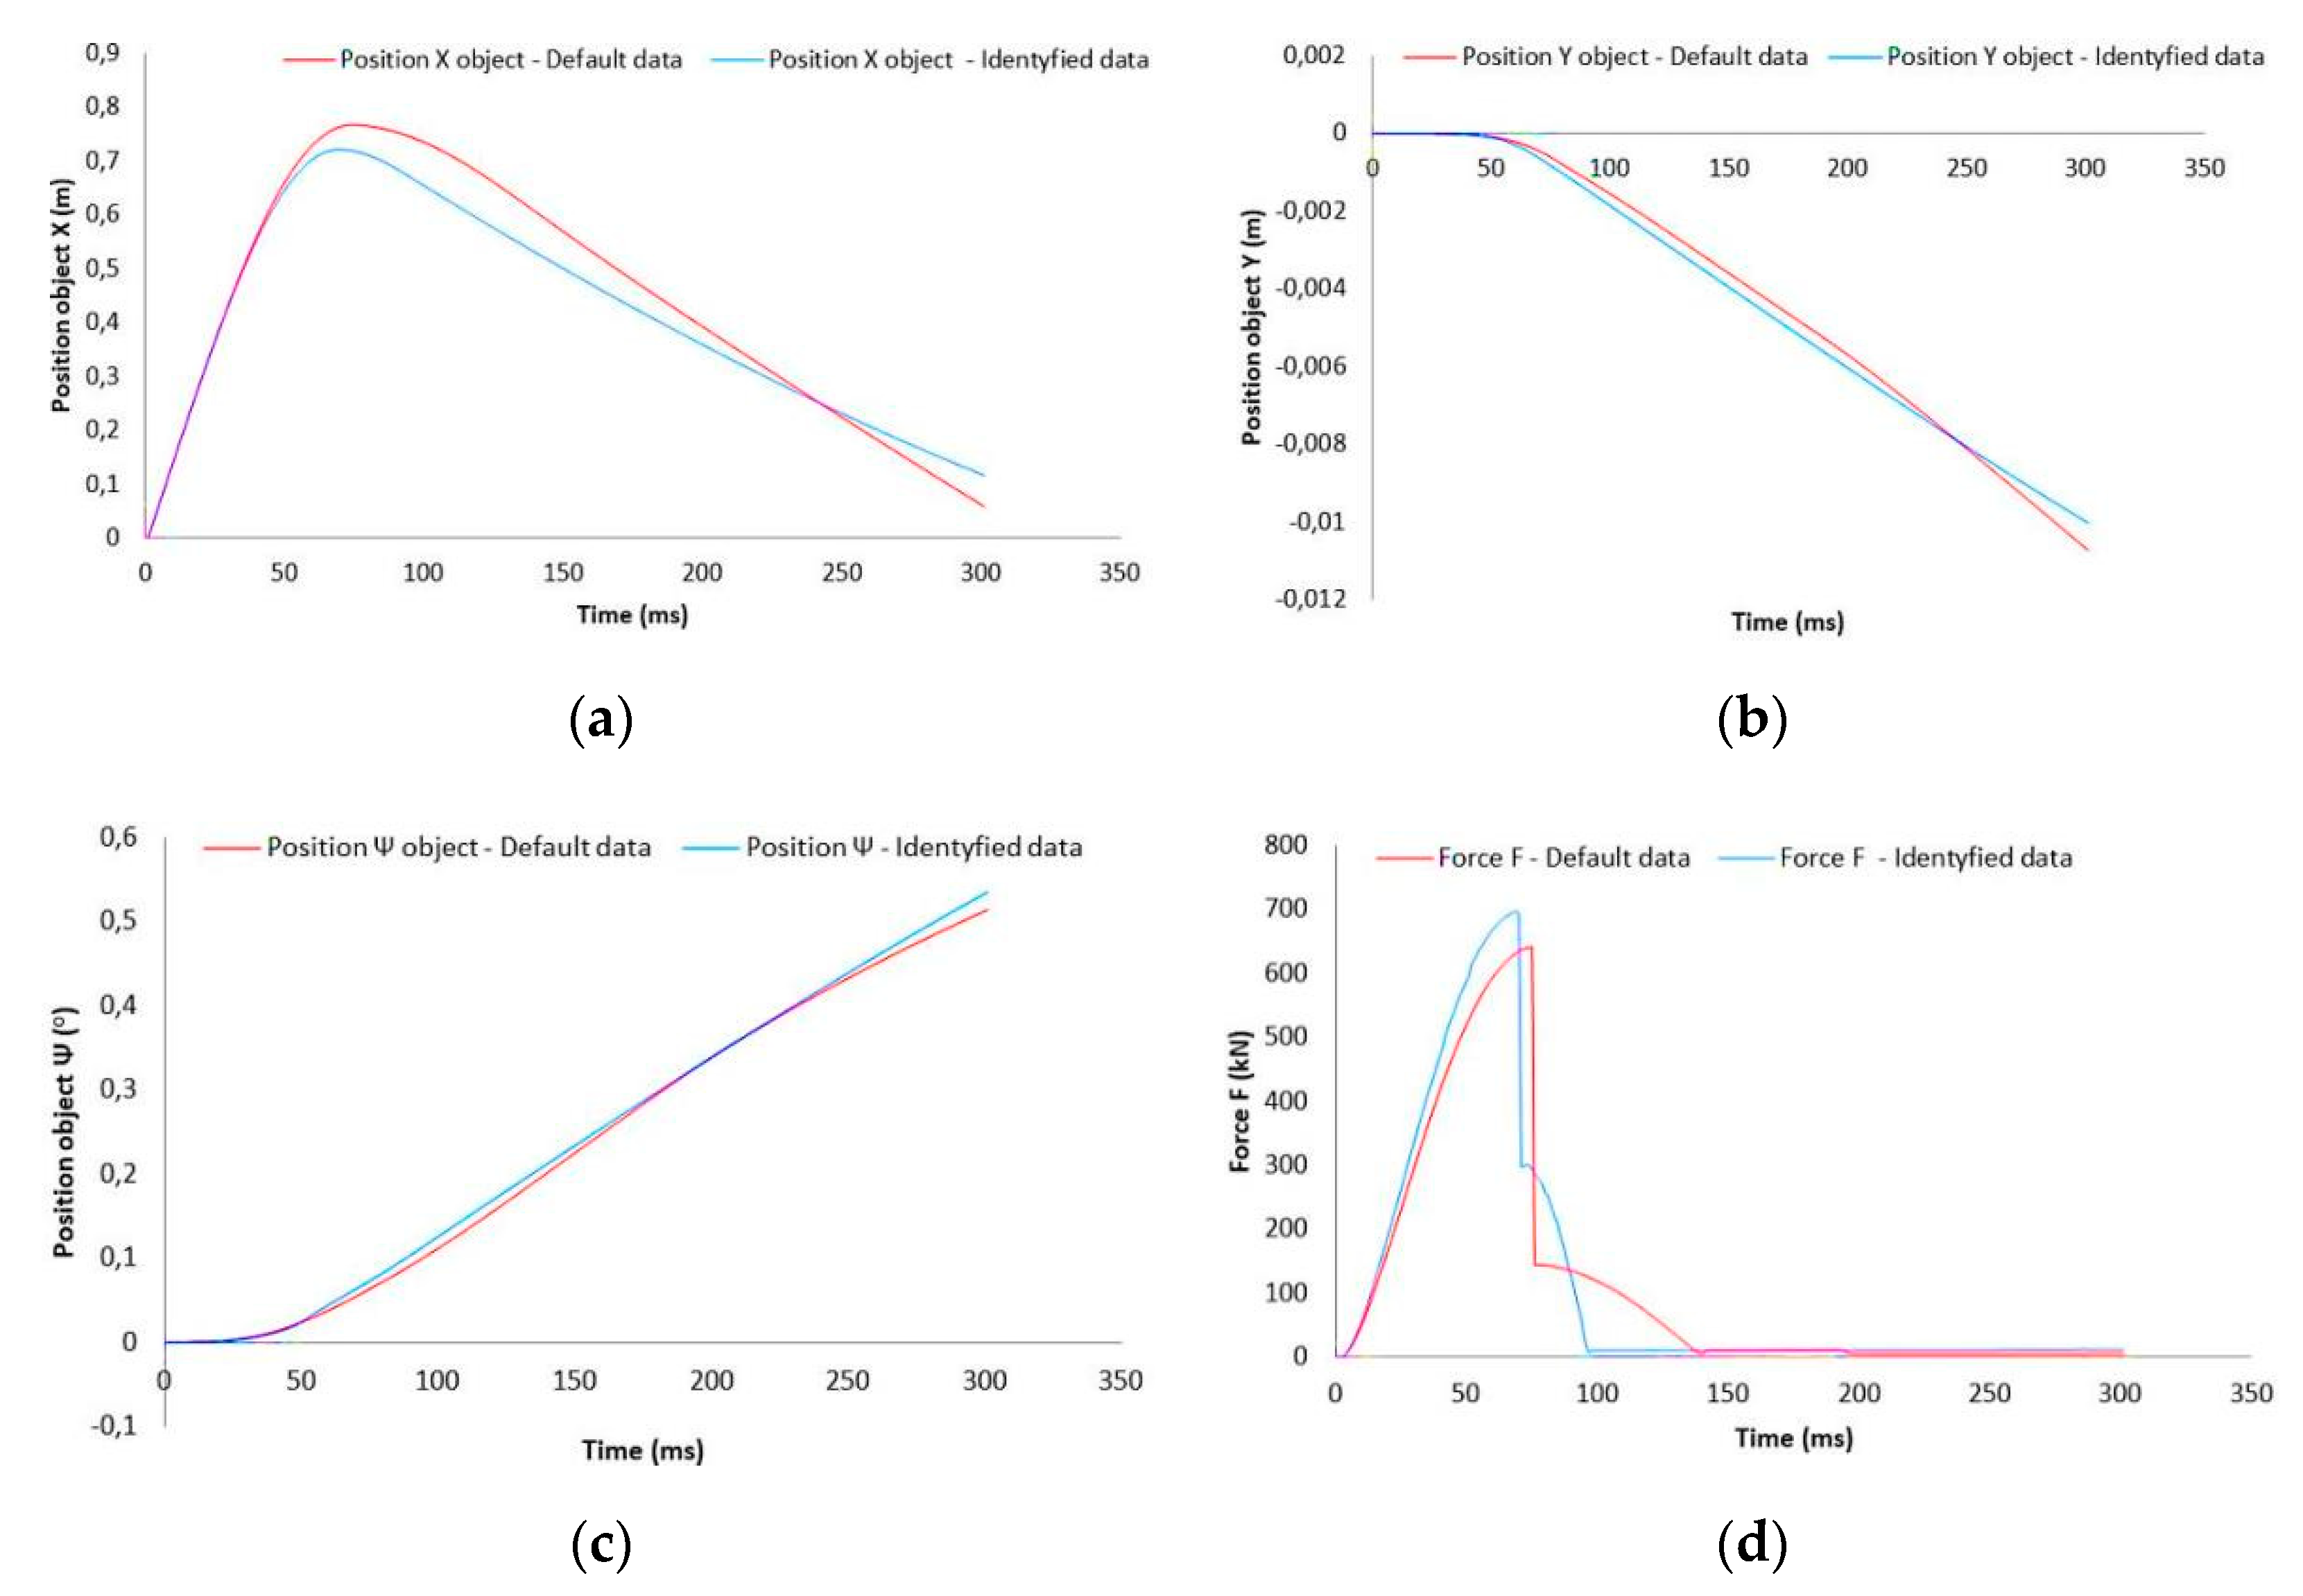
To illustrate the above differences, time histories of changes: longitudinal component X, transverse component Y, yaw angle Ψ, and impact force F (
Figure 11a–d) are presented, as well. In the simulation for default data, the maximum displacement of the vehicle body along X axle occurred in time
t = 72 ms and was X = 0.767 m, whereas, for identified data, it was lower, X = 0.721 m and occurred earlier, in time
t = 67 ms (
Figure 11a). The differences in the position of simulated vehicles along Y axle were consistent with time t = 34 ms, after which the differences occurred (
Figure 11b).
The vehicle simulated for default data rotated faster than indicated in the crash test; hence, a correction of the plane of contact force Δy’, which is also reflected in the time histories of yaw angle Ψ (
Figure 11c).
In the compression phase, impact force F (
Figure 11d) in the simulation for the data identified reaches the maximal value 696.86 kN in time t = 68 ms, next—298.62 kN, in time
t = 71 ms, and further drops down to zero. In turn, for the program default data, impact force F reaches, in the compression phase, a lower value 640.88 kN, and the maximum follows in time
t = 74 ms, then—144.39 kN in time
t = 75 ms, and decreases down to zero. The differences result from those phenomena related to an increase in the body stiffness while the engine and the engine supporting frame are being crushed.
4. Conclusions
The impact parameters identification method proposed involves the performance of the procedures: a test selection, a division of the film into single frames, the measurements and photograph scaling, the selection of the reference base for the overlap analysis for the test vehicle and the simulated vehicle, the top and bottom views, and a change in the impact parameters (stiffness in the compression and restitution phase, the coefficient of restitution, a change in the plane of contact force, and wheel blocking) for the best image matching. Having received the image overlap from the recorded test and vector styling of the simulated vehicle in time t of the collision, the impact parameters identified must be entered into the simulation of the incident reconstructed. The approach in that convention increases the possibilities of the impact reconstruction by the road accident experts and developing expertise for courts with no access to test impact forces data.
Further studies should, therefore, be performed towards the development of the crash models in MBS programs to facilitate considering a varied stiffness of the body zones in its 3D space connected with the vehicle body structure and its internal elements and not, as it has been the case so far, of the vehicle body, its solid with the average stiffness. A solution to this problem would provide an alternative to time-consuming modeling in the FEM convention.
The study shows that the parameters used for simulations in practice should be selected based on the actual accidents which have been filmed and on crash tests. The study results have demonstrated that, for the V-SIM default parameters, an accurate reconstruction of the course of the impact was not possible due to:
a simplified model of the contact of the vehicle with a rigid barrier and the need to introduce a change in the contact force application point;
the program not modeling the elements installed inside the vehicle, resulting in the stiffness changes during impact;
inaccurate values of default parameters for a head-on collision with a rigid barrier; and
not identifying the car body explorer deformations causing wheel blocking and the need for the operator to enter that task manually.
The expert witnesses applying programs for expertise development should consider the above modeling simplifications not to assume an inadequate simulation result as it has a negative effect for insurance companies and court decisions.
The study results also demonstrate that the vehicle impact model in V-SIM should be further developed to:
apply the models which consider different stiffness of the car body particular zones or which divide the car body into separate blocks of different stiffness;
apply automatic identification of wheel blocking in the function of the body depth deformations;
introduce a possibility of 2D impact course visualization in the car side view and not, as it has been so far, the top view; and
a substantial 3D collision course visualization enhancement.
To recapitulate, this research developed a methodology of identifying the crash parameters to be applied for various vehicles and various crash velocities, as well as various kinds of barriers and crashes. Thus, it is possible to provide the adequate, compliant with the real-life course of the crash, result of the simulation using the MBS programs, although, they currently use more simple models of the detection of collision and crash, as compared with the FEM programs. However, by offering a much shorter time of calculations and a high number of numerical vehicle models in their databases, they provide an interesting and developmental alternative for the FEM programs. The research performed also facilitated determining a further development of models in the MBS programs which should focus on developing the crash models to consider a varied stiffness of the body zones in its 3D space. Next to the development of the aspects of crash modeling presented in the article, the effects for practical applications have also been provided for the experts performing vehicle crash simulations, as well as the guidelines for optimizing the functionality and the calculations precision of the V-SIM program, in the future to be used by designers when working on the successive versions of that IT tool.


