1. Introduction
Flexible devices are part of the next generation of mobile technology and include foldable displays, wearable devices, and implant sensors. Their core component is a flexible printed circuit board (FPCB). To popularize flexible devices, FPCBs must be inexpensively and efficiently produced. However, conventional circuit board production methods (e.g., lithography and etching processes) cannot meet these requirements. Since the roll-to-roll process is suitable for the low-cost mass production of flexible substrates, researchers have attempted to develop the process for manufacturing flexible devices.
In the roll-to-roll process, electronic circuit patterns are printed onto flexible substrates which are transferred between unwinding and rewinding rollers. These flexible substrates are composed of a polymer film, which is called a “web”. In the actual process, the two unwinding and rewinding rollers, along with many additional rollers, generate the electronic circuit patterns. The electronic circuit patterns are printed on the web, inspected, and packaged. The space between any two rollers in the process is called the “span”. The direction along the transfer is “machine direction (MD)”. The direction perpendicular to MD is “cross direction (CD)”.
If the web has an uneven strain distribution in the span between these rollers, defects may form. In a given span, the two rollers at both ends exert tension on the web, generating a strain distribution in the web. To construct the electronic circuit pattern, multilayer printing is performed with several spans. A register error is a relative positional error between the patterns of the previous and next spans. A register error occurs if the strain generated on the web in each span is uneven. Further, an uneven strain can cause pattern errors because there is a contraction difference between the two patterns in the center. Therefore, this non-uniform strain distribution causes a register error in the machine direction (MD) and cross direction (CD) of the web [
1]. If the strain deviation in the MD is reduced and the distribution becomes more uniform, this error is reduced.
Existing processes using rollers include rolling processes for metalworking and the rotary press printing process. In the rolling process, metal materials are reshaped to obtain a product. Thus, researchers have focused on plastic rather than elastic deformation [
2,
3]. In the rotary printing process, characters or images are printed on a paper substrate. Researchers have attempted to minimize the register error to improve print quality; however, micro-scale printing precision is not required [
4,
5,
6].
The electronic circuit pattern created in the roll-to-roll process is finely detailed; therefore, micro-scale printing precision is important for multilayer printing. A register error due to a shape error or misalignment of the pattern creates defects in the electronic circuit. Thus, a great deal of research has focused on reducing register errors in order to manufacture high-performance electronic components. Hu, L. et al. measured the register error using a high-resolution microscope camera and studied motion-base calibration using the micro-movement of the print head [
7]. Jung, H. et al. conducted and compensated for the register error by controlling the span length and tension using an active motion-based roller between the upstream and downstream printing rollers [
8]. Kang, H. et al. compensated for the register error using the phase shift of the upstream roller and continuously compensating the register error of the downstream roller through PID control [
9]. Chang, J. et al. reduced the register error by locally releasing tension on the web locally through a successive chucking system, clamping unit, and guide roller descending [
10]. Kim, C. et al. reduced the strain on the web by controlling the tension using a dancer roller to reduce the web shrinkage that occurs during the drying process [
11]. Lee, J. et al. used a register control algorithm to reduce the tension error [
12]. Kim, S. et al. analyzed the deformation of the substrate in the ink transfer process using computational fluid dynamics (CFD) [
13]. However, there are few studies that proactively correct the uneven strain distribution during the roller design stage prior to using a separate actuator or controlling the system. In the roll-to-roll process, the electronic circuit is printed on an arbitrary printing line in the CD. Therefore, the non-uniformity of the strain in the printing line is more important than the absolute value of the strain in the web. The strain is concentrated in the center of the CD and decreases toward both sides [
14]. In addition, the strain deviation in the web is proportional to the web width and inversely proportional to the distance in the MD from the line where the roller and web touch. To reduce the register error, the strain deviation must not exceed a certain level within a single span; if the strain variation is great, the effective printing area is reduced, which limits productivity. In addition, the strain generated by tension during the process is recovered when the tension is disengaged after the process. This elastic change can also result in pattern error. If the strain distribution is uneven, the pattern is misaligned, resulting in an MD register error and poor print quality.
In this study, we investigated the strain distribution in the flexible web in the roll-to-roll process. We sought to equalize the strain distribution in the MD on the printing line in the CD. To maintain high print quality and productivity, we proposed a new roller design that compensates the non-uniformity of the strain. Moreover, we developed a finite element (FE) model of a single-span roller and web and evaluated the compensation performance of the roller. To maximize the compensation, we optimized the design parameters of the roller using the design of experiments (DOE) methodology and analysis of variance (ANOVA).
To minimize the strain deviation in the MD, we constructed the compensation roller with a convex roller core. The convex core was wrapped in a flexible material (rubber skin) such that the roller and web were always in contact. The outer diameter of the roller with the core and rubber is uniform. This roller configuration changes the contact stiffness along the CD on the web when the rollers and the web touch to compensate for the strain deviation.
To optimize the compensation performance, we varied the thickness gradient of the rubber skin surrounding the roller, the total diameter of the roller, and the material properties of the rubber skin. The thickness gradient is the thinnest minus the thickest diameters of the core. Additionally, we considered interactions between the design parameters. From this analysis, we found that the strain of the web was most uniform in the roller with a barrel-type core with a thickness gradient of approximately 8 mm. This roller compensated the uneven strain distribution by approximately 48% with respect to the conventional roller.
2. Strain of Web in Roll-to-Roll Process
The finite element analysis was used to analyze the strain distribution of the web in the roll-to-roll process. Through this analysis, it was confirmed that the MD strain deviation exists under uniform tension conditions. Additionally, the MD strain deviation with respect to the web width and the location of the printing line was analyzed. A series of experiments were conducted to verify the FEA results, and the MD strain deviation similar to the FEA results was measured. Therefore, we used the FE model to compensate the MD strain deviation.
2.1. Strain Analysis Model of Web
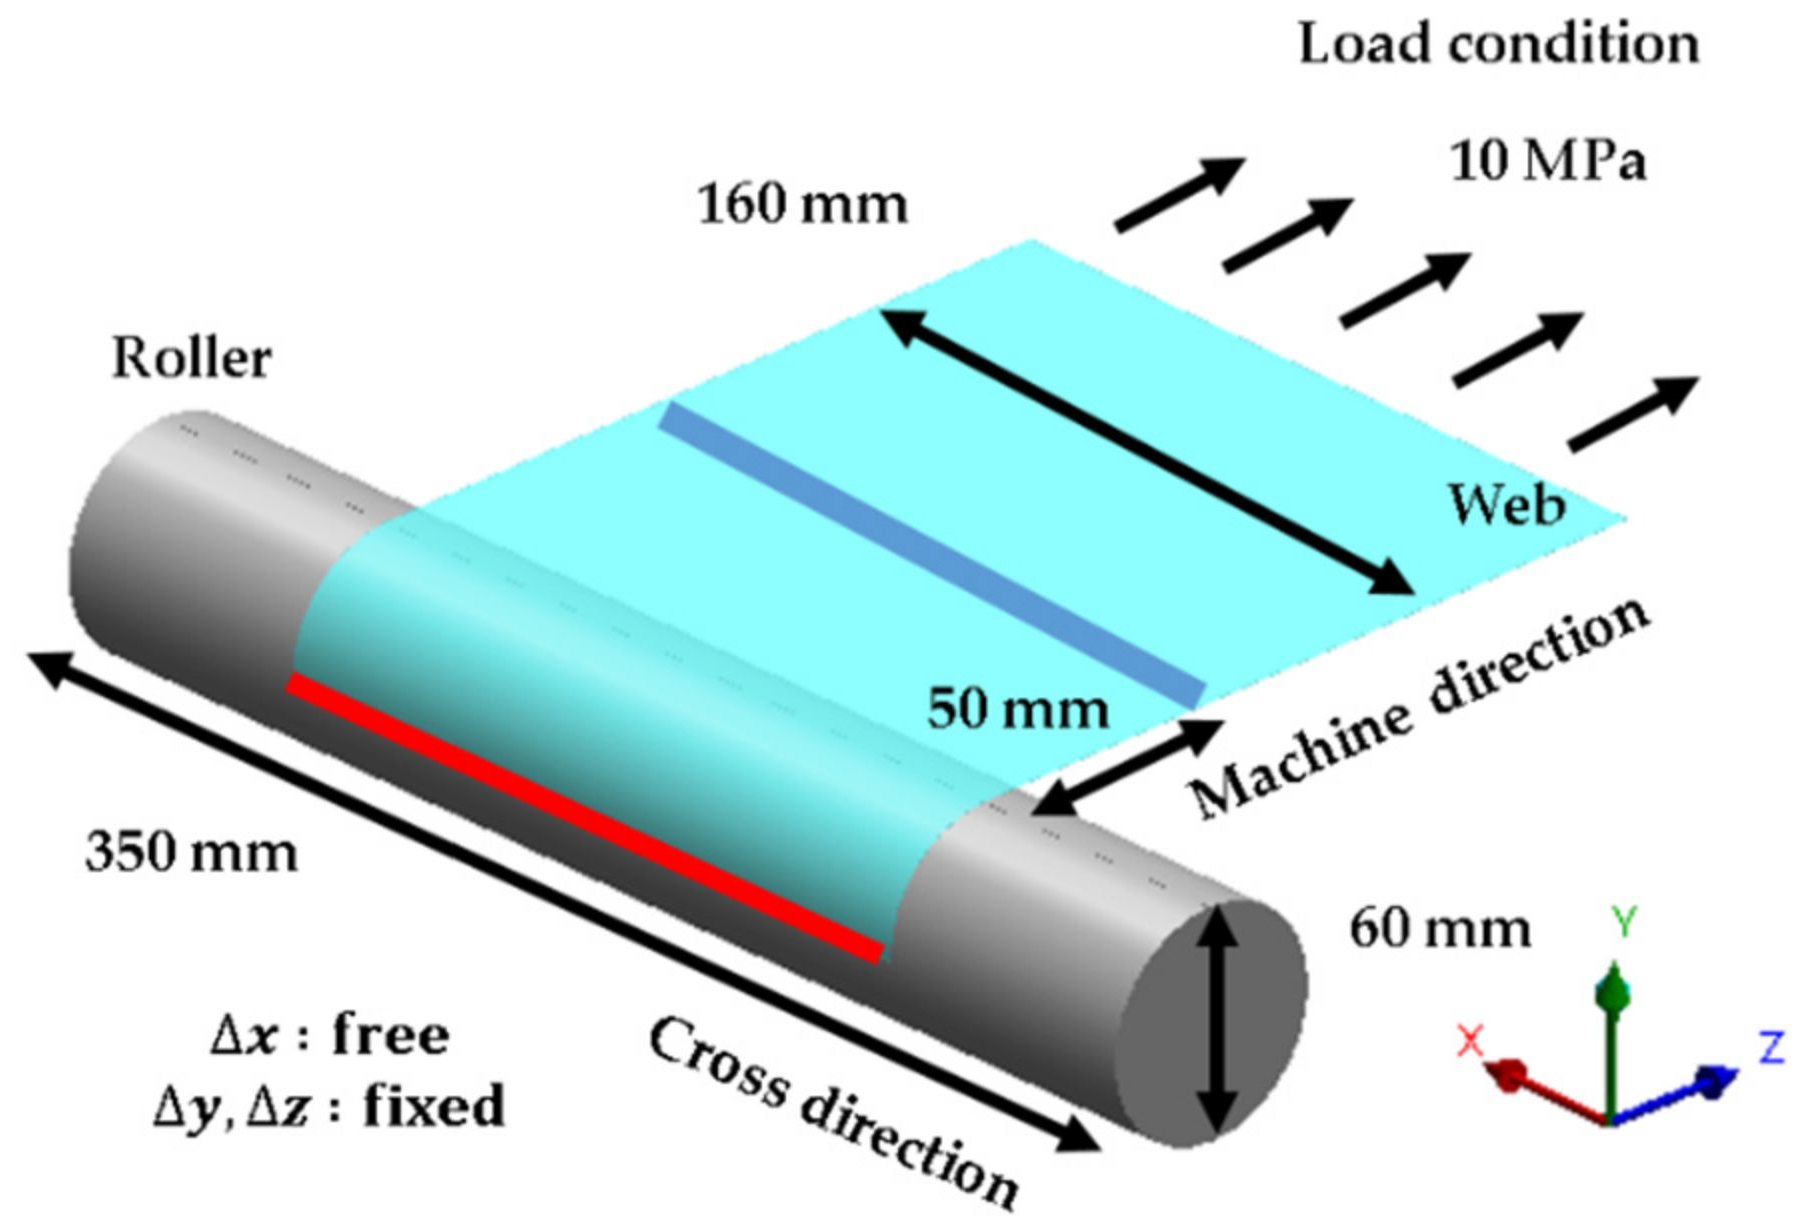
ANSYS Workbench R18.0 was used to conduct an FE analysis on the web strain caused by tension for a conventional roller in the roll-to-roll process. To analyze the strain of the web when tension is applied to a single span, the FE model consisted of a roller and a web. A schematic of the FE model is shown in
Figure 1. The diameter and length of the roller were 60 and 350 mm, respectively, and the roller was composed of aluminum. The web was composed of a polyethylene terephthalate (PET) film with a width of 160 mm, a span length of 200 mm, and a thickness of 0.2 mm. The mechanical properties used in the analysis are shown in
Table 1. PET films are viscoelastic materials; however, we considered them to be linear elastic materials because of the low strain in this case study. The element size of the web is 5 mm and the web was modeled as a uniform hexahedron mesh; the number of elements was 3324 and the number of nodes was 19,289. The element size and shape were predetermined after checking the FE model’s convergency. In addition, boundary conditions such as the load, degrees of freedom, and friction conditions were set in the FE model. The tension (10 MPa) was applied at the load end along the transport direction of the web. At the fixed end of the web, which touched the roller, all degrees of freedom except the width direction of the web were constrained. The degree of freedom in the width direction of the web allowed for deformation due to Poisson’s ratio. Moreover, the contact between the web and roller resulted in friction with a friction coefficient of 0.2.
In the actual process, the transfer of the web is a dynamic process. In this study, however, we modeled the process with a constant transfer speed and under static conditions for simplicity. If the strain deviation is compensated under static conditions, it will also be compensated in the dynamic state.
2.2. Web Strain FEA Results: Conventional Roller
We used the FE model to analyze the strain distribution along the position of printing line or across the width of the web under uniform tension conditions.
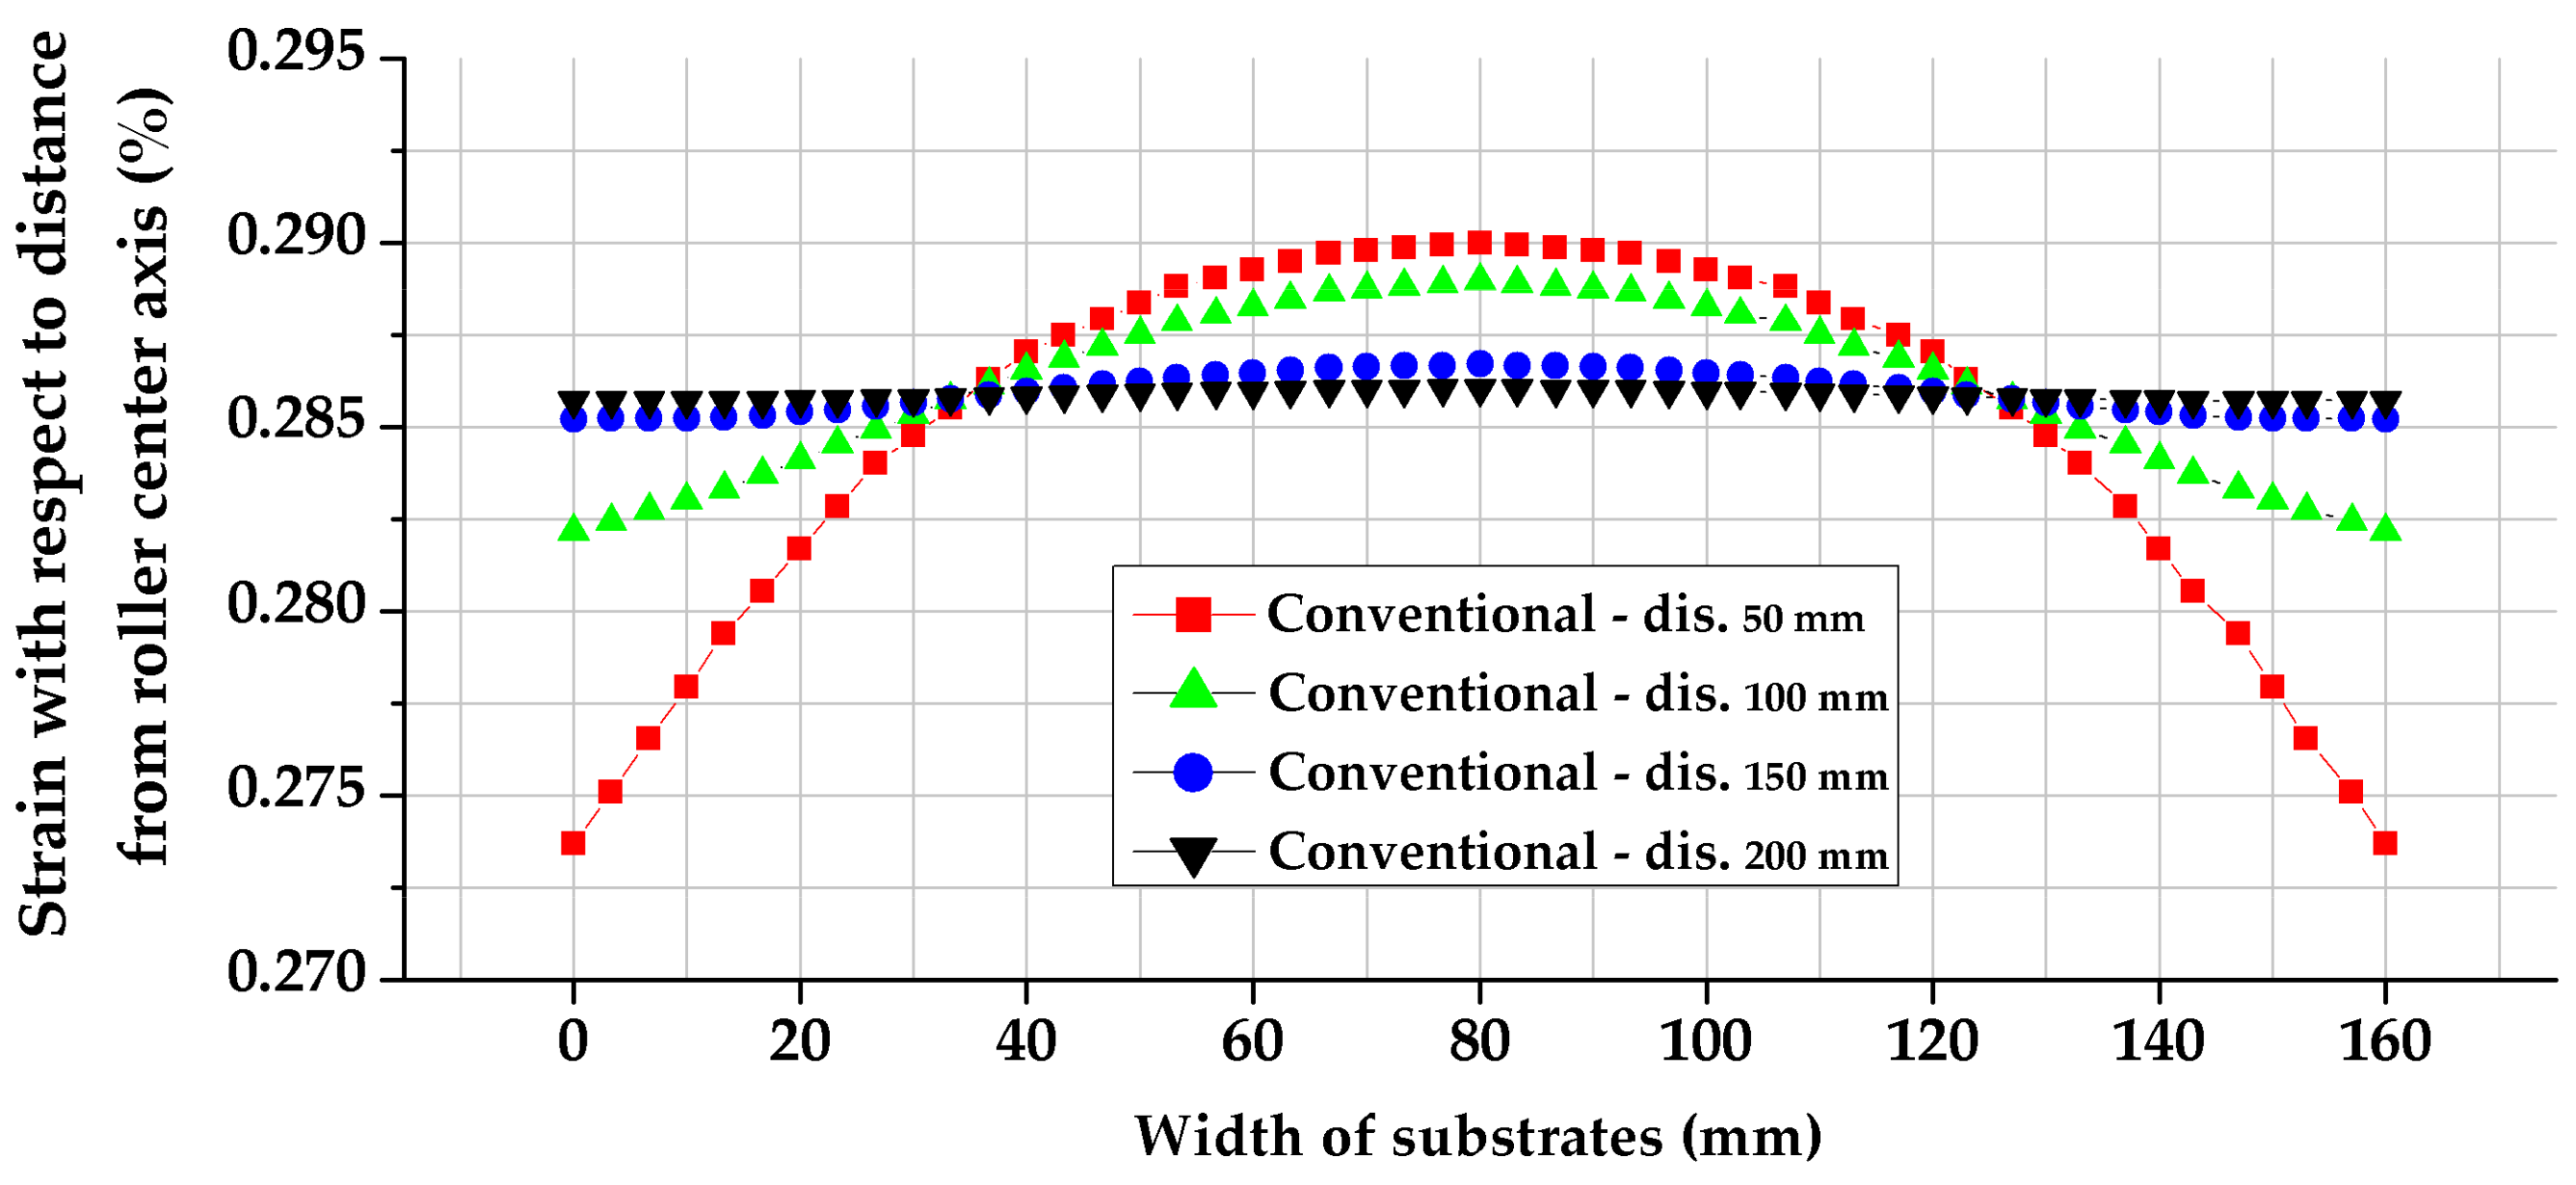
Figure 2 shows the relationship between the position along the printing line and strain deviation in the MD with respect to the distance from the contact line of the web (width of 160 mm) and roller when a tensile force of 10 MPa is applied to the web.
At a distance of 50 mm from the roller in the MD, the strain exhibited the most uneven distribution, while the most uniform strain was observed for a distance of 200 mm. The shorter the distance between the roller and the web in the MD, the greater the variation in strain distribution. Moreover,
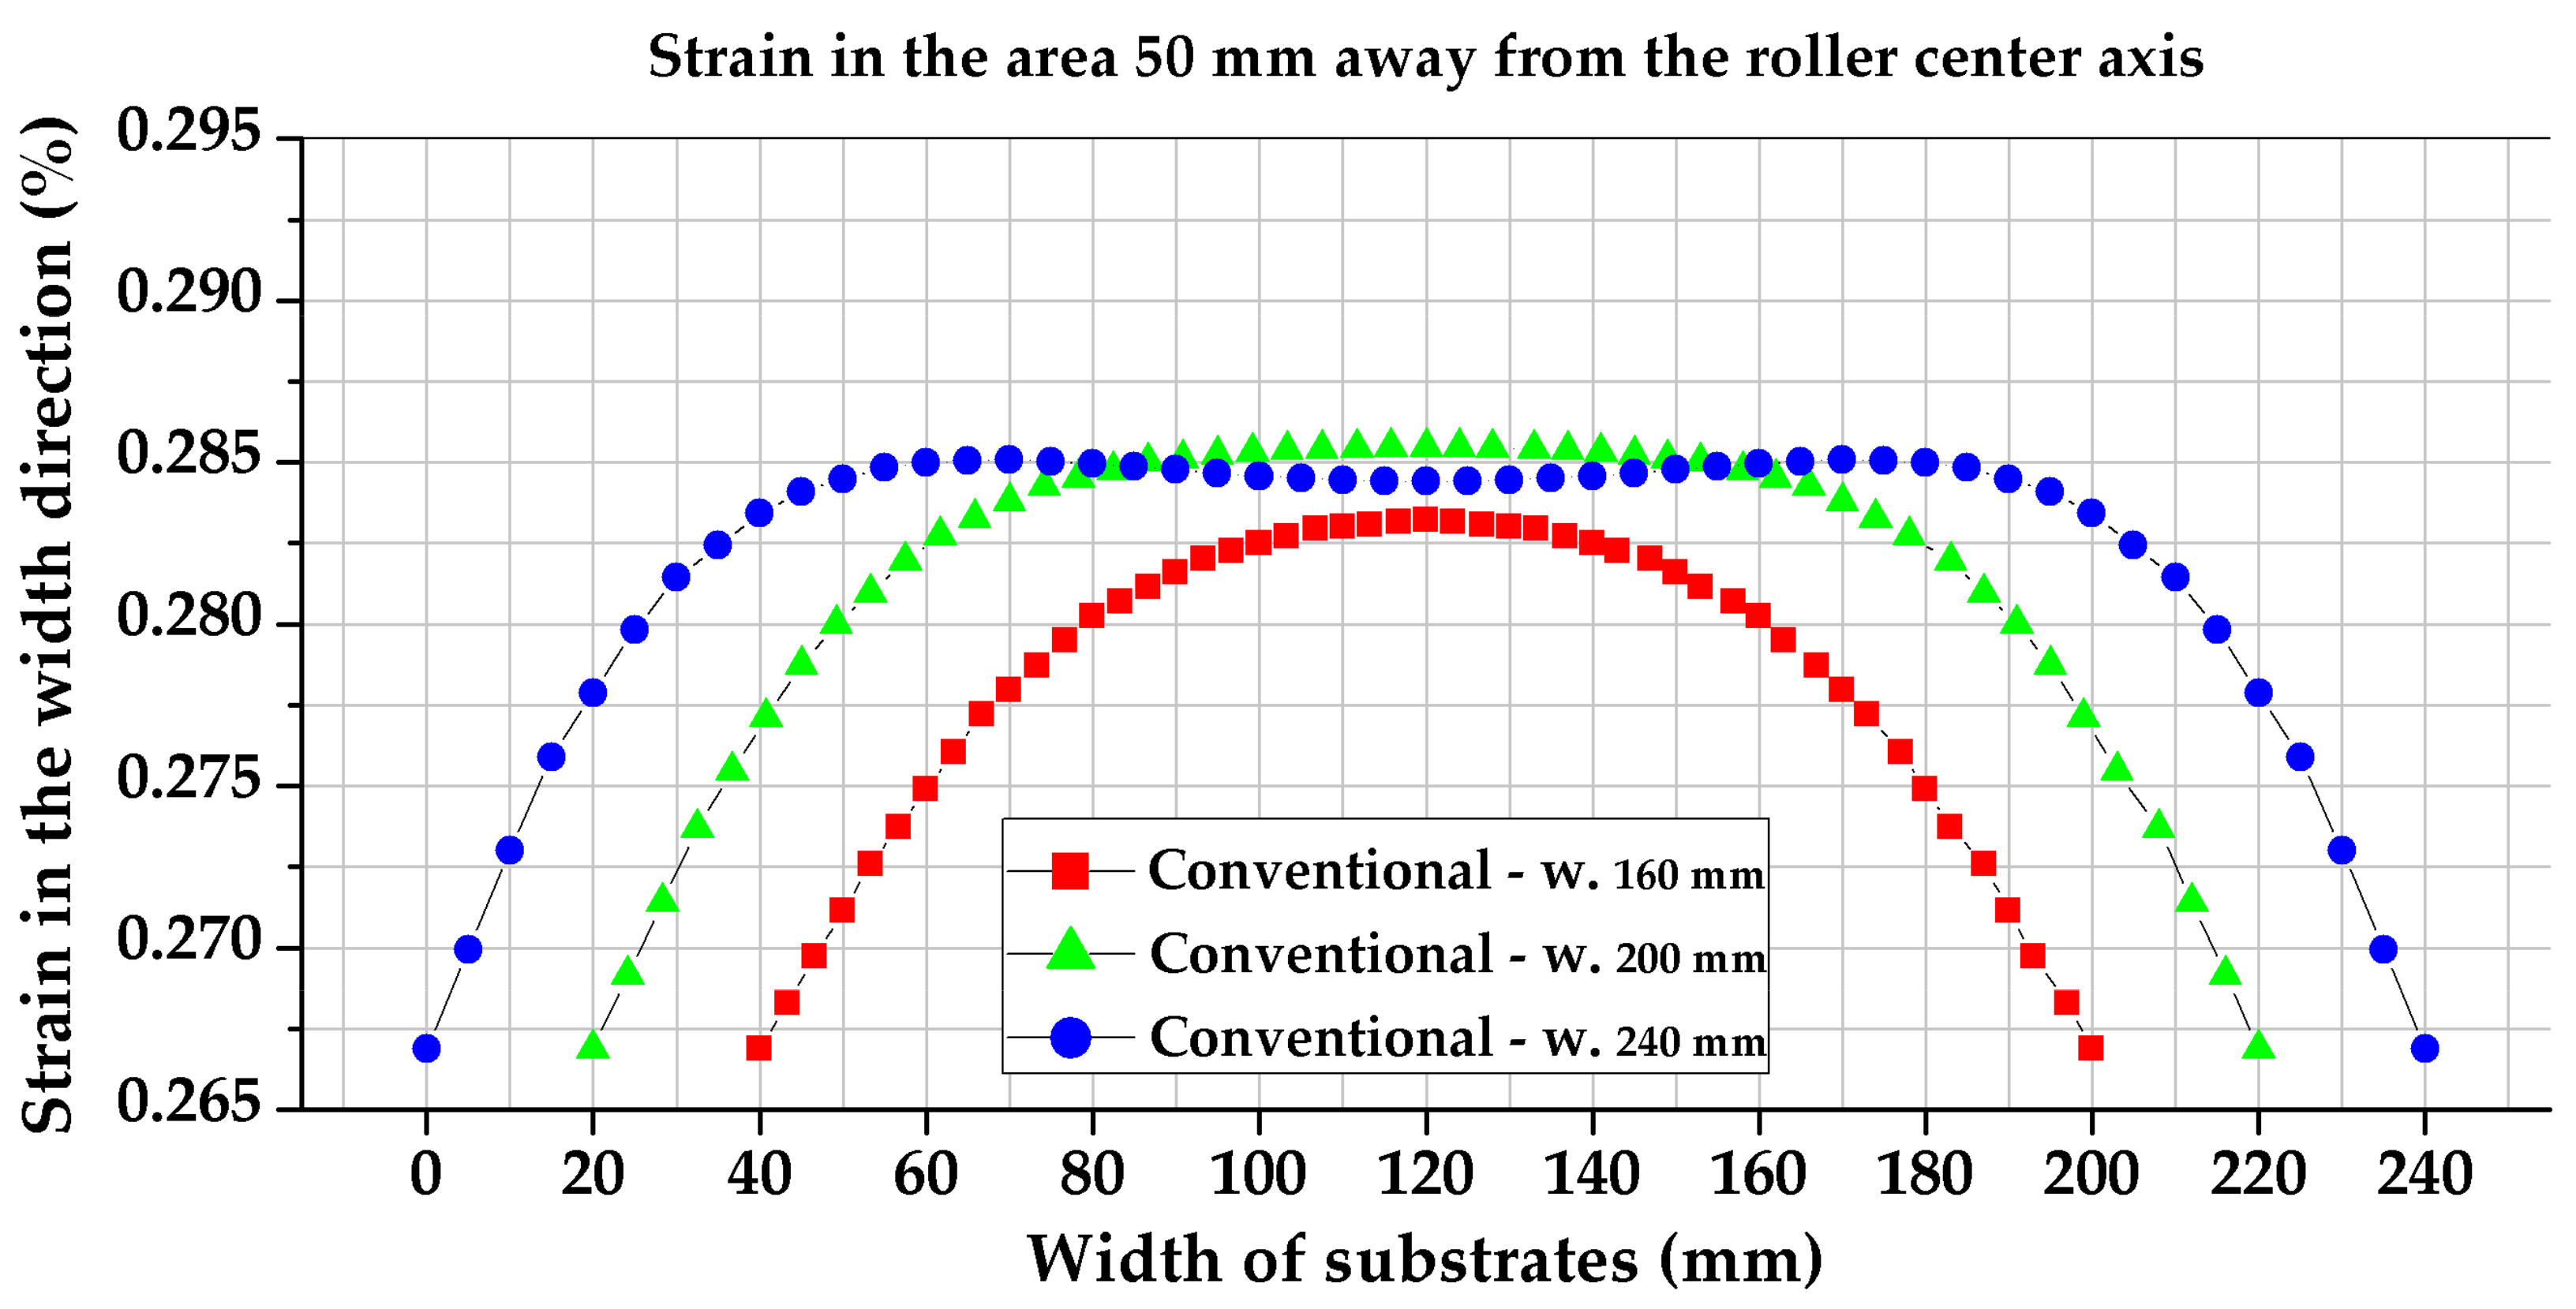
Figure 3 shows the deviation of the MD strain which occurs with changes in the web width for a distance 50 mm from the roller in the MD. When the film width was 160 mm, the strain deviation was minimal. The strain deviation increased as the web width increased. This strain deviation may cause a register error in the MD owing to the change in the tension in each span. In addition, when the tension is removed after the process, the elastic strain becomes zero and the positioning precision of the pattern is adversely affected. Therefore, we sought to design a roller to improve the precision of the printing pattern and to minimize the register error by compensating for the strain deviation in the MD.
2.3. Verification of FE Model for Analyzing Web Strain Deviation
Before using the FE model to design the roller, we verified the model.
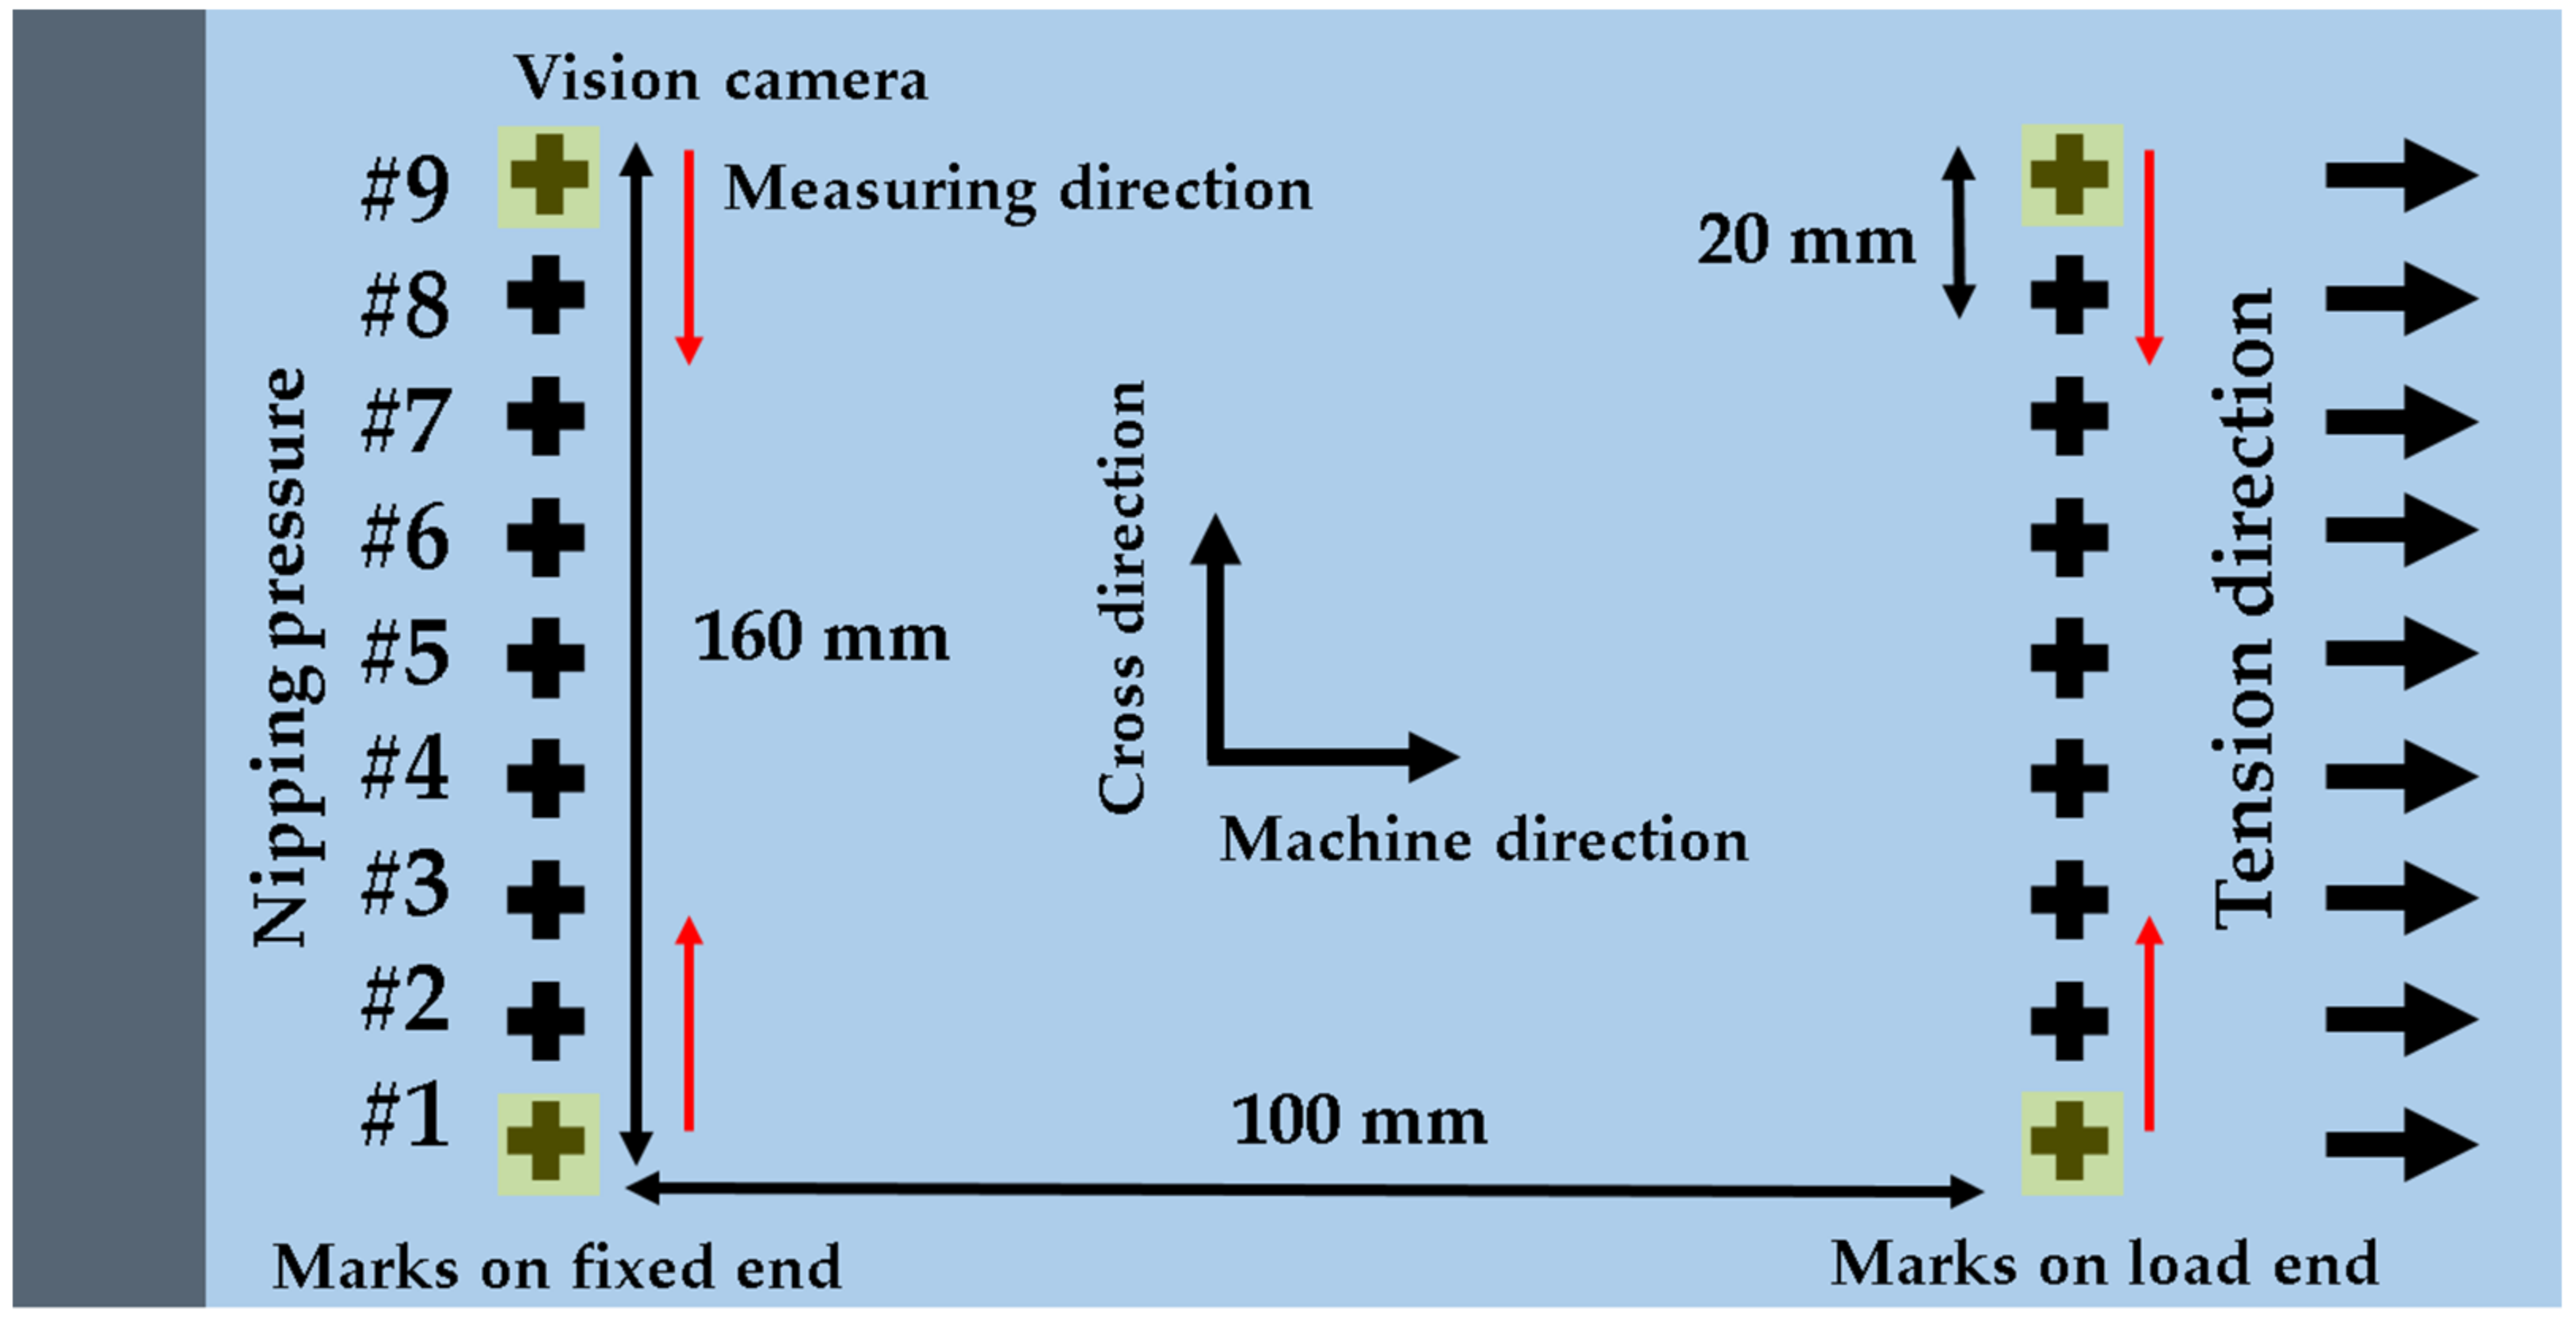
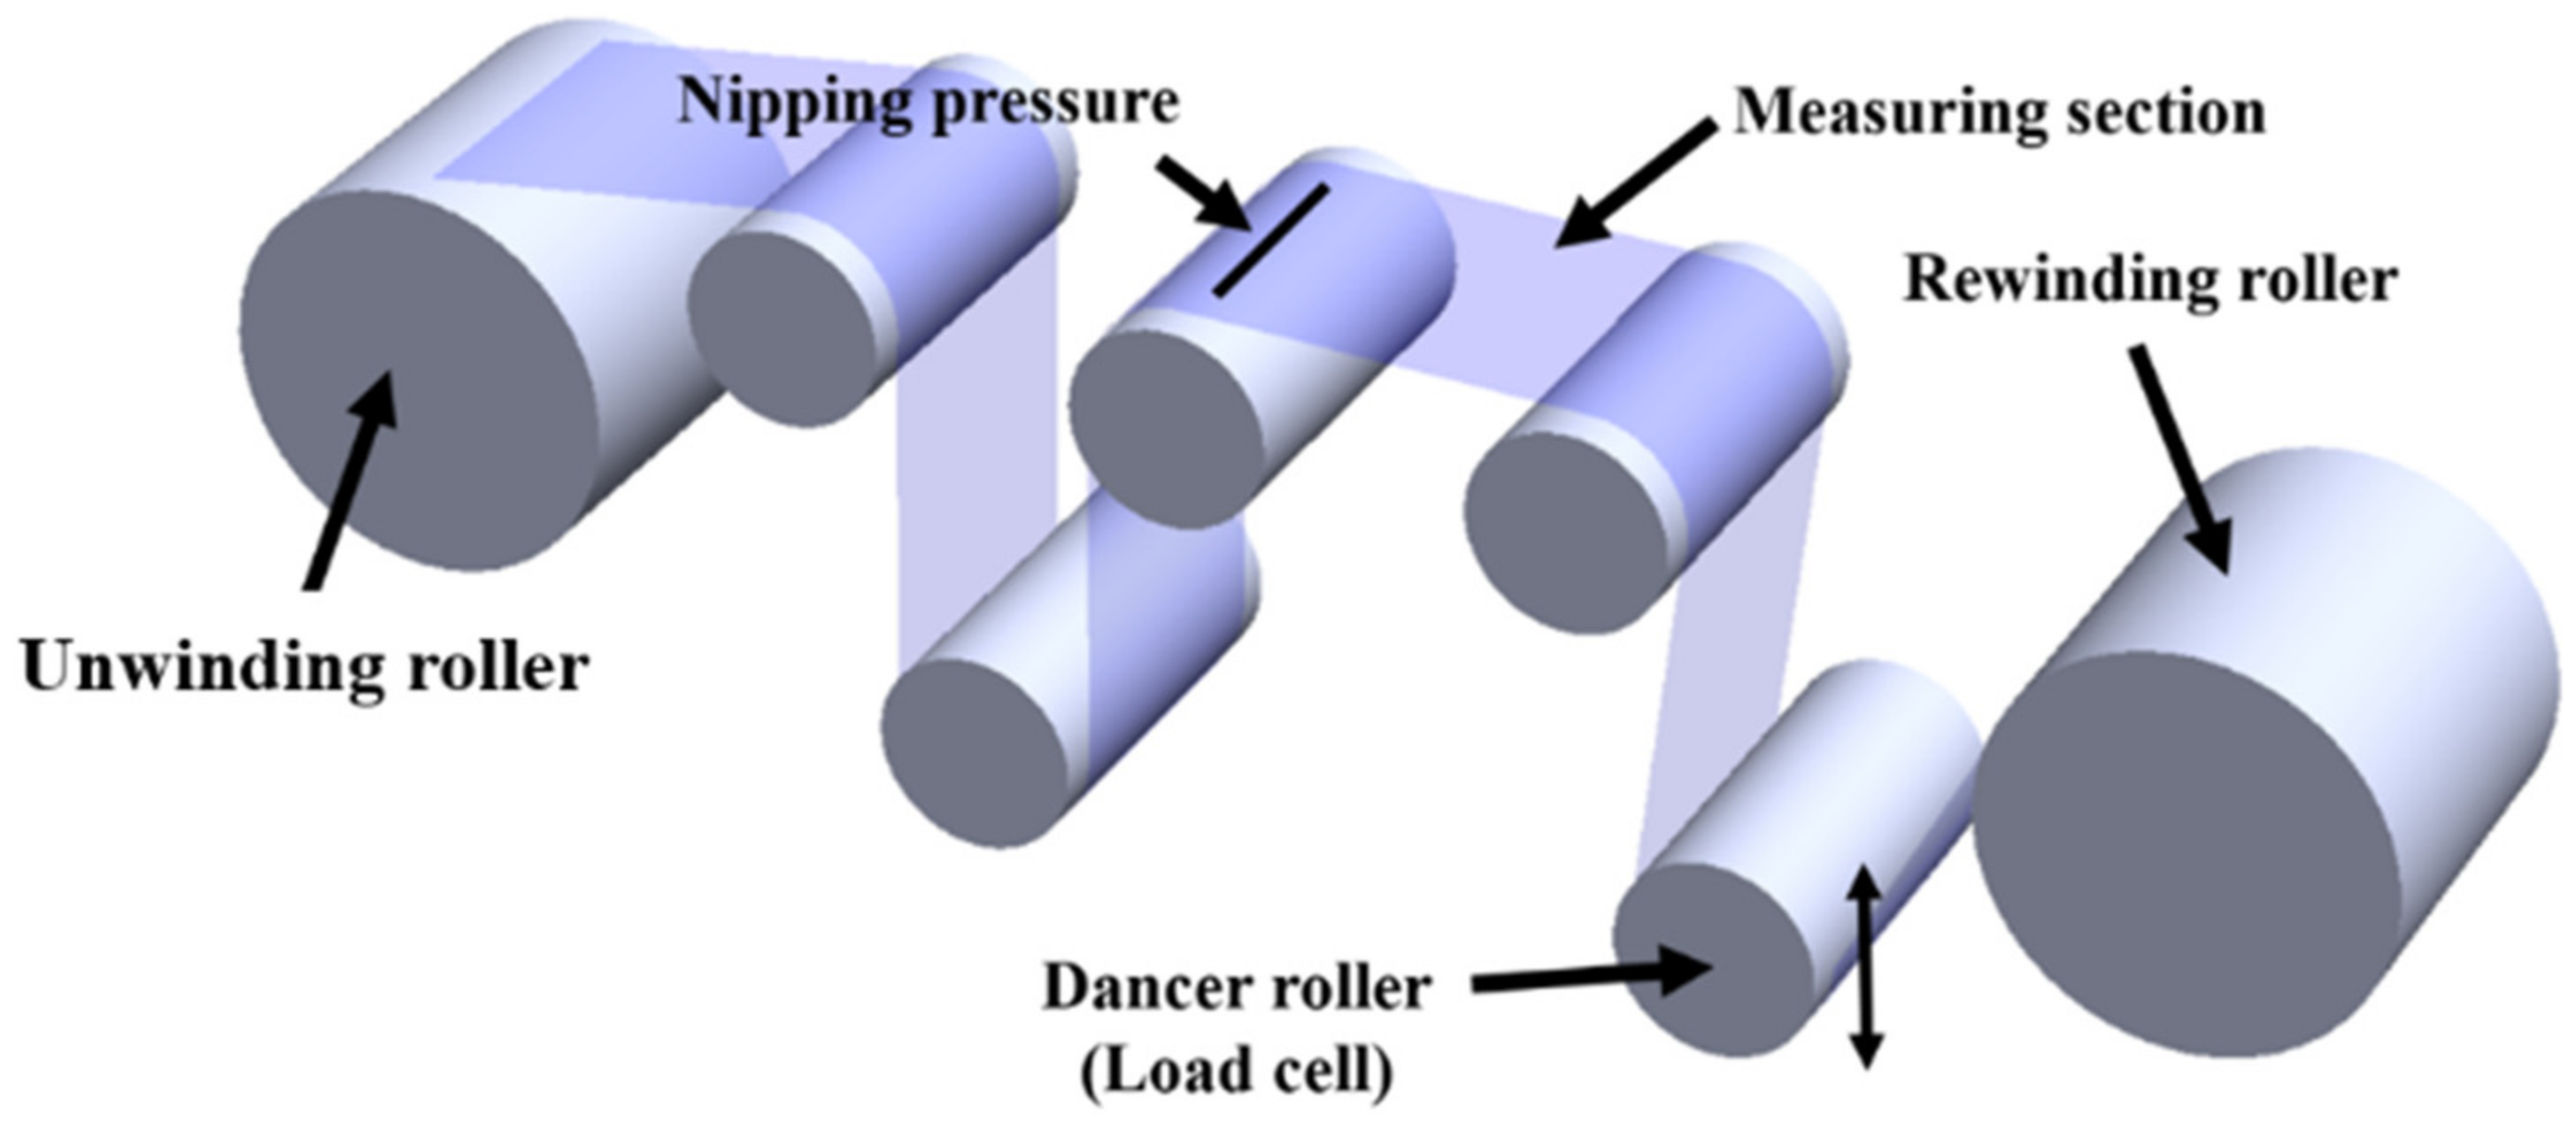
Figure 4 shows a schematic of the arrangement of the rollers and web of the experimental equipment. In general, the web is transferred by an unwinding roller and a rewinding roller. In a single span, one side uses a nip to simulate the fixed end, and the other side uses a dancer roller to simulate the load end. The tension acting on the web was measured with load cells (TS-100, Bongshin Loadcell Inc., Osan-si, Korea) at both ends of the dancer roll. The strain measurement was calculated from the relative displacement of reference marks on the web when tension was applied to the web, as shown in
Figure 5. The mark displacement was measured with a vision camera (MV-BX30A, Crevis Inc., Yongin-si, Korea, pixel size = 4.65 μm).
To measure the relative displacement of the web, 18 marks were used—nine marks near the fixed end and nine marks near the load end. Each set of nine marks is aligned along the CD, parallel to each other. The marks were fabricated by using a CO2 laser on the web. The marks were approximately 1 × 1 mm2 and cross-shaped.
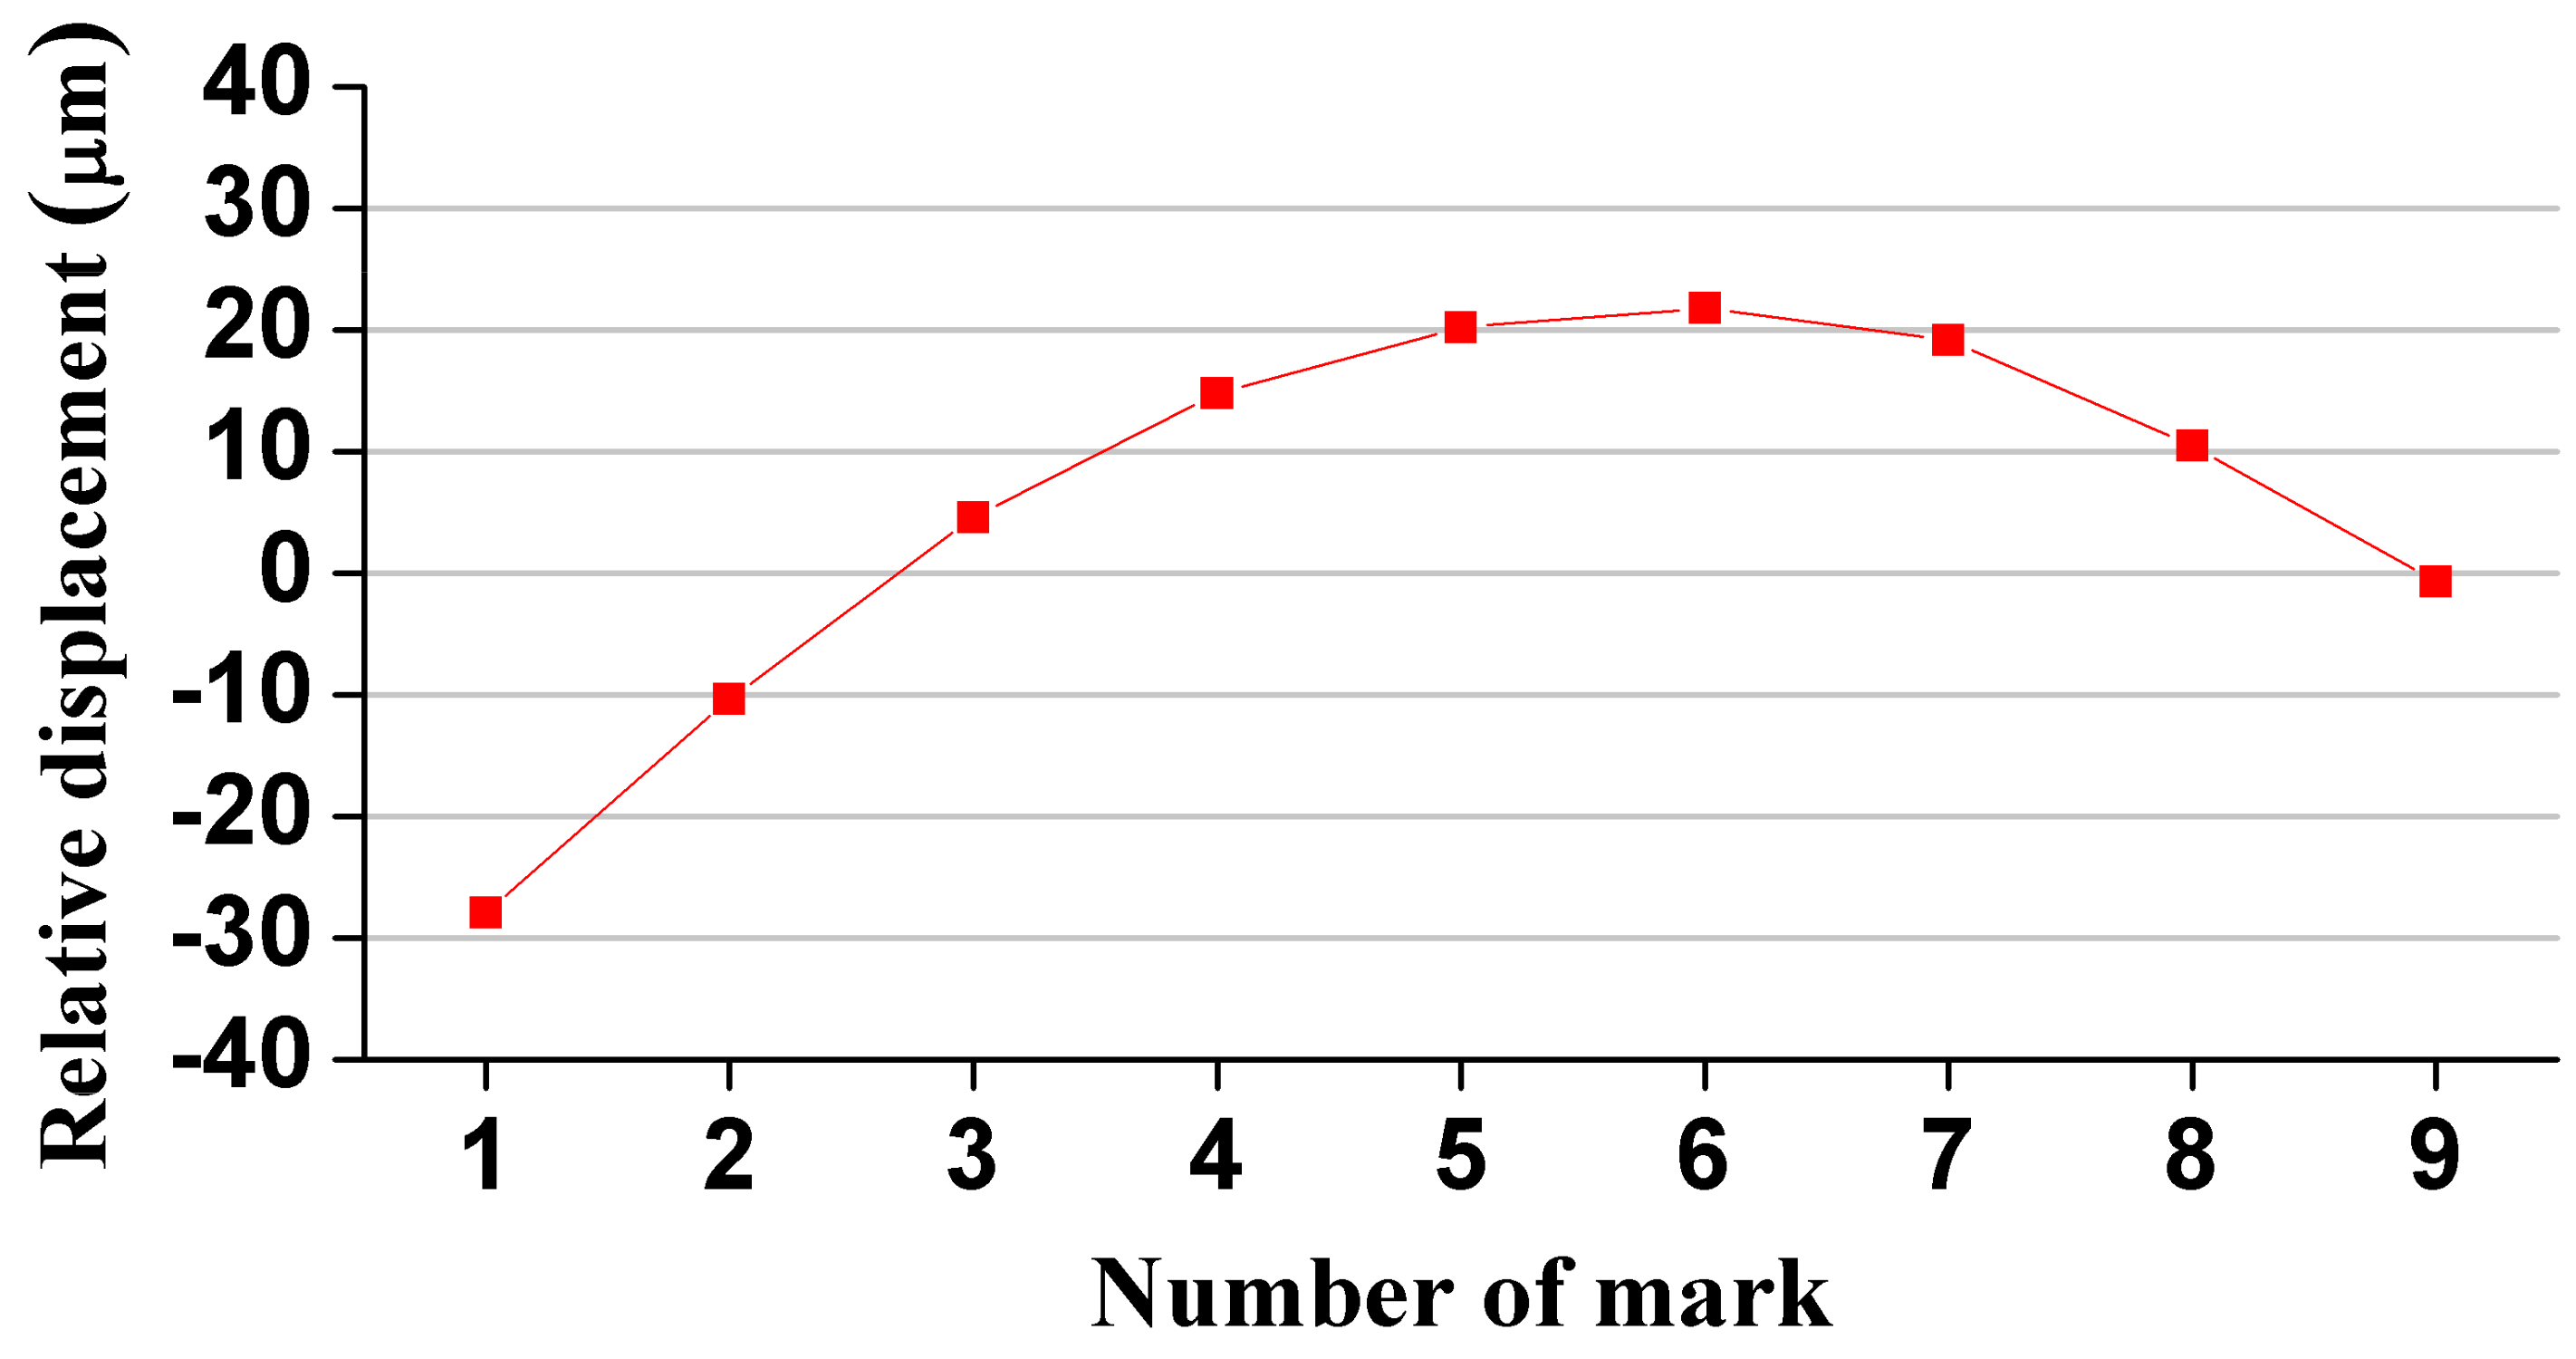
Figure 6 shows the relative displacement from the marks at the fixed end to the marks at the load end; the experimental results are similar to the results of the FEA. However, even if the transfer of the web was stopped during the experiment, displacement due to the inertia of the roller occurred; thus, it was impossible to stop it at the same position every time. Additionally, because the dancer roller used a hydraulic drive to add tension, it was difficult to compare quantitatively because there is a tension error for each test case. The experimental results were not symmetrical about the center because the position of the reference mark was not symmetrical.
Based on the results in
Figure 6, we confirmed that the strain deviation occurred in the MD under uniform tension conditions; the strain in the MD was larger near the center of the CD and decreased toward both ends. Since non-idealities exist in reality, there are some errors; however, the FEA and the experiment largely agree. Thus, we used the FE model to design the compensation roller for minimizing the strain deviation in the MD.
3. Roller Design Optimization for Minimizing Strain Deviation
The compensation roller has a barrel-shaped core and is wrapped with an elastic rubber. This roller was named “barrel roller”. In order to maximize the corrective performance of the barrel roller, we optimized the roller using DOE and ANOVA. After applying the optimized design factors to the FEA, we confirmed that the strain deviation was reduced.
3.1. Roller for Compensating Strain Deviation
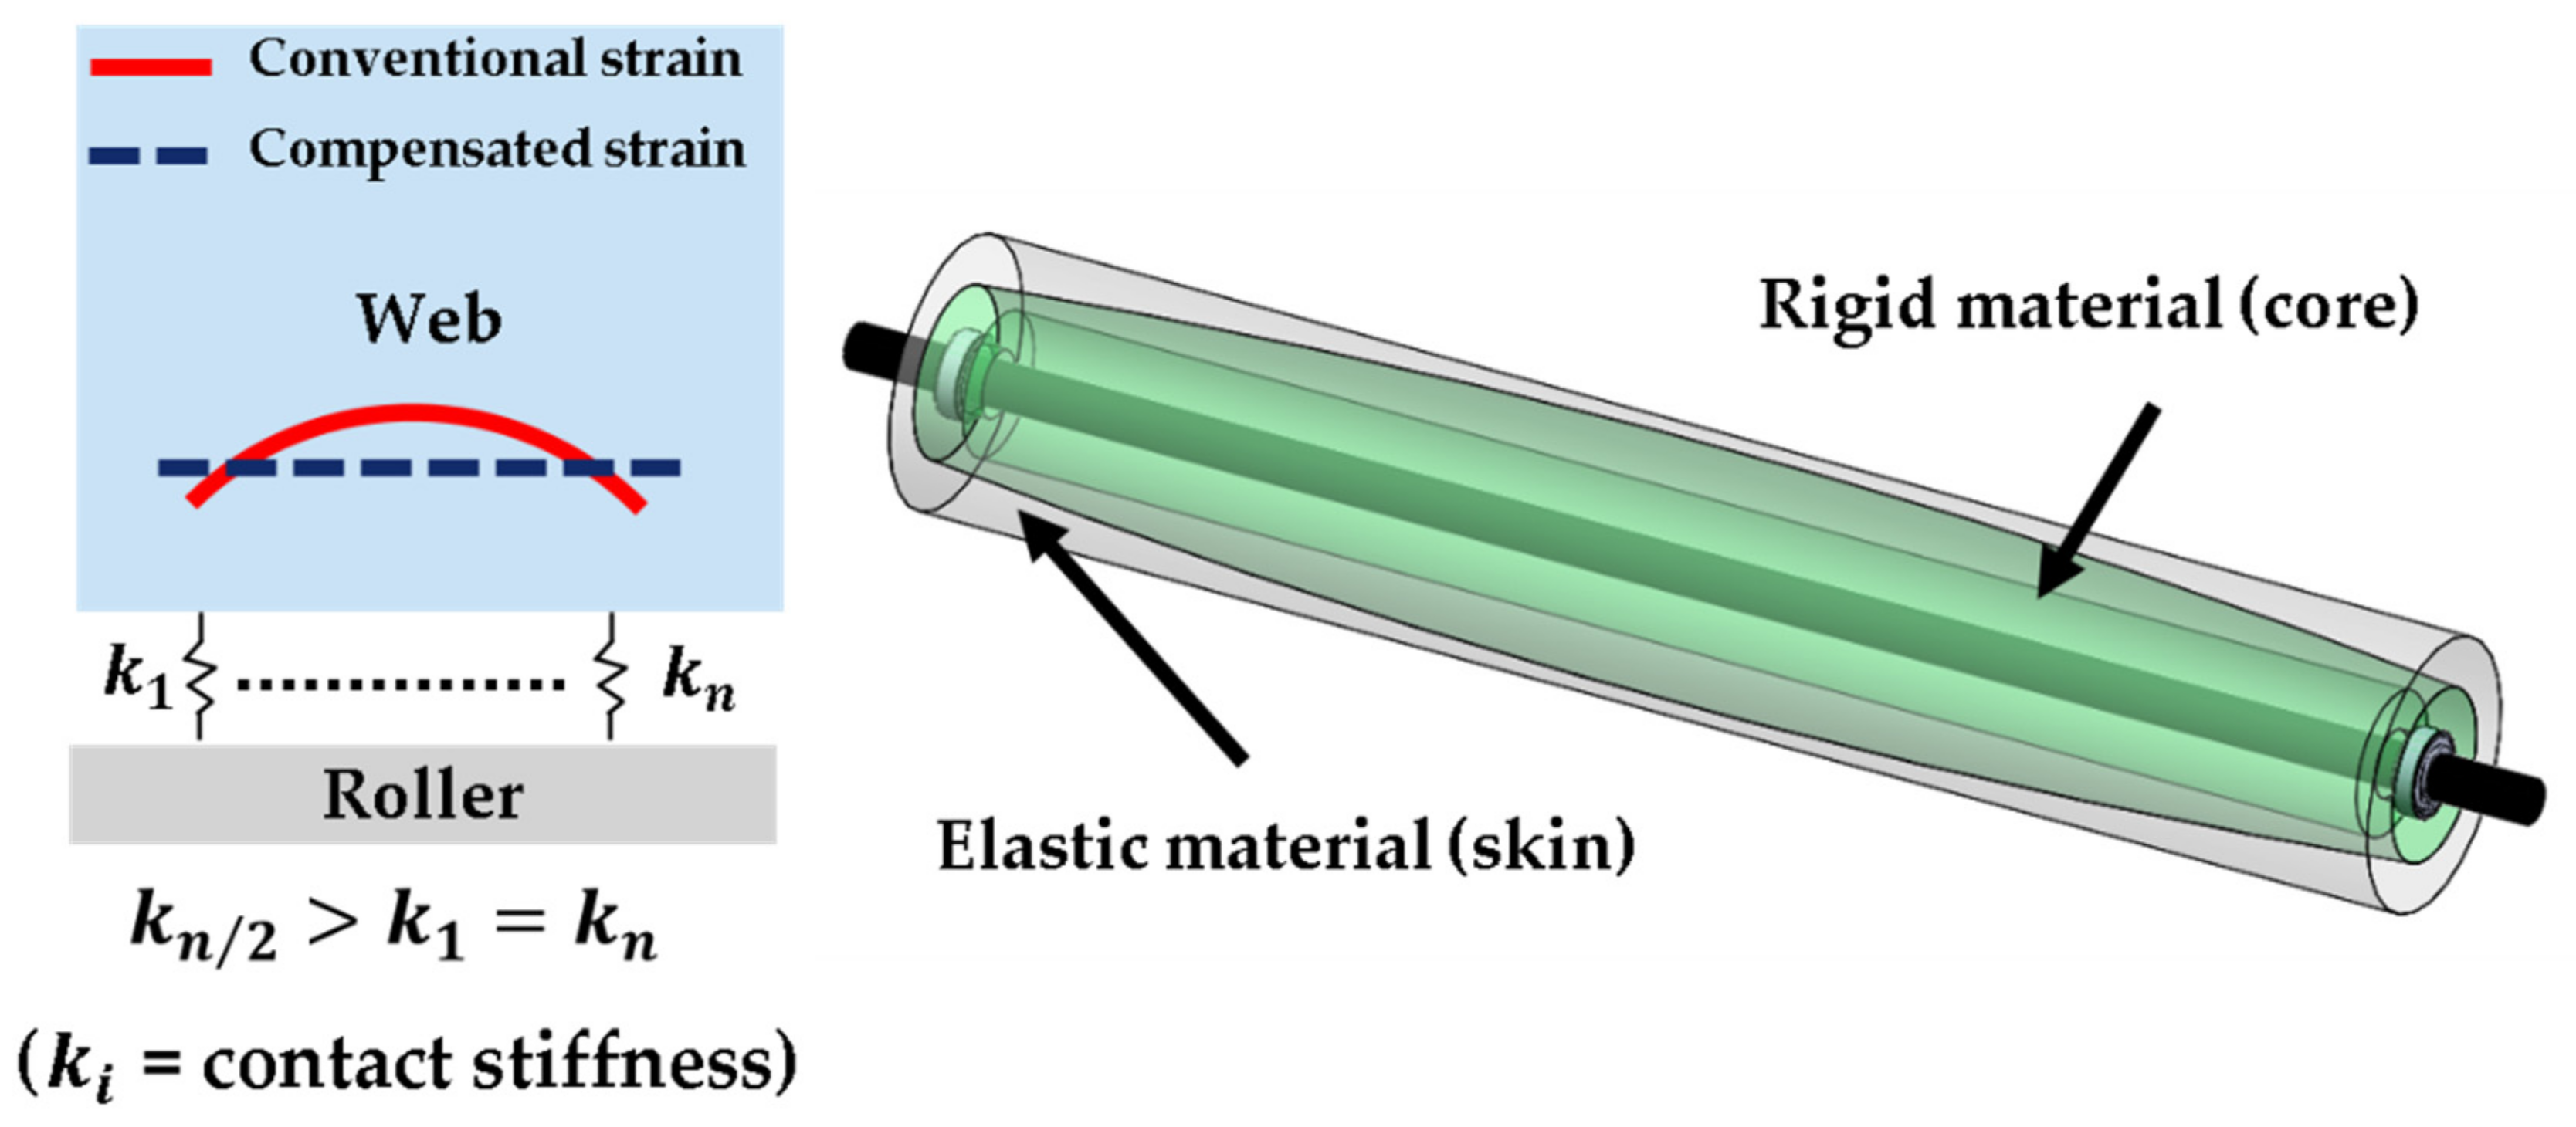
According to the FEA and experimental results, the strain in the MD of the web was high in the center of the CD when a uniform tension was applied to the conventional roller. The strain deviation in the MD can be compensated by adjusting the contact stiffness between the roller and the film. If the contact stiffness decreases toward the roller end, the relatively low strain increases; thus, the strain deviation in the web is compensated.
To test this concept with an actual roller, a roller with a convex core was chosen and the roller was wrapped in an elastic material (rubber skin). Hence, the core is rigid and the skin is flexible. As shown in
Figure 7, the contact stiffness between the web and roller is greatest in the center and decreases toward each side. The total diameter of the core and skin assembly is constant to prevent wrinkling of the web. Since the core of the roller is convex, the roller was named a “barrel roller”.
We then used the FE model to optimize the design of the roller shown in
Figure 7, focusing on the strain distribution in the MD 50 mm from the contact line. The goal of the optimization was to minimize the difference between the maximum and the minimum of the strain distribution in the MD along the CD.
3.2. Design Factors and Their Interaction
The design of experiments (DOE) is a method of efficiently planning an experiment to obtain the maximum information while minimizing the number of experiments required [
15]. DOE is used to analyze the factors that affect the output of the system. To minimize the MD strain deviation of the web under uniform tension conditions, design optimization was conducted based on DOE. Design factors were selected and the sensitivity analysis was performed according to the level change of design factors.
We varied the thickness gradient of the skin (A), the diameter of the entire roller including the core and skin (B), and the elasticity modulus (Young’s modulus, C) of the skin. Considering the process with actual rollers, the minimum thickness of the skin was set to 3 mm.
Next, we investigated possible interactions between the selected design factors (i.e., whether one factor depends on another factor).
Table 2 lists the initial values of the design factors used to study the interactions with a two-way factorial design. One of the three selected design factors was fixed, and the deviation of the strain in the MD of the web was analyzed as the other two factors were varied.
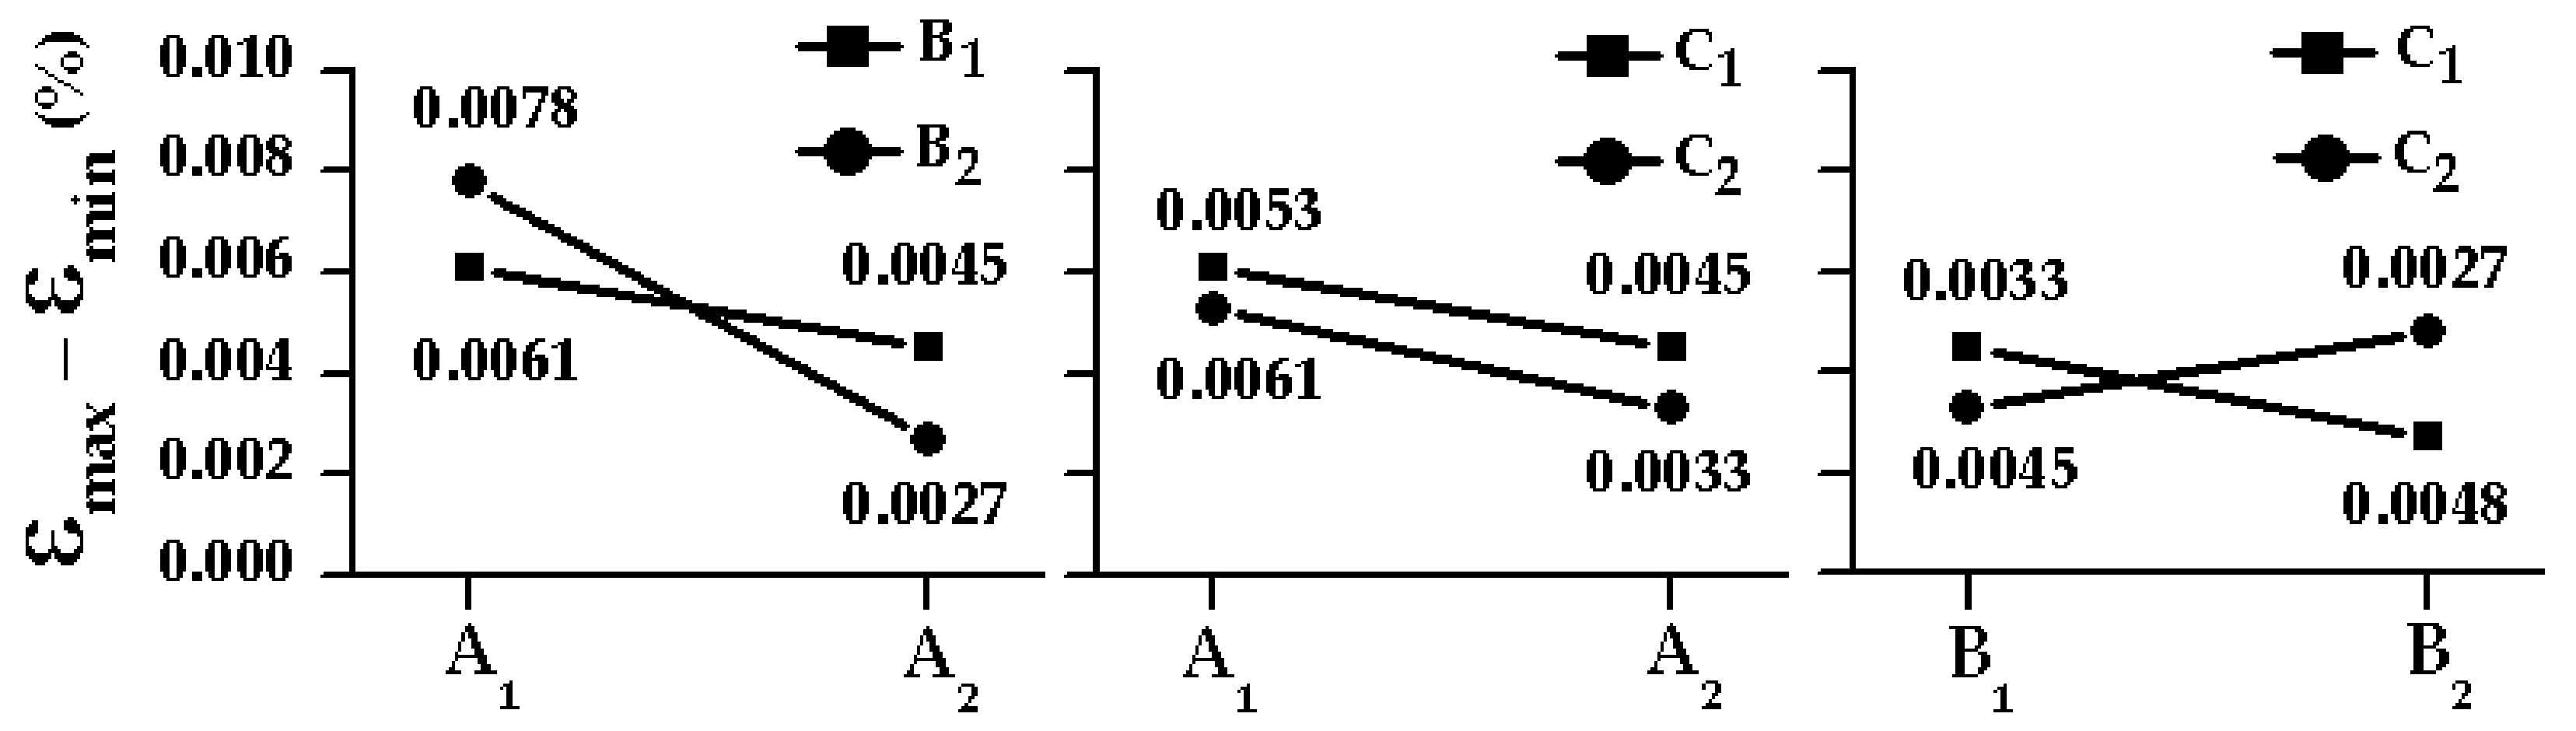
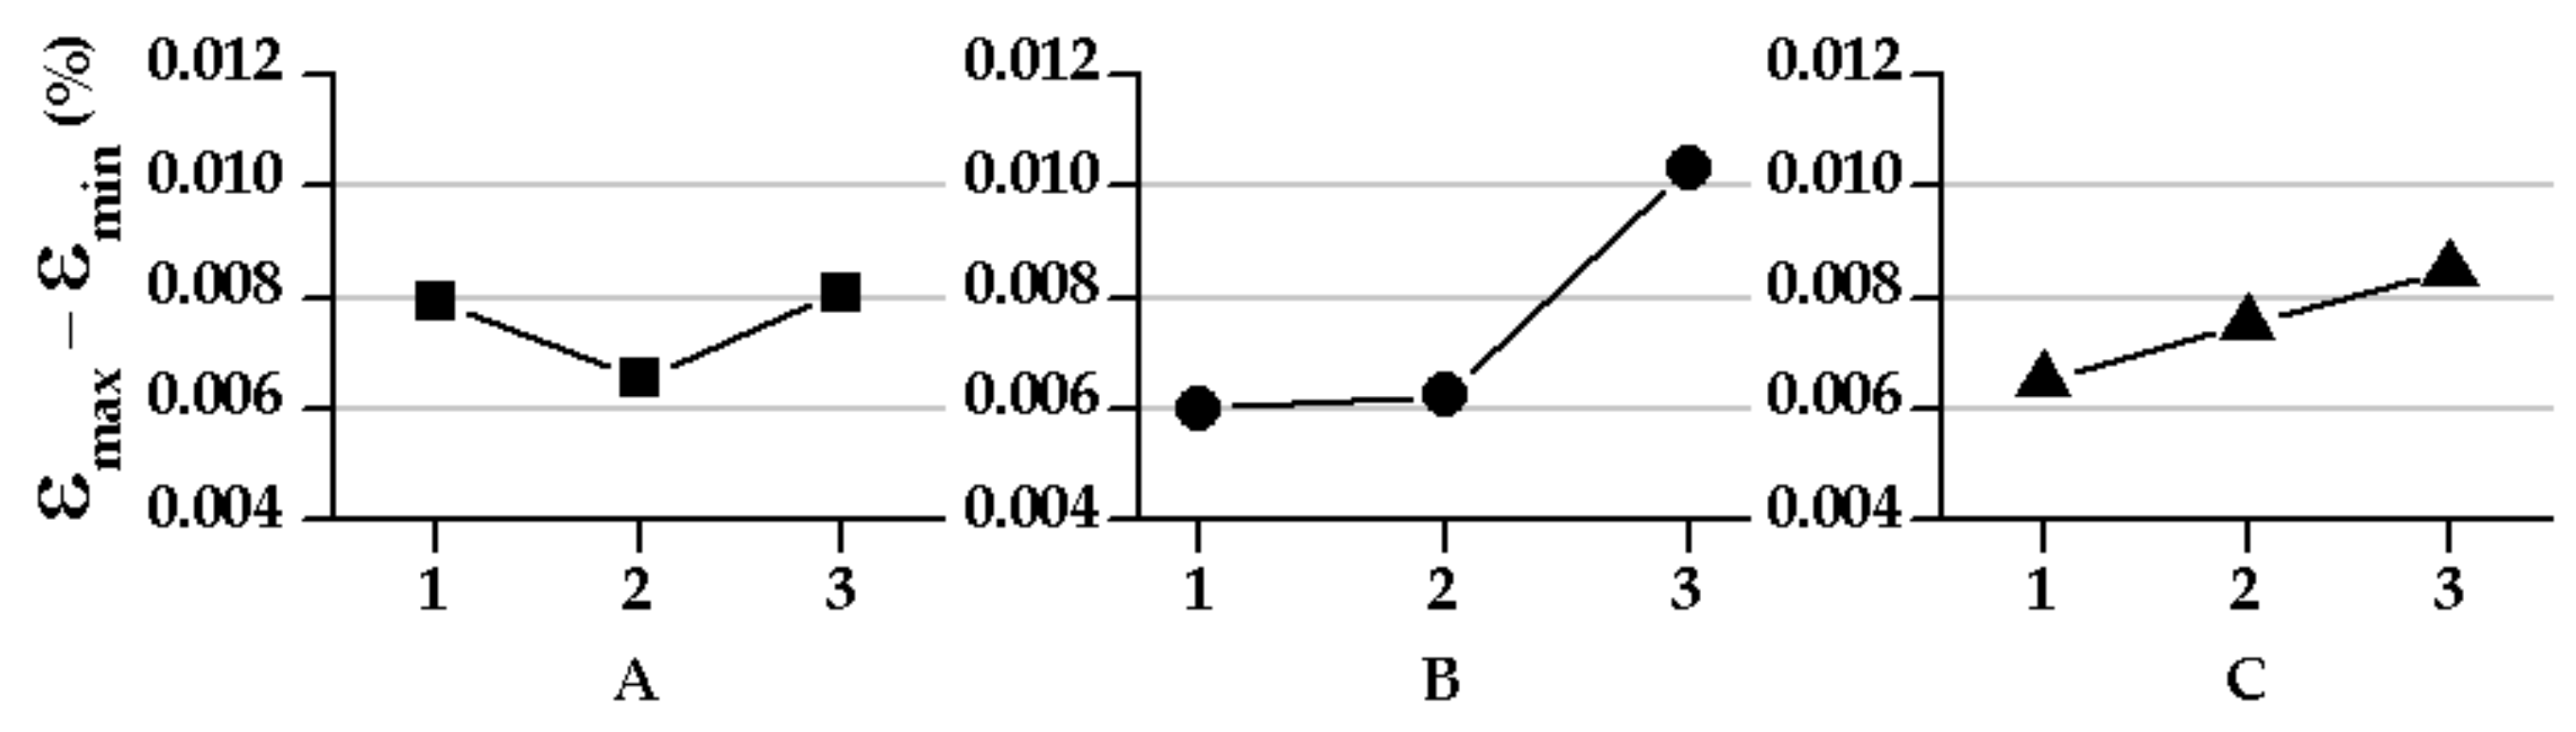
The results are shown in
Figure 8. The graph shows that the curves representing the relationship between the thickness gradient of the skin (A) and the diameter of the entire roller (B) and the relationship between the diameter of the roller (B) and Young’s modulus (C) of the skin intersect. However, the curves representing the relationship between the thickness deviation (A) of the skin and Young’s modulus (C) of the skin do not intersect. Hence, factor B is affected by the levels of factors A and C; these factors interact.
3.3. Design of Experiments (DOE) Considering Interactions
Since we confirmed that interactions between design factors occur, our DOE analysis considered these interactions.
Table 3 presents an orthogonal array for the case in which the interactions between the design factors are considered. Factors A, B, and C are in columns 1, 2, and 5, and their interactions are indicated by AB, BC, and AC, respectively. In the DOE-based FEA, only columns 1, 2, and 5 with factors A, B, and C were considered. Then, in the process of selecting the optimum condition, the factors of the remaining columns were considered. The ABC factor, which is a higher-order interaction, was not considered and was pooled in the error term. Subsequently, a sensitivity analysis was conducted to determine whether changes in design factor values affected the strain deviation in the MD.
The initial factor levels in the sensitivity analysis were the factor levels in
Table 2, and the results are shown in
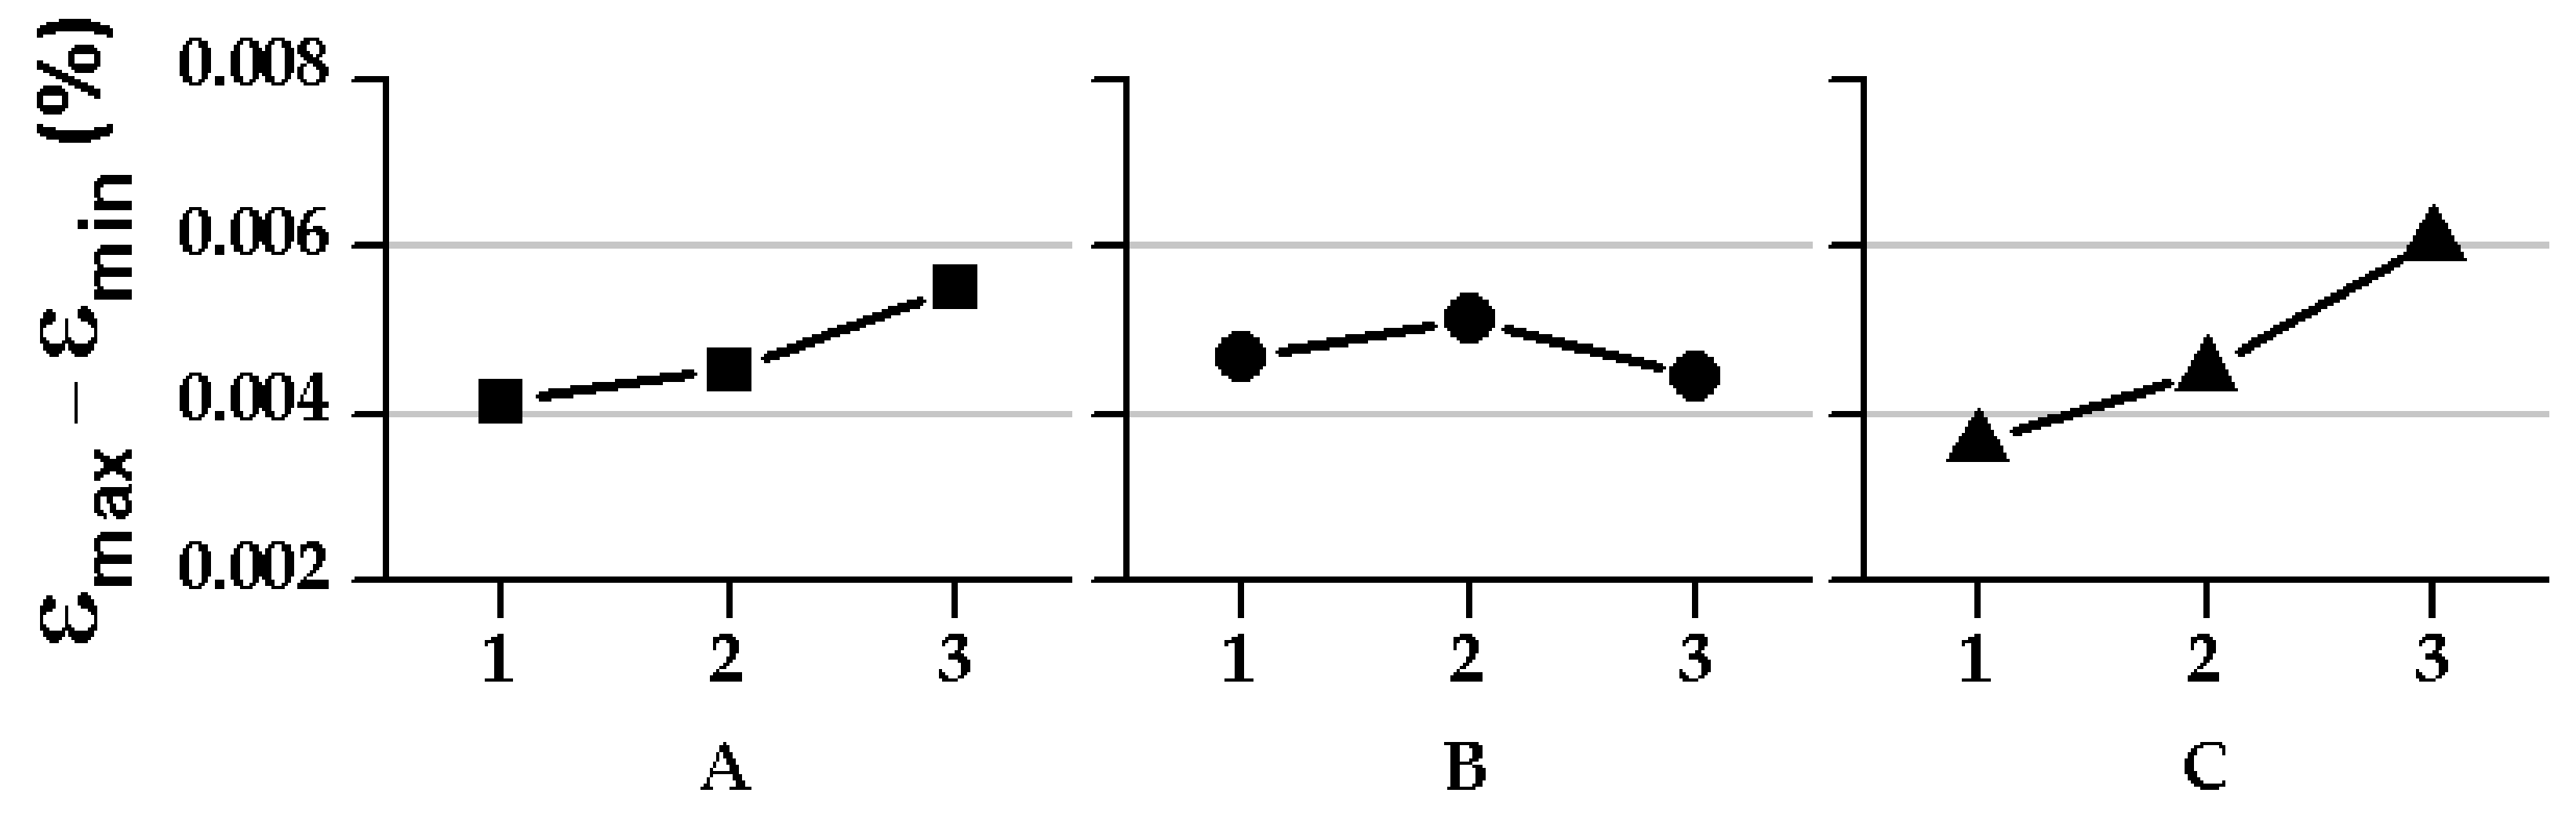
Figure 9. The objective function to minimize the strain deviation of MD was selected so that the difference between the maximum and minimum values of the strain distribution was to be the smallest. The same was applied to the DOE-based FEA and verification experiments. Accordingly, the strain deviation in the MD was minimal when the thickness gradient (A) of the skin was approximately 6 mm and the total diameter (B) of the roller was 40–60 mm. The lower the Young’s modulus (C) of the rubber, the greater the reduction of the MD strain deviation.
Thus, the range of factor A was further sub-divided from 6 to 9 mm and the range of factor B was set to 40–60 mm for the FEA. The levels of the modified factors are shown in
Table 4, and
Table 3 shows the orthogonal array. Moreover,
Figure 10 shows the results of the sensitivity analysis based on the modified factor levels in
Table 4. For a skin thickness gradient (A) of 6 mm, roller diameter (B) of 60 mm, and low Young’s modulus (C) of the skin, the strain deviation in the MD was minimized. In addition, each design factor influenced the reduction of the strain deviation in the MD.
Subsequently, we performed a quantitative analysis of variance (ANOVA) to select the optimal design. The ANOVA represents the variation in the characteristic values obtained as a result of the DOE as the total sum of squares [
15]. This value is expressed as the total sum of squares for each factor, and the remainder is interpreted as an error variation. The variance of each factor is then compared to the variance of the error to determine how much influence each factor has on the characteristic values. The larger the F value in the analysis of variance, the greater the effect on the objective function.
Table 5 shows the results of the ANOVA including the interactions between the factors; SS is the sum of squares, DF is the degrees of freedom, MS is the mean square, E is the error term, and T is the total sum of squares of the characteristic values obtained as a result of the DOE method. The F value was calculated by dividing the mean square value of each factor by the mean square value of the error (E).
According to
Table 5, the F value of the A × C factor was 0.13, which was less than the error value. Thus, the interaction between A and C had a small effect on the reduction of the strain deviation in the MD. The interaction between A and C was pooled in the error term in
Table 6. Based on the results in
Table 6, the modulus of elasticity of the skin had the greatest effect and the total diameter of the roller had the least effect.
3.4. Determination of Optimized Design
According to
Table 6, the factor with the greatest influence on the reduction of the strain deviation in the MD was the elastic modulus of the skin (C); the total diameter of the roller (B) had the least effect. However, because these factors interact, the interaction must be considered when determining the optimal shape.
Table 7 shows the results of the MD strain deviation for the factor levels in
Table 4. The combinations with the least strain deviation in the MD are the A
1B
1 and B
3C
1 combinations. The results in
Table 7 alone cannot be used to select the value of factor B because of the interaction. However, according to
Table 6, factor C had the greatest influence on the strain deviation in the MD. Therefore, the B
3C
1 combination was chosen first. The level of factor B was fixed at B
3, and the level of A was determined. Among the combinations including B
3, A
3B
3 produced the smallest MD strain deviation.
Finally, the A
3B
3C
1 combination was selected as the optimal design and applied to the FE model to confirm the corrective effects on the strain deviation in the MD.
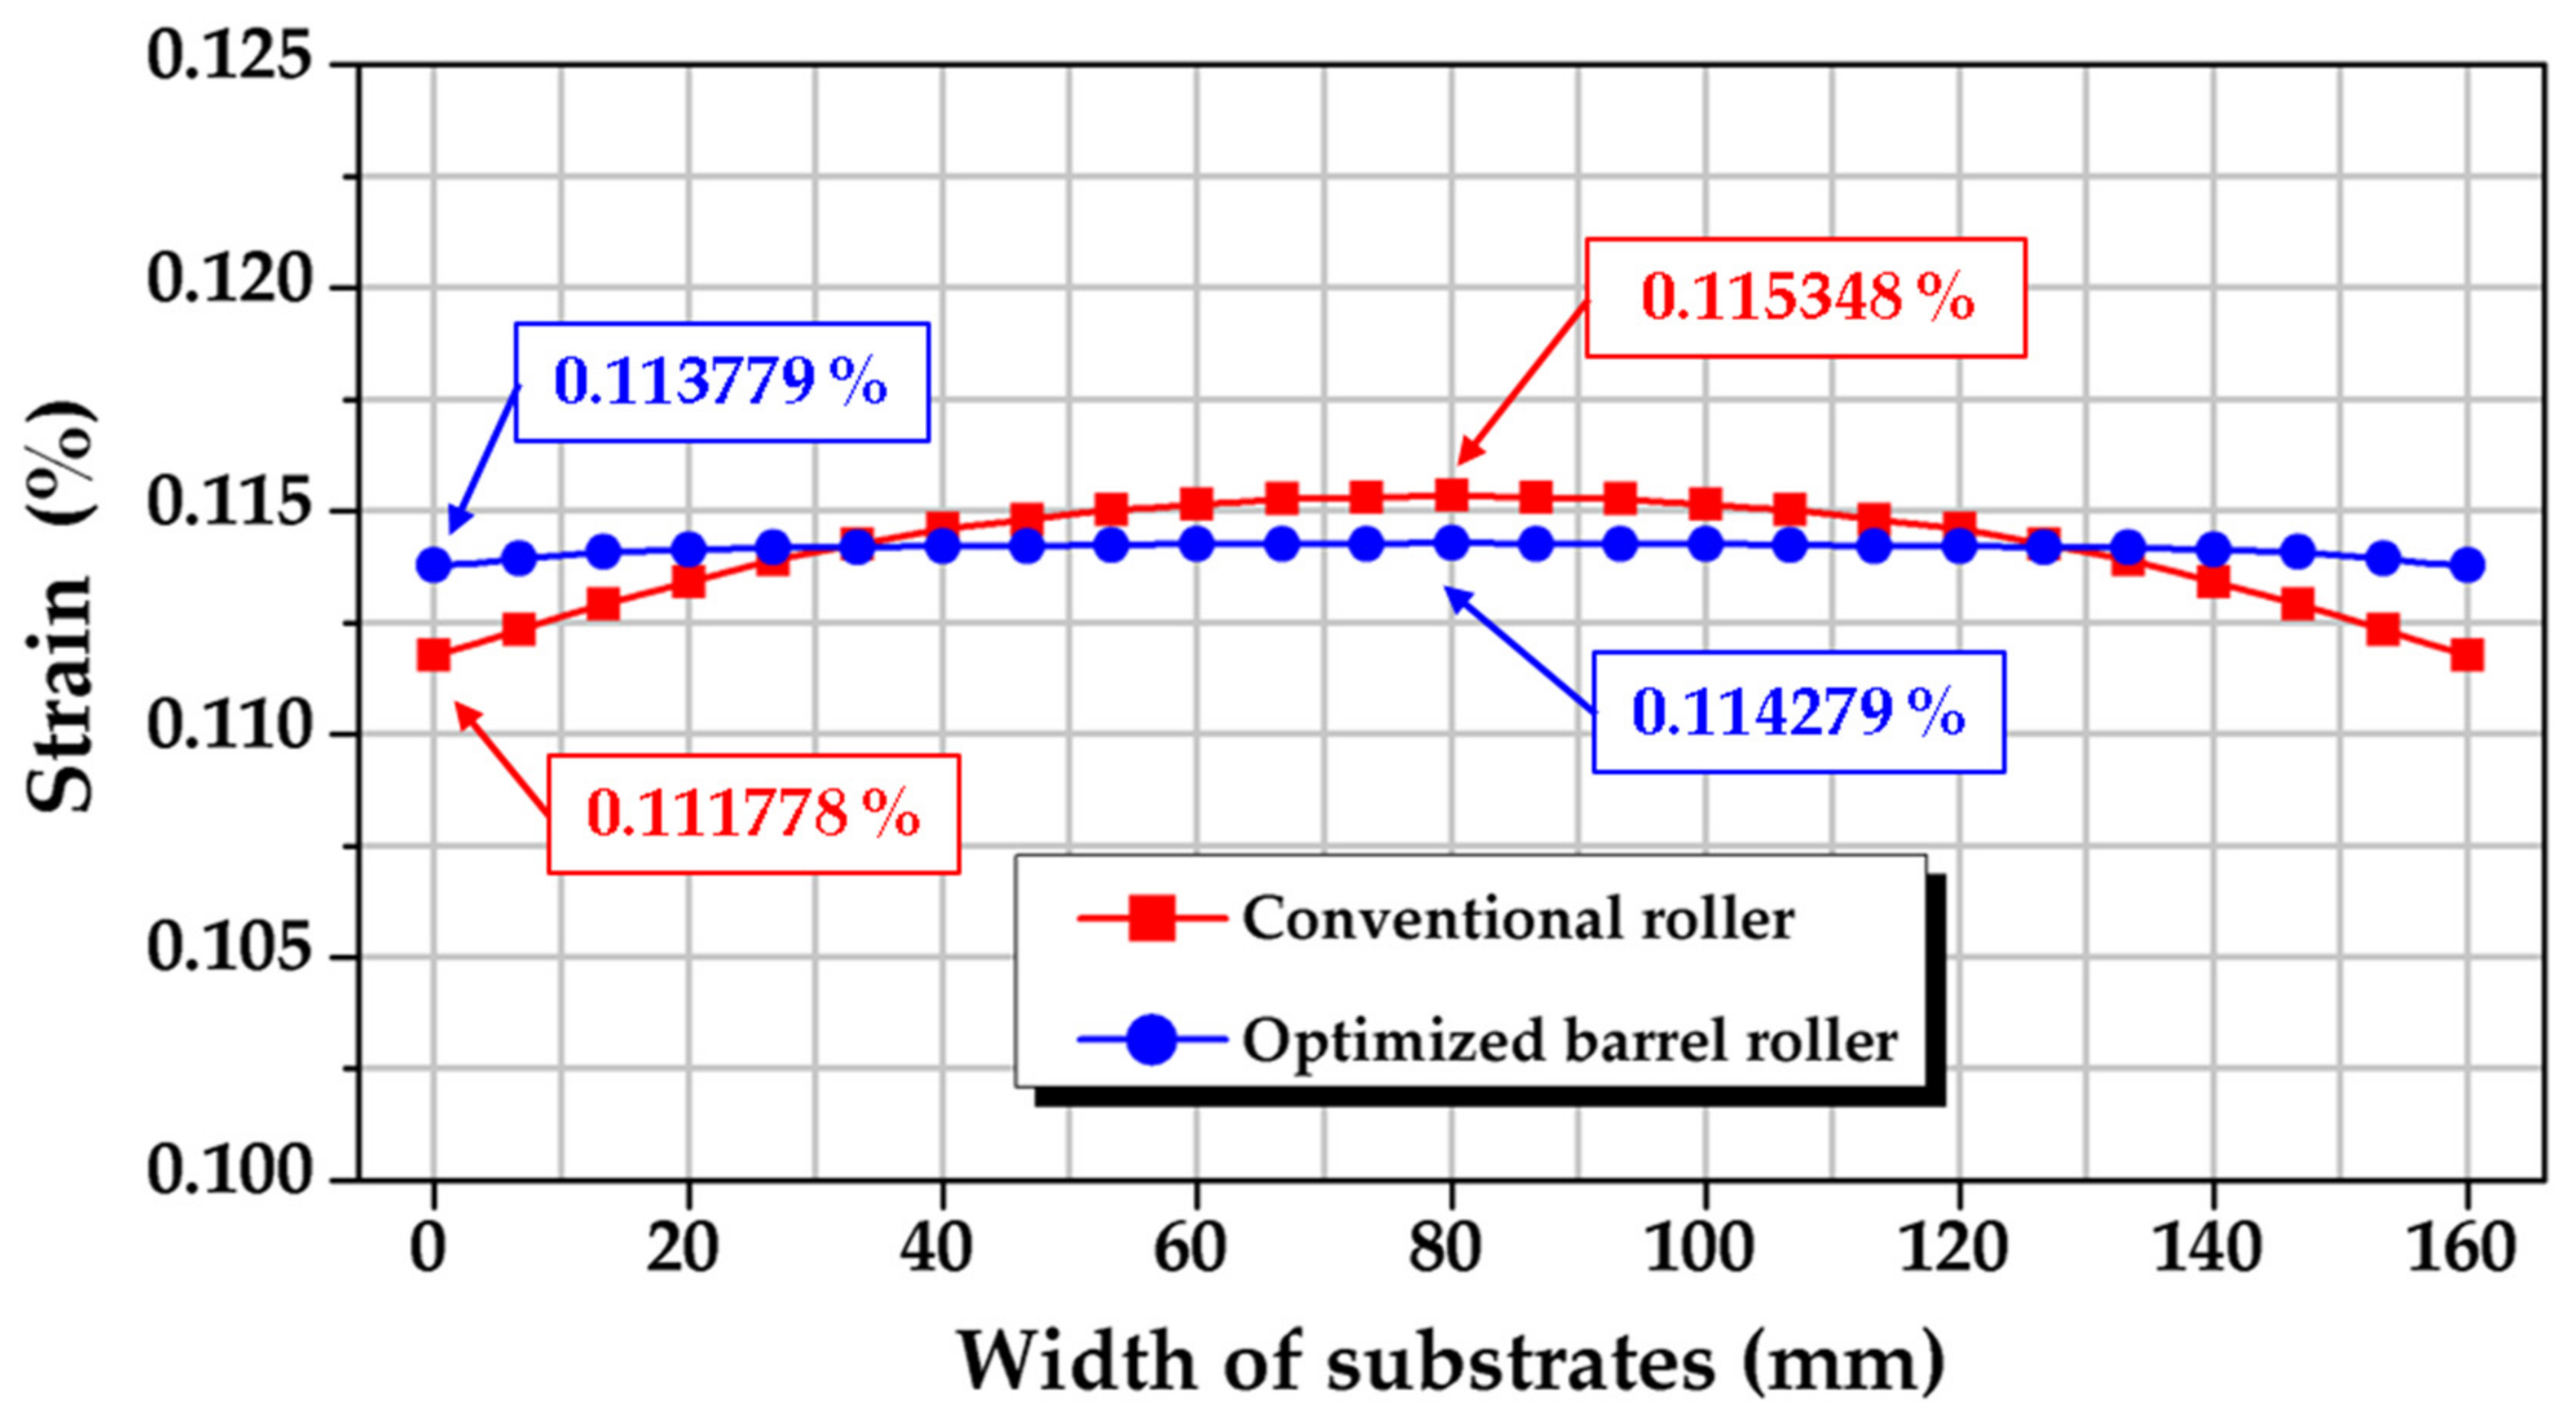
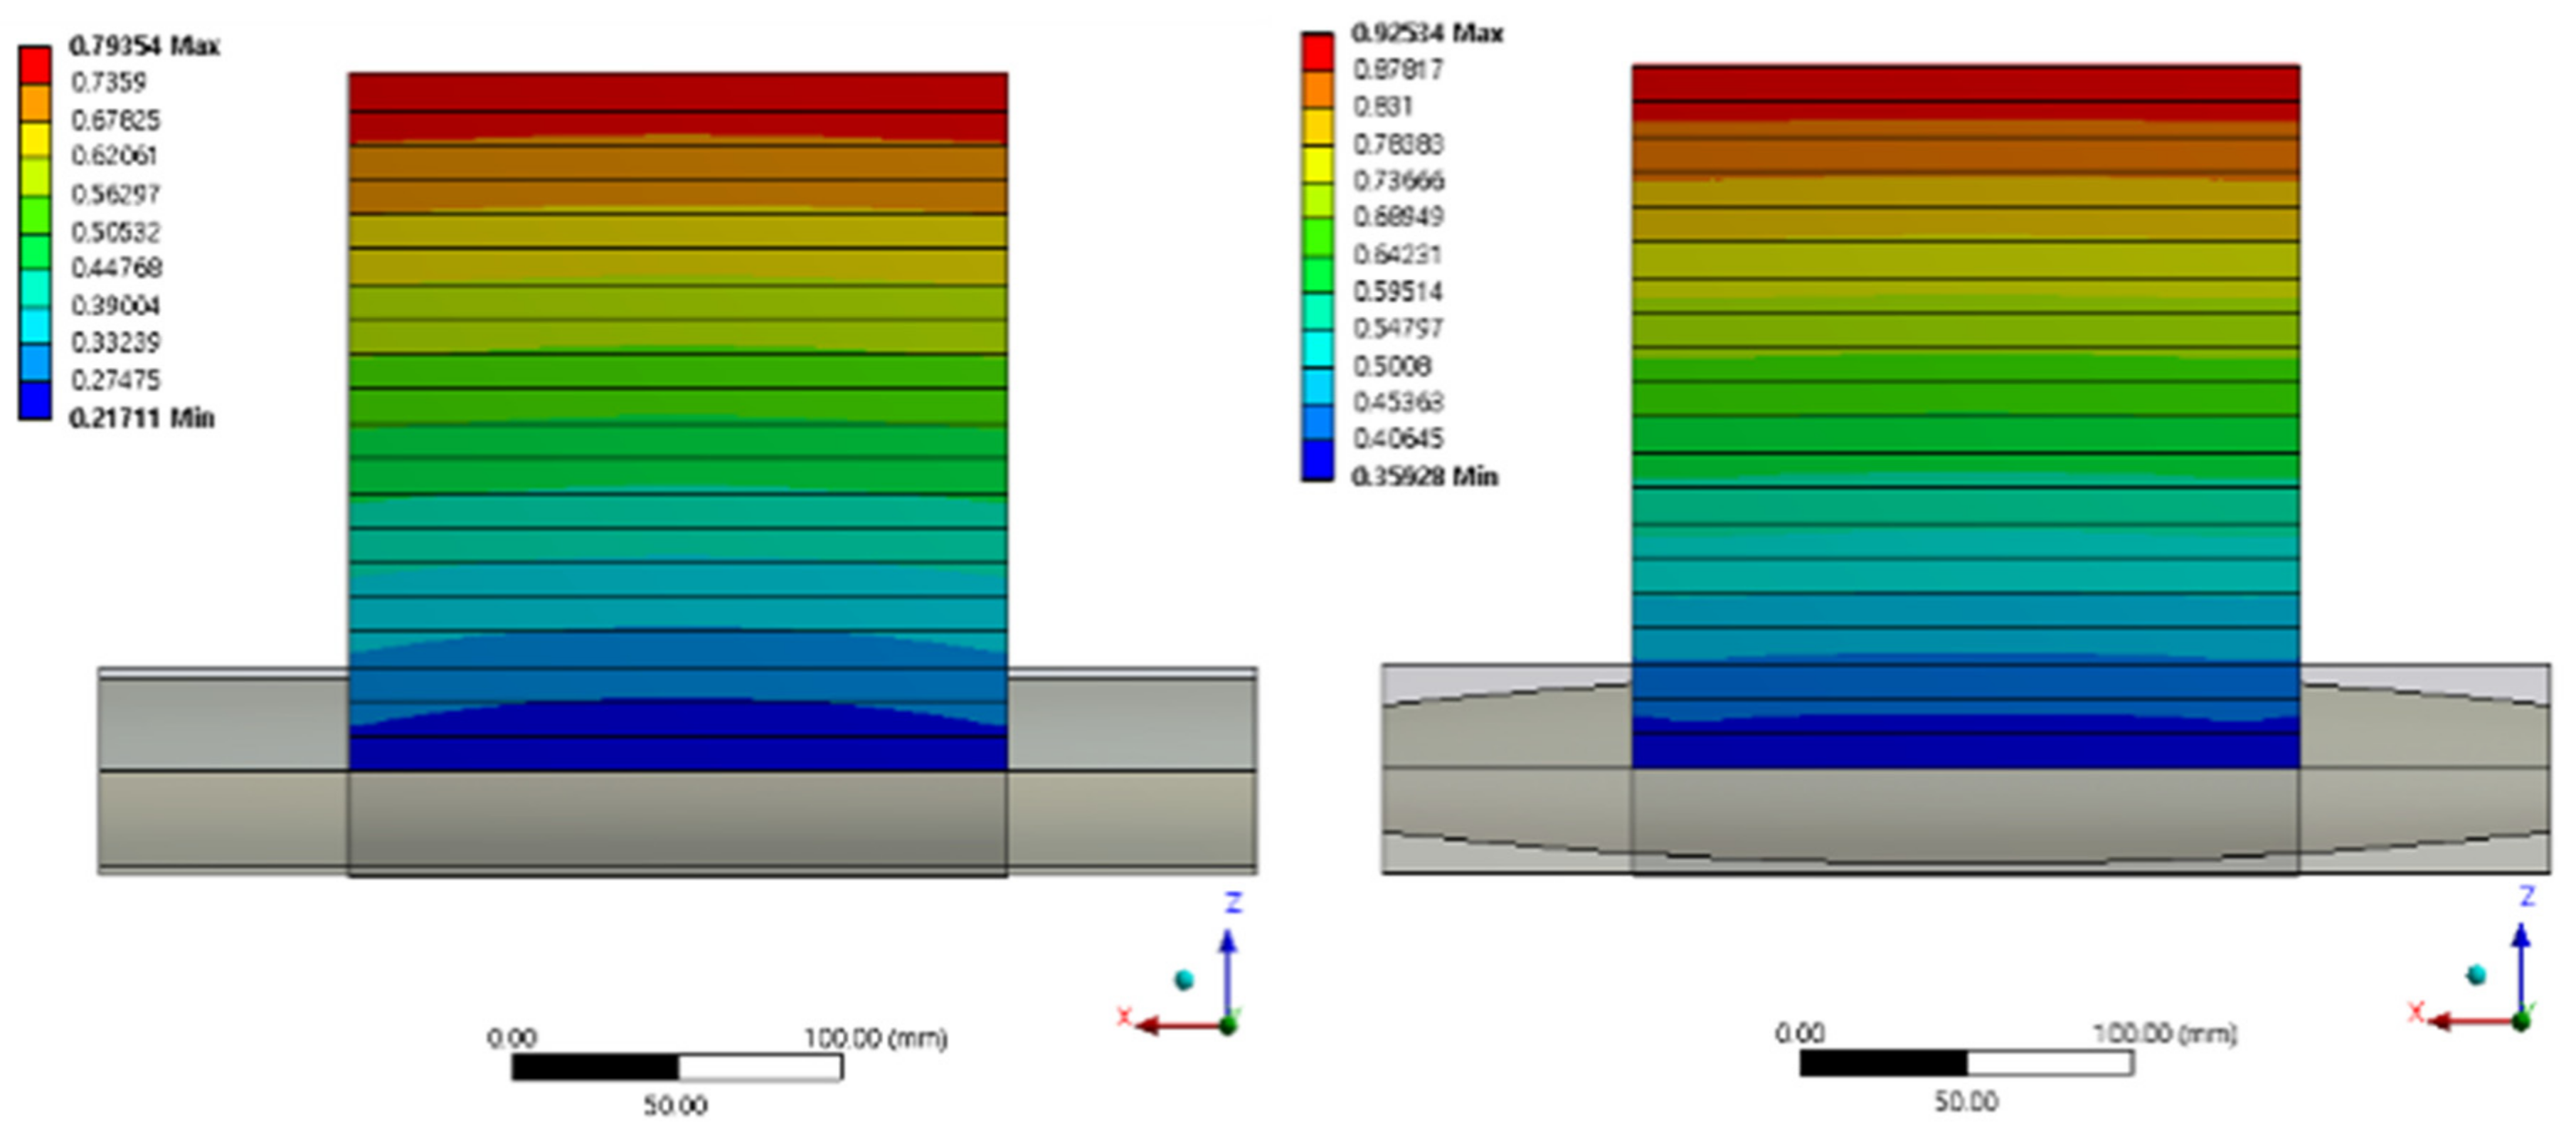
Figure 11 compares the strain deviations in the MD of the conventional and barrel rollers. The total deformation of the web is shown in
Figure 12. The proposed design is effective according to these results.
4. Experiment
By manufacturing the optimized barrel roller, we were able to verify its compensation performance. For a span length of 200 mm, the average deviation was 8.54 μm for the conventional roller and 4.42 μm for the optimized barrel roller. This represents a compensation of approximately 48%. Under the same conditions as in the experiment, FEA produces a compensation performance of 85%.
4.1. Experiment for Verifying the Performance of Barrel Roller
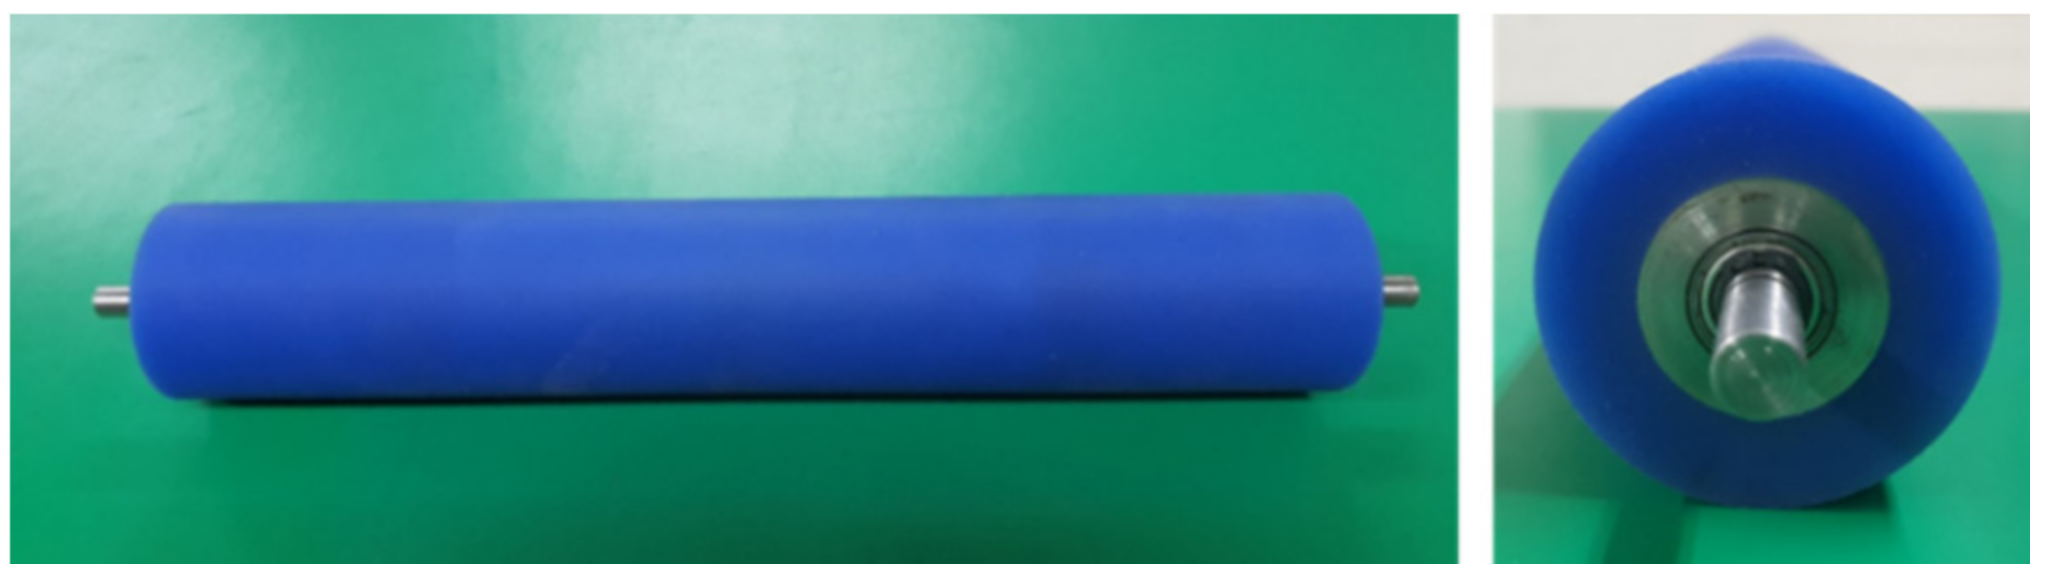
We conducted an experiment to evaluate the compensation performance of the optimized barrel roller. The optimized barrel roller was a barrel-shaped A
3B
3C
1 combination; the thickness gradient of the skin was 8 mm, the total diameter of the roller was 60 mm, and the elastic modulus of the shell was 2.85 MPa (
Figure 13).
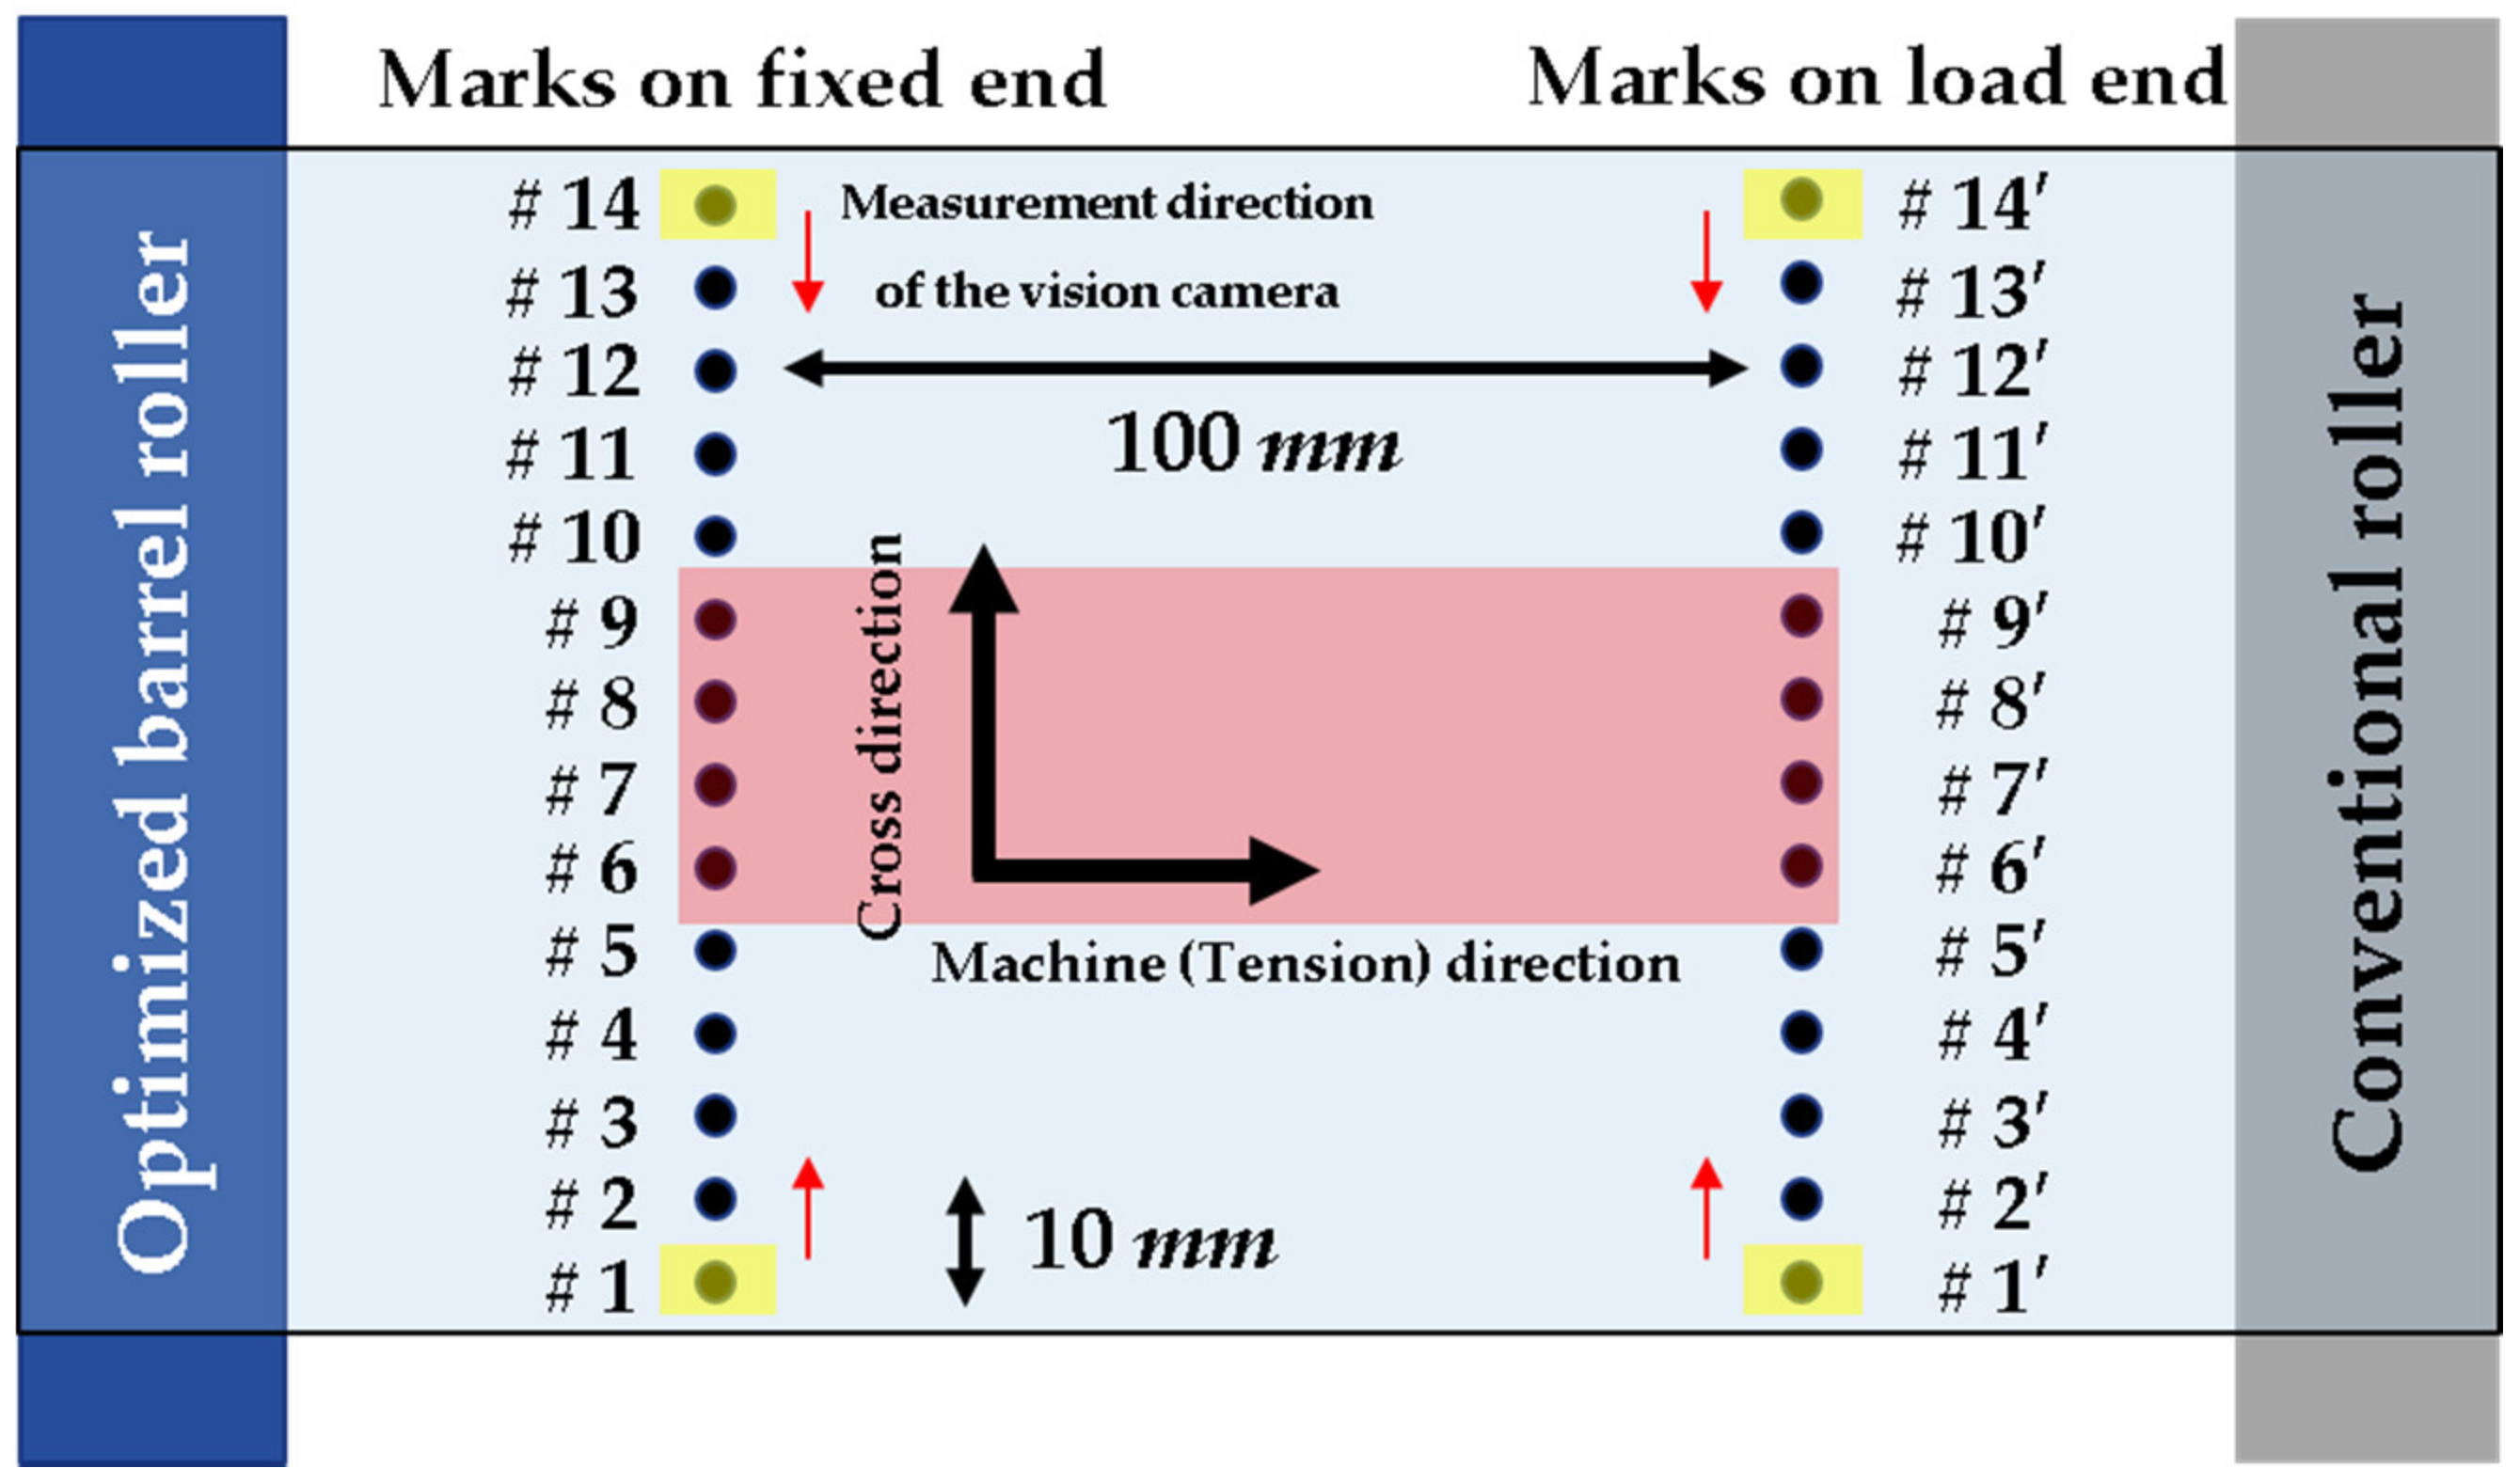
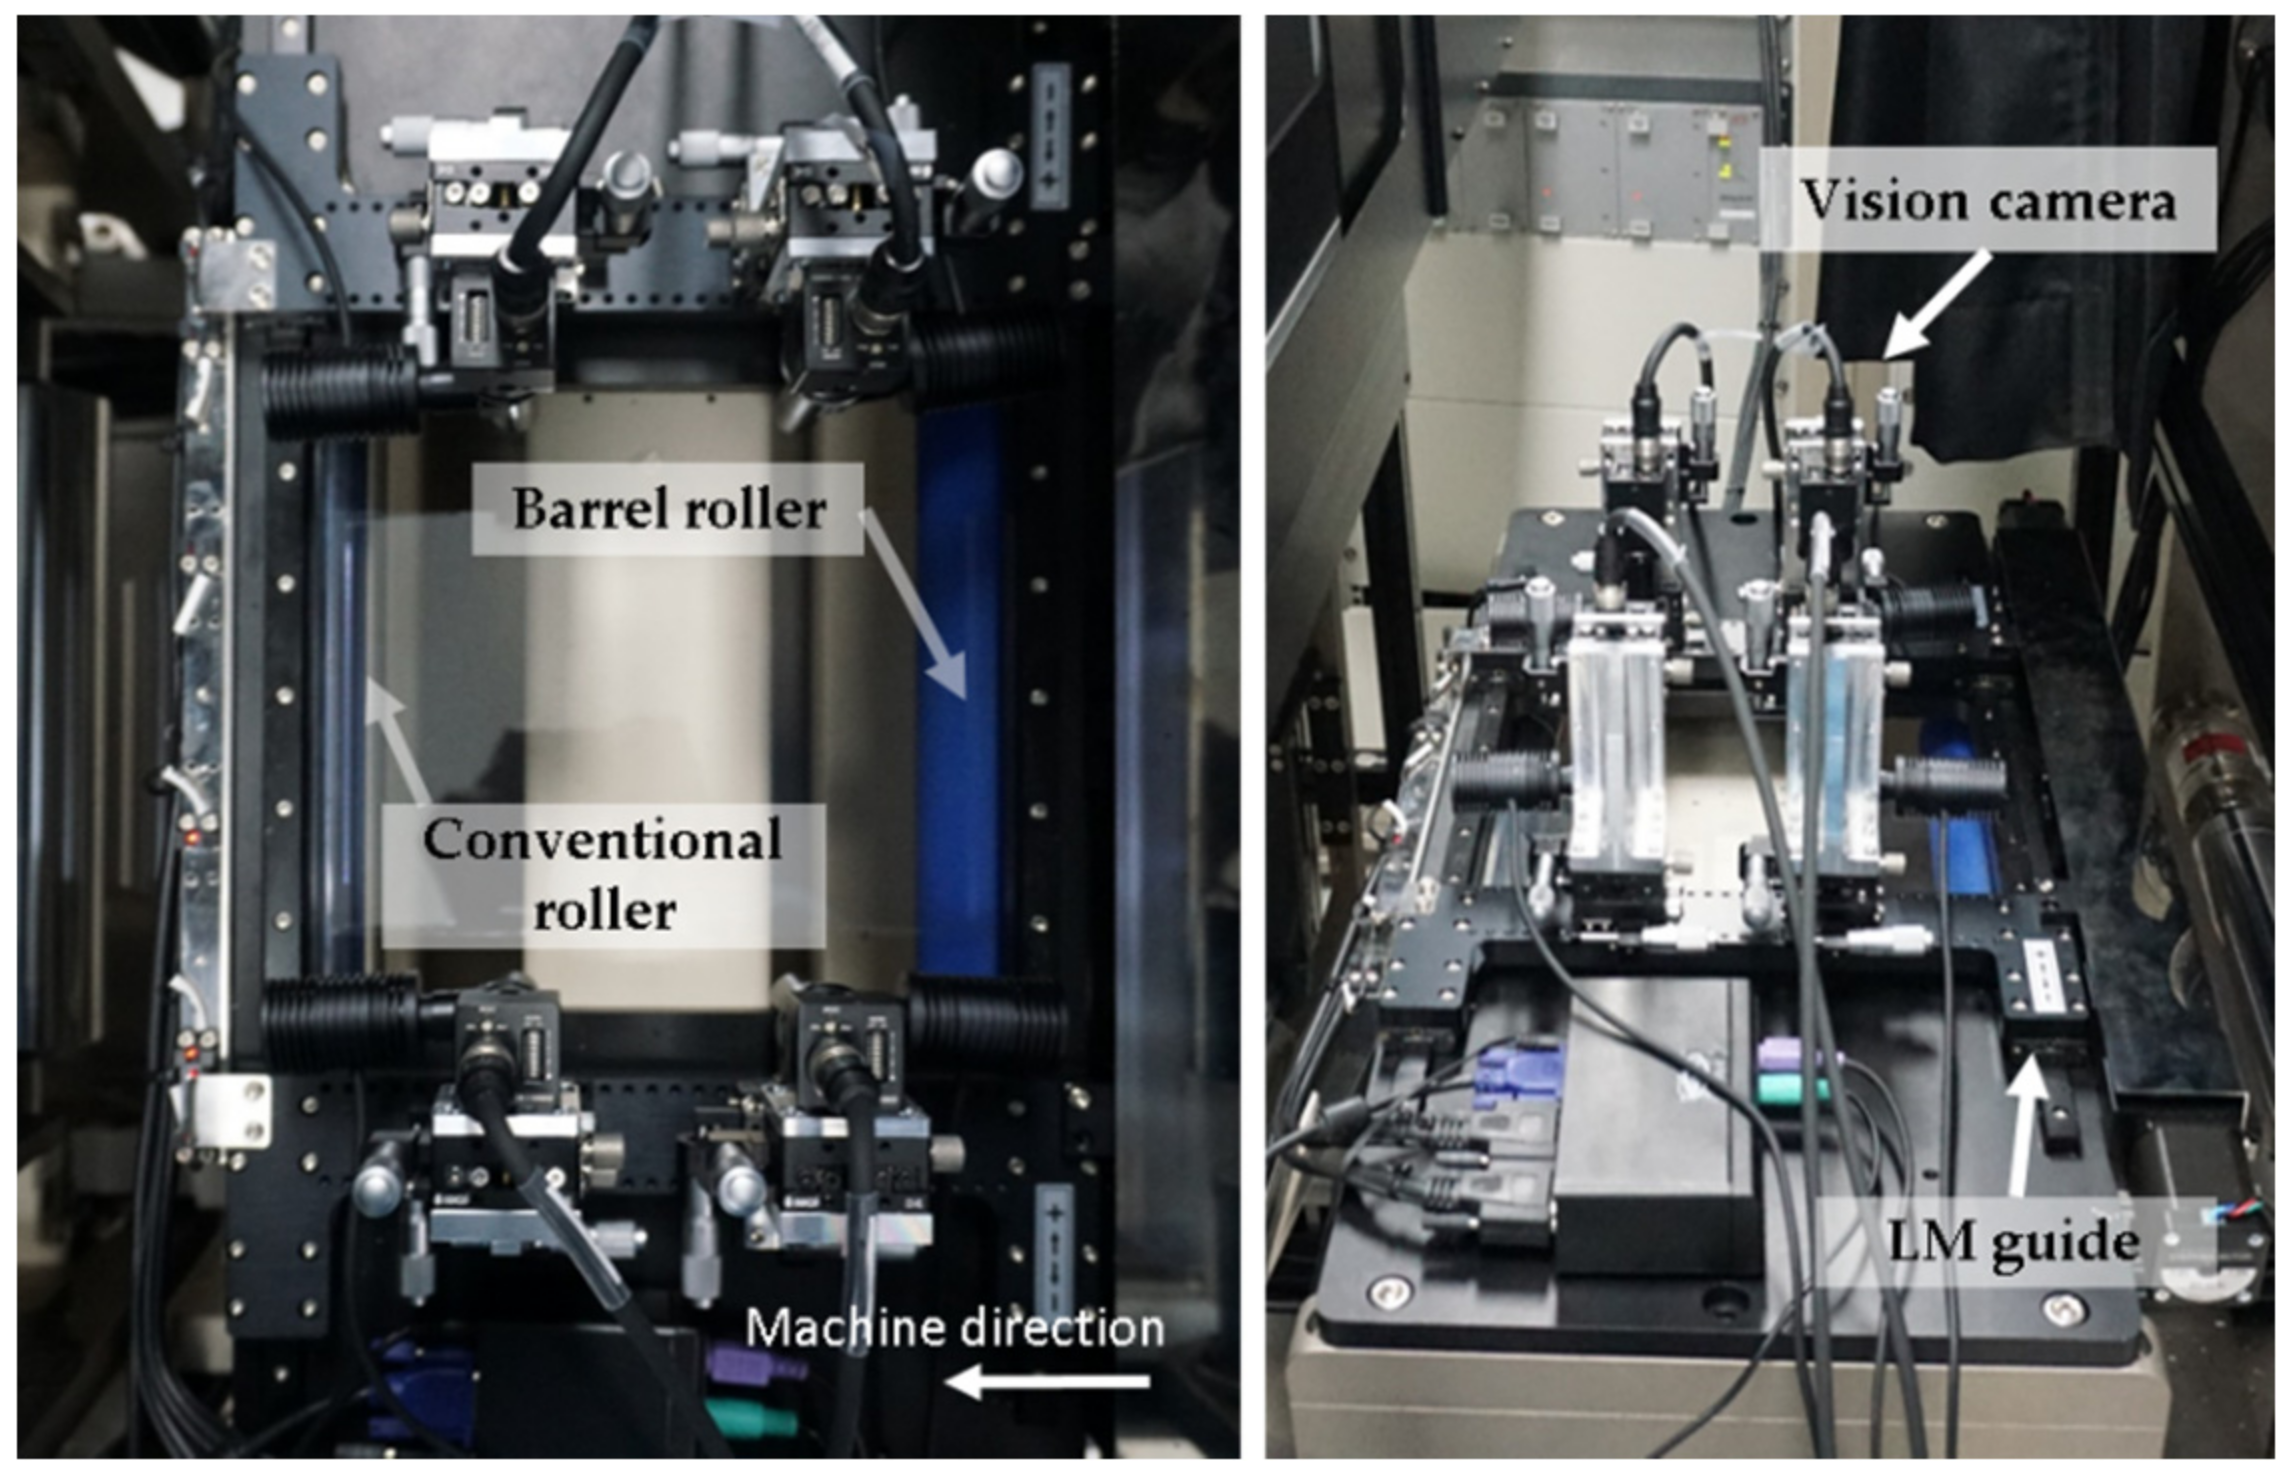
To evaluate the performance of the barrel roller, we conducted a comparative experiment by replacing the fixed-end roller with the barrel roller, as shown in
Figure 14. The load-end roller was a conventional roller. Reference marks were also placed by a laser; the relative displacement of the laser marks was measured with a vision camera, and the strain was calculated. In this experiment, we used 28 marks—14 marks are close to the optimized barrel roller (fixed end) and 14 marks near the conventional roller (load end). The web used in the experiment was a PET film (Mitsubishi Inc. O321E188) with a width of 160 mm and a thickness of 188 μm. The experimental apparatus is shown in
Figure 15.
Tension in the film was engaged with dancer rollers and measured with load cells at both ends of the roller at the load end. In the FEA, the load condition was assumed to be 10 MPa; however, in the experiment, the maximum tension was limited to 5 MPa due to the load limit of the dancer roller. Since we assumed that the deformation of the web and skin occurred only within the elastic region, a linear relationship between the strain and tension was assumed.
The vision cameras were positioned 50 and 150 mm away from the central axis of the roller and the web was transferred. When a reference mark entered the field of view of the vision camera, the transfer of the web was stopped and the position of the mark was measured. To measure the strain, a pair of reference marks at 100 mm intervals in the MD was pictured on the web under a load of approximately 3 MPa, and all reference positions were measured first. In the next step, the tension was increased to 5 MPa, and the positions of the marks were determined to calculate the strain. The procedure was repeated three times; marks #6 to #9 could not be measured due to mechanical interference between the vision cameras.
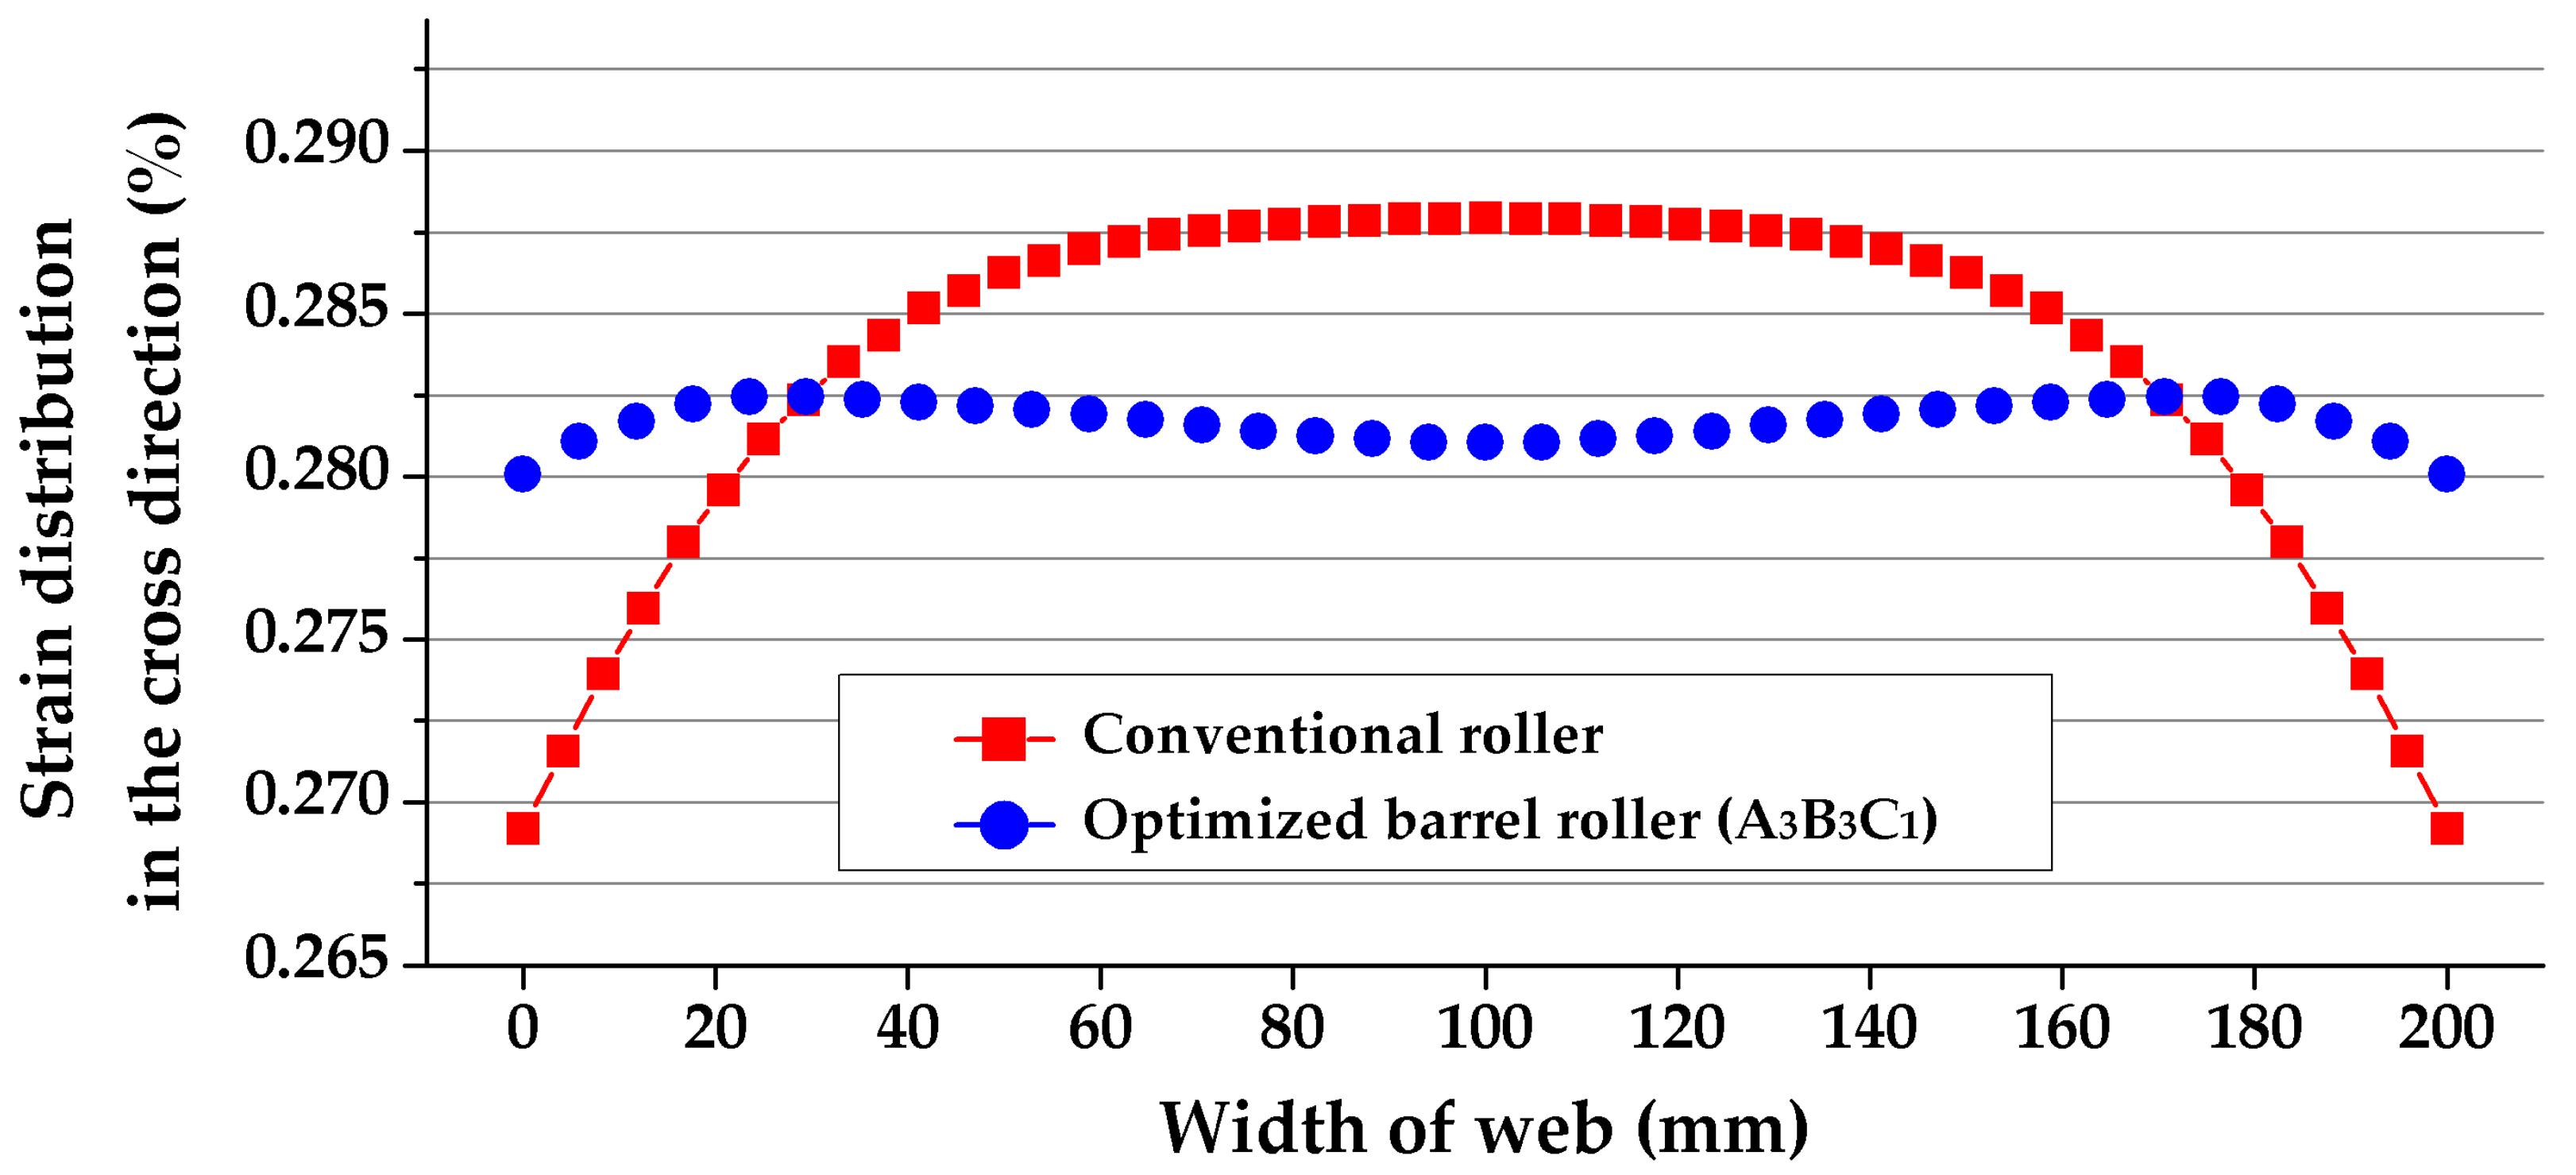
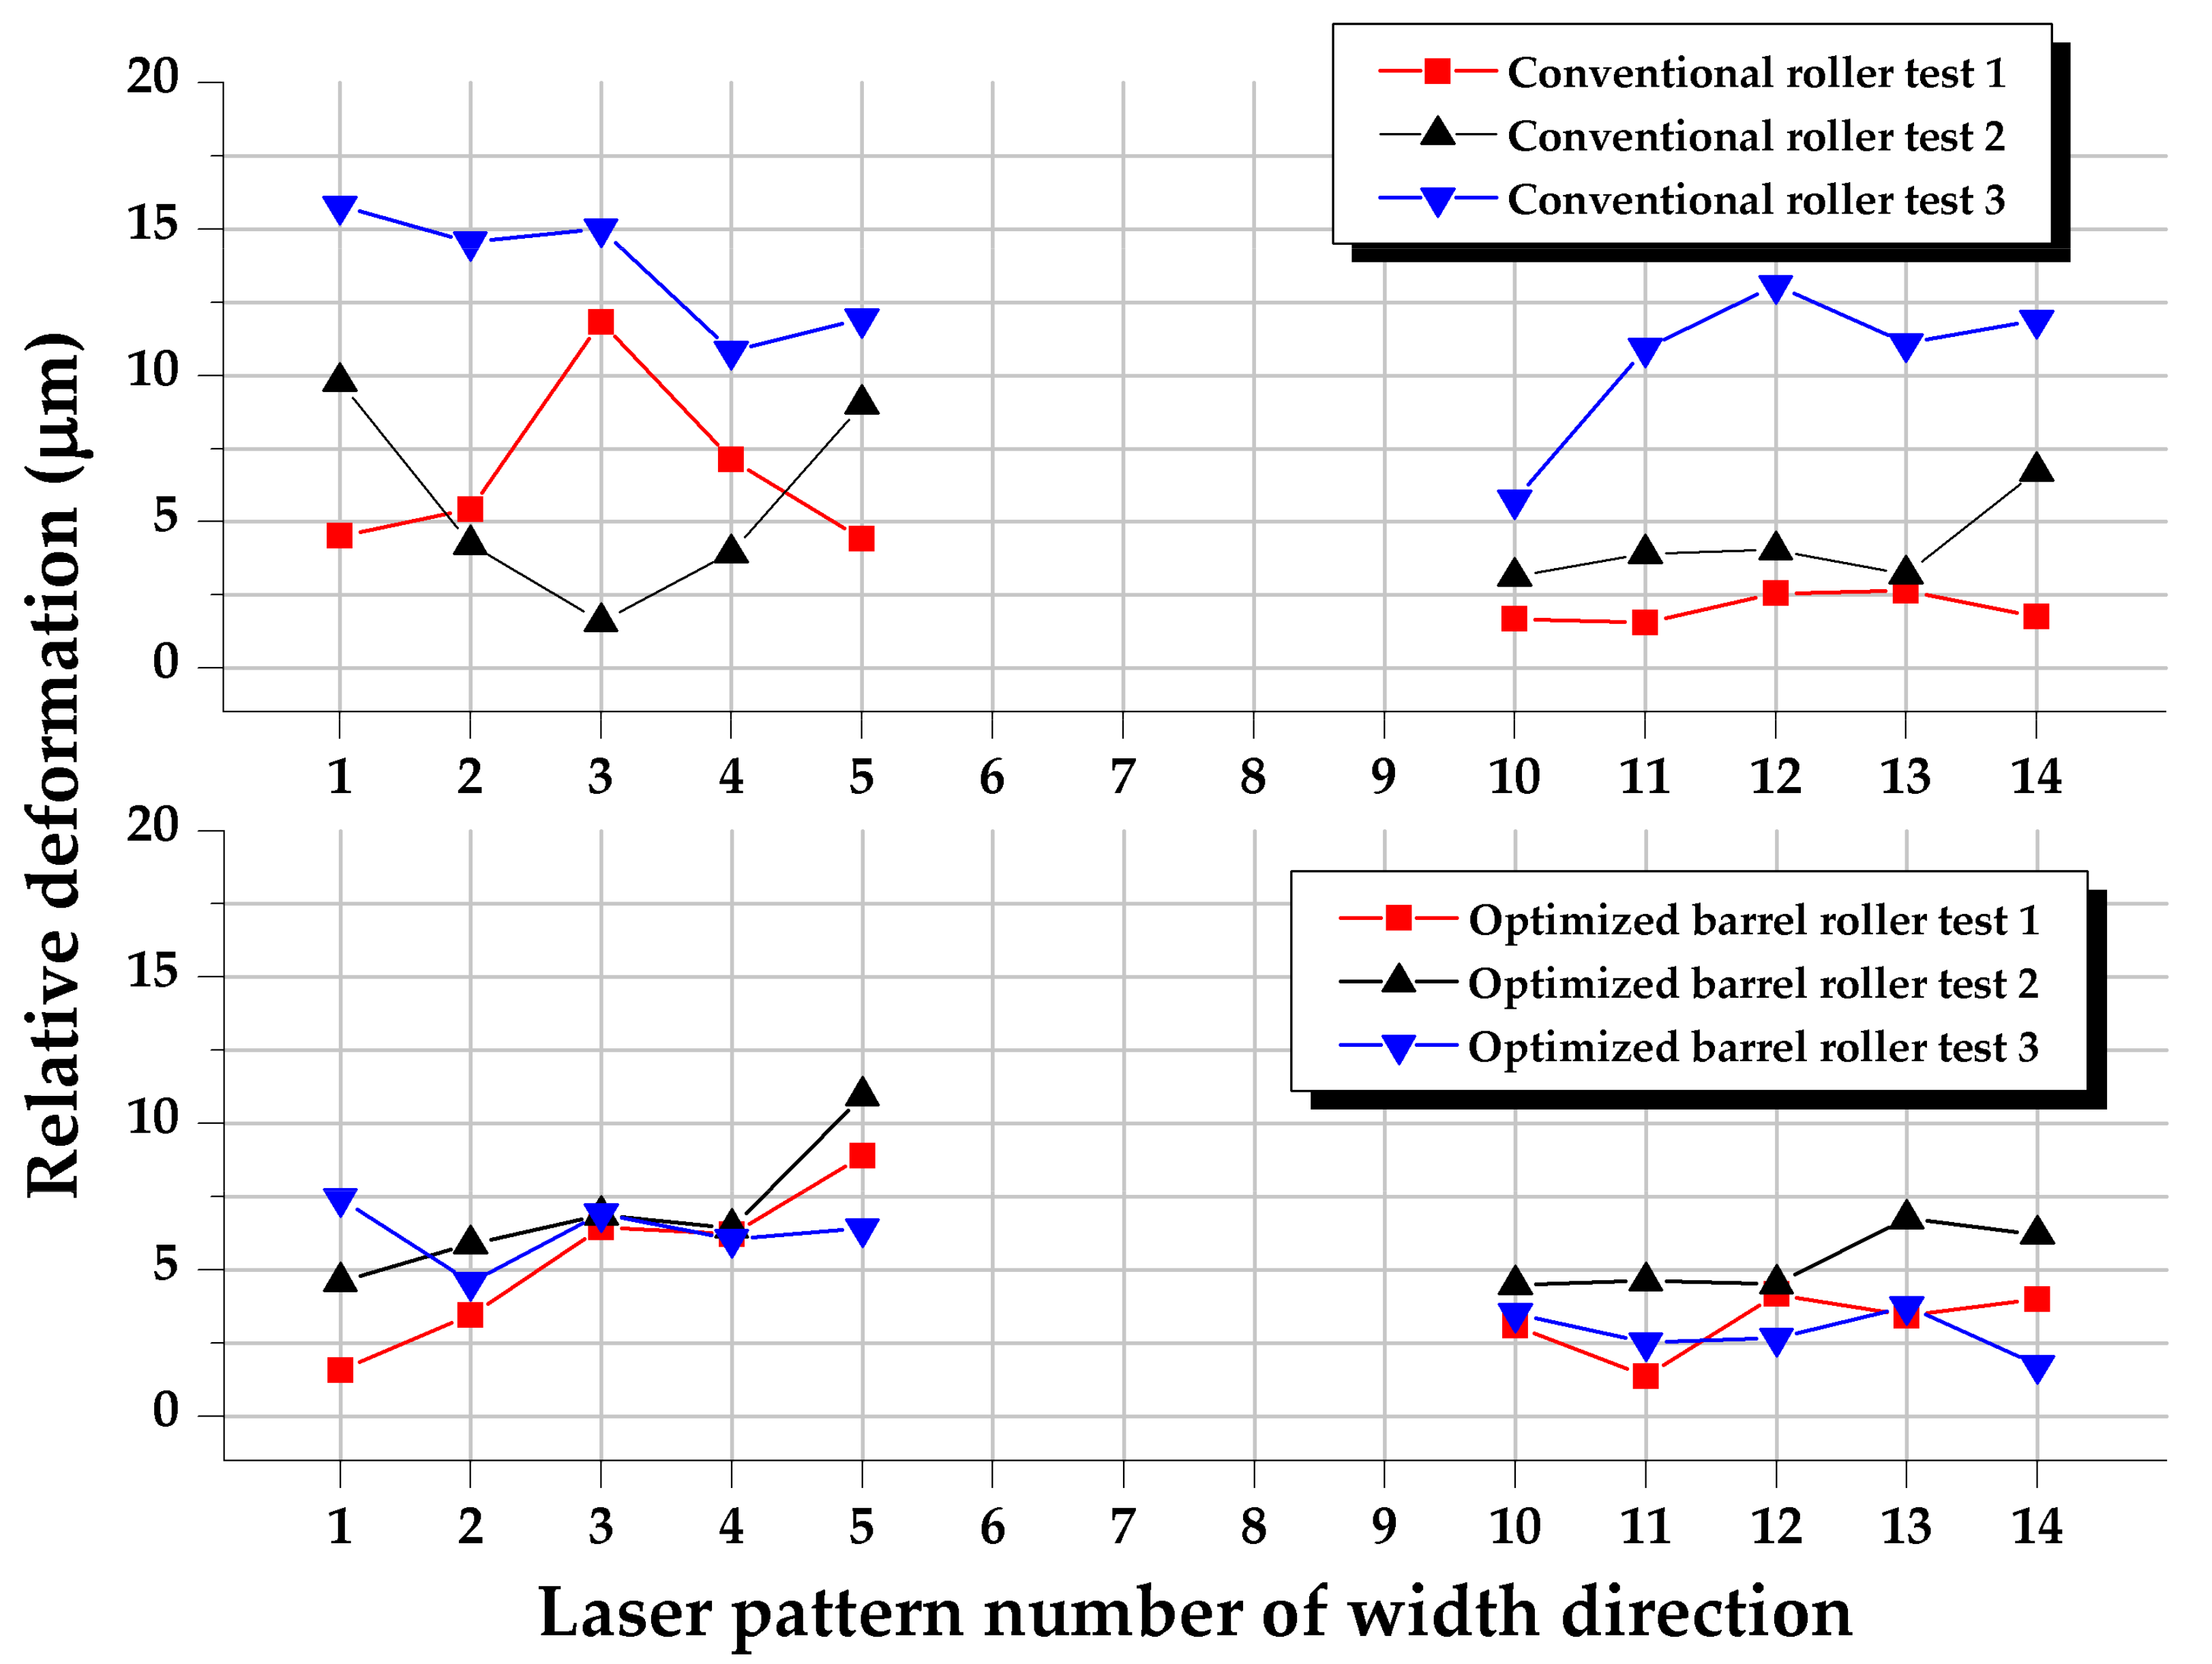
The experimental measurements of the strain deviation in the MD are shown in
Figure 16 and
Table 8.
Figure 16 shows the relative displacements in the MD under tension condition at each reference mark.
Table 8 compares the deviation in the relative displacements in the MD of each experiment. The mean deviations for the conventional and barrel rollers were 8.54 and 4.42 μm, respectively; thus, the deviation of barrel roller was 48% lower.
4.2. Comparison of Experimental and FEA Results
In the DOE-based FEA, the tension was 10 MPa. However, the experiment was conducted under 5 MPa of tension due to the maximum load limitation of the dancer roller. In addition, reference markings for measuring the MD strain deviation were already engraved under a tension of 3 MPa. This is because the web is transferred to the patterning section. Therefore, in the verification experiment, the reference position of each mark was measured under 3 MPa of tension, and the strain was calculated by measuring the position of the mark after increasing the tension to 5 MPa. To compare the MD strain deviations of the experiments and FEA under the same conditions, an FE model with a tension of 5 MPa was constructed. In the 200 mm span, the printing lines were set at distances of 50 and 150 mm from the contact point of the roller and the web. The mechanical properties used in this FEA are shown in
Table 9.
Figure 17 shows the FEA results of the strain distribution in the MD for these conditions.
The strain deviations of the conventional and optimized barrel rollers were 0.00357% and 0.0005%, respectively. For the FEA model, the relative displacements were 7.14 and 1 μm, respectively. Based on these results, the compensation performance was approximately 85%.
There are a few explanations for the mismatch between the results of the experiment and the FEA. The reference marks were not placed exactly 50 mm from the central axis of the roller in the actual experiment. Additionally, uniform tension could not be applied with the dancer roller. Moreover, the reference marks may not have been symmetrically arranged around the center of the CD of the web, the laser mark array and the central axis of the rollers were misaligned, and the properties applied in the FEA were not perfectly accurate.
5. Conclusions
In this study, we analyzed the non-uniform strain distribution in a web in the roll-to-roll process. In addition, to mitigate the uneven strain distribution, we designed an optimized roller. According to the experimental results, strain uniformity is improved by approximately 48% with the proposed design compared to the conventional roller.
If the strain distribution in the transported web is non-uniform, a register error may occur in the machine direction (MD or transfer direction) of the web, reducing the shape accuracy or position precision of the print pattern. The distribution of the strain generated in a web being transferred under uniform tension is symmetrical along the width direction (CD) of the web with respect to the centerline of the web in the MD. Around this centerline, the strain is high and decreases toward both sides of the web. This deviation decreases as the web moves away from the roller and increases with the increasing web width. Improving this uniformity is important for productivity and precision.
In this study, we designed a novel roller to minimize the strain deviation in the MD. This roller consists of a rigid core and an elastic outer skin. The core is barrel-shaped and covered with the elastic skin. The assembly is a cylinder with a constant diameter. This configuration reduces the strain deviation by changing the contact stiffness between the web and the roller.
First, we used an FE model composed of a roller and web to simulate the strain due to tension in an actual process; based on this model, we optimized the roller design. For this purpose, we varied the thickness gradient of the skin, the total diameter of the roller, and the physical properties of the skin. Using DOE and ANOVA, we optimized the design to minimize the MD strain distribution at the printing line 50 mm from the roller central axis. The total diameter of the roller interacts with the thickness gradient; in addition, the mechanical properties of the skin interact with the diameter. The barrel roller with a thickness gradient of 8 mm, a roller diameter of 60 mm, and an elastic modulus of 2.85 MPa minimizes the strain distribution.
To compare the strain distributions of the conventional and optimized barrel rollers in the MD, we conducted a verification experiment. The rollers optimized with the FEA and DOE were employed, and the experiment was repeated three times for tensions of 3–5 MPa. The conventional and barrel rollers produce deviations of 8.54 and 4.42 μm, respectively. Thus, the compensation performance is improved by 48% by the barrel roller.
Our experiments had certain limitations; the center area could not be measured due to the mechanical interference between the vision cameras. This should be fixed with a jig in the future.
Despite the experimental limitations, the strain distribution is more uniform with the optimized than with the conventional roller. This is expected to improve the printing precision of fine patterns and to mitigate register errors in the multilayer printing process. The results of this study can promote the introduction of the roll-to-roll process into the industrial fabrication processes of FPCBs and displays.
Author Contributions
Conceptualization, funding acquisition, writing—review and editing, M.G.L.; writing—original draft, data curation, formal analysis, methodology, visualization, Y.K.; investigation, Y.K. and G.E.K.; supervision, project administration, M.G.L. and Y.J.; resources, S.K.; validation, M.G.L., Y.J., and H.J. All authors have read and agreed to the published version of the manuscript.
Funding
This study is based on work supported by the Ministry of Trade, Industry, and Energy (MOTIE, Korea) under the Industrial Technology Innovation Program No. 20000665. Development of an ecofriendly and highly durable surface treatment for super-omniphobic substrate on the large area over 4 m2.
Conflicts of Interest
The authors declare no conflict of interest.
References
- Kang, H.; Lee, C.; Shin, K. A novel cross directional register modeling and feedforward control in multi-layer roll-to-roll printing. J. Process Control 2010, 20, 643–652. [Google Scholar] [CrossRef]
- Yoon, J.S.; Kim, J.; Kang, B.S. Deformation analysis and shape prediction for sheet forming using flexibly reconfigurable roll forming. J. Mater. Process. Technol. 2016, 233, 192–205. [Google Scholar] [CrossRef]
- Bui, Q.V.; Ponthot, J.P. Numerical simulation of cold roll-forming processes. J. Mater. Process. Technol. 2008, 202, 275–282. [Google Scholar] [CrossRef]
- Lif, J.O. Hygro-viscoelastic stress analysis in paper web offset printing. Finite Elem. Anal. Des. 2006, 4, 341–366. [Google Scholar] [CrossRef]
- Parola, M.; Vuorinrn, S.; Linna, H.; Kaljunen, T.; Beletski, N. Modelling the web tension profile in a paper machine. In Proceedings of the Science of Papermaking, XII Fundamental Research Symposium, Oxford, UK, 19–21 September 2001; Volume 2, pp. 759–781.
- Parola, M.; Kaljunen, T.; Vuorinrn, S. New method for the analysis of the paper web performance on the press. In Proceedings of the 27th IARIGAI Research Conference, Graz, Austria, 10–13 September 2000; pp. 203–218. [Google Scholar]
- Hu, L.; Chen, W.; Liu, Z. An active register control strategy for multilayer R2R printed electronics based on microscope vision. In Proceedings of the 13th IEEE Conference on Industrial Electronics and Applications (ICIEA), Wuhan, China, 31 May–2 June 2018. [Google Scholar]
- Jung, H.; Nguyen, H.A.D.; Choi, J.; Yim, H.; Shin, K. High-precision register error control using active-motion-based roller in roll-to-roll gravure printing. Jpn. J. Appl. Phys. 2018, 57, 05GB04. [Google Scholar] [CrossRef]
- Kang, H.; Lee, C.; Shin, K. Modeling and compensation of the machine directional register in roll-to-roll printing. Control Eng. Pract. 2013, 21, 645–654. [Google Scholar] [CrossRef]
- Chang, J.; Lee, S.; Lee, K.B.; Lee, S.; Cho, Y.T.; Seo, J.; Lee, S.; Jo, G.; Lee, K.Y.; Kong, H.S.; et al. Overlay accuracy on a flexible web with a roll printing process based on a roll-to-roll system. Rev. Sci. Instrum. 2015, 86, 55108. [Google Scholar] [CrossRef] [PubMed]
- Kim, C.; Jeon, S.W.; Kim, C.H. Reduction of Linearly Varying Term of Register Errors Using a Dancer System in Roll-to-Roll Printing Equipment for Printed Electronics. Int. J. Precis. Eng. Manuf. 2019, 20, 1485–1493. [Google Scholar] [CrossRef]
- Lee, J.; Seong, J.; Park, J.; Park, S.; Lee, D.; Shin, K.H. Register control algorithm for high resolution multilayer printing in the roll-to-roll process. Mech. Syst. Signal. Process. 2015, 60–61, 706–714. [Google Scholar] [CrossRef]
- Kim, S.; Na, Y. Study on the web deformation in ink transfer process for R2R printing application. Int. J. Precis. Eng. Manuf. 2010, 11, 945–954. [Google Scholar] [CrossRef]
- Zillmann, B.; Wagner, M.F.X.; Schmaltz, S.; Schmidl, E.; Lampke, T.; Willner, K.; Halle, T. In-plane biaxial compression and tension testing of thin sheet materials. Int. J. Solids. Struct. 2015, 66, 111–120. [Google Scholar] [CrossRef]
- Montgomery, D.C. Design and Analysis of Experiments, 8th ed.; John Wiley & Sons, Ltd.: Chichester, UK, 2012; pp. 68–73, 183–192, 206–208. [Google Scholar]
Figure 1.
Schematic of finite element (FE) model: Red lines are fixed in the machine direction (MD); the blue line represents the target printing line.
Figure 1.
Schematic of finite element (FE) model: Red lines are fixed in the machine direction (MD); the blue line represents the target printing line.
Figure 2.
MD strain distribution along the printing line with respect to the change in distance between roller and line.
Figure 2.
MD strain distribution along the printing line with respect to the change in distance between roller and line.
Figure 3.
MD strain distribution along the printing line with respect to the web width.
Figure 3.
MD strain distribution along the printing line with respect to the web width.
Figure 4.
Schematic of equipment for web strain measurement.
Figure 4.
Schematic of equipment for web strain measurement.
Figure 5.
Schematic of the web strain measurement method (top view) with a conventional roller.
Figure 5.
Schematic of the web strain measurement method (top view) with a conventional roller.
Figure 6.
Strain measurement results along the cross direction (CD) of conventional roller.
Figure 6.
Strain measurement results along the cross direction (CD) of conventional roller.
Figure 7.
Compensation rollers for minimizing the non-uniform strain.
Figure 7.
Compensation rollers for minimizing the non-uniform strain.
Figure 8.
Interaction analysis for the two-way factorial design.
Figure 8.
Interaction analysis for the two-way factorial design.
Figure 9.
Sensitivity analysis considering interactions based on factor levels in
Table 2.
Figure 9.
Sensitivity analysis considering interactions based on factor levels in
Table 2.
Figure 10.
Sensitivity analysis considering interactions based on factor levels in
Table 4.
Figure 10.
Sensitivity analysis considering interactions based on factor levels in
Table 4.
Figure 11.
Comparison of strain distribution in the cross direction: Conventional versus optimized barrel roller.
Figure 11.
Comparison of strain distribution in the cross direction: Conventional versus optimized barrel roller.
Figure 12.
Comparison of total deformation results: Conventional versus optimized barrel roller.
Figure 12.
Comparison of total deformation results: Conventional versus optimized barrel roller.
Figure 13.
Optimized barrel roller fabricated with final design parameters.
Figure 13.
Optimized barrel roller fabricated with final design parameters.
Figure 14.
Schematic of web strain measurement (top view) with a barrel roller.
Figure 14.
Schematic of web strain measurement (top view) with a barrel roller.
Figure 15.
Experimental setup for strain measurement: linear motion (LM) guide and four vision cameras.
Figure 15.
Experimental setup for strain measurement: linear motion (LM) guide and four vision cameras.
Figure 16.
Comparison between relative displacements of conventional and optimized barrel rollers. The laser pattern number is an index in
Figure 14. The spacing between the laser pattern numbers is 10 mm.
Figure 16.
Comparison between relative displacements of conventional and optimized barrel rollers. The laser pattern number is an index in
Figure 14. The spacing between the laser pattern numbers is 10 mm.
Figure 17.
Comparison of FEA between the existing roller and barrel roller derived by calculating the MD strain distribution under 3 MPa of tension and then changing the tension to 5 MPa.
Figure 17.
Comparison of FEA between the existing roller and barrel roller derived by calculating the MD strain distribution under 3 MPa of tension and then changing the tension to 5 MPa.
Table 1.
Mechanical properties in the finite element analysis (FEA).
Table 1.
Mechanical properties in the finite element analysis (FEA).
| | Young’s Modulus | Mass Density | Poisson’s Ratio |
|---|
| E (GPa) | ρ (kg/m3) | - |
|---|
| Roll (aluminum) | 71 | 2,770 | 0.33 |
| Web (PET) | 3.5 | 1,320 | 0.34 |
Table 2.
Design factors and initial levels of each factor.
Table 2.
Design factors and initial levels of each factor.
| Sort | Factor | Level |
|---|
| 1 | 2 | 3 |
|---|
| Control factor | A (mm) | Thickness gradient of skin | 3 | 6 | 9 |
| B (mm) | Outer diameter of roller | 40 | 60 | 80 |
| C (MPa) | Young’s modulus of skin | 2.85 | 7.85 | 12.85 |
Table 3.
Orthogonal array for interaction analysis.
Table 3.
Orthogonal array for interaction analysis.
| No. | Factor |
|---|
| A | B | AB | AB | C | AC | AC | BC | ABC | ABC | BC | ABC | ABC |
|---|
| Column |
|---|
| 1 | 2 | 3 | 4 | 5 | 6 | 7 | 8 | 9 | 10 | 11 | 12 | 13 |
|---|
| 1 | 1 | 1 | 1 | 1 | 1 | 1 | 1 | 1 | 1 | 1 | 1 | 1 | 1 |
| 2 | 1 | 1 | 1 | 1 | 2 | 2 | 2 | 2 | 2 | 2 | 2 | 2 | 2 |
| 3 | 1 | 1 | 1 | 1 | 3 | 3 | 3 | 3 | 3 | 3 | 3 | 3 | 3 |
| 4 | 1 | 2 | 2 | 2 | 1 | 1 | 1 | 2 | 2 | 2 | 3 | 3 | 3 |
| 5 | 1 | 2 | 2 | 2 | 2 | 2 | 2 | 3 | 3 | 3 | 1 | 1 | 1 |
| 6 | 1 | 2 | 2 | 2 | 3 | 3 | 3 | 1 | 1 | 1 | 2 | 2 | 2 |
| 7 | 1 | 3 | 3 | 3 | 1 | 1 | 1 | 3 | 3 | 3 | 2 | 2 | 2 |
| 8 | 1 | 3 | 3 | 3 | 2 | 2 | 2 | 1 | 1 | 1 | 3 | 3 | 3 |
| 9 | 1 | 3 | 3 | 3 | 3 | 3 | 3 | 2 | 2 | 2 | 1 | 1 | 1 |
| 10 | 2 | 1 | 2 | 3 | 1 | 2 | 3 | 1 | 2 | 3 | 1 | 2 | 3 |
| 11 | 2 | 1 | 2 | 3 | 2 | 3 | 1 | 2 | 3 | 1 | 2 | 3 | 1 |
| 12 | 2 | 1 | 2 | 3 | 3 | 1 | 2 | 3 | 1 | 2 | 3 | 1 | 2 |
| 13 | 2 | 2 | 3 | 1 | 1 | 2 | 3 | 2 | 3 | 1 | 3 | 1 | 2 |
| 14 | 2 | 2 | 3 | 1 | 2 | 3 | 1 | 3 | 1 | 2 | 1 | 2 | 3 |
| 15 | 2 | 2 | 3 | 1 | 3 | 1 | 2 | 1 | 2 | 3 | 2 | 3 | 1 |
| 16 | 2 | 3 | 1 | 2 | 1 | 2 | 3 | 3 | 1 | 2 | 2 | 3 | 1 |
| 17 | 2 | 3 | 1 | 2 | 2 | 3 | 1 | 1 | 2 | 3 | 3 | 1 | 2 |
| 18 | 2 | 3 | 1 | 2 | 3 | 1 | 2 | 2 | 3 | 1 | 1 | 2 | 3 |
| 19 | 3 | 1 | 3 | 2 | 1 | 3 | 2 | 1 | 3 | 2 | 1 | 3 | 2 |
| 20 | 3 | 1 | 3 | 2 | 2 | 1 | 3 | 2 | 1 | 3 | 2 | 1 | 3 |
| 21 | 3 | 1 | 3 | 2 | 3 | 2 | 1 | 3 | 2 | 1 | 3 | 2 | 1 |
| 22 | 3 | 2 | 1 | 3 | 1 | 3 | 2 | 2 | 1 | 3 | 3 | 2 | 1 |
| 23 | 3 | 2 | 1 | 3 | 2 | 1 | 3 | 3 | 2 | 1 | 1 | 3 | 2 |
| 24 | 3 | 2 | 1 | 3 | 3 | 2 | 1 | 1 | 3 | 2 | 2 | 1 | 3 |
| 25 | 3 | 3 | 2 | 1 | 1 | 3 | 2 | 3 | 2 | 1 | 2 | 1 | 3 |
| 26 | 3 | 3 | 2 | 1 | 2 | 1 | 3 | 1 | 3 | 2 | 3 | 2 | 1 |
| 27 | 3 | 3 | 2 | 1 | 3 | 2 | 1 | 2 | 1 | 3 | 1 | 3 | 2 |
Table 4.
Modified factor levels for determining the global minimum.
Table 4.
Modified factor levels for determining the global minimum.
| | A (mm) | B (mm) | C (MPa) |
|---|
| Level 1 | 6 | 40 | 2.85 |
| Level 2 | 7 | 50 | 7.85 |
| Level 3 | 8 | 60 | 12.85 |
Table 5.
ANOVA results derived after performing FEA by applying the orthogonal array in
Table 3 and the modified factor levels in
Table 4.
Table 5.
ANOVA results derived after performing FEA by applying the orthogonal array in
Table 3 and the modified factor levels in
Table 4.
| Factor | SS | DF | MS | F |
|---|
| A | 8.13 × 10⁻¹⁰ | 2 | 4.07 × 10⁻¹⁰ | 44.68 |
| B | 2.01 × 10⁻¹⁰ | 2 | 1.00 × 10⁻¹⁰ | 11.02 |
| C | 2.70 × 10⁻⁹ | 2 | 1.35 × 10⁻⁹ | 148.51 |
| AB | 2.07 × 10⁻⁹ | 4 | 5.18 × 10⁻¹⁰ | 56.94 |
| AC | 4.72 × 10⁻¹² | 4 | 1.18 × 10⁻¹² | 0.13 |
| BC | 1.91 × 10⁻⁹ | 4 | 4.78 × 10⁻¹⁰ | 52.57 |
| E | 7.28 × 10⁻¹¹ | 8 | 9.10 × 10⁻¹² | − |
| T | 7.78 × 10⁻⁹ | 26 | − | − |
Table 6.
ANOVA results after pooling the A × C factor with an F value less than 1 into the error term.
Table 6.
ANOVA results after pooling the A × C factor with an F value less than 1 into the error term.
| Factor | SS | DF | MS | F |
|---|
| A | 8.13 × 10⁻¹⁰ | 2 | 4.07 × 10⁻¹⁰ | 39.55 |
| B | 2.01 × 10⁻¹⁰ | 2 | 1.00 × 10⁻¹⁰ | 9.75 |
| C | 2.70 × 10⁻⁹ | 2 | 1.35 × 10⁻⁹ | 131.45 |
| AB | 2.07 × 10⁻⁹ | 4 | 5.18 × 10⁻¹⁰ | 50.40 |
| BC | 1.91 × 10⁻⁹ | 4 | 4.78 × 10⁻¹⁰ | 46.53 |
| E | 7.28 × 10⁻¹¹ | 12 | 1.03 × 10⁻¹¹ | - |
| T | 7.78 × 10⁻⁹ | 26 | - | - |
Table 7.
Two-way factorial table based on levels in
Table 4.
Table 7.
Two-way factorial table based on levels in
Table 4.
| | A1 | A2 | A3 | C1 | C2 | C3 |
|---|
| B1 | 0.0096 | 0.0110 | 0.0214 | 0.0154 | 0.0122 | 0.0144 |
| B2 | 0.0142 | 0.0165 | 0.0154 | 0.0106 | 0.0152 | 0.0202 |
| B3 | 0.0141 | 0.0134 | 0.0127 | 0.0069 | 0.0133 | 0.0200 |
Table 8.
Deviation of relative displacement in each experiment: Conventional versus optimized barrel roller.
Table 8.
Deviation of relative displacement in each experiment: Conventional versus optimized barrel roller.
| | Test No. | Deviation (μm) | Mean of Deviation (μm) |
|---|
Conventional
roller | 1 | 10.31 | 8.54 |
| 2 | 7.14 |
| 3 | 8.18 |
Barrel
roller | 1 | 5.38 | 4.42 |
| 2 | 3.79 |
| 3 | 4.09 |
Table 9.
Mechanical properties applied to FEA to simulate the MD strain deviation of the web under the same tension conditions as the experiment.
Table 9.
Mechanical properties applied to FEA to simulate the MD strain deviation of the web under the same tension conditions as the experiment.
| | Young’s Modulus | Mass Density | Poisson’s Ratio |
|---|
| E (GPa) | ρ (kg/m3) | - |
|---|
| Roll (aluminum) | 71 | 2,770 | 0.33 |
| Silicon rubber (skin) | 0.00285 | 1,200 | 0.5 |
| Web (PET) | 3.5 | 1,320 | 0.34 |
| Publisher’s Note: MDPI stays neutral with regard to jurisdictional claims in published maps and institutional affiliations. |
© 2020 by the authors. Licensee MDPI, Basel, Switzerland. This article is an open access article distributed under the terms and conditions of the Creative Commons Attribution (CC BY) license (http://creativecommons.org/licenses/by/4.0/).


