Article

Capabilities and Limitations of Using Desktop 3-D Printers in the Laser Sintering Process

by
Michał Olejarczyk
*,
Piotr Gruber
and
Grzegorz Ziółkowski
Faculty of Mechanical Engineering, Centre for Advanced Manufacturing Technologies (CAMT/FPC), Wroclaw University of Science and Technology, 50-371 Wrocław, Poland
*
Author to whom correspondence should be addressed.
Appl. Sci. 2020, 10(18), 6184; https://doi.org/10.3390/app10186184
Submission received: 30 July 2020 / Revised: 28 August 2020 / Accepted: 2 September 2020 / Published: 5 September 2020
(This article belongs to the Section Mechanical Engineering)

Abstract

:
Almost one-third of the revenues of the Additive Manufacturing (AM) machines market is generated by desktop systems. A new category of such devices are Laser Sintering (LS) machines, in which we can find a few representatives of this group. A growing interest in the use of desktop AM solutions in research and industry is visible, and therefore an evaluation of its capabilities and limitations is desirable. The presented paper focuses on comparing desktop (Sintratec S1; Sinterit Lisa) and industrial (Formiga P110) LS systems. The properties of raw materials were characterized by Scanning Electron Microscopy (SEM) and Differential Scanning Calorimetry (DSC), as well as by determining the Particle Size Distribution (PSD) and static and dynamic flowability of powder. Laser Sintering commercial sets were characterized by their mechanical properties (tensile strength), surface quality (roughness), as well as by their accuracy and porosity (computed tomography). The conducted test showed significant differences, especially in the case of material properties and manufacturing repeatability. The found differences between desktop and industrial LS systems suggest that the use of a low-budget LS system, especially for the research and production of end-use parts, has to take into account its limitations.

1. Introduction

Laser Sintering (LS), or Selective Laser Sintering (SLS), is one of the major polymer-based Additive Manufacturing (AM) technologies, and has been developing for over 30 years [1,2,3]. In laser sintering, parts are built up layer by layer based on a 3D CAD model. The process starts from an empty platform that is lowered by the thickness of a single layer. Powder is then spread across by a roller or a recoater, preheated and then melted by a laser beam along a corresponding cross-section. This sequence is repeated until the part is completed. This technology does not require the use of support structures, because the unfused powder fulfils that role. Currently, the area of LS process applications covers the manufacturing of prototypes, as well as fully functional end-use parts.
There is no unambiguous definition of desktop 3D printers, which can also be referred to as personal or low-cost 3D printers. The price criterion is most often taken into account when describing this market segment, which is under USD 5000. The division between “industrial” and “desktop” systems was established when the first low-cost RepRap machines were commercialized. Since then, this difference has become blurred. The predominant process for this category is material extrusion (FDM—Fused Deposition Modeling/FFF—Fused Filament Fabrication), but there are examples for vat photopolymerization (SL—Stereolithography and DLP—Digital Light Processing) and powder bed fusion (LS) [4]. Nowadays, desktop 3D printing is responsible for almost one-third of the revenues of all AM machines (30.5%, which was USD 610.5 million in 2017) [5]. Since the end of January 2014, a patent that protected LS machines expired, which resulted in more manufacturers entering the market of polymer laser sintering [6]. A relatively new category of devices, based on LS technology, is desktop solutions, which are characterized by their low purchase price (<EUR 25,000)—even tenfold lower when compared to industrial solutions. Although they are based on the same principles of operation as the industrial versions, they show differences in the complexity of individual systems, the quality of produced models, the stability of the process, and the variety of materials that can be used. This is especially the case when taking into account the noticeable differences in the obtained results of production between industrial and desktop devices—only the first ones are known to meet specific functional requirements. A few desktop 3D printers are currently available on the market, e.g., S1 (Sintratec, Brugg, Switzerland), Lisa (Sinterit, Krakow, Poland), SnowWhite (Sharebot, Nibionno, Italy), VIT SLS (Natural Robotics, Barcelona, Spain) and Red Rock (Red Rock 3D, Moscow, Russia). The main difference in the construction of desktop devices relates to the type of laser, the control system, and the size of the processing chamber [7] (Table 1). The use of a diode laser, instead of a CO2 laser, significantly reduces the cost of the device, but the low radiation energy available for this solution is unsuitable for organic polymers in the spectral range. This requires special material mixtures that enhance energy absorption in order to reach an adequate level for melting a specific material [8]. The materials most commonly used for a desktop machine are PA 12 and flexible TPU/TPE. LS-desktop devices can not only be used for prototypes, but also for tooling. It is more and more noticeable that solutions of this type can be part of modular production systems that allow the production of end parts on a larger scale.
Kinstlinger et al. [9] described the development of a low-cost, open-source LS system (OpenSLS) using nylon and polycaprolactone (PCL). In [7], Chatham el al. consider the use of low-cost 3D printers based on LS technology to perform three-dimensional (3D) surgical modelling in reconstructive surgery. Regarding medical applications, an attempt was also made to manufacture orally disintegrating tablets based on two polymers: hydroxypropyl methylcellulose (HPMC E5, JRS PHARMA, Rosenberg, Germany) and vinylpyrrolidonevinyl acetate copolymer (Kollidon® VA 64, BASF, Callanish, UK) mixed with paracetamol. A desktop 3D Printer (Sintratec Kit, Brugg, Switzerland) was used for this purpose [10]. However, a LS desktop is not only used in medical applications. Desktop solutions were considered in the production of spare parts for aviation. One scenario presented by Siavash et al. involved the use of Norge Ice 9 and Ice 1 (Norge Systems acquired by Prodways in 2015) [11]. Płatek et al. presented the analysis of the influence of gradient topology on the deformation process of the cellular structure, which was achieved based on a Lisa 3D printer and polyamide material [12].
To the best of our knowledge, no benchmarking of desktop laser sintering devices has been reported in the academic literature to date. The determination of the capabilities and limitations of desktop devices was conducted. Noteworthy is the complex evaluation of polyamide powders (morphology, thermal, particle size distribution, and flowability), including not only static flowability properties, but also dynamic flowability testing, which has not been presented in the literature yet. Despite the properties of the LS process, PA12 is reported in the literature, and the comparison of industrial and desktop LS machines are not presented in the academic literature, especially considering a complex approach including the mechanical properties, roughness, dimensional accuracy and porosity analysis. The presented research allows an in-depth comparison of the capabilities and limitations of the most popular processing methods of LS materials.

2. Materials and Methods

2.1. Materials

The materials that were investigated in this work are commercially available PA12 powders supplied by device manufacturers: PA2200 (EOS, Krailling, Germany), PA12 Smooth (Sinterit, Krakow, Poland) and PA12 Black (Sintratec, Brugg, Switzerland). The results obtained for the PA2200 material are treated as a reference. The materials were used as received from the suppliers.

2.2. Machines (Parameters)

Commercial machines, when compared to desktop ones, stand out in terms of their design, hardware, and system. In the case of the conducted comparison, one should look at elements such as the working volume, laser type and its maximum power, used heating system and its maximum possible temperatures, available layer thicknesses, or the method of applying the powder. All the above-mentioned comparison parameters could affect the accuracy, durability and manufactured elements. Basic data regarding the machines are presented in Table 1 in order to facilitate the comparison of these LS systems, i.e., Formiga P110, Lisa and S1.
The manufacturing processes were prepared with software that was dedicated to each machine. The devices were tested when processing with the most popular material used in LS technology, which is PA12. Refreshed powder was used, with the mixing ratio being set according to each manufacturer’s instructions. The parameters that were used to produce the parts were standard (provided by the manufacturer) and are shown in Table 2. Each manufacturing process was as similar as possible and contained only test samples.

2.3. Scanning Electron Microscopy

The powder’s morphology was characterized by scanning electron microscopy (Zeiss SEM EVO MA25, Zeiss, Oberkochen, Germany). For a high-resolution analysis, the samples were covered with Au (sputter current: 40 mA, sputter time: 50 s) using the Quorum machine. The obtained images were used to compare the morphology of the tested powders as an addition to the subsequent analysis of the particle size distribution.

2.4. Powder Flowability

Two methods were used to assess the flowability of the powder: quasi-static (Hausner Ratio, HR) and dynamic (Revolution Powder Analyze). These methods describe the behavior of the powder in the process conditions very well.
The ratio of the tap and bulk density provides a statement on the flowability of powders, and is called the “Hausner Ratio (HR)” [16]. A practical equation widely used to evaluate flow properties can be given by the following equation, which calculates powder volume changes in a graduated cylinder after a certain period of taps [17]:
H R = ρ n ρ 0 = V o V n
where n is the number of taps provided to the sample, ρn and ρ0 are the tapped and loose bulk density, and V0 and Vn are the loose and tapped volume, respectively. The determination of the bulk and the tapped density is described by norms: ISO 3953 and ASTM D7481. The test was performed using the tap density tester ETD-1020 (Electrolab, Mumbai, India). Compaction of the powder in a measuring cylinder with a volume of 100 mL took place under its weight by cyclical tapping—a constant value of 14 ± 2 mm with a frequency of 5 Hz. Loosely filled powder up to the level of 50 mL was precompacted after 500 taps. In the next cycle, tapping was continued, 750 and 1250 times, until the indicated volume difference was less than 2% of the previous measurement. This procedure was repeated three times for each powder (each done with a new powder sample).
One of the dynamic methods of quantitative evaluation of powder flowability is the so-called Revolution Powder Analysis (RPA) [8]. This measurement corresponds approximately to the loading by the LS application tools (roller or blade). In this method, the drum with an inner diameter of 84 mm and a width of 20 mm rotates around its axis at an angular velocity ranging from 2 to 60 rpm. The transparent sidewalls allow the observation of the powder behavior inside, which can be captured by the image vision system [18]. This method allows for the measurement of the first avalanche angle (AA), flowing angle (αf) and dynamic cohesive index (σf). The avalanche angle describes the angle at which the powder reaches the highest potential energy (the highest point) in the drum just before the loss of stability—visible as an avalanche [8]. The avalanche behavior of a powder sample can be used as a good predictor of powder flowability for powders that are not too cohesive [19]. The first avalanche angle is measured by image analysis at a low rotational speed, and the flowing angle is measured at a variable rotational speed. In general, a low value of these factors corresponds to a good flowability [20,21]. In this test, one rotating speed (1 rpm speed) was used for the first avalanche angle, and 9 different rotating speeds between 2 and 60 rpm were used, both at an increasing and decreasing angular velocity, for the flowing angle. A total of 25 images were taken for each rotation speed, separated by 1.0 s. Based on the recorded images, the average position of the powder/air interface and the fluctuations around this value were tracked. The dynamic cohesive index only refers to the cohesive forces acting between the grains [20]. It is assumed that an increase in the cohesiveness of the powder leads to a corresponding increase in the cohesive index. The device used to perform the present study was the GranuDrum (GranuTools, Awans, Belgium). The drum for each batch was half-filled with powder (roughly 55 mL). An angular velocity of 30 rpm was taken as the comparative value, which corresponds to the average recoater speed in the LS machine of 125 mm/s (Formiga P110).
The powders were investigated using both methods under the same moisture conditions (40% relative humidity (RH) and 20 °C).

2.5. Particle Size Distribution

The powder’s morphology is an important factor regarding the raw material for every powder bed fusion process. Generally, a smaller particle size with a more regular shape and narrow particle size distribution is more favourable when it comes to improving the manufacturing accuracy [22].
The powder’s particle size and its distribution were measured using dry laser diffraction spectroscopy (Sympatec, HELOS/BR 4470 C, RODOS/T4, R4, Clausthal-Zellerfeld, Germany) with a measurement range of 0.1 ÷ 875 µm according to the ISO 13220-1 standard. The dispersing method was set at 2 bar and used a vibration material feeder (feed rate was set to 100%, gap width was 3.5 mm). Particle D50 is considered to be the average particle diameter by volume (50%). D10 and D90 were also determined, as well as the percentage participation of particles below 10 and 90 µm. Additionally, the span was calculated based on Equation (2):
S p a n = D 90 D 10 D 50

2.6. Differential Scanning Calorimetry

The powder’s thermal properties were determined with Differential Scanning Calorimetry (DSC) using a DSC 204 F1 Phoenix device (NETZSCH-Gerätebau GmbH, Selb, Germany). The test was carried out in accordance with the ISO 11357-1:2016-11 standard. Each powder sample weighed in the range of 3 to 5 mg and was heated from room temperature to a temperature well above the melting point of the material at a constant speed of 20 K/min under a nitrogen protective atmosphere.
The thermographs, along with the melting and crystallization temperature, were determined. On this basis, the processing temperature ranges of semicrystalline polymers (such as PA12) were determined. The difference between the onset temperatures of melting and crystallization (ΔT = (Tm –Tc)onset) were determined, which is commonly specified as the processing window [23].

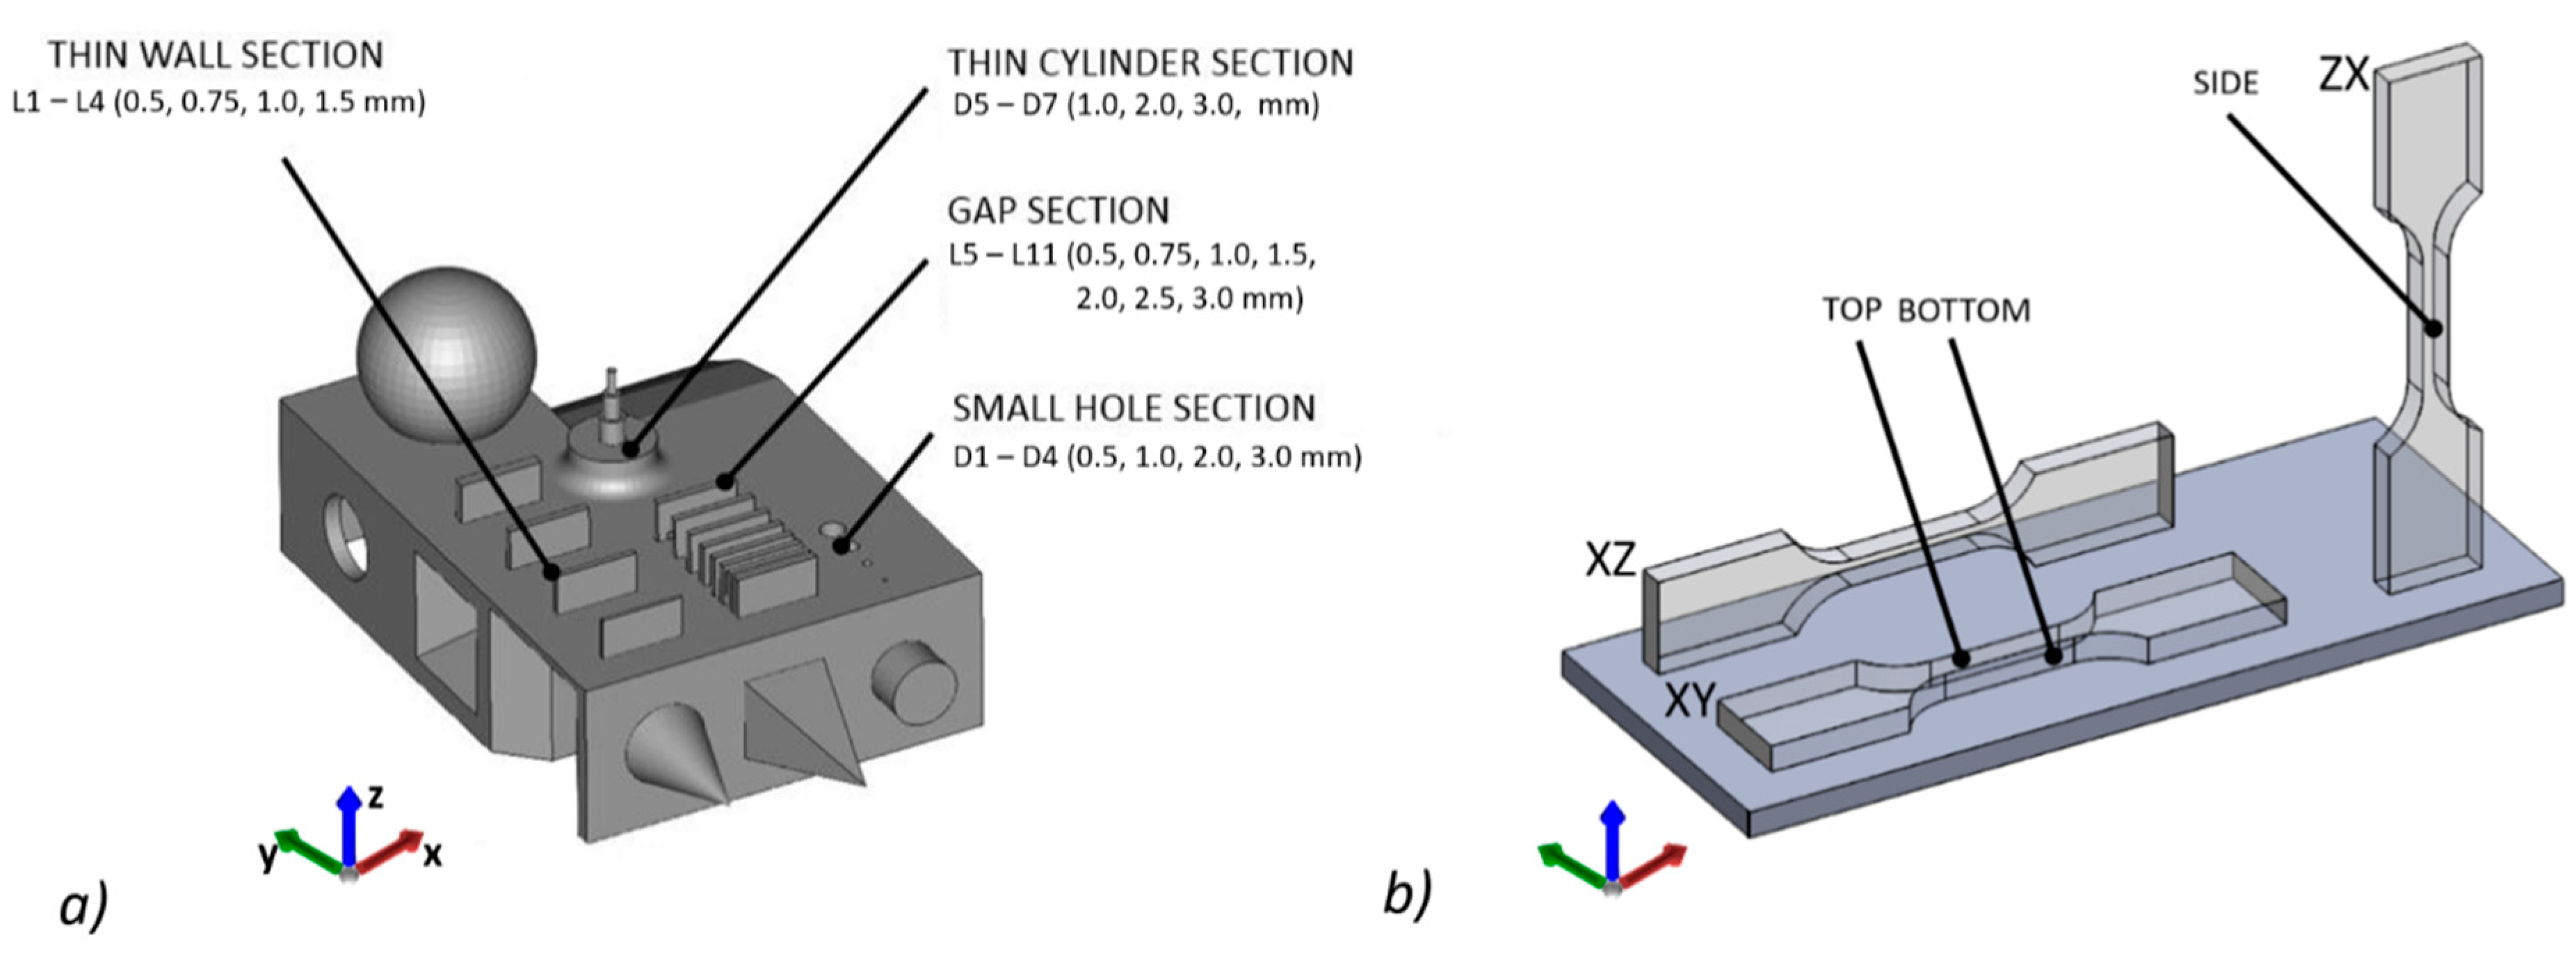
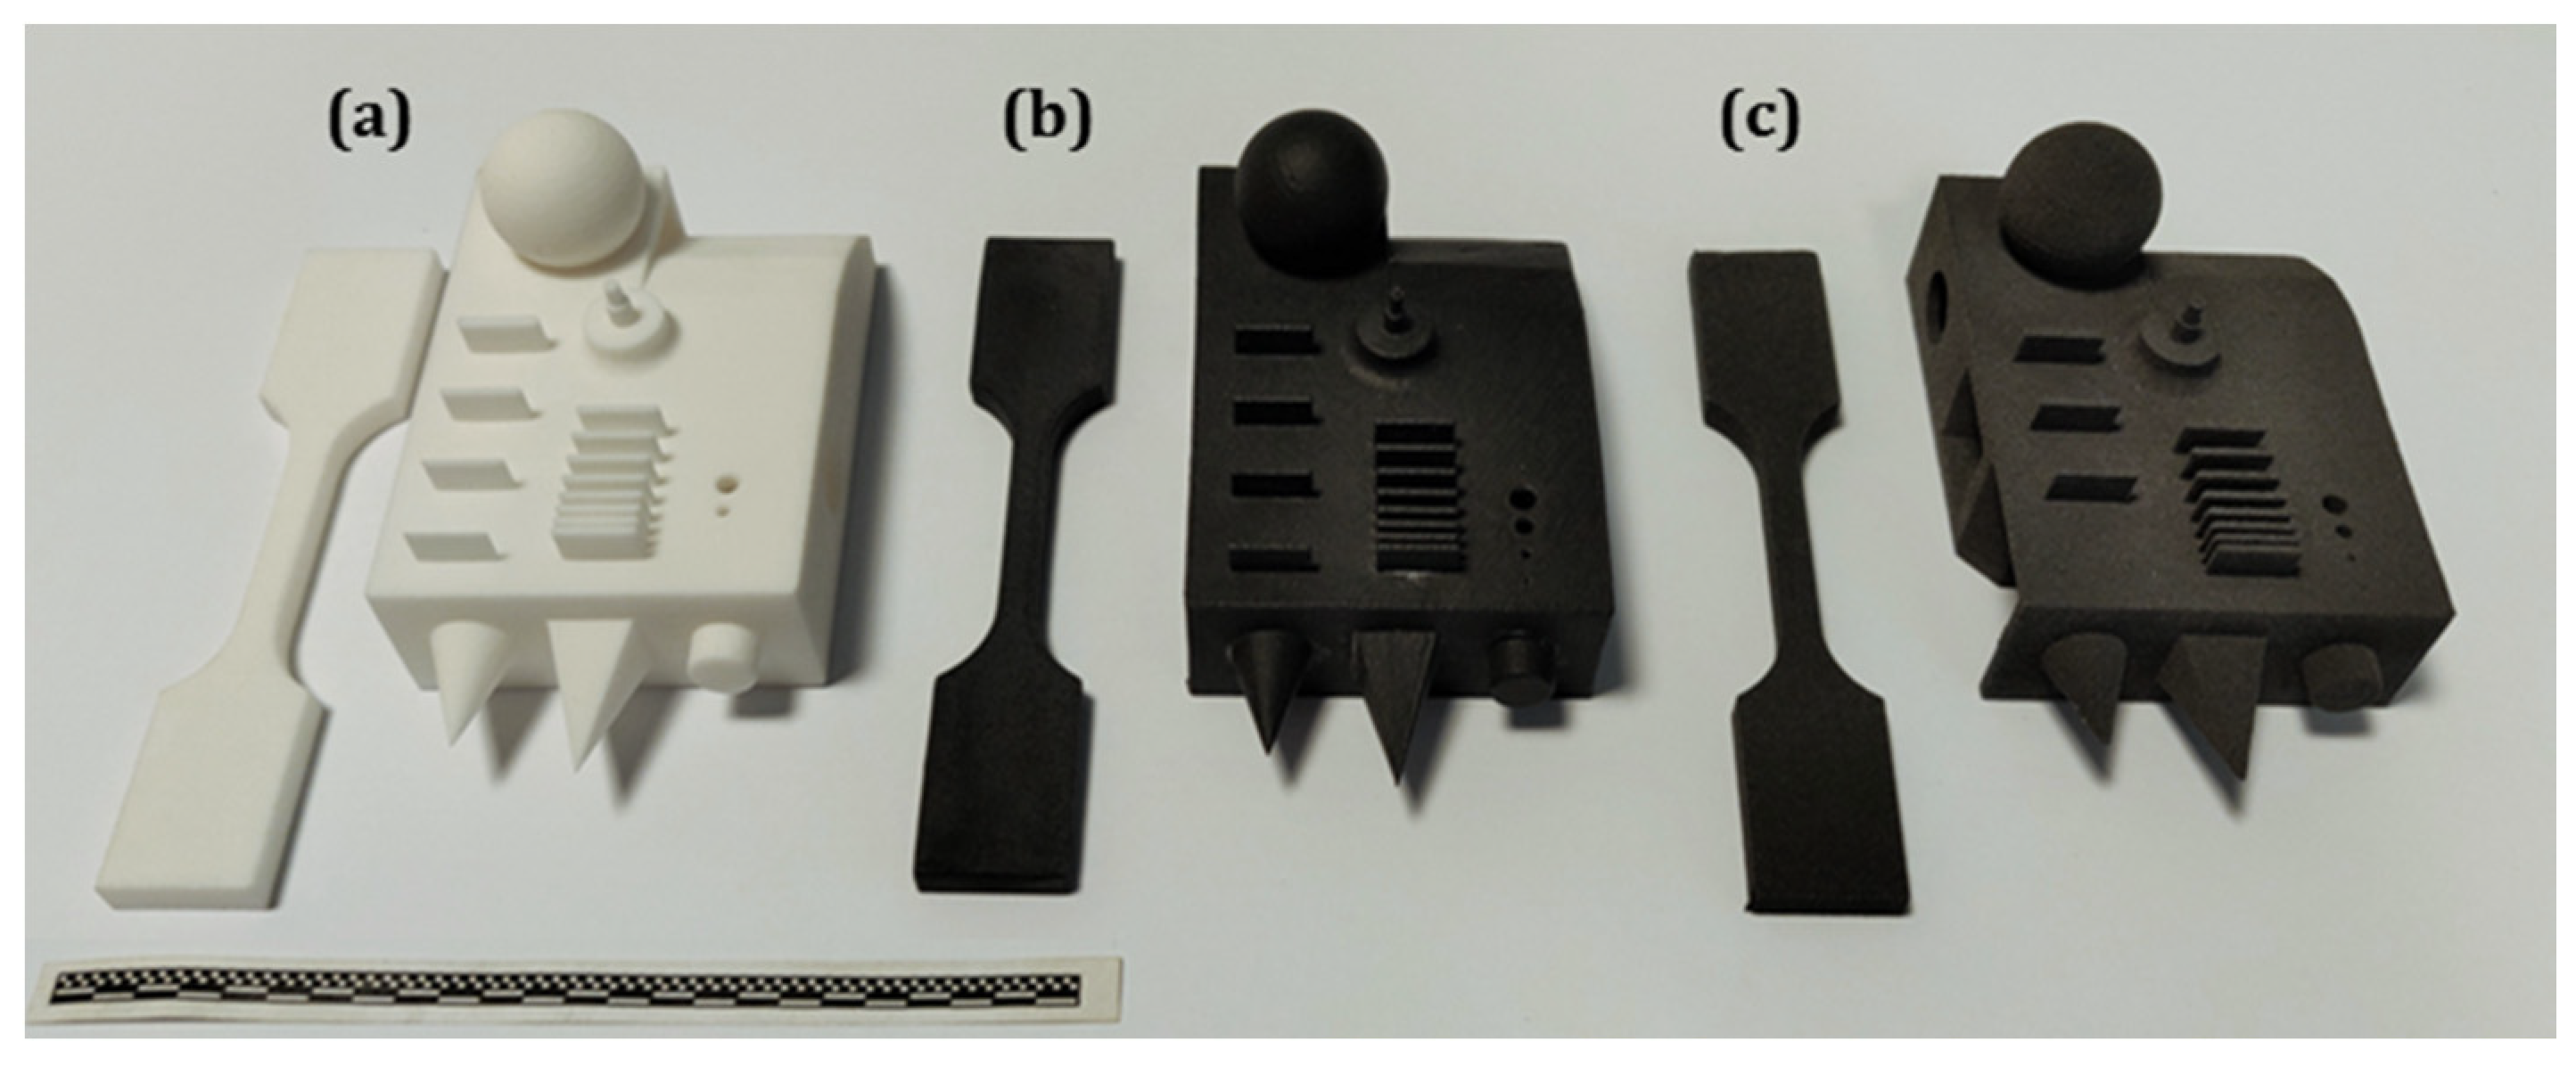
2.7. Benchmark Geometry

The test sample, the benchmark geometry of which is shown in Figure 1a, was designed to verify the manufacturing limitations of each machine, as well as to aid the comparison of accuracy using industrial computed tomography. The specimen includes basic geometrical shapes such as a cone, sphere, fillets and chamfers, different thin walls, and holes. The mentioned features, due to the layer-by-layer manner of the material addition process, are nontrivial to manufacture. Geometrical shapes can also be measured including the dimensional accuracy, warping, deviations and tolerances, which can be observable due to the difference between the hardware and software of the tested systems.

2.8. Mechanical Testing

Dog bone-shaped tensile specimens were prepared according to ASTM E8/E8M–11, and manufactured using each machine with three orientations in build volume—XY, XZ, ZX, as defined in ISO/ASTM52921:2013 as XYZ, XZY, ZXY. The specimens are shown in Figure 1.
Tensile specimens were produced with three different LS machines. Five sample sets for each orientation and machine were produced in order to determine the tensile strength in accordance with the build orientation. The process parameters were set as standard according to each machine manufacturer.
The tensile strength test was performed using an INSTRON3384 equipped with a 10 kN measuring head (accuracy class 0.5), wedge handles with a maximum load of 50 kN, and a video level detector (Ave 1 2663-821, Instron, Norwood, MA, USA). The samples, according to ISO 6892-1:2016-09, were loaded with 20 N at a speed of 2 mm/min, while measurements were made at a speed of 10 mm/min.

2.9. Surface Roughness

The surface quality of the produced samples was measured using confocal microscopy with an OLYMPUS LEXT OLS4000. Measurements were carried out after postprocessing (sandblasting) using strength samples, on surfaces as shown in Figure 1, before conducting the tensile test. Observations and measurements are possible in three dimensions in real-time. The used LEXT system ensures that the resolution in the XY plane is 0.12 µm, and 0.01 µm on the Z-axis. The LEXT software offers various ways to classify the surfaces, waviness, and porosity. The values obtained from a three-dimensional image were determined using algorithms that are applicable to 2D parameters in accordance with ISO 4287 and 4288.

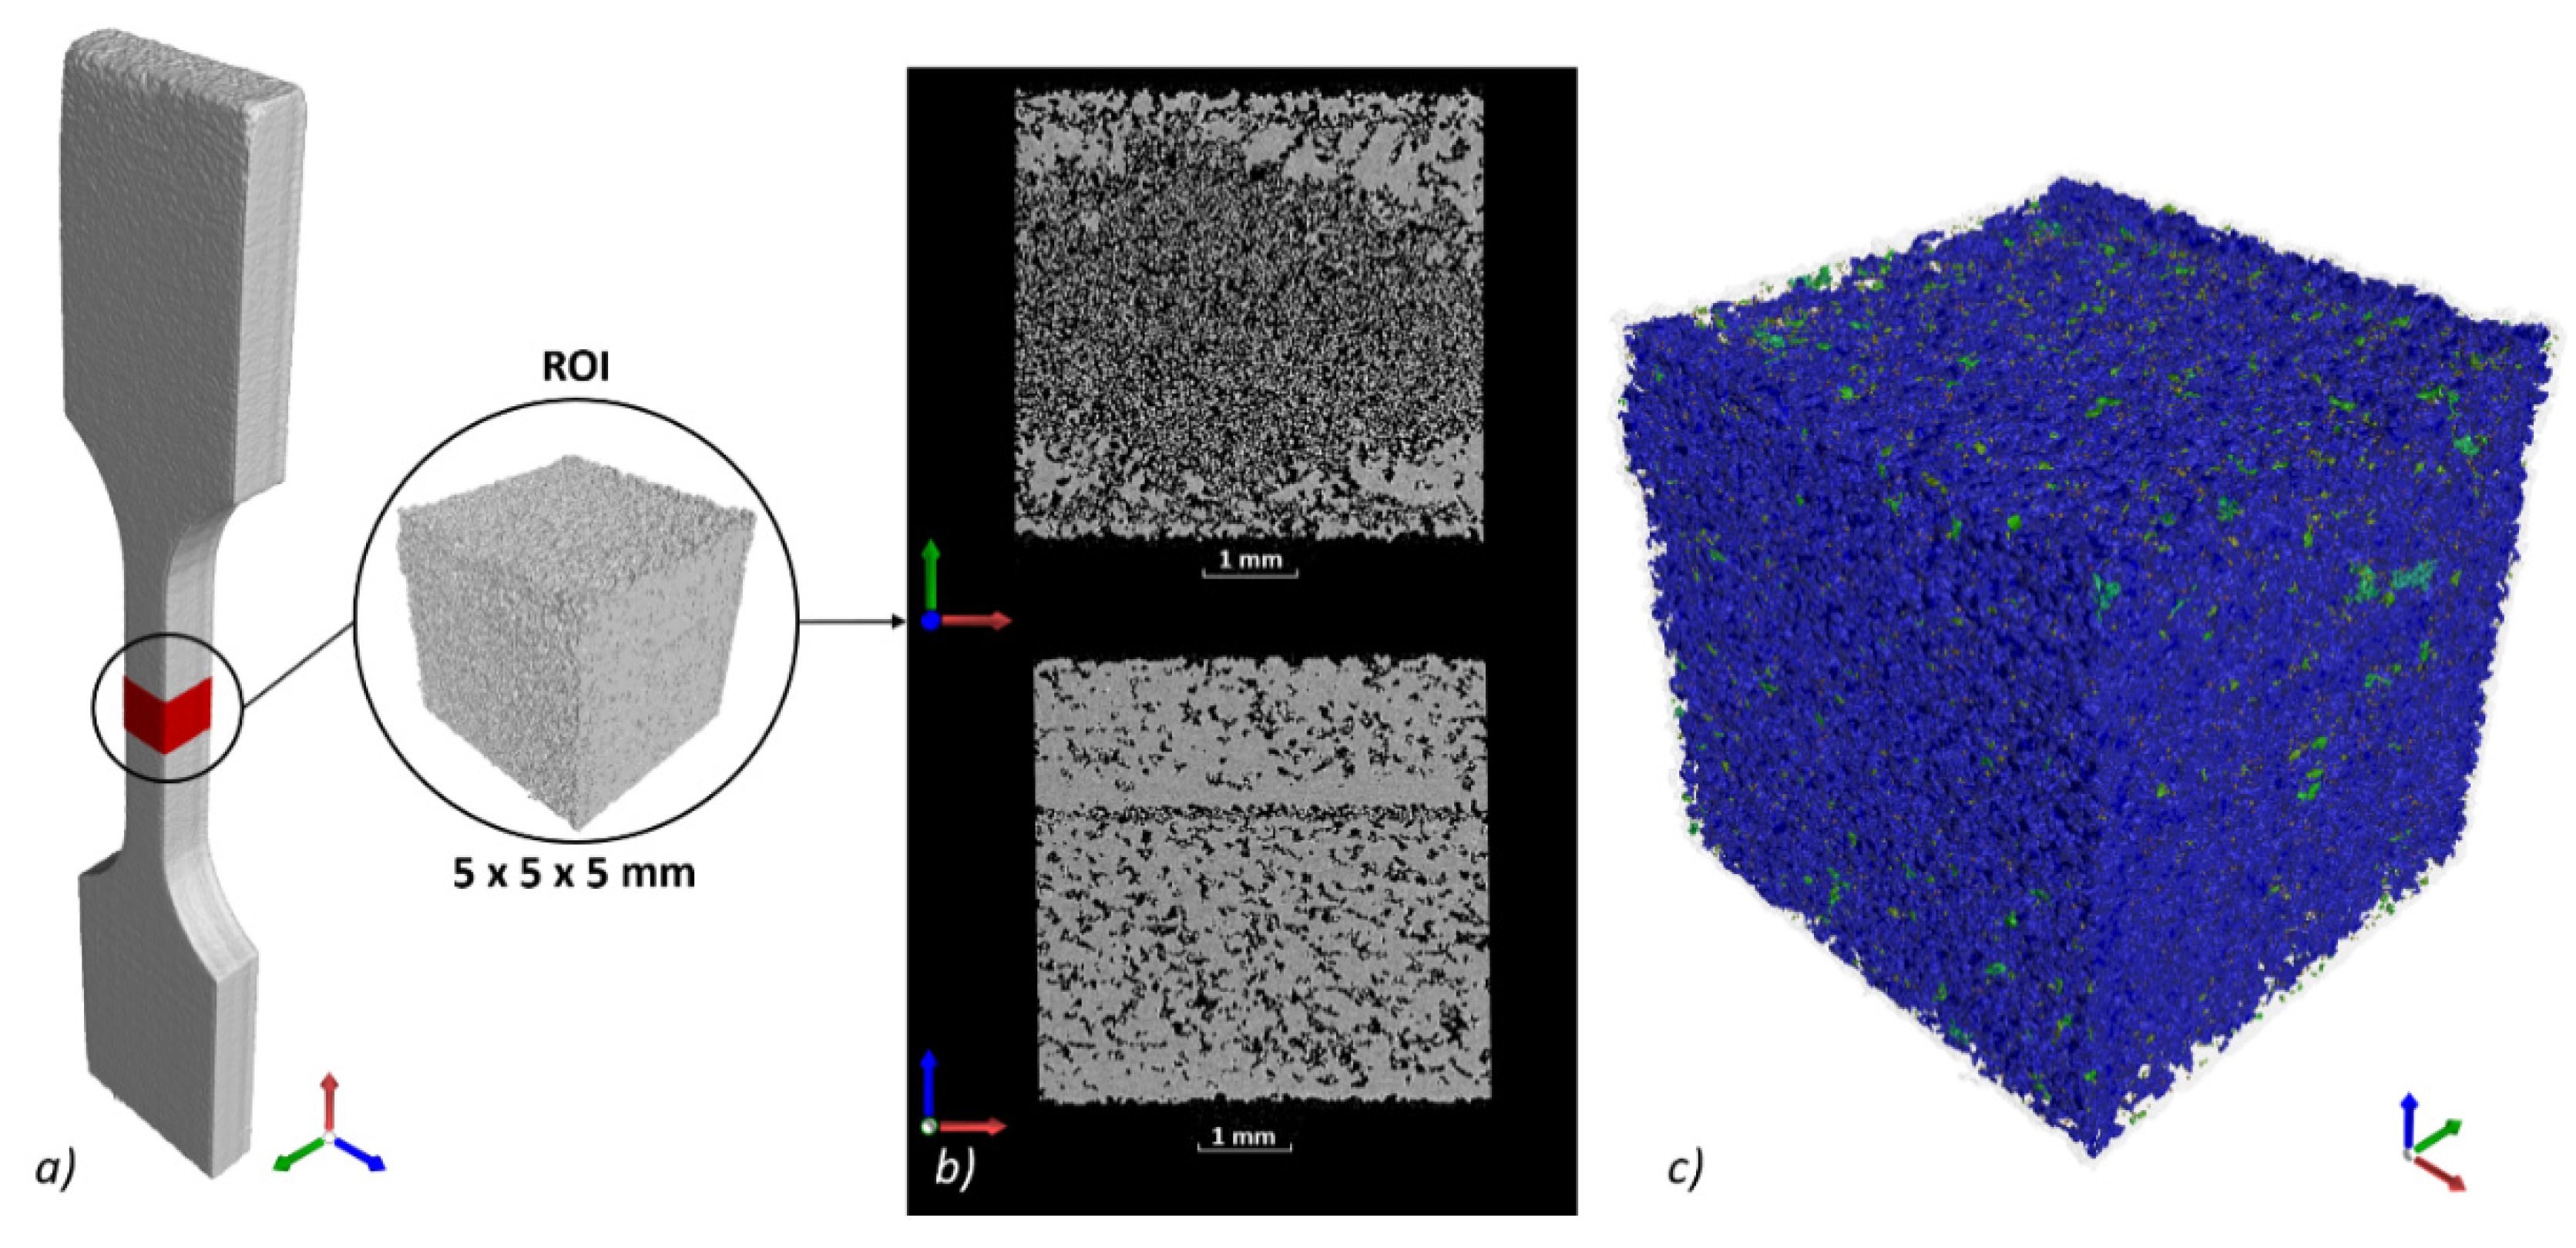
2.10. Computed Tomography

The cone-beam X-ray computed tomography system (XCT) v|tome|x m180/300 (GE Sensing and Inspection Technologies GmbH, Germany) was used for the reconstruction of the benchmark and tensile samples. Before the measurements, the geometry of the system was calibrated according to the GE procedure. An analysis of the geometric accuracy was performed for the benchmark samples, for which the following scanning parameters were used: tube voltage of 160 kV, tube current of 100 µA, integration time of a single projection of 1s, voxel size at the level of 60 µm. In turn, a porosity analysis was performed for the tensile samples using the following Computed Tomography (CT) measurement parameters: tube voltage of 80 kV, tube current of 70 µA, and a 200 ms integration time of a single projection. To obtain a higher resolution of the CT scans, the reconstruction was only performed for the selected region of interest (ROI), which was located in the middle of each sample. This allowed the reconstruction of the samples with a geometrical magnification of 32.35 and a resolution (voxel size) of 6.2 µm.
The obtained images were processed using software VG Studio MAX 3.3 (Volume Graphics, Heidelberg, Germany). A local threshold method was used to extract three-dimensional geometric data from two-dimensional tomographic sections. The manufacturing accuracy was evaluated by applying a nominal/actual comparison of the 3D models from the CT scans, and a nominal 3D CAD model for the benchmark samples. After aligning the 3D scan data with the CAD model using a best fit method, a map of deviations of the manufactured models was plotted. A porosity analysis was performed using dedicated VG modules.

3. Results and Discussion

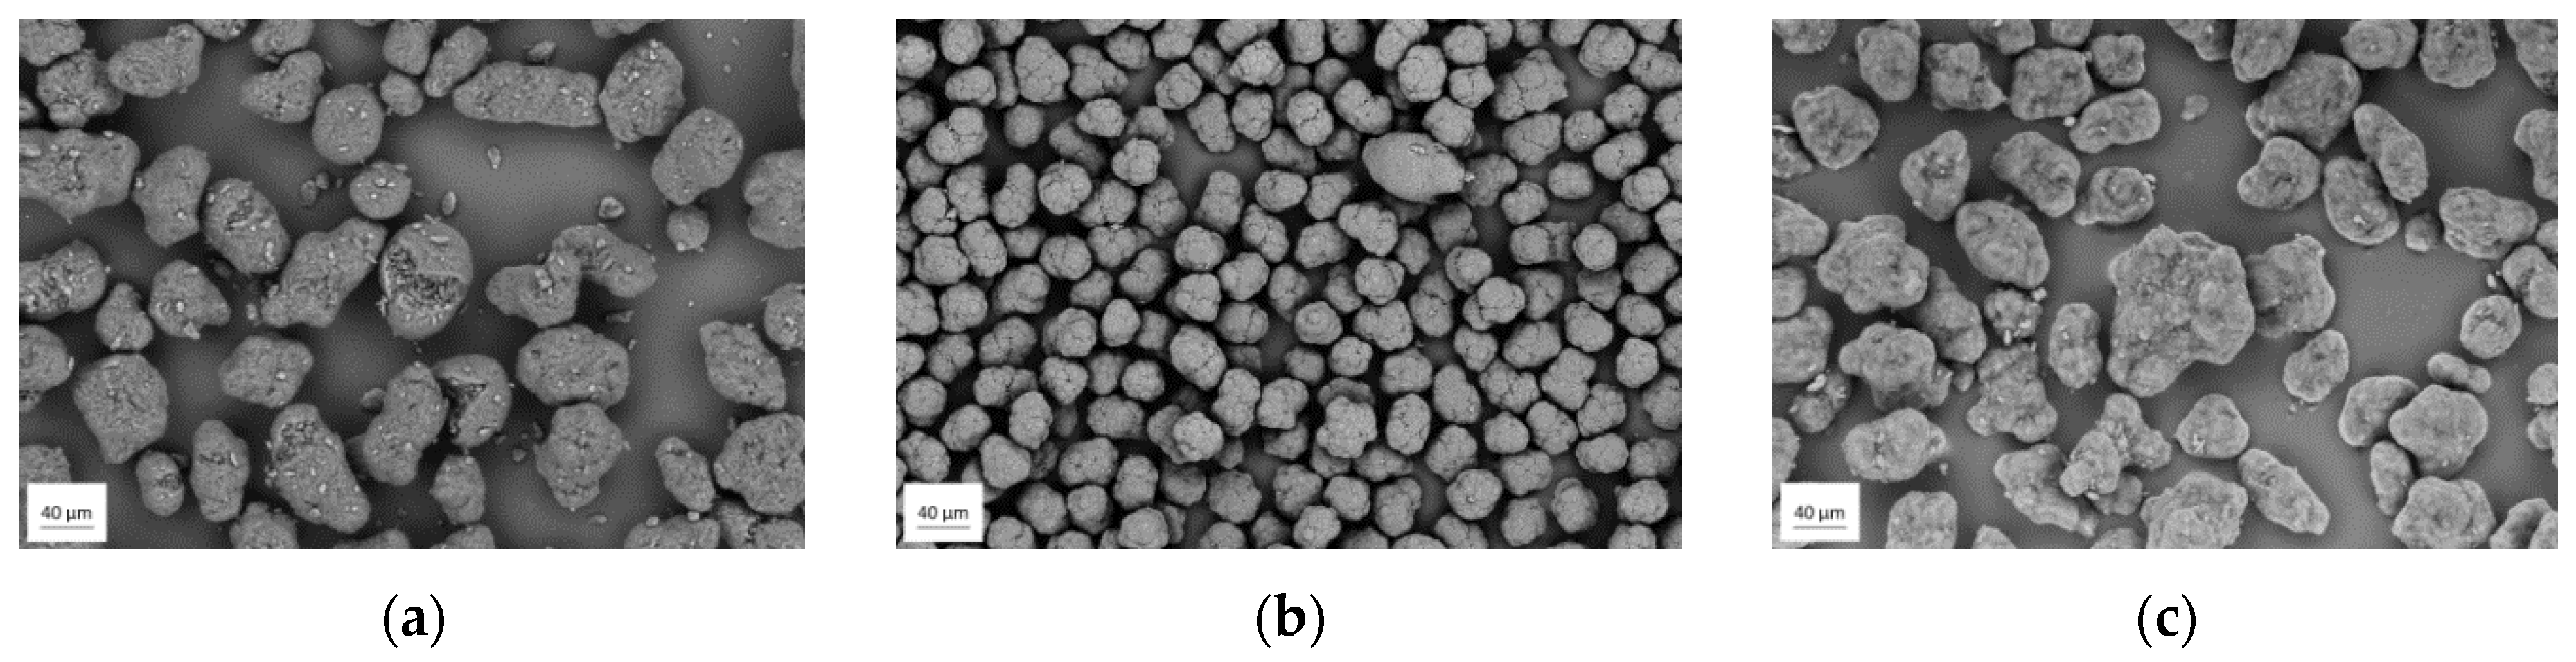
3.1. Scanning Electron Microscopy

SEM images are shown in Figure 2. The evaluated particles of the powders have a reduced roundness—the so-called “potato-shape”—which indicates preparation by the precipitation process. PA12 Smooth has a visibly smaller particle size with a narrow distribution. On the SEM images of the PA2200 and PA12 Black, particles with a size of several micrometres are visible on the powder’s particle surface. In the case of PA2200, they are identified as titanium dioxide (TiO2), which is added to improve whiteness, flowability [24], and absorption [25], and additionally acts as a nucleating agent. The SEM images confirm that each of the tested materials were prepared, or selected, to be suitable for the LS process. The tested powders have a similar “potato shape” morphology, which indicates the same type of manufacturing process used.

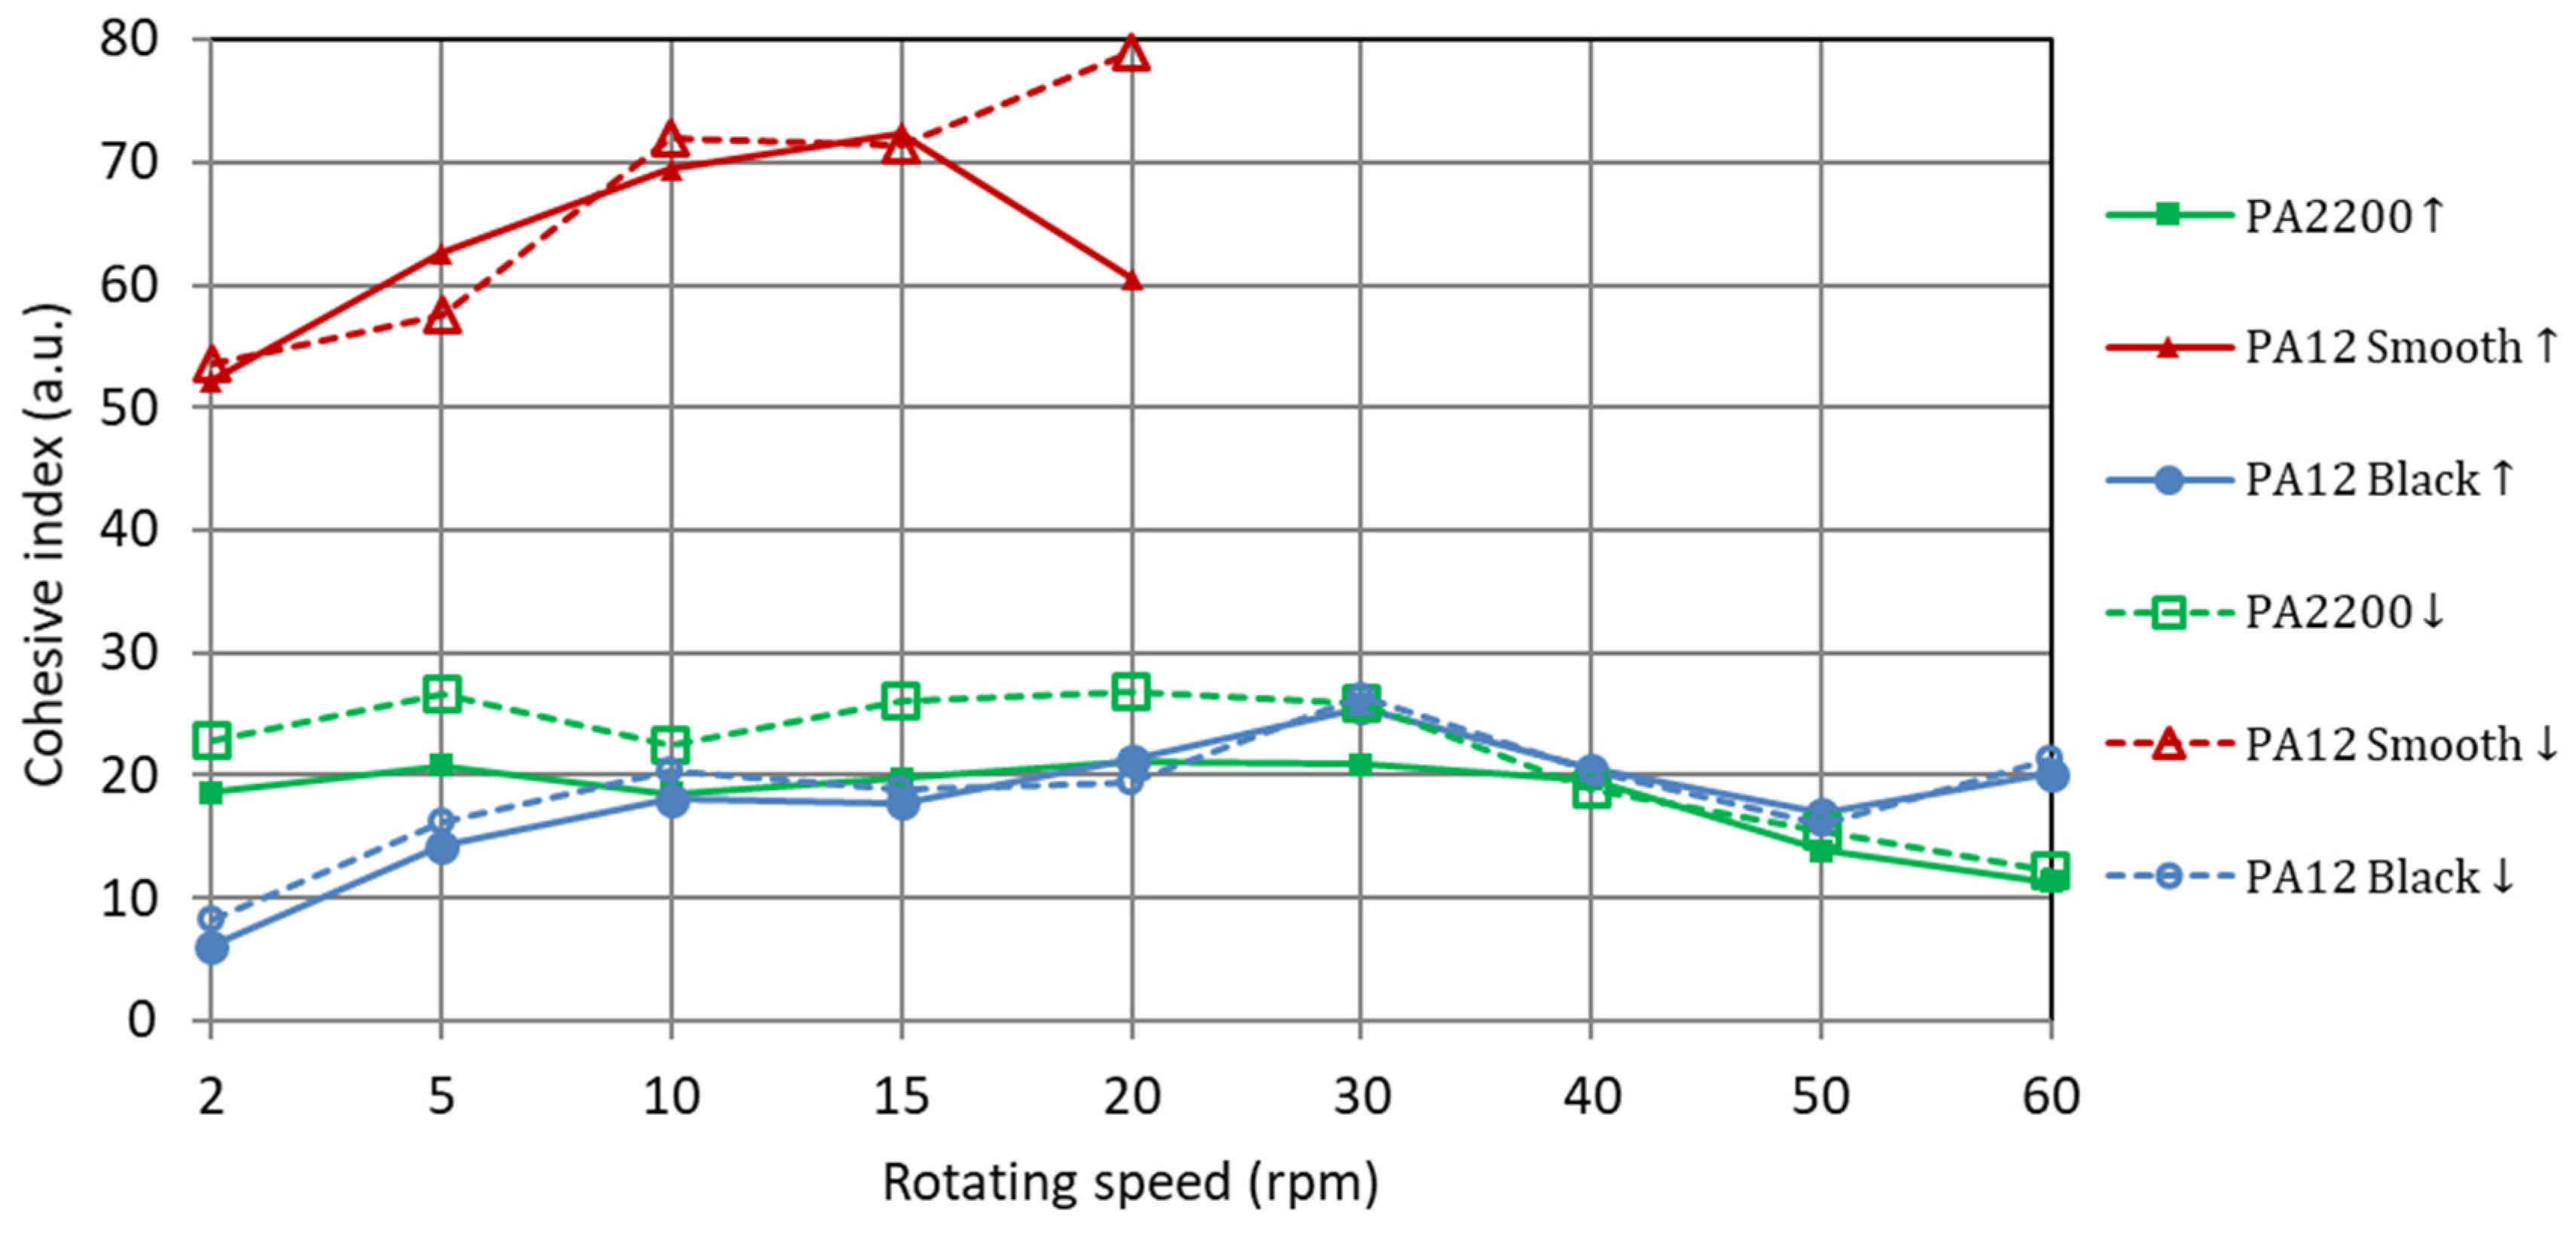
3.2. Powder Flowability

The powder flowability influences both the material delivery and application on the work surface. Characterized by the Hausner ratio, LS powders should typically be below a threshold level of 1.25 [8,16]. The Hauser ratio is listed in Table 3, and the best static flowability is given by PA12 Smooth. Every tested powder meets the acknowledged requirements and is classified as having good flowability, which confirms their suitability for the LS process. However, as previously mentioned, the HR refers to static conditions and does not consider the dynamic behavior that prevails during the application of the powder in the manufacturing process. The dynamic cohesive index in relation to rotating speed was determined, and is showed in Figure 3. PA2200 and PA12 Black have a similar dynamic behavior of flow properties, which is described by the manufacturer of the testing device as good (5–10) or fair (10–20). However, it should be taken into account that the ranges provided by the manufacturer of the testing device do not explicitly refer to the specificity of powder application in the LS process. In this case, PA2200 was used as a reference. PA12 Smooth acts as a cohesive powder that gives an irregular flow with a higher average floating angle. Poor flow properties, especially at higher rotating speeds, resulted in an inability to evaluate data obtained above 20 rpm.

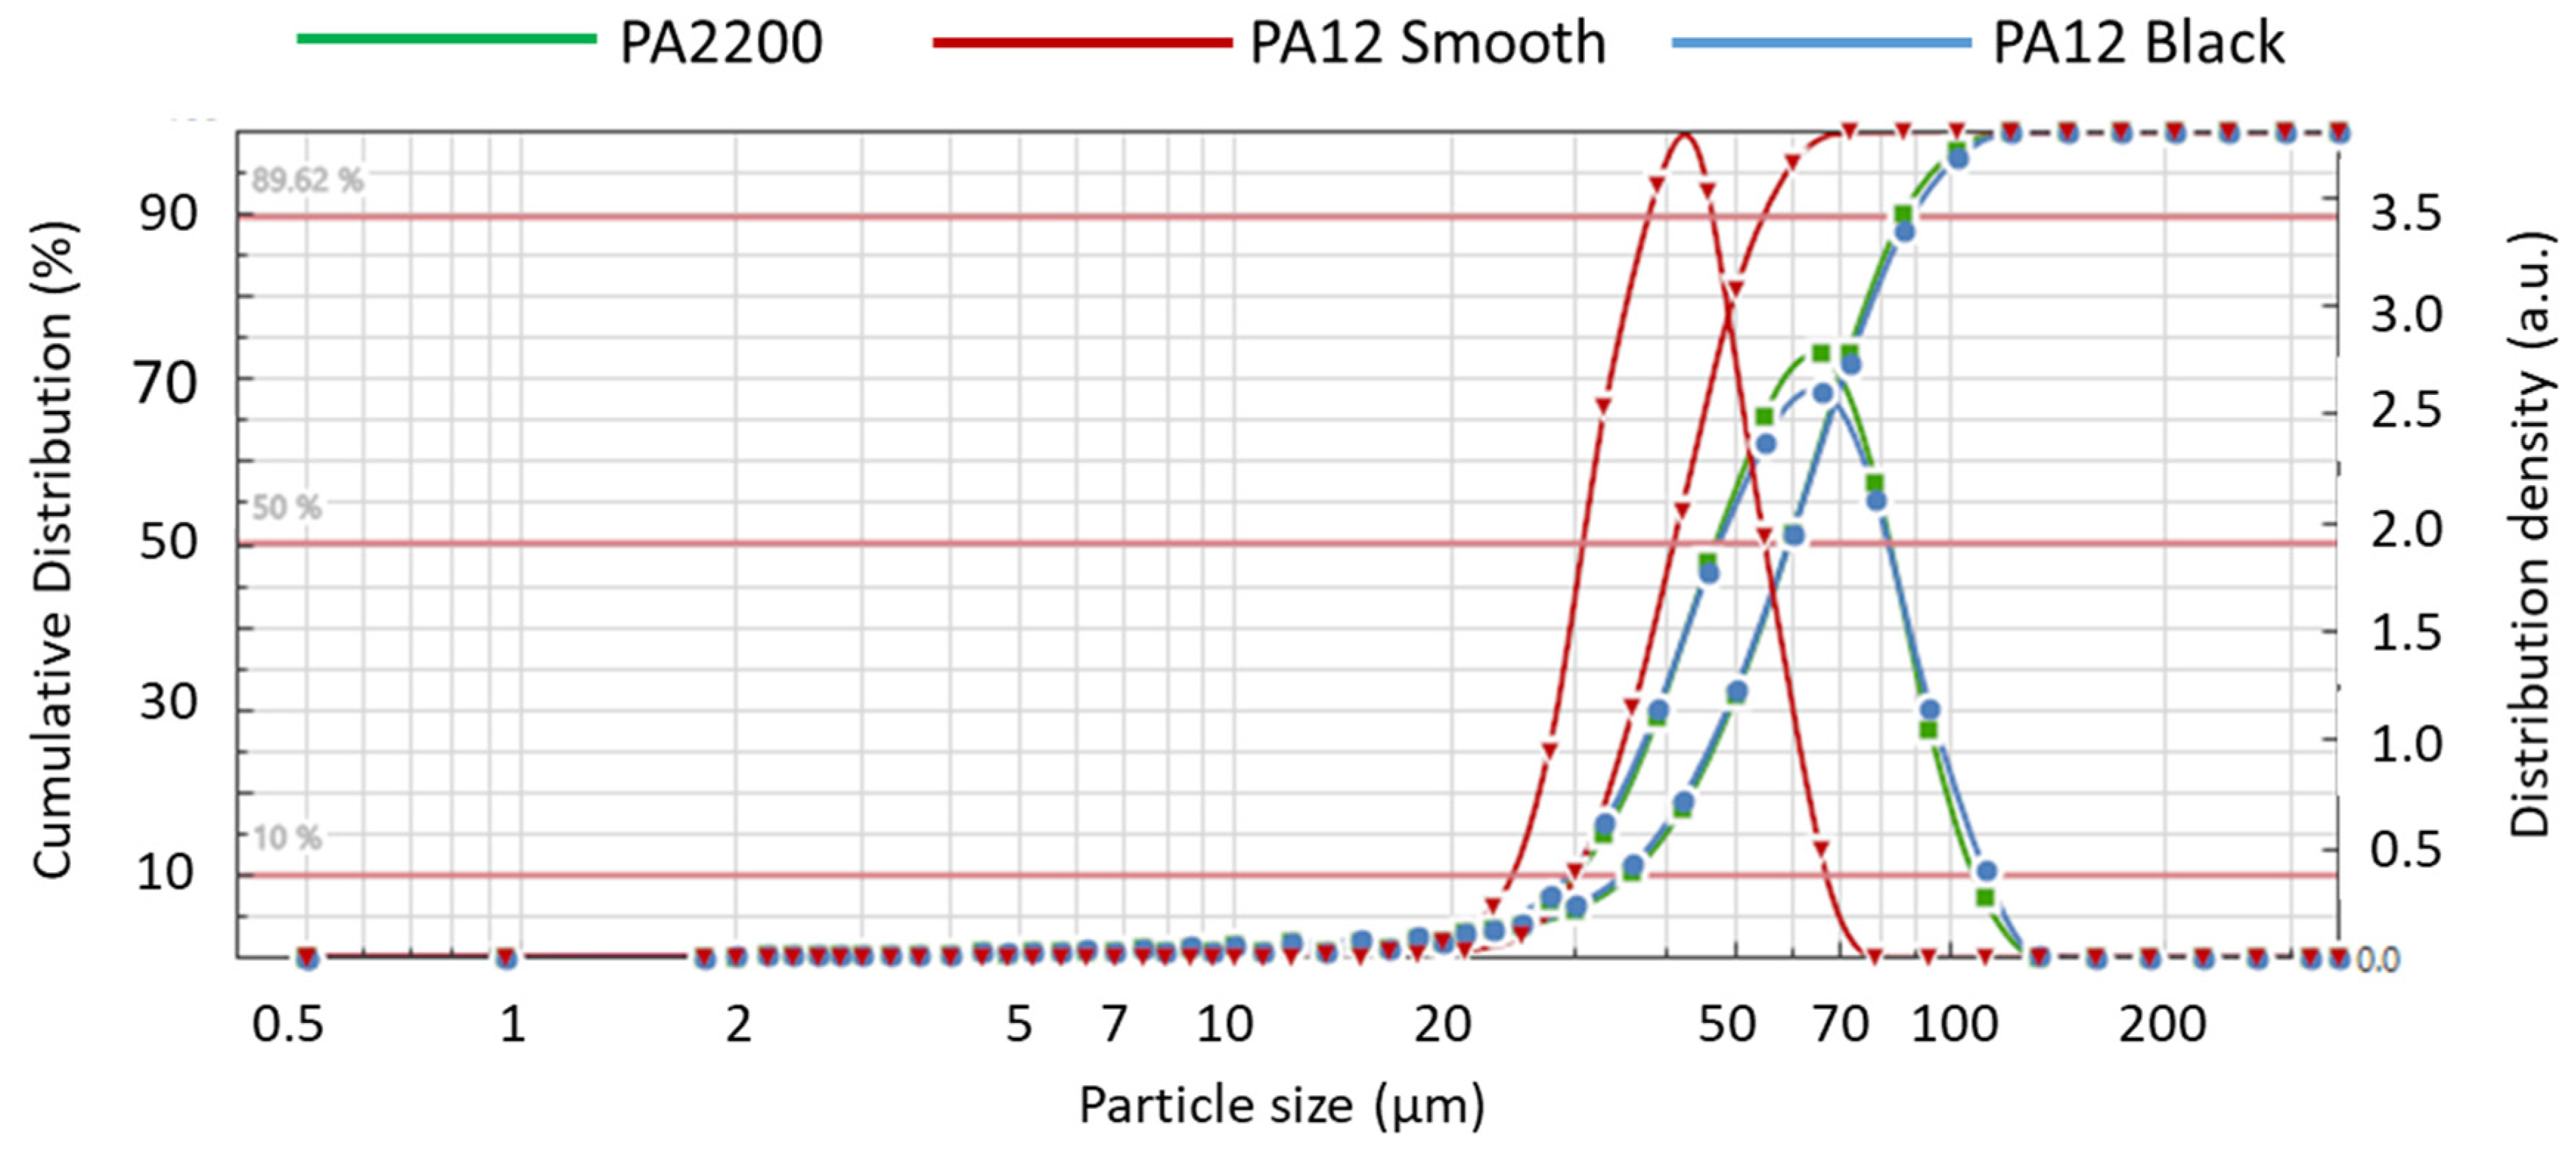
3.3. Particle Size Distribution

The results obtained from dry laser diffraction spectroscopy for each powder are shown in Table 3. The powder’s size distribution for the commercial LS system should theoretically be in the range of 0 to 200 µm (in practice it is narrower from 20 to 80 µm), with a distribution similar to normal, and with a central value around 63 µm [26]. Moreover, the powder should not have too many particles below 20 µm, because they affect the flowability of the material and increase the adhesion between the particles, in turn disturbing the process [27]. The lower limit for particle size, because of its poor bulk flow at high temperatures, is also commonly referred to as 10 µm [18].
Each tested powder meets the stated requirements. PA2200 and PA12 Black have a similar powder size distribution, as shown in Figure 4, while PA12 Smooth (Sinterit) has a narrower distribution with a smaller central value size, which corresponds with the SEM images. All the tested powders have an insignificant share of particles below 20 µm. In the case of PA12 Smooth, it is worth mentioning the lack of particles smaller than 10 µm. This is in contrast to PA2200 and PA12 Black, where a small size addition could be observed. PA12 Smooth stands out with its smaller particle size and narrower distribution, which can bring about a better final surface quality.

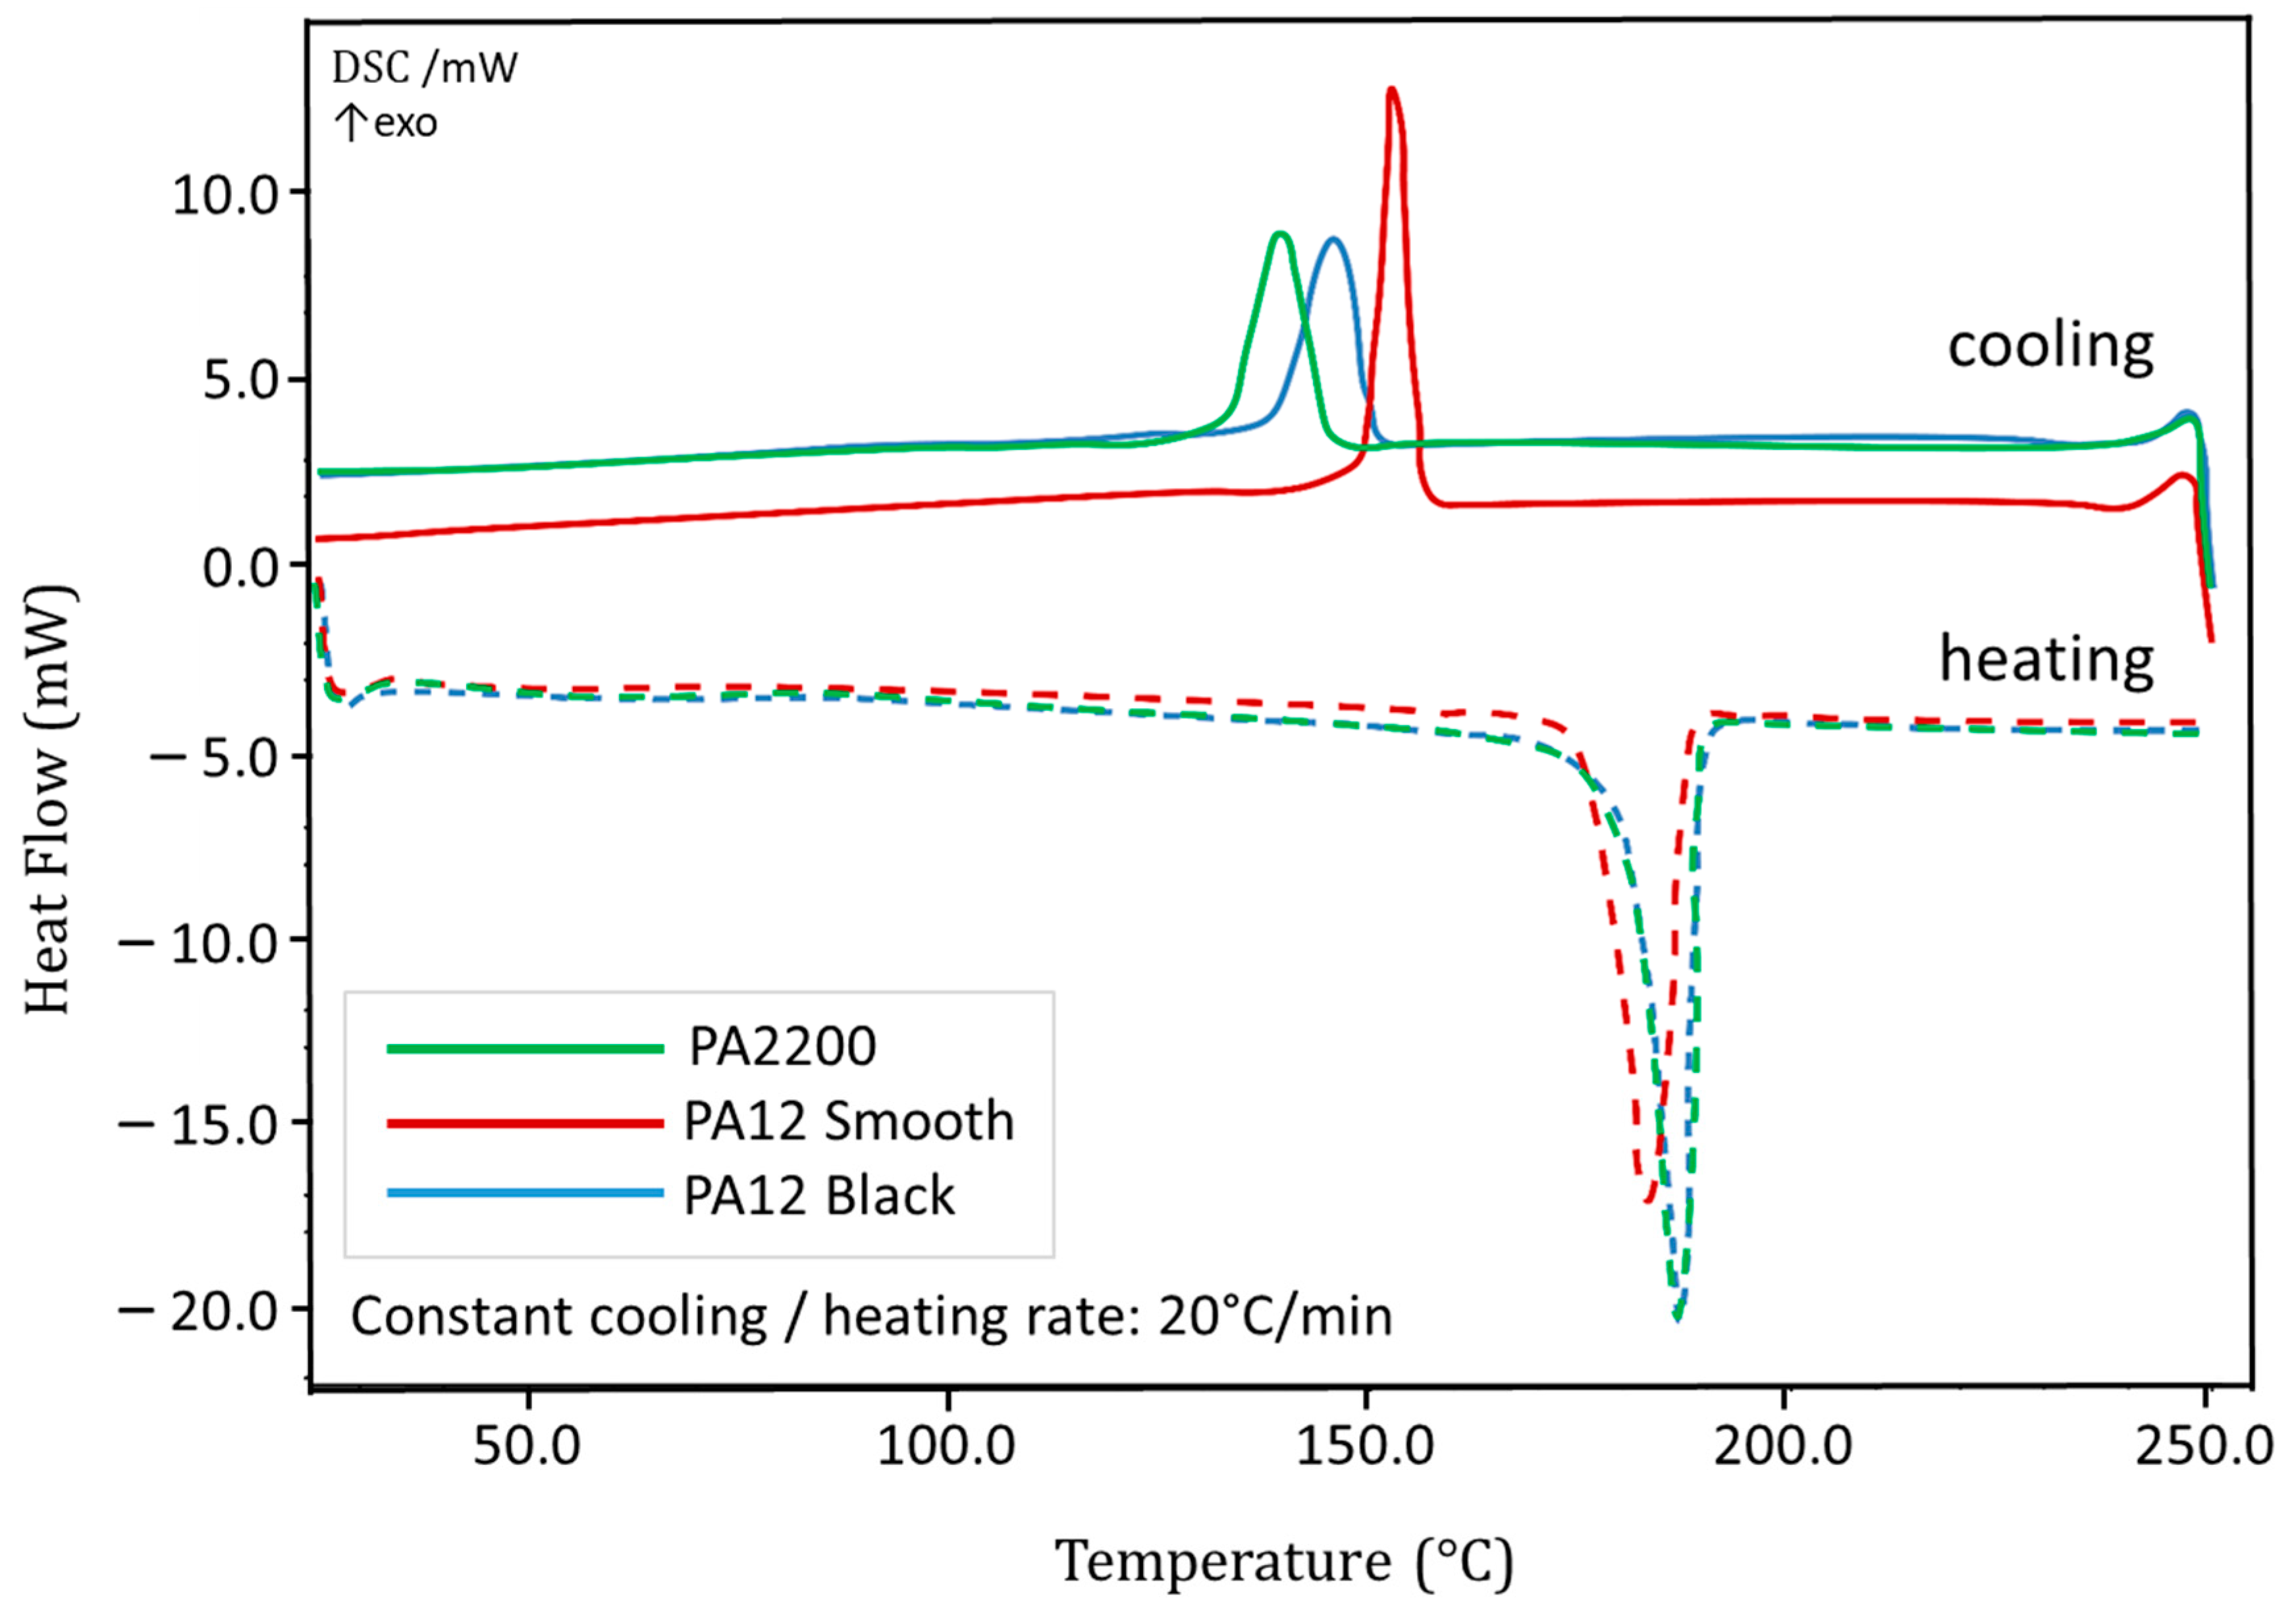
3.4. Differential Scanning Calorimetry

Thermal analysis (DSC) showed a semicrystalline structure of the tested materials. The obtained DSC curves are similar to single peaks during heating and cooling, as shown in Figure 5. The extracted start melting temperature (Tm-start), start crystallization temperature (Tc-start), and processing window width (ΔT) are listed in Table 4.
The widest processing window is provided by PA2200, while PA12 Smooth offers the narrowest one. The lowest melting and crystallization enthalpies are given by PA2200, and significantly differ from PA12 powders of desktop LS manufacturers. The found differences indicate that PA12 Smooth and PA12 Black contain a higher value of crystal domains in the tested materials. Additionally, a high melting enthalpy is favourable for precise contour melting. The threshold for thermal bleeding of nonmelted powder particles rises, which allows for a higher surface quality to be achieved [28].
The thermal properties show that PA2200 has the highest tolerance of temperatures divergence, while also having the lowest enthalpies. This can result in less precise contour melting when compared to the other two polyamides.

3.5. Benchmark Geometry Characterization

The samples produced using different LS machines are shown in Figure 6. The most significant appearance difference is the colour of the used material. In order to compensate the low power of diode lasers that are used in desktop devices, a higher absorption rate is needed and is assured by dark colour powders. Noticeable differences can be seen in the surface quality and finishing, and the PA12 Smooth model looks glossier than the other two. Moreover, some small geometric shapes were not produced, and some were built with a reduced accuracy.
The smallest circular hole (ø0.5 mm) was not manufactured in every sample. The next smallest hole (ø1 mm) was visible in each specimen, but only Lisa produced a hole in which unsintered powder was removable. It was only S1 that did not build the thinnest wall (0.5 mm). The Lisa device produced walls of 0.95 mm instead of the designed sizes of 0.5 and 0.75 mm. Each gap between the thin walls was possible to clean. The differences in the surface quality and accuracy are discussed later in the corresponding sections.

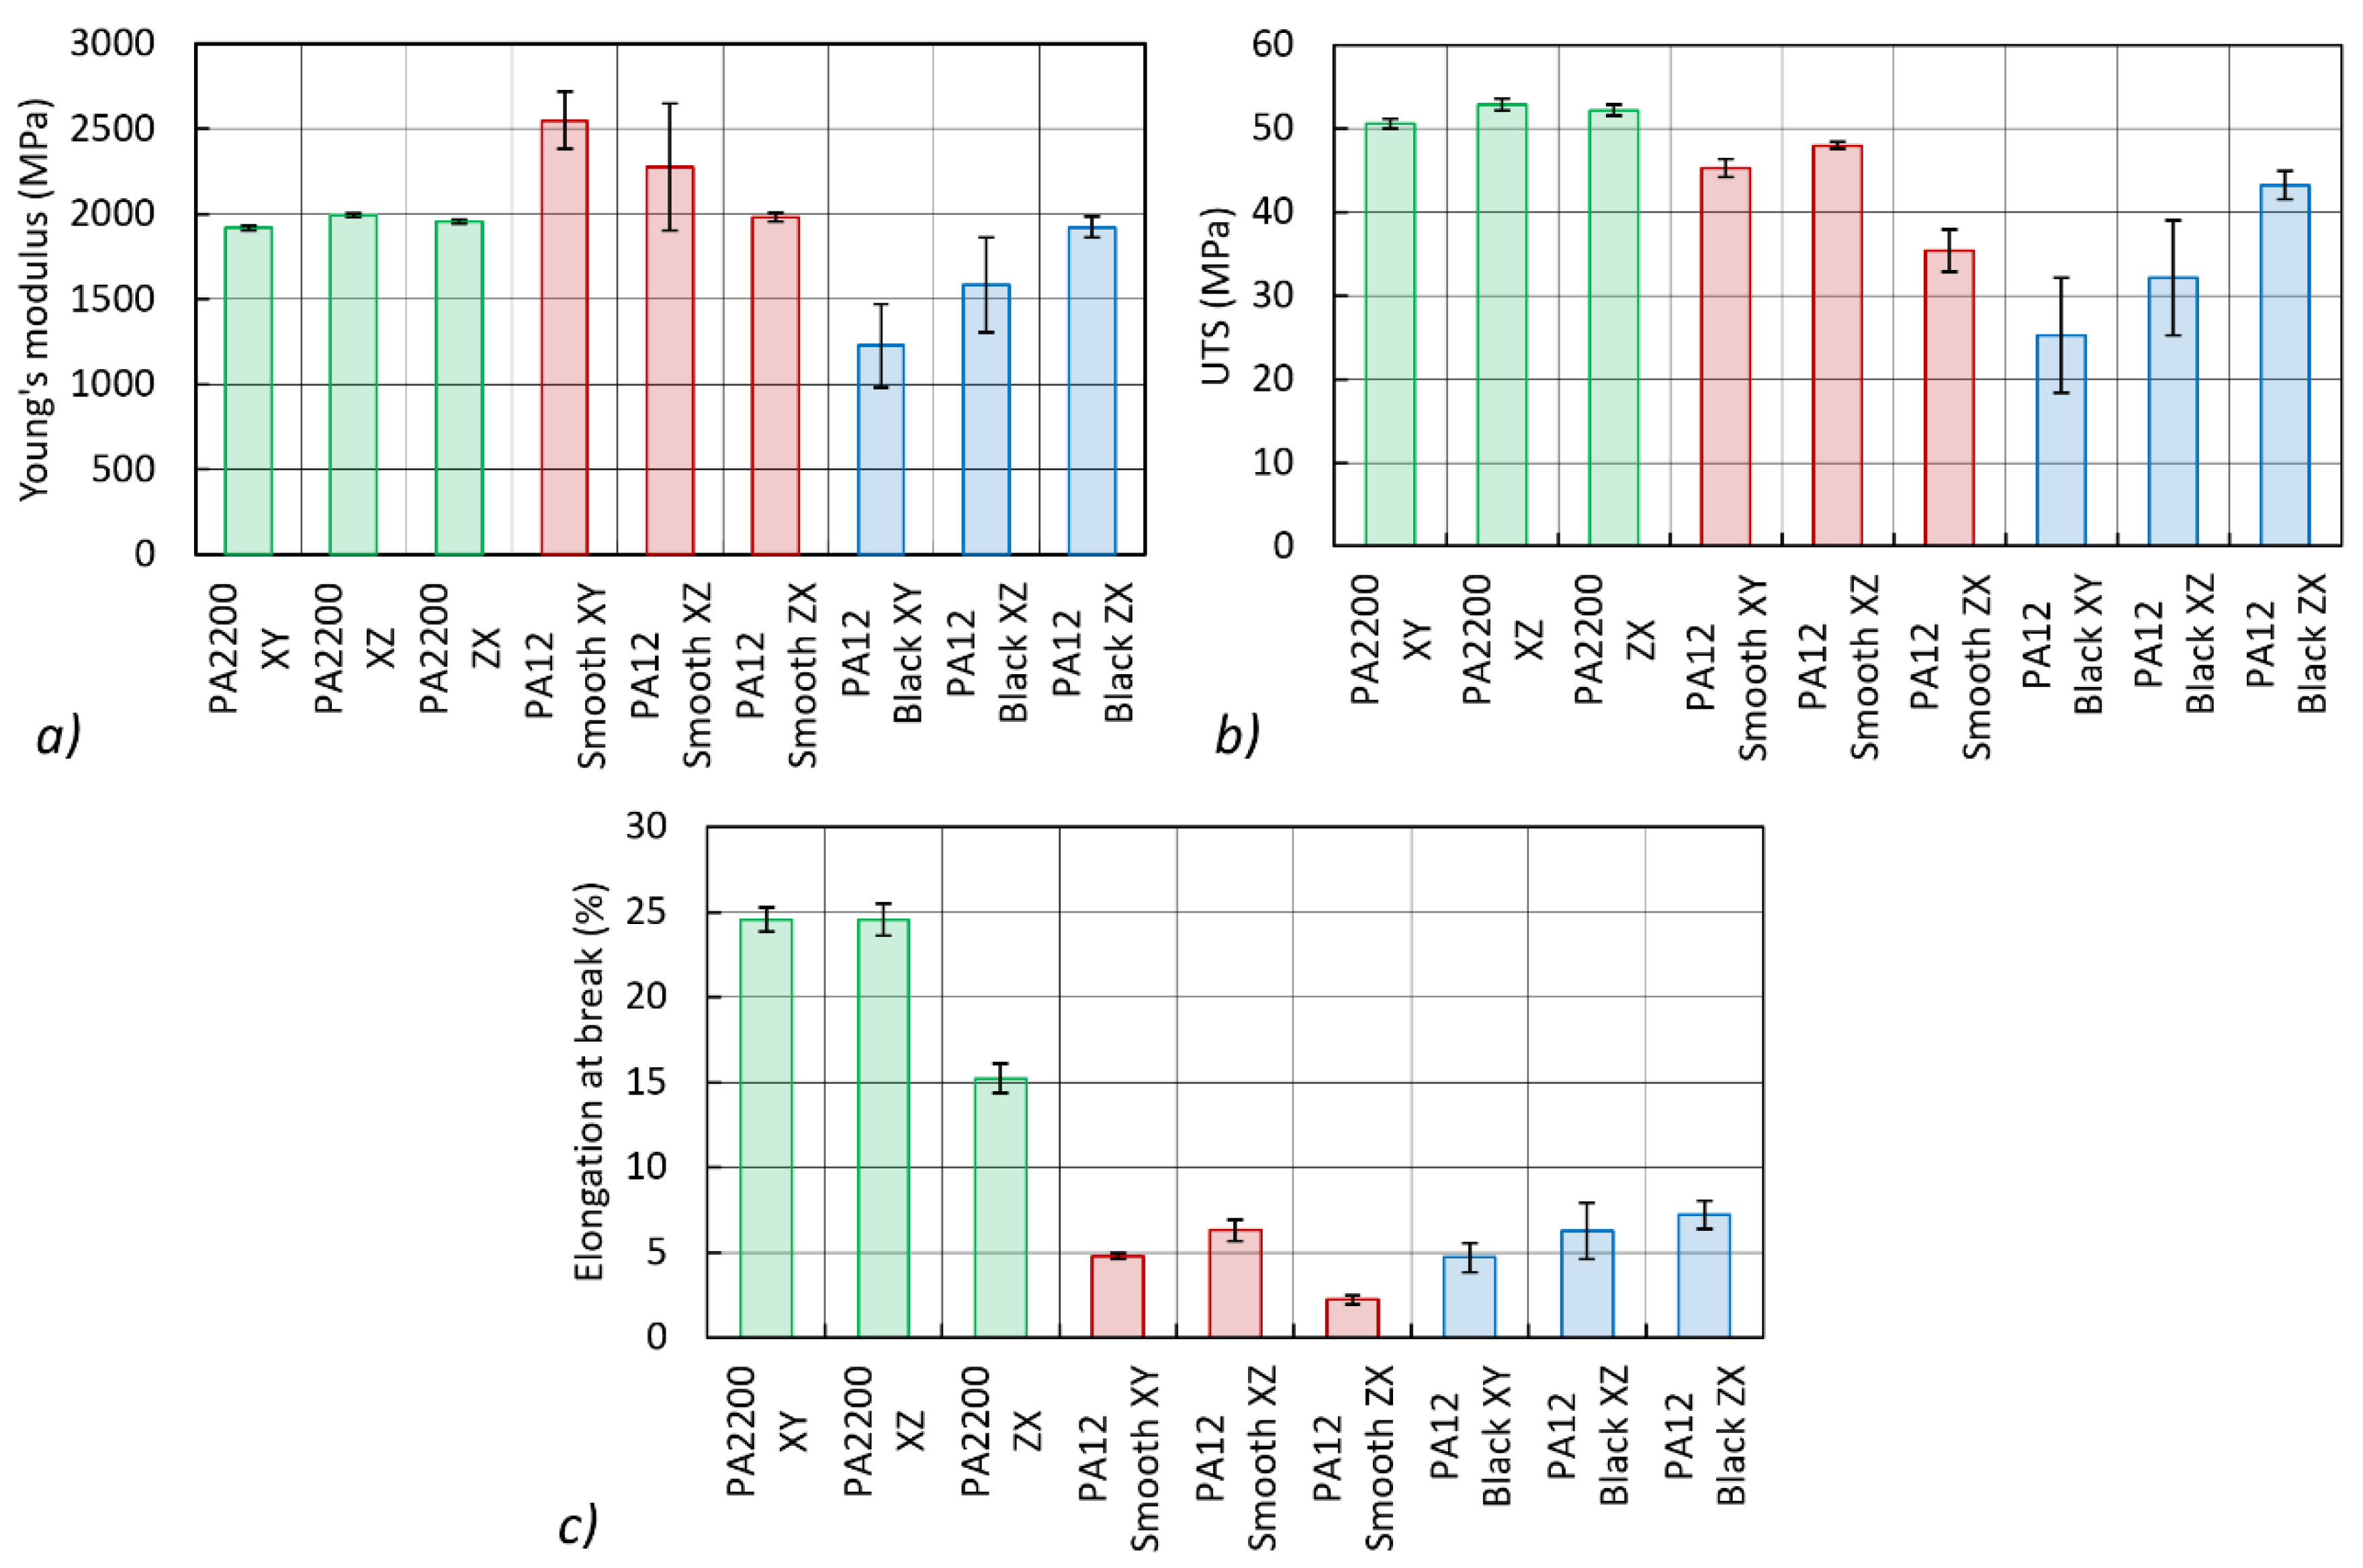
3.6. Mechanical Testing

Results of the tensile test of materials with a distinguished build orientation are shown in Figure 7. The highest ultimate tensile strength and elongation at break was achieved for PA2200 (EOS). Additionally, the lowest standard deviation of each material’s property confirms that Formiga P110 ensures the highest repeatability of manufacturing.
Both desktop solutions have high standard deviation values. It is worth noting that the ultimate tensile strength and deviation obtained using PA12 Smooth (Sinterit) is significantly better than those obtained by other desktop manufacturers. Moreover, polyamide processed with desktop machines has an unquestionably lower elongation at break. The industrial machines reported by Stichel et al. regardless of the manufacturer or used PA12, did not show as many differences in mechanical properties [29] as those found by industrial and desktop devices. The highest mechanical properties, and their reproducibility, are offered by the commercial set while using Formiga P110 and PA2200, while S1 offered the lowest properties with high deviations, which can indicate nonhomogenous thermal conditions (heating/laser exposure) in the process, or poorly optimized process parameters.
In this comparison, only the samples from Formiga P110 obtained similar results decelerated by the manufacturers’ datasheet which are presented in Table 5. For desktop LS, the biggest difference in mechanical properties is noticed for the elongation at break (2.2% for PA12 Smooth ZX vs. 15.2% for PA2200 ZX). Mostly, unfilled polyamide 12 in industrial LS systems achieves values of 46–52 MPa for the tensile strength in both directions and 20–36% in the vertical direction and around 10% in the horizontal direction for elongation at break. Despite different energy input values and parameter optimizations, the reference point will not significantly differ. A comparison of the absolute values for the tensile strength with other studies showed that Wegner and Witt [30] found maximum values of 51.3  (XY) and 48.9 MPa (ZX)—PA2200, DTM Sinterstation 2500 HS. Furthermore, Hofland et al. [31] found maximum values for the elongation at break: 25.9% in horizontally built samples and 15.6% for vertically built samples—PA2200, P395 EOS system.

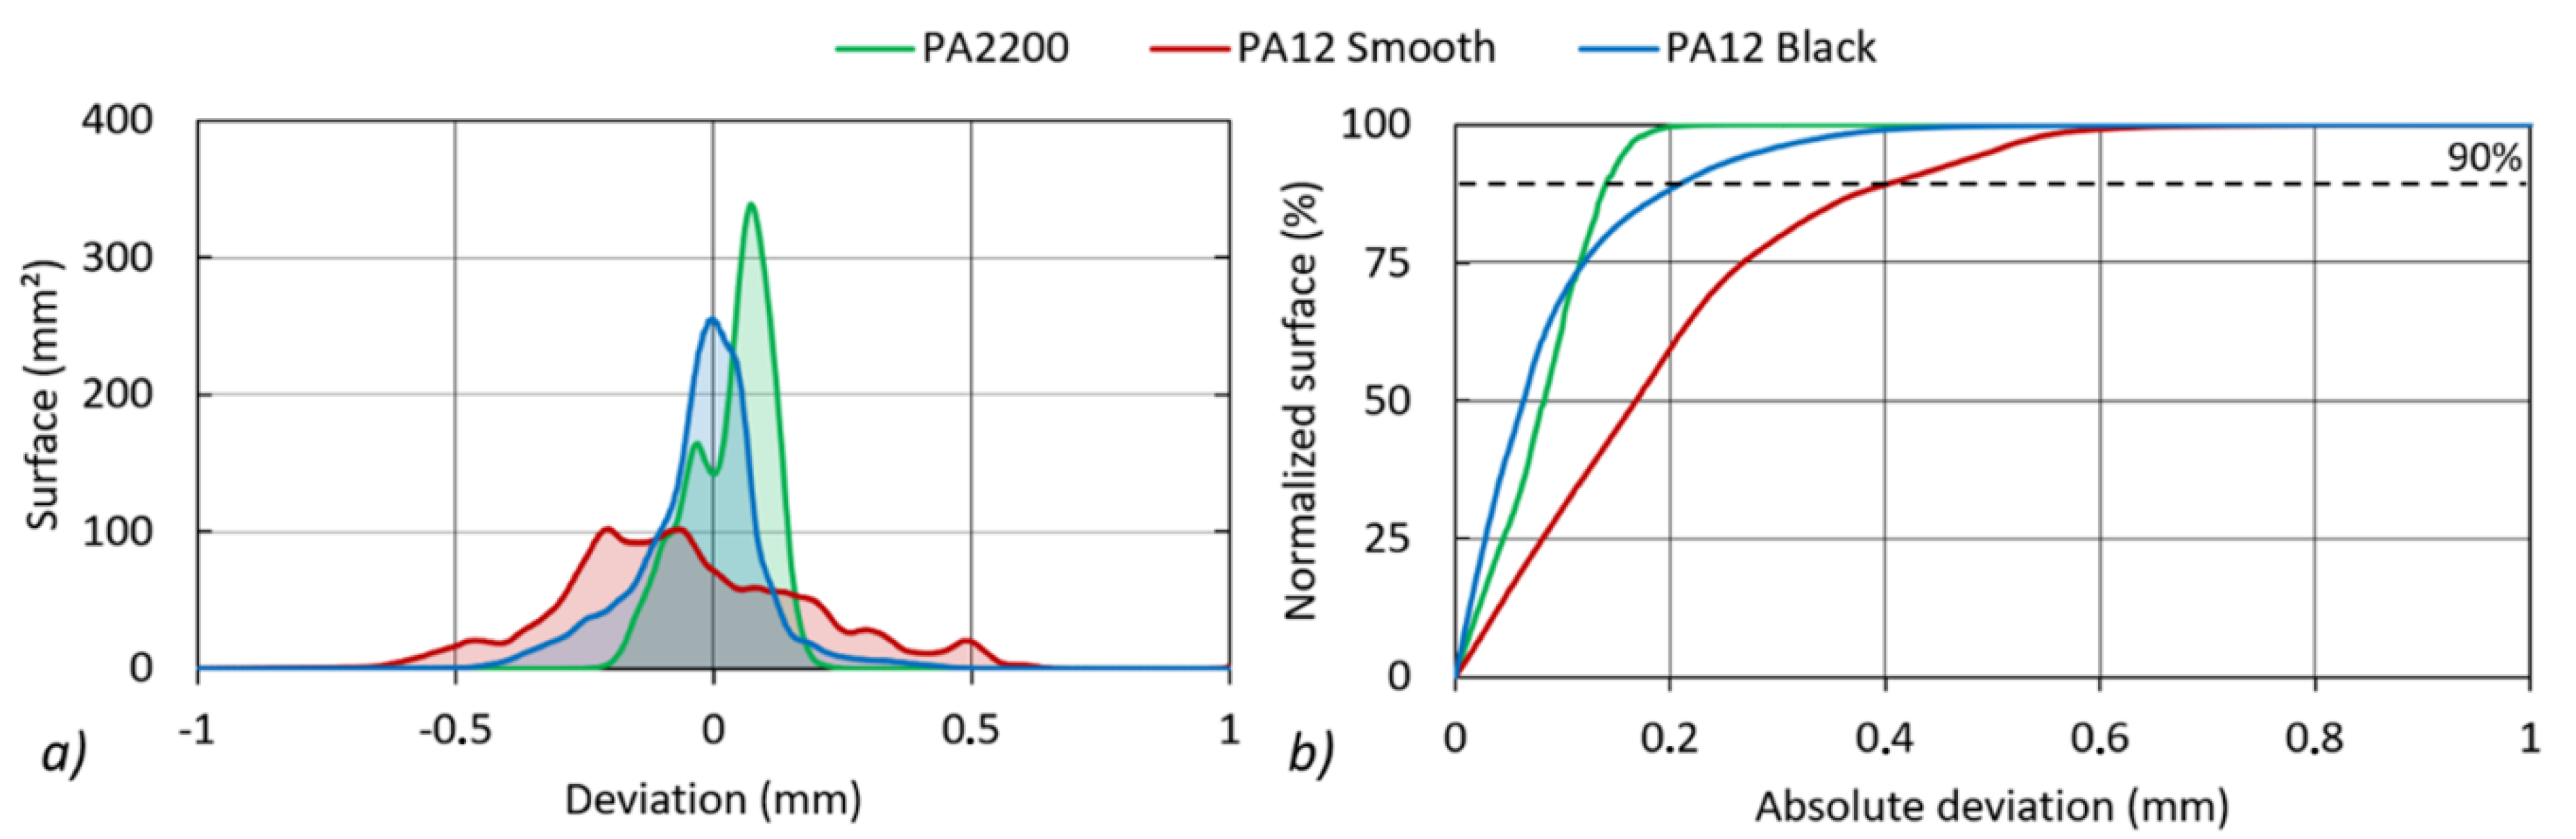
3.7. Surface Roughness

The surface roughness is not only influenced by the orientation of the structure [32], but also by the processing parameters [33] and the batch material. Considering the various machines, with significant differences in their construction, it was expected to find divergence between the produced samples. Table 6 shows the sample’s surface roughness is dependent on the used machine and the build orientation of the tested surface.
The best surface roughness was achieved for PA12 Smooth, on which nonmelted powder, which was attached to the model, was at least visible to the unaided eye. The mentioned samples were produced using Lisa with the laser source mounted on the XY kinematics, which does not allow high scanning speeds when compared to systems that use galvanometers. The relatively long laser acquisition time enabled the best melting performance of a model—powder cake border.

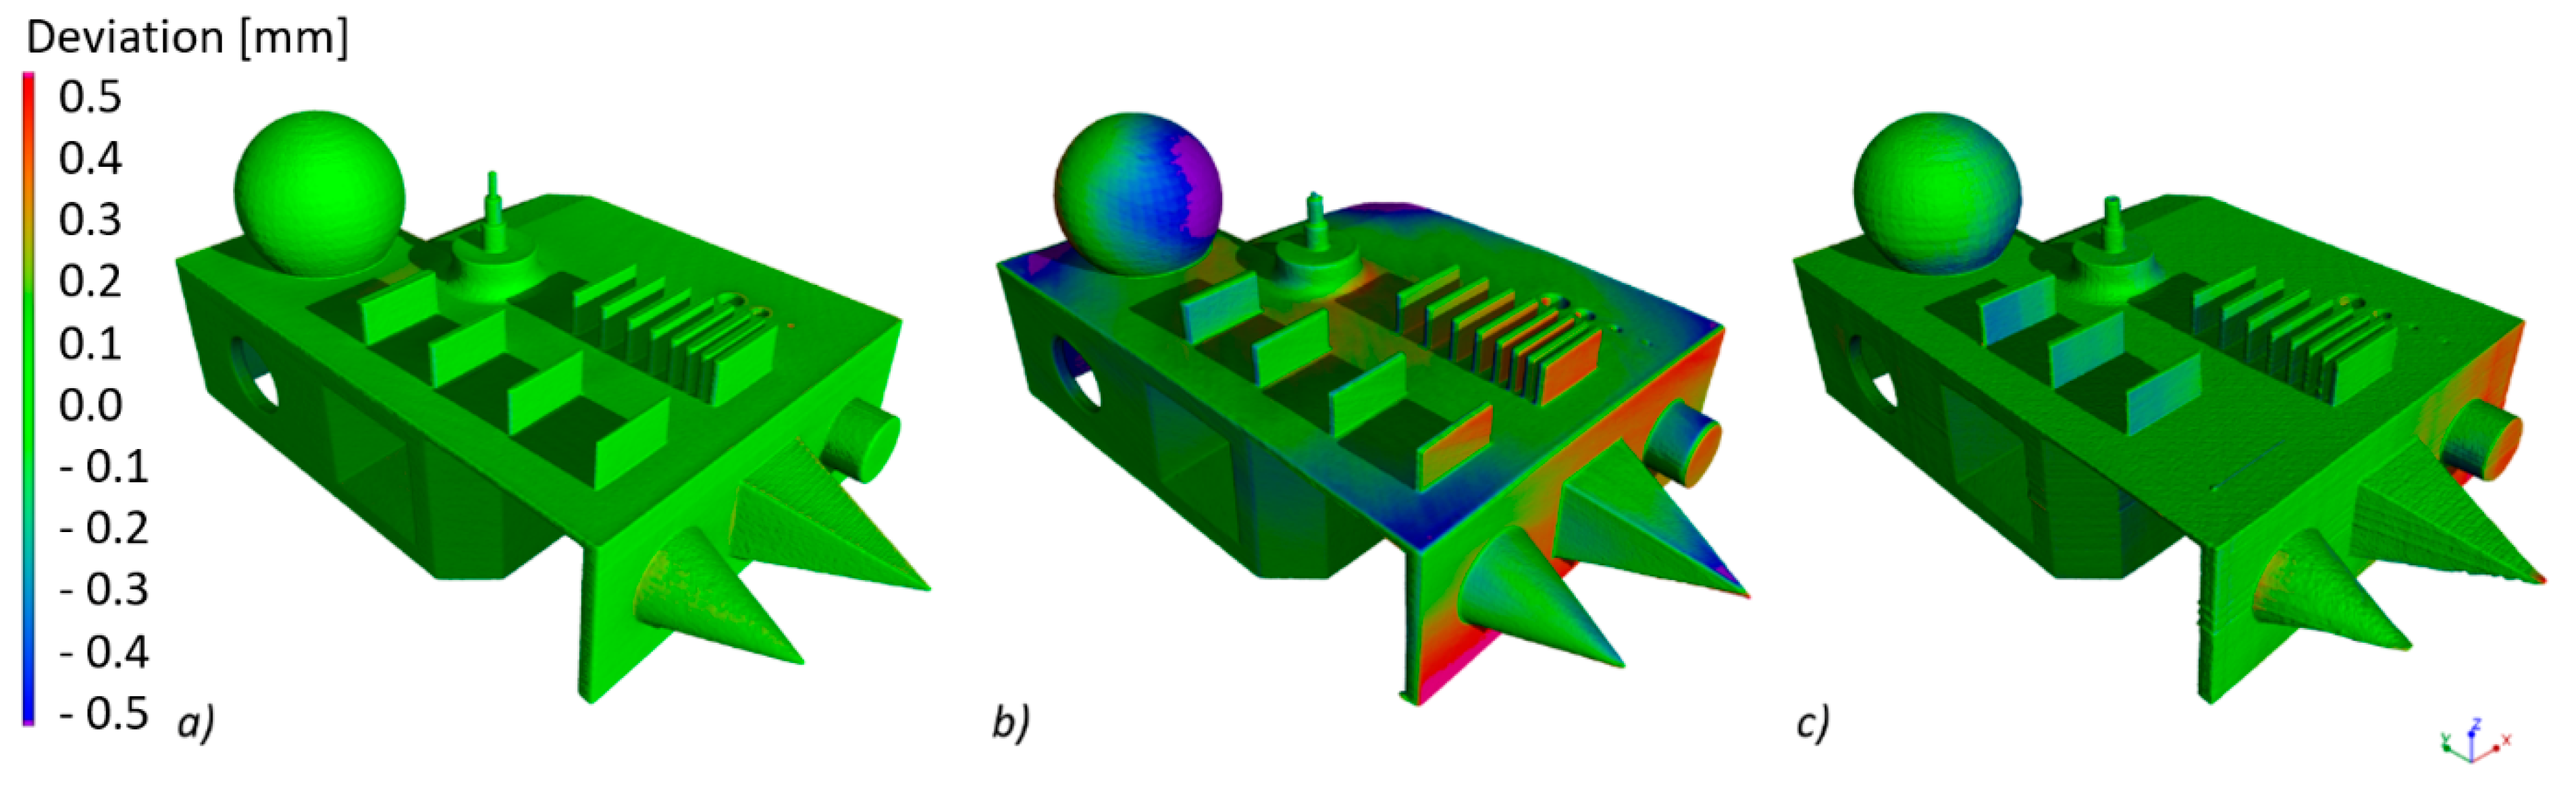
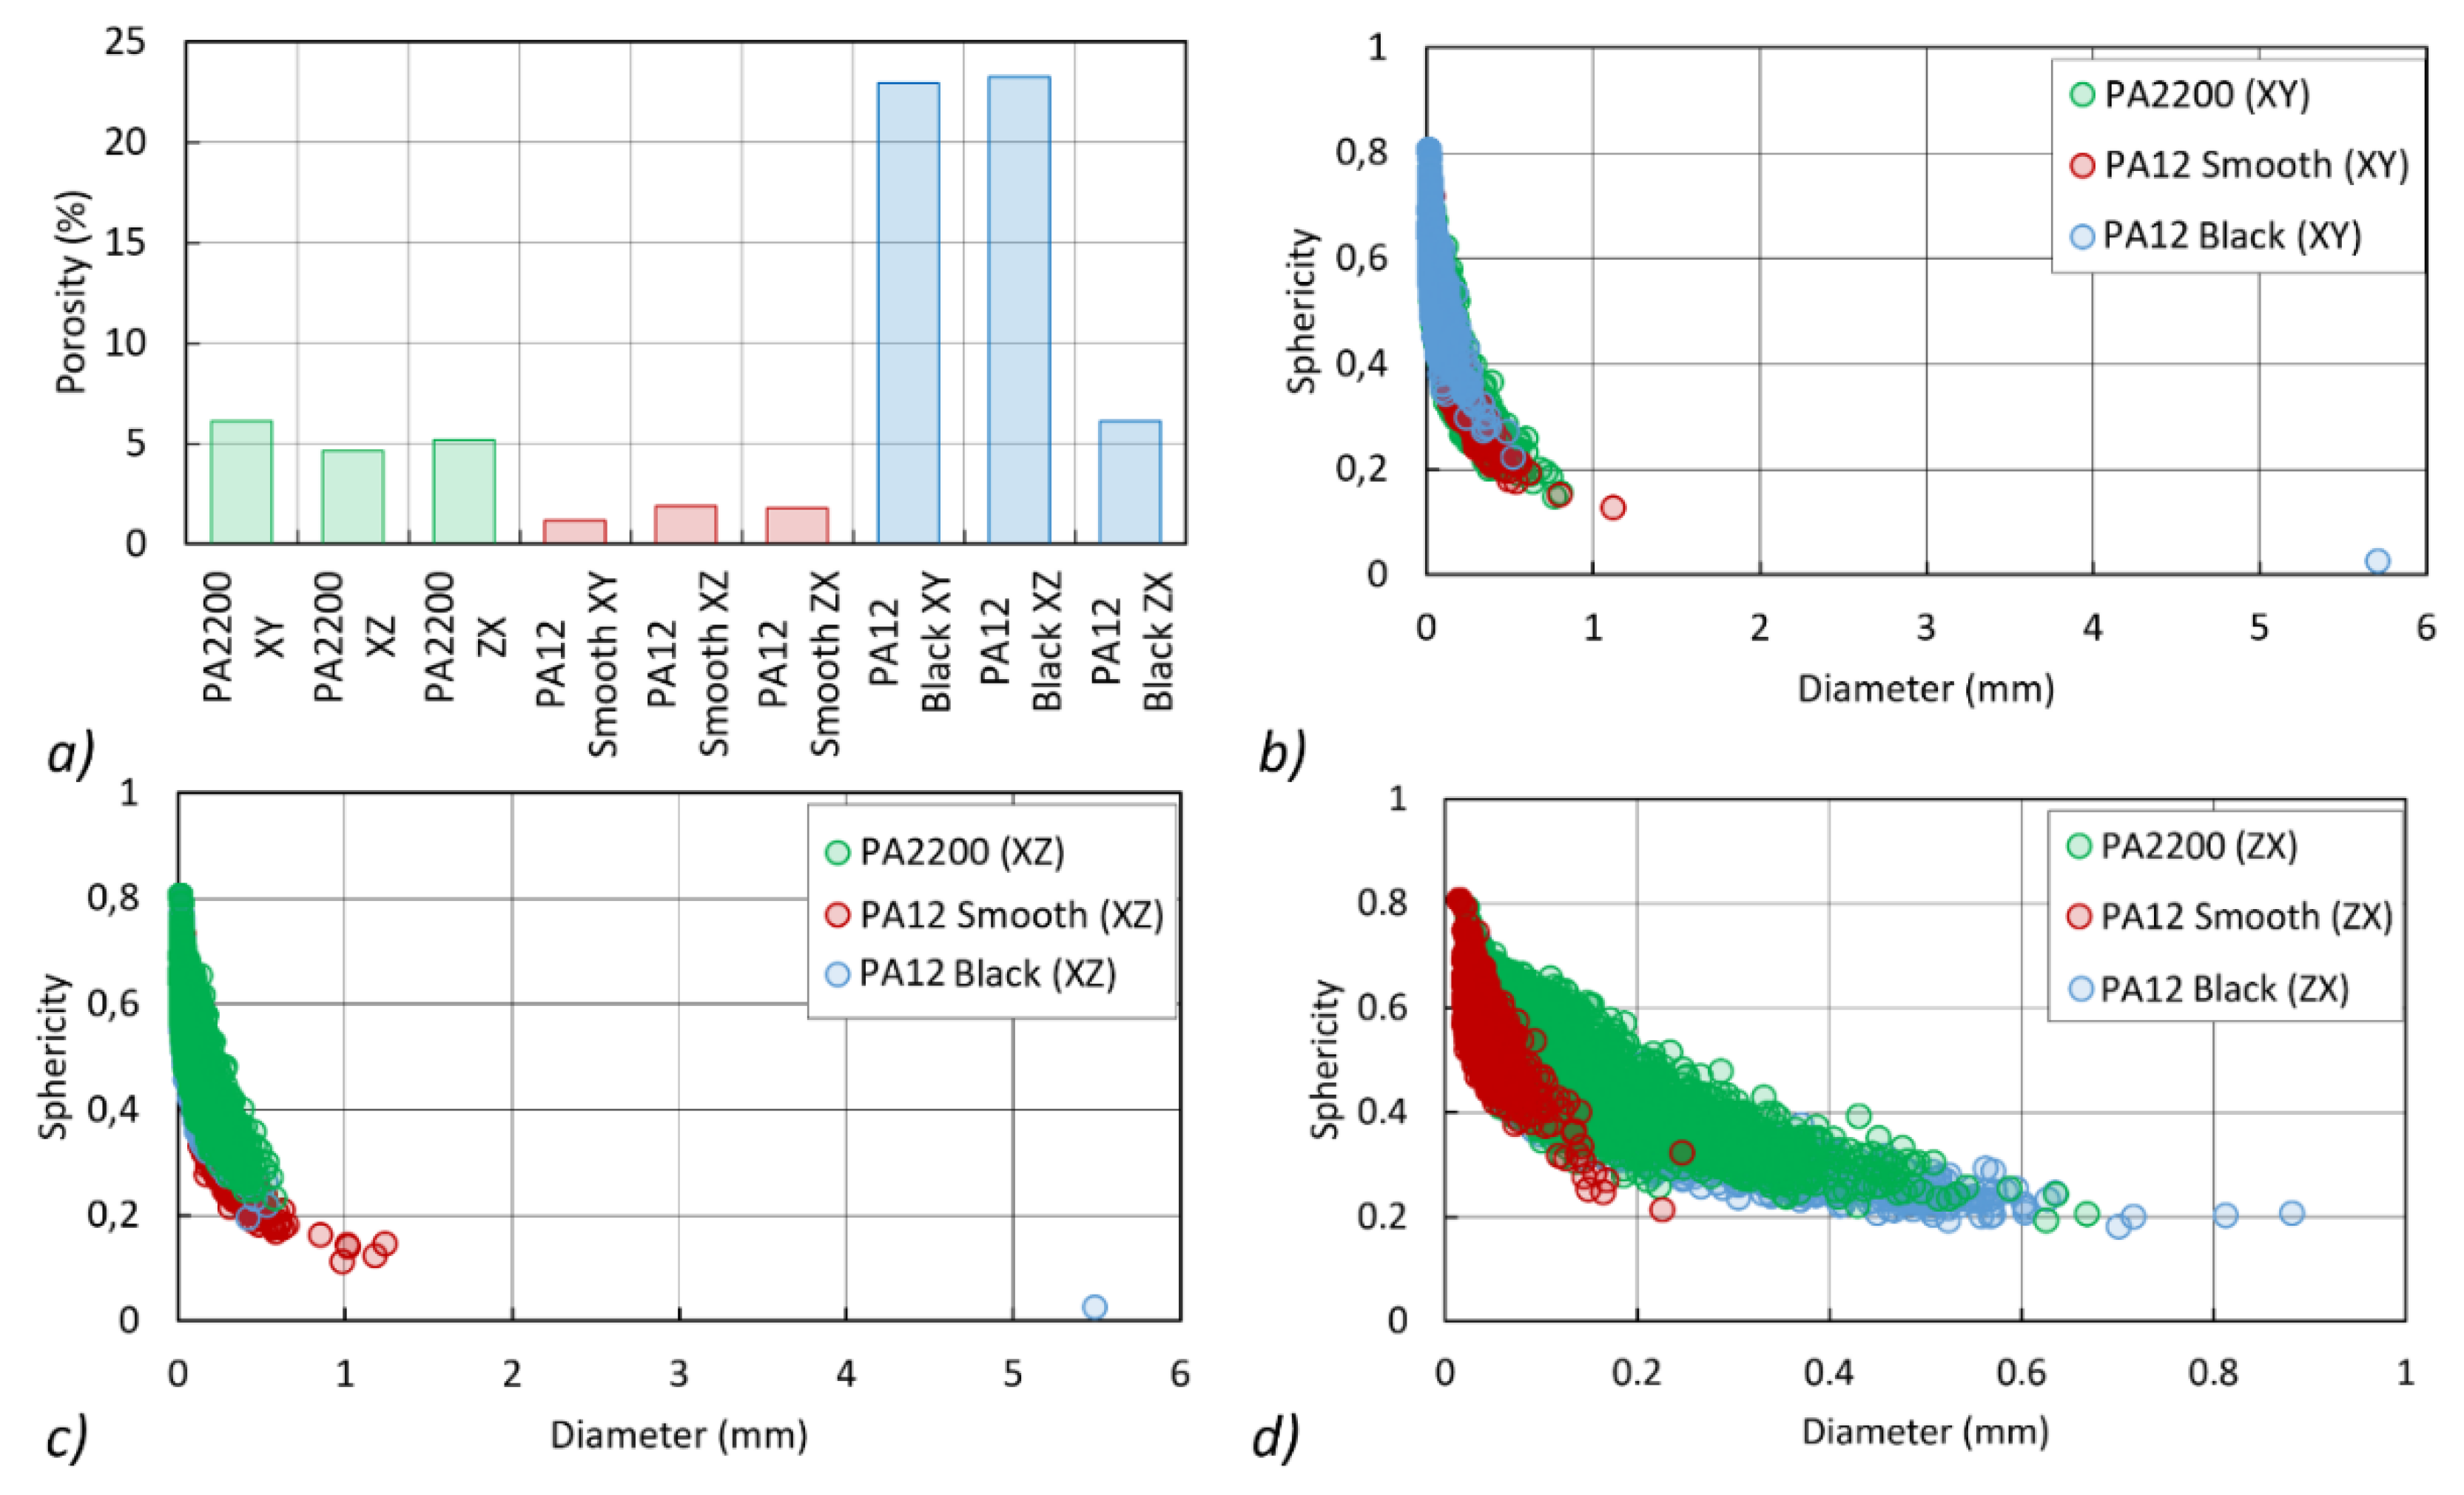
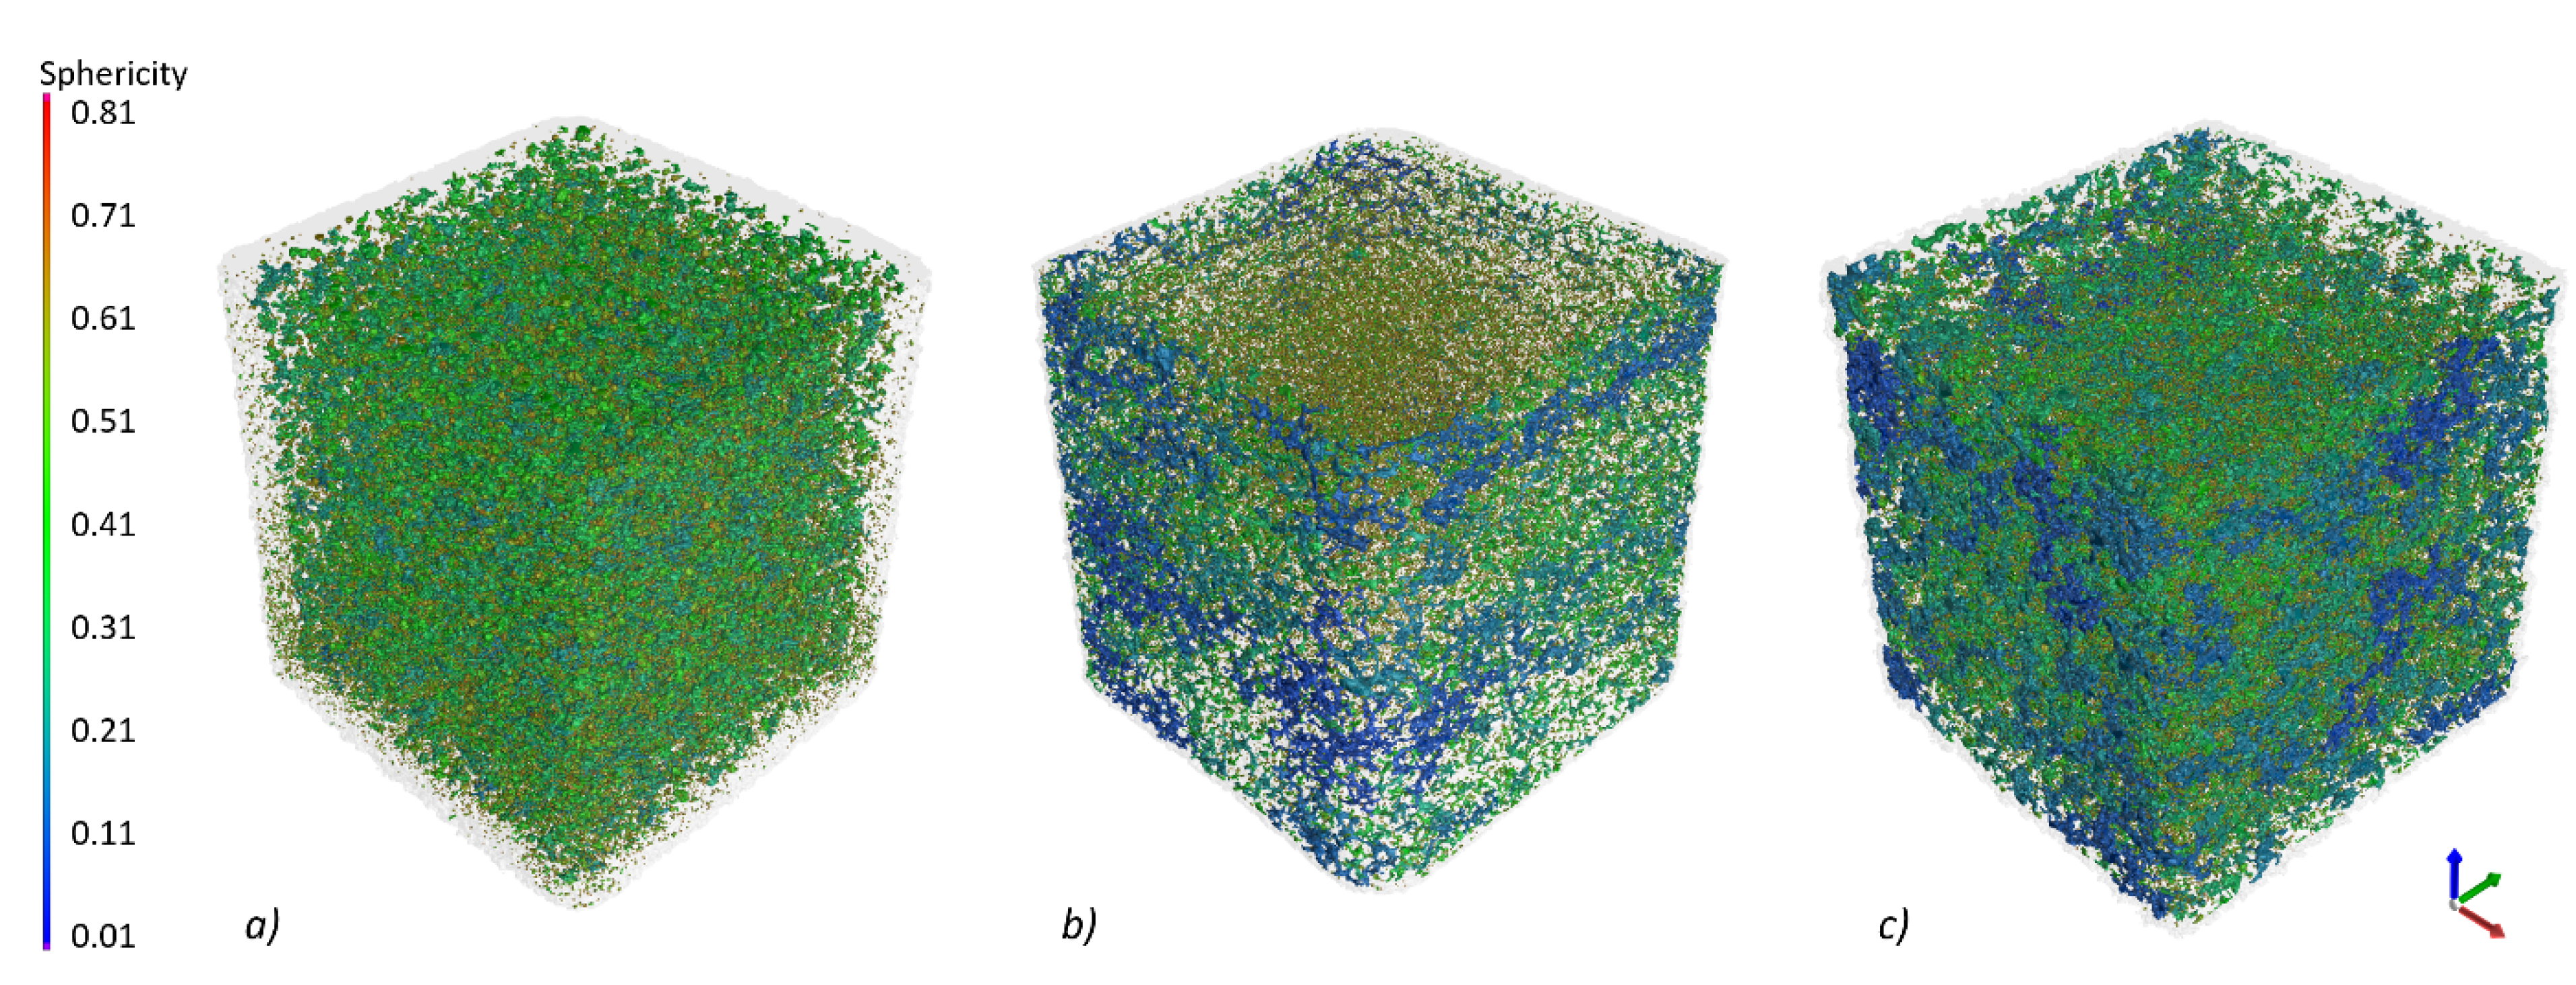
3.8. Computed Tomography

Geometry deviations in the form of a colour map for the manufactured benchmark samples are shown in Figure 8. As can be seen, the highest accuracy is provided by the industrial machine, which is illustrated by the even distribution of deviations. Moreover, the results obtained for the desktop machines differ from each other. The samples produced using the Lisa machine, which had greater mechanical properties, have a significantly lower accuracy than those manufactured using S1. Additionally, deviations of the surface are cumulated in certain areas of the model, which may indicate the greater impact of shrinkage.
A quantitative comparison of benchmark geometry is shown in the form of deviation distribution (Figure 9a) and the cumulative deviation histogram (Figure 9b) showing the percentage of the actual surface at a given distance from the nominal surface.
The largest absolute deviations of 0.416 mm were recorded for PA12 Smooth (Lisa). The smallest absolute deviations of 0.143 mm were obtained for the PA2200 sample (Formiga P110). The summary of absolute, positive and negative deviations for 90% of the compared surfaces is presented in Table 7.
The porosity occurring in the LS PA12 samples depends on many factors: process parameters such as the energy density supplied by the laser [34], insufficient packing and drying of the powder, low viscosity, coalescence, atmospheric gas trapped between particles and layers, and the off-gassing of degradation products [35].
The porosity of the samples produced using different devices can therefore vary significantly. The porosity analysis was registered for the region of interest located in the middle of each sample (Figure 10a). Thus, CT reconstruction carried out in this way enabled the detection of pores with diameters larger than 15.1 µm. Due to the complex structure of pores connected to the surface in the tested samples (Figure 10b), a porosity analysis was performed by taking into account closed and open pores (Figure 10c). This allows for more accurate results of samples produced using different devices when compared to the analysis of only closed porosity that was presented in the literature (56).
The lowest porosity value was recorded for the samples made from PA 12 Smooth powder. The porosity, in this case, did not exceed 1.9% for the samples produced in all three orientations (Figure 11a). For PA2200, the porosity for all build orientations ranged from 4.6 to 6.1%.
The highest porosity, exceeding 23%, was recorded for the PA12 Black XZ samples. The largest differences in porosity were observed for this series due to the build direction. For the PA12 Black ZX sample, the porosity was at the level of 6.1%. A comparison of the shape of pores (sphericity) and diameters for the analysed series is presented in Figure 10b–d. Open pores with diameters larger than 5 mm occur in PA12 Black XY and XZ samples. These pores have the most extensive structure (low sphericity) and occupy a significant part of the analysed volumes (Figure 10c). The differences between the shape of the pores occurring in samples built in the ZX plane are shown in Figure 12.

4. Conclusions

The conducted study revealed the variability of obtained material properties with regards to the machine’s configuration (its commercially available set—hardware, software and raw material).
(1)
Every tested powder is suitable for an LS process in terms of its morphology and flowability. A higher number of small particles in the case of PA12 Smooth can act in favour of surface quality, however the dynamic flowability is significantly decreased which can reduce productivity of powder application.
(2)
The thermal properties of every tested powder are similar. PA2200 provides the longest sintering window, which is in favour for uneven temperature distribution in the build chamber.
(3)
The differences in mechanical properties discovered in this study between desktop and industrial machines were bigger than between the output of industrial machines which were reported in previous works, for example by Stichel et al. [29].
(4)
Despite using a darkened powder which supports the absorption of laser radiation, desktop LS systems did not produce samples with mechanical properties as good as industrial LS. The most noticeable differences are in the case of an elongation at break, where industrial LS shows much higher results.
(5)
The highest accuracy and repeatability was presented by an industrial LS system, which was provided along with good mechanical properties. The low porosity observed in the case of PA12 Smooth was archived by the overheating by laser radiation which is clearly visible in the high surface deviation of the benchmark sample.
The conducted comparative study shows that the outcome of desktop and industrial LS machines may vary, despite the fact that it should be considered that LS desktop systems are constantly developed and that the changes in software can even improve the obtained production results.
In the future, it is planned to take into account the issue of the process parameter optimization. The topic discussed in this article focuses on the first iteration of commercially available desktop LS devices. At the time of publishing this article, the next generation of these devices has been announced and should be included in future papers.

Author Contributions

Conceptualization: M.O. and P.G.; methodology: M.O., P.G., and G.Z.; software: P.G., and G.Z.; validation: M.O., P.G., and G.Z.; resources and data curation: M.O., P.G., and G.Z.; writing—original draft preparation: M.O., P.G., and G.Z.; writing—review and editing: M.O., P.G., and G.Z.; visualization: P.G., and G.Z.; supervision: M.O.; project administration: M.O.; funding acquisition: G.Z. and P.G. All authors have read and agreed to the published version of the manuscript.

Funding

This work was supported by the National Centre for Research and Development in Poland (Grant No. LIDER/23/0098/L-9/17/NCBR/2018).

Conflicts of Interest

The authors declare no conflict of interest.

References

  1. Deckard, C.R. Method and Apparatus for Producing Parts by Selective Sintering. U.S. Patent 4,863,538, 5 September 1989. [Google Scholar]
  2. Deckard, C.R.; Rock, R.; Joseph, J. Method for Selective Laser Sintering with Layerwise Cross-Scanning. U.S. Patent 5,155,324, 13 October 1992. [Google Scholar]
  3. Beaman, J.J.; Deckard, C.R. Selective Laser Sinterng with Assisted Powder Handling. U.S. Patent 4,938,816, 3 July 1990. [Google Scholar]
  4. Gebhardt Andreas, K.J.T.L. 3D Printing—Understanding Additive Manufacturing, 2nd ed.; Carl Hanser Verlag: Munich, Germany, 2019; pp. 80–87. [Google Scholar]
  5. Wohlers, T. Wohlers Report 2018. In 3D Printing and Additive Manufacturing State of the Industry; Annual Worldwide Progress Report; Wohlers Associates Inc.: Fort Collins, CO, USA, 2018; ISBN 978-0-9913332-4-0. [Google Scholar]
  6. Schmidt, M.; Merklein, M.; Bourell, D.; Dimitrov, D.; Hausotte, T.; Wegener, K.; Overmeyer, L.; Vollertsen, F.; Levy, G.N. Laser based additive manufacturing in industry and academia. CIRP Ann. 2017, 66, 561–583. [Google Scholar] [CrossRef]
  7. Chatham, C.A.; Long, T.E.; Williams, C.B. A review of the process physics and material screening methods for polymer powder bed fusion additive manufacturing. Prog. Polym. Sci. 2019, 93, 68–95. [Google Scholar] [CrossRef]
  8. Schmid, M. Laser Sintering with Plastics: Technology, Processes, and Materials; Carl Hanser Verlag GmbH & Co. KG: Munich, Germany, 2018; pp. I–XIII. ISBN 978-1-56990-683-5. [Google Scholar]
  9. Kinstlinger, I.S.; Bastian, A.; Paulsen, S.J.; Hwang, D.H.; Ta, A.H.; Yalacki, D.R.; Schmidt, T.; Miller, J.S. Open-Source Selective Laser Sintering (OpenSLS) of nylon and biocompatible polycaprolactone. PLoS ONE 2016, 11, 1–26. [Google Scholar] [CrossRef] [PubMed] [Green Version]
  10. Fina, F.; Madla, C.M.; Goyanes, A.; Zhang, J.; Gaisford, S.; Basit, A.W. Fabricating 3D printed orally disintegrating printlets using selective laser sintering. Int. J. Pharm. 2018, 541, 101–107. [Google Scholar] [CrossRef] [PubMed]
  11. Siavash, H.K. Additive manufacturing in the spare parts supply chain: Hub configuration and technology maturity. Rapid Prototyp. J. 2018, 24, 1178–1192. [Google Scholar] [CrossRef] [Green Version]
  12. Płatek, P.; Baranowski, P.; Cieplak, K.; Sarzyński, M.; Sienkiewicz, J.; Janiszewski, J.; Małachowski, J. Investigation on deformation process of cellular structures with gradient topology manufactured additively. AIP Conf. Proc. 2019, 2078, 020108. [Google Scholar] [CrossRef]
  13. Homepage Company EOS (Electro Optical Systems) FORMIGA P110. Available online: https://www.eos.info/en (accessed on 20 August 2019).
  14. Homepage Company Sinterit Sinterit Lisa Specifications. Available online: https://www.sinterit.com/ (accessed on 20 August 2019).
  15. Homepage Company Sintratec Sintratec Kit. Available online: https://sintratec.com/ (accessed on 20 August 2019).
  16. Schmid, M.; Amado, F.; Levy, G.; Wegener, K. Flowability of powders for Selective Laser Sintering (SLS) investigated by Round Robin Test. In High Value Manufacturing: Advanced Research in Virtual and Rapid Prototyping, Proceedings of the 6th International Conference on Advanced Research in Virtual and Rapid Prototyping, Leiria, Portugal, 1–5 October 2013; VR@P 2013; CRC Press: Boca Raton, FL, USA, 2014; pp. 95–99. [Google Scholar] [CrossRef]
  17. Hayes, G.D. Food Engineering Data Handbook; John Wiley & Sons, Ltd.: New York, NY, USA, 1987; ISBN 978-0470208403. [Google Scholar]
  18. Amado, A.; Schmid, M.; Levy, G.; Wegener, K. Advances in SLS Powder Characterization. In Proceedings of the International Conference on Solid Freeform Fabrication 2011 (SFF’11), Austin, TX, USA, 17 August 2011; Volume 1, pp. 438–452. [Google Scholar]
  19. Tay, J.Y.S.; Liew, C.V.; Heng, P.W.S. Powder Flow Testing: Judicious Choice of Test Methods. AAPS PharmSciTech 2017, 18, 1843–1854. [Google Scholar] [CrossRef] [PubMed]
  20. Lumay, G.; Boschini, F.; Traina, K.; Bontempi, S.; Remy, J.C.; Cloots, R.; Vandewalle, N. Measuring the flowing properties of powders and grains. Powder Technol. 2012, 224, 19–27. [Google Scholar] [CrossRef]
  21. Lumay, G.; Tripathi, N.M.; Scientist, P.; Francqui, F. How to Gain a Full Understanding of Powder Flow Properties, and the Benefits of Doing so. ONdrugDelivery Mag. 2019, 102, 42–46. [Google Scholar]
  22. Yan, C.Z.; Shi, Y.S.; Yang, J.S.; Liu, J.H. An organically modified montmorillonite/nylon-12 composite powder for selective laser sintering. Rapid Prototyp. J. 2011, 17, 28–36. [Google Scholar] [CrossRef]
  23. Schmid, M.; Wegener, K. Thermal and molecular properties of polymer powders for Selective Laser Sintering (SLS). AIP Conf. Proc. 2016, 1779. [Google Scholar] [CrossRef] [Green Version]
  24. Verbelen, L.; Dadbakhsh, S.; Van Den Eynde, M.; Kruth, J.P.; Goderis, B.; Van Puyvelde, P. Characterization of polyamide powders for determination of laser sintering processability. Eur. Polym. J. 2016, 75, 163–174. [Google Scholar] [CrossRef]
  25. Schmid, M.; Schmid, M. Laser Sintering with Plastics; Carl Hanser Verlag: Munich, Germany, 2018; ISBN 9781569906835. [Google Scholar]
  26. Mielicki, C.; Gronhoff, B.; Wortberg, J. Effects of laser sintering processing time and temperature on changes in polyamide 12 powder particle size, shape and distribution. In AIP Conference Proceedings; American Institute of Physics: College Park, MD, USA, 2014; Volume 1593, pp. 728–731. [Google Scholar] [CrossRef] [Green Version]
  27. Schmid, M.; Amado, A.; Wegener, K. Polymer powders for Selective Laser Sintering. In AIP Conference Proceedings; American Institute of Physics: College Park, MD, USA, 2014; Volume 1664. [Google Scholar] [CrossRef] [Green Version]
  28. Schmid, M.; Kleijnen, R.; Vetterli, M.; Wegener, K. Influence of the origin of polyamide 12 powder on the laser sintering process and laser sintered parts. Appl. Sci. 2017, 7, 462. [Google Scholar] [CrossRef] [Green Version]
  29. Stichel, T.; Frick, T.; Laumer, T.; Tenner, F.; Hausotte, T.; Merklein, M.; Schmidt, M. A Round Robin study for Selective Laser Sintering of polyamide 12: Microstructural origin of the mechanical properties. Opt. Laser Technol. 2017, 89, 31–40. [Google Scholar] [CrossRef]
  30. Wegner, A.; Witt, G. Correlation of Process Parameters and Part Properties in Laser Sintering using Response Surface Modeling. Phys. Procedia 2012, 39, 480–490. [Google Scholar] [CrossRef] [Green Version]
  31. Hofland, E.; Baran, I.; Wismeijer, D. Correlation of Process Parameters with Mechanical Properties of Laser Sintered PA12 Parts. Adv. Mater. Sci. Eng. 2017, 2017, 1–11. [Google Scholar] [CrossRef] [Green Version]
  32. Bacchewar, P.B.; Singhal, S.K.; Pandey, P.M. Statistical modelling and optimization of surface roughness in the selective laser sintering process. Proc. Inst. Mech. Eng. Part B J. Eng. Manuf. 2007, 221, 35–52. [Google Scholar] [CrossRef]
  33. Beard, M.A.; Ghita, O.R.; Evans, K.E. Using Raman spectroscopy to monitor surface finish and roughness of components manufactured by selective laser sintering. J. Raman Spectrosc. 2011, 42, 744–748. [Google Scholar] [CrossRef]
  34. Dupin, S.; Lame, O.; Barrès, C.; Charmeau, J.-Y. Microstructural origin of physical and mechanical properties of polyamide 12 processed by laser sintering. Eur. Polym. J. 2012, 48, 1611–1621. [Google Scholar] [CrossRef]
  35. Bain, E.D.; Garboczi, E.J.; Seppala, J.E.; Parker, T.C.; Migler, K.B. AMB2018-04: Benchmark Physical Property Measurements for Powder Bed Fusion Additive Manufacturing of Polyamide 12. Integr. Mater. Manuf. Innov. 2019, 8, 335–361. [Google Scholar] [CrossRef]
Figure 1. Specimen’s geometry: (a) benchmark model with build orientation and small features explained, (b) tensile specimen’s orientation in build direction and surfaces used to measure roughness.
Applsci 10 06184 g001
Figure 2. SEM images of powder particles (a) PA2200, (b) PA12 Smooth, (c) PA12 Black.
Applsci 10 06184 g002
Figure 3. Cohesive index curves recorded as a function of the increasing (↑) and decreasing (↓) rotation speed for polyamide powders.
Applsci 10 06184 g003
Figure 4. Cumulative distribution and distribution density of the tested polyamides powders.
Applsci 10 06184 g004
Figure 5. Differential Scanning Calorimetry (DSC) thermograms of powders PA2200, PA12 Smooth and PA12 Black.
Applsci 10 06184 g005
Figure 6. Benchmark and tensile specimens produced using (a) Formiga P110 and PA2200, (b) Lisa and PA12 Smooth, (c) S1 and PA12 Black.
Applsci 10 06184 g006
Figure 7. Results of mechanical testing presented as: (a) Young’s modulus, (b) Ultimate Tensile Strength and (c) Elongation at break of the PA2200, PA12 Smooth and PA12 Black with distinction of the build orientation.
Applsci 10 06184 g007
Figure 8. Graphic representation of surface deviation as a result of actual/nominal analysis of (a) PA2200, (b) PA12 Smooth, (c) PA12 Black.
Applsci 10 06184 g008
Figure 9. Actual/nominal analysis: (a) histograms of geometry deviations, (b) cumulative deviation histogram.
Applsci 10 06184 g009
Figure 10. Porosity analysis: (a) sample PA12 Black XZ with analysed region of interest (ROI), (b) cross-sections in XY and XZ plane, (c) 3D view of porosity.
Applsci 10 06184 g010
Figure 11. Porosity analysis: (a) dependency of sphericity and pore diameter related to the different building strategy, (b) XY, (c) XZ, (d) ZX.
Applsci 10 06184 g011
Figure 12. 3D pores visualisation: (a) PA2000 ZX (Formiga P110), (b) PA12 Smooth ZX (Lisa), (c) PA12 Black ZX (S1).
Applsci 10 06184 g012
Table 1. Basic Hardware Data Regarding the Tested Laser Sintering (LS) Machines [13,14,15].
ManufacturerBuild Volume [mm × mm × mm]LaserHeating SystemLayer Thickness [mm]Powder Application SystemMaterials
EOS GmbH
P110
(Germany)
200 × 250 × 330 with inert gas atmosphereCO2 (30 W) with scanner head
(1060 nm)
Resistance heaters—working chamber and receiving chamber0.06, 0.1, 0.12Recoater (blade) with circular movementPA12, PA12/GF, PA12/MF, PA11, TPE, PS
Sinterit
Lisa
(Poland)
150 × 200 × 150 without inert gas atmosphereIR Diode (5 W) on XY kinematics
(808 nm)
Heated piston, Heated cylinder, Heated feed bed, Heated print bed—max 190 °C0.075 ÷ 0.175Recoater with linear movementPA12, TPE, TPU
Sintratec
S1 (Switzerland)
110 × 110 × 160 without inert gas atmosphereBlue Diode (2.3 W) with scanner head
(445 nm)
Lamp heating of the working chamber0.05 ÷ 0.1 (preferable 0.1)Recoater with linear movementPA12, TPE
Table 2. Laser Sintering Process Parameters Used to Produce Parts According to Each Machine.
MachineMaterialMixing Ratio
(Used: Virgin)
Layer Thickness [mm]Laser Power [W]Temperature on Print Surface
[°C]
Temperature in Removing Chamber [°C]Scanning Speed (Hatching)
[mm/s]
Formiga P110PA220050:500.1211671482500
LisaPA12 Smooth70:300.1Laser power ratio-1170n/an/a
S1PA12 Black30:700.15170140650
Table 3. The Hausner Ratio (HR), First Avalanche Angle, Flowing Angle, Cohesive Index and Particle Size Distribution of Different Machine Manufacturer’s Polyamide 12 Powders.
MaterialHR [a.u.]AA [°]αf [°]σf [a.u.]d50 [µm](d90-d10)/d50<10 µm [%]
at 30 rpm (↑)
PA22001.1440.152.820.959.30.871.52
PA12 Smooth1.0962.951.460.541.00.640.0
PA12 Black1.1437.636.025.559.40.931.62
Table 4. Thermal Properties of Powders PA2200, PA12 Smooth, and PA12 Black.
MaterialTm-onset [°C]Tc-onset [°C]ΔT [°C]ΔHm [J/g]ΔHc [J/g]
PA2200180.6151.029.6108.664.0
PA12 Smooth176.5157.419.1157.384.6
PA12 Black179.9158.421.5175.792.7
Table 5. Comparison of Mechanical Properties of PA 12 Manufactured in Different Industrial LS Systems.
Company/Material/SystemEOS | PA22003D Systems | DuraForm ProX PAProdways | PA12-L 1600 and Farsoon Technologies | FS 3300PA
Formiga P110 by WUST *(1)Unknown Systems by EOS (2)ProX500 by WUSTUnknown Systems by 3D Systems (2)Unknown Systems by Prodways and Farsoon Tech. (2)
Tensile Modulus [MPa]
X Direction1920.0 (32.8)18001834.0 (50.2)17701602
Y Direction1992.3 (22.5)18001781.7 (54.9)
Z Direction1957.2 (22.8)17501839.8 (45.4)
Tensile Strength [MPa]
X Direction50.6 (1.3)5247.9 (0.8)5046
Y Direction52.9 (1.4)5247.6 (1.6)
Z Direction52.2 (1.3)5245.9 (2.1)
Strain at break [%]
X Direction24.6 (1.4)2022.7 (2.2)2236
Y Direction24.6 (1.4)2022.2 (2.8)
Z Direction15.2 (1.3)710.2 (4.3)
(*) Wroclaw University of Science and Technology; (1) Present work in manuscript; (2) Values according to corresponding manufacturers’ data sheet.
Table 6. Average Surface Roughness of the Measured Samples.
MaterialSurfaceRa [µm]Rz [µm]Rt [µm]
PA2200
(Formiga P110)
top18.1205.4235.4
bottom17.06196.6222.5
side17.59187.5226.3
PA12 Smooth
(Lisa)
top18.44188.2213.2
bottom16.90178.5201.6
side16.27181.2202.0
PA12 Black
(S1)
top24.97233.0261.3
bottom22.85210.9230.6
side26.79222.9247.5
The underline shows the lowest value on each sample group.
Table 7. Actual/Nominal Analysis Results of Benchmark’s Computed Tomography (CT) Scans.
Cumulated Variance Distribution of 90% of the SurfacePA2200
[mm]
PA12 Smooth [mm]PA12 Black [mm]
Absolute0.1430.4160.217
Negative0.1210.3950.160
Positive0.1480.4500.240

