1. Introduction
Engineers create and exchange engineering specification documents to develop a product. One of the efficient ways of representing product specification in engineering specification documents is a table. A table is a physical and logical representation to organize structured data [
1]. Tables in documents provide a compact method for presenting relational information in an immediate and intuitive manner, while simultaneously organizing and indexing the information.
In the case of engineering specification documents, tables are frequently used to represent an organized product specification explicitly. Table format for product specification helps engineers to understand the meaning of the product specification quickly. Generally, tables are designed in so many graphically different ways such as simple hierarchies of strings, relational structures like database tables, or any combinations of them. This paper only focused on tables which are structured for product specification, so that they must have graphical lines to represent cells in a table and each cell has only one content.
Figure 1 and
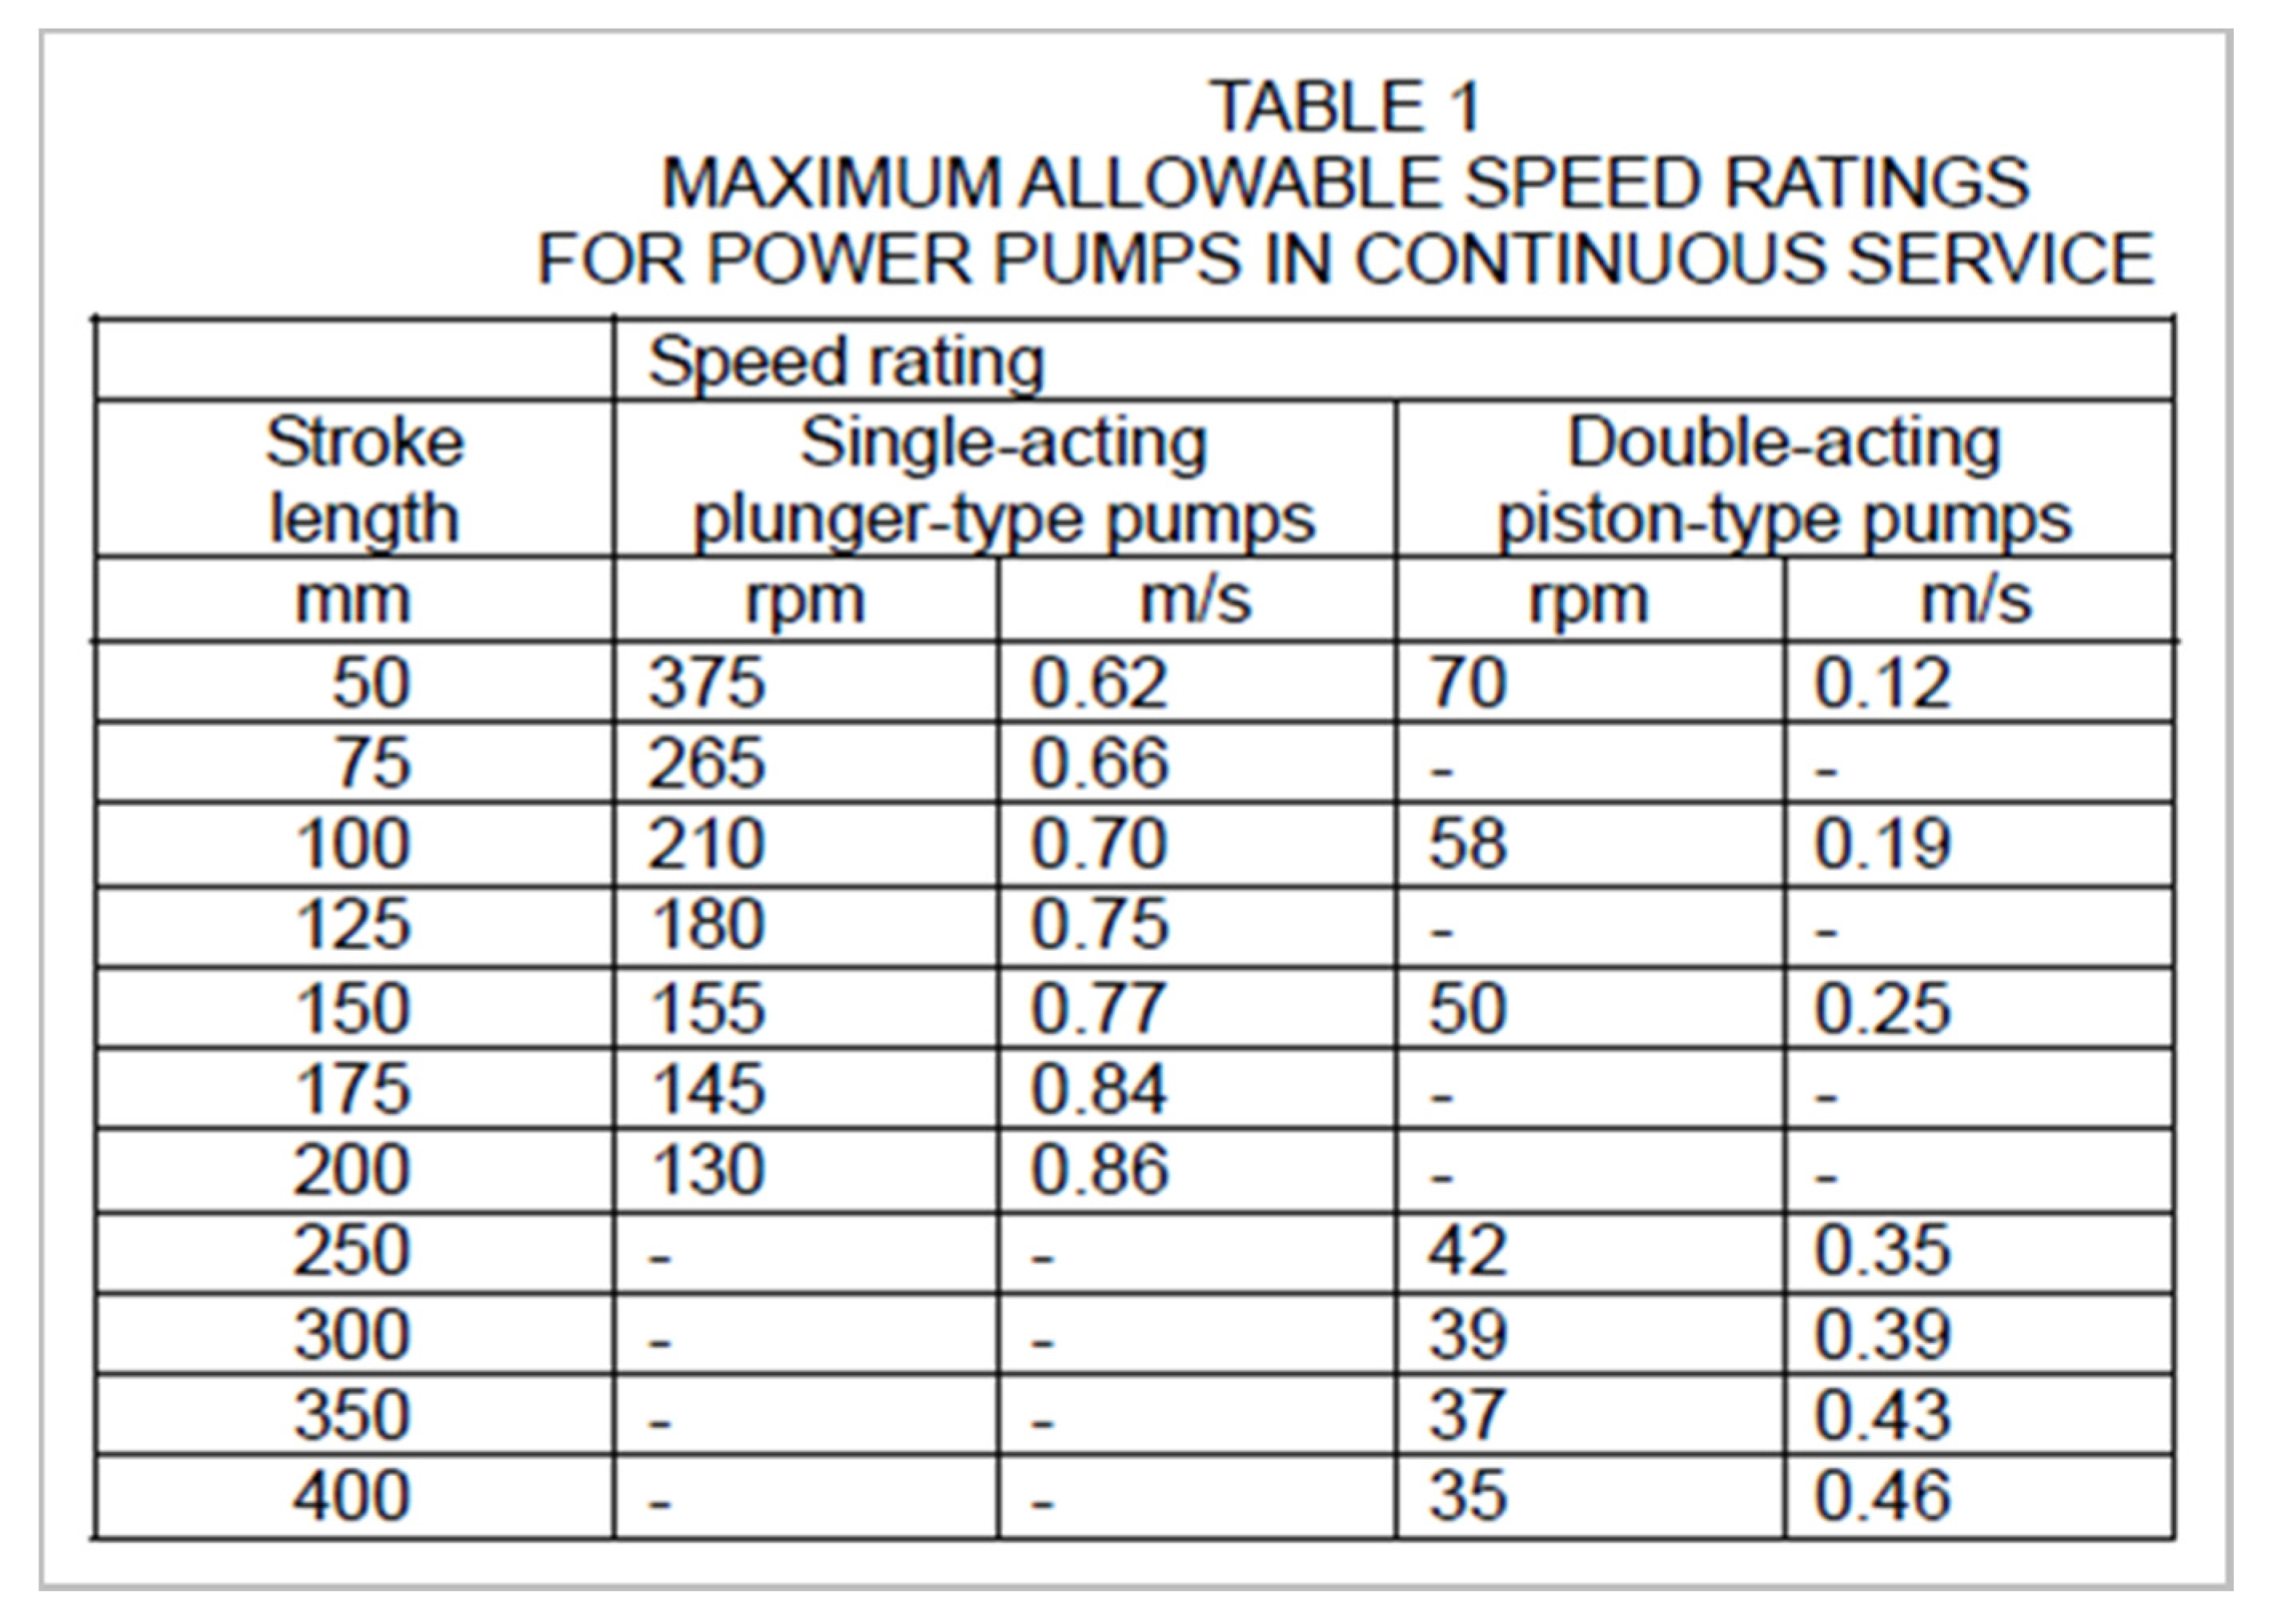
Figure 2 are table examples illustrating the restricted table forms. They have horizontal and vertical lines, and they present a set of relations holding between hierarchical concepts for product specifications.
The table in
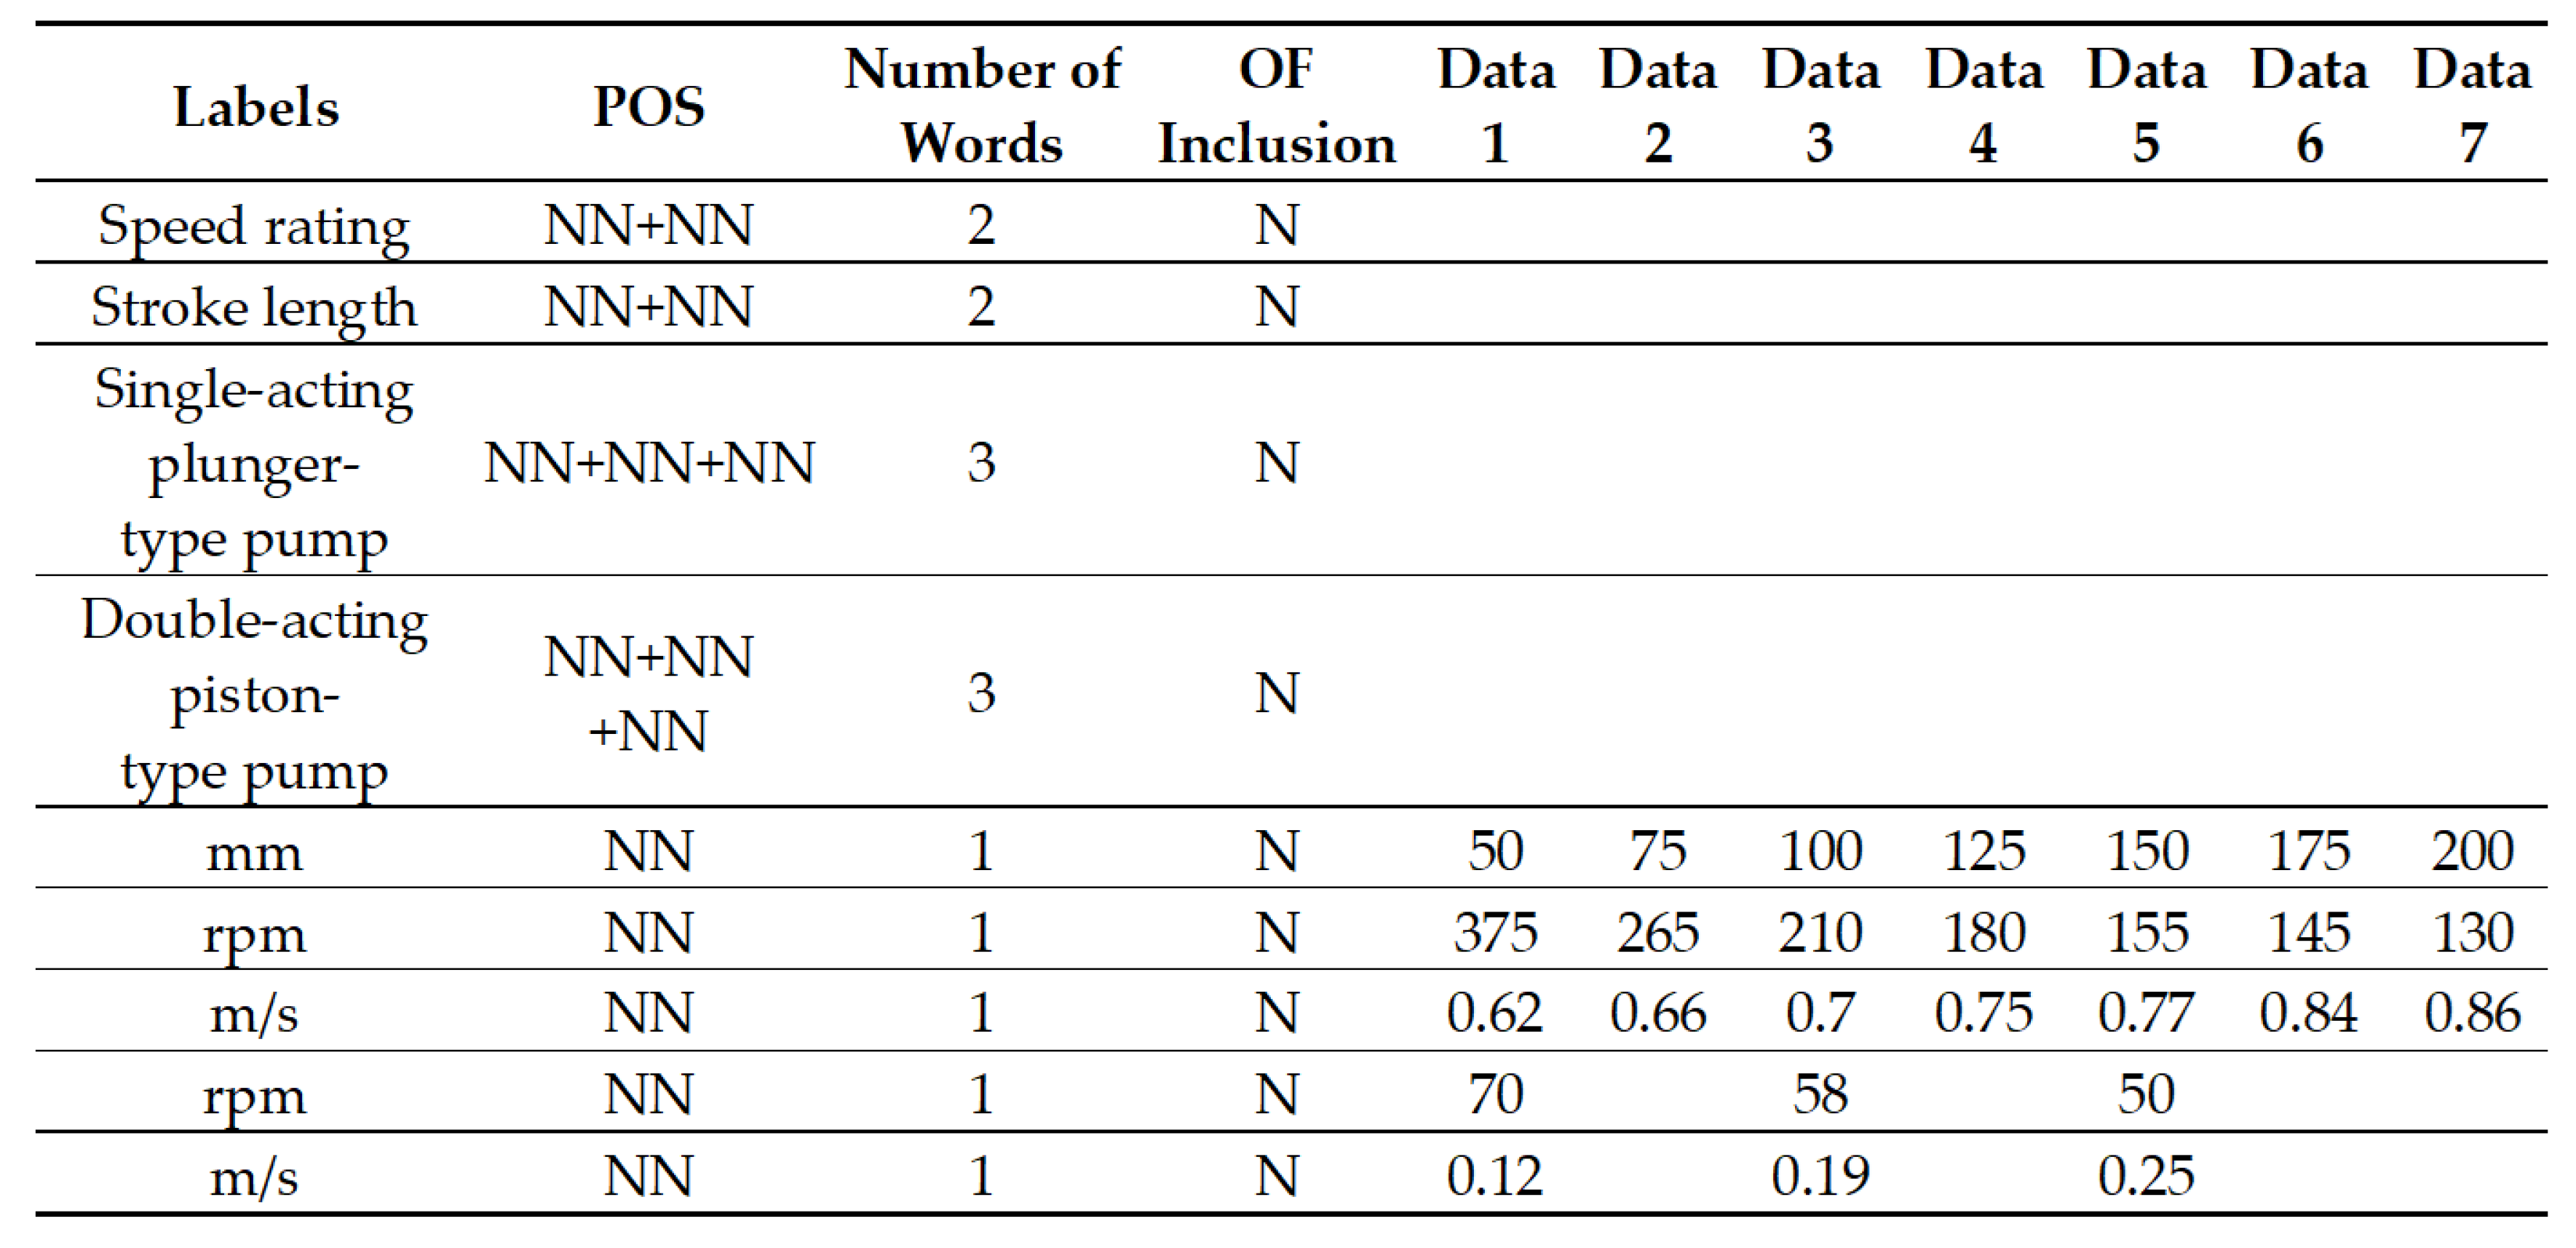
Figure 1 has nested multiple rows of column headers (labels) to explain the meanings of data in numbers. As shown in the title of the table in
Figure 1, the table explains speed rating of two different pumps with different ranges of stroke length. The data in the table shows speed rating in two different units; rpm and m/s. Engineers can easily understand the table by recognizing the structure of the table and by catching the meaning of terms in the table.
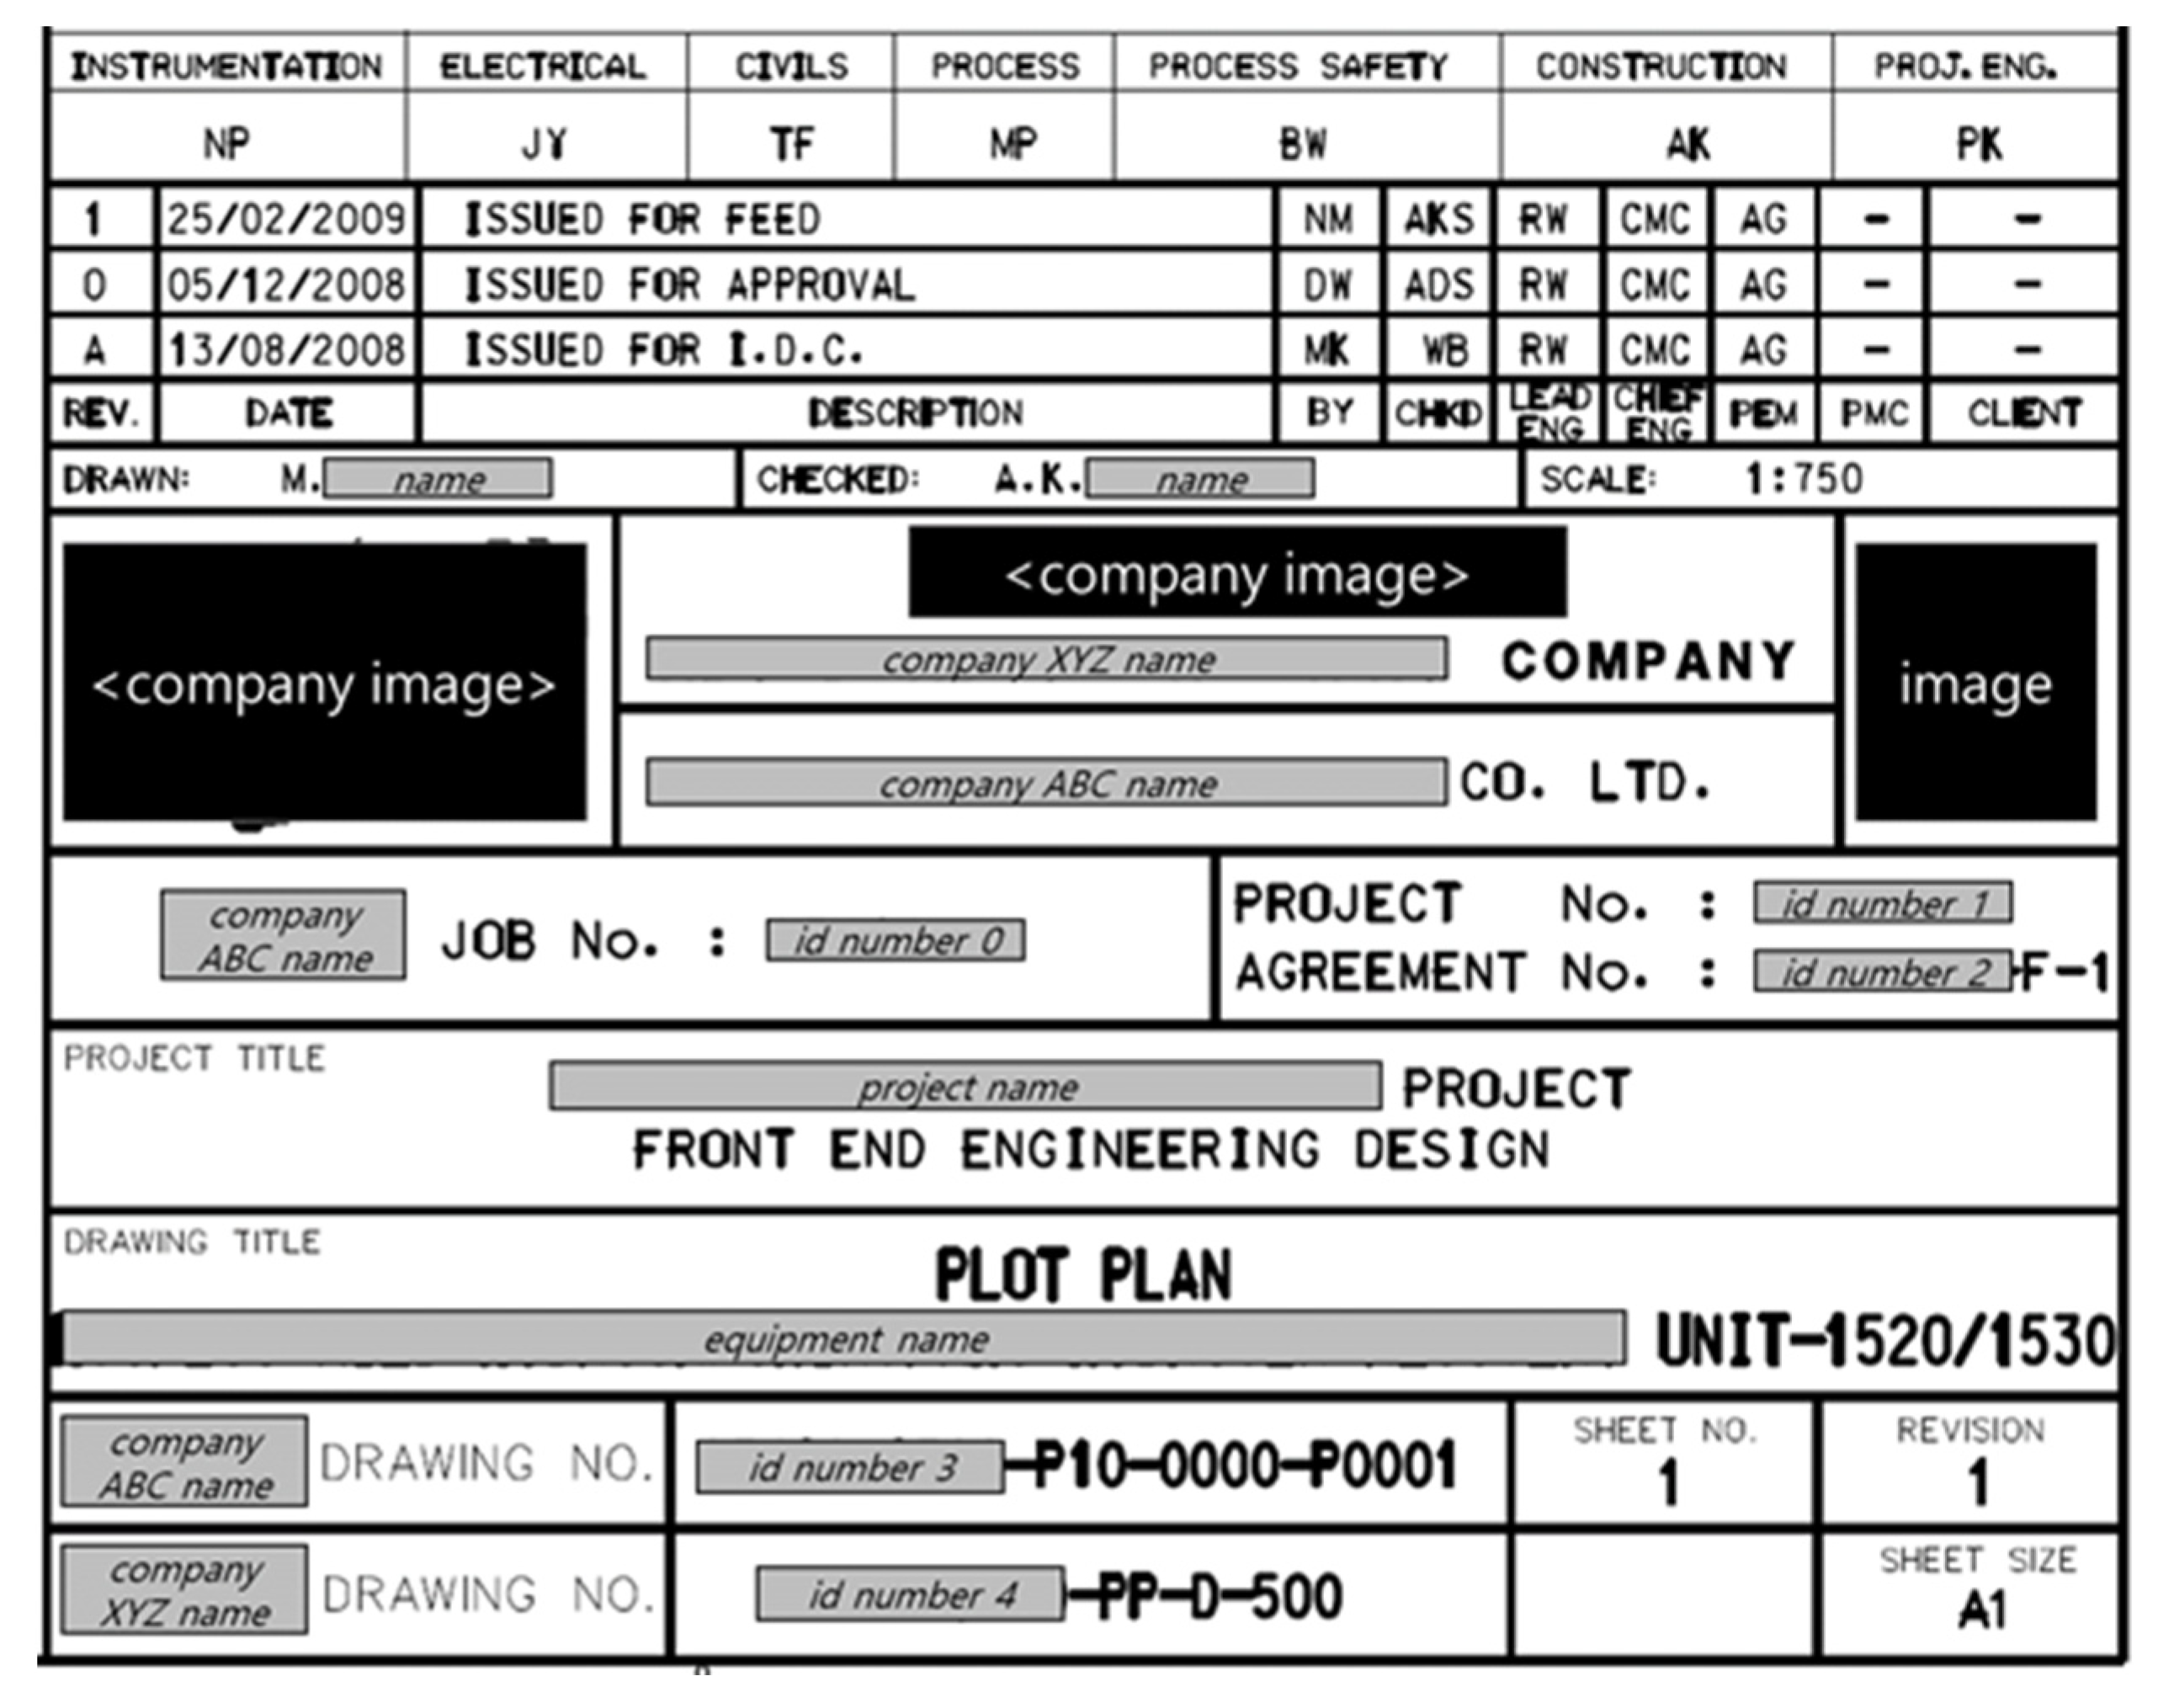
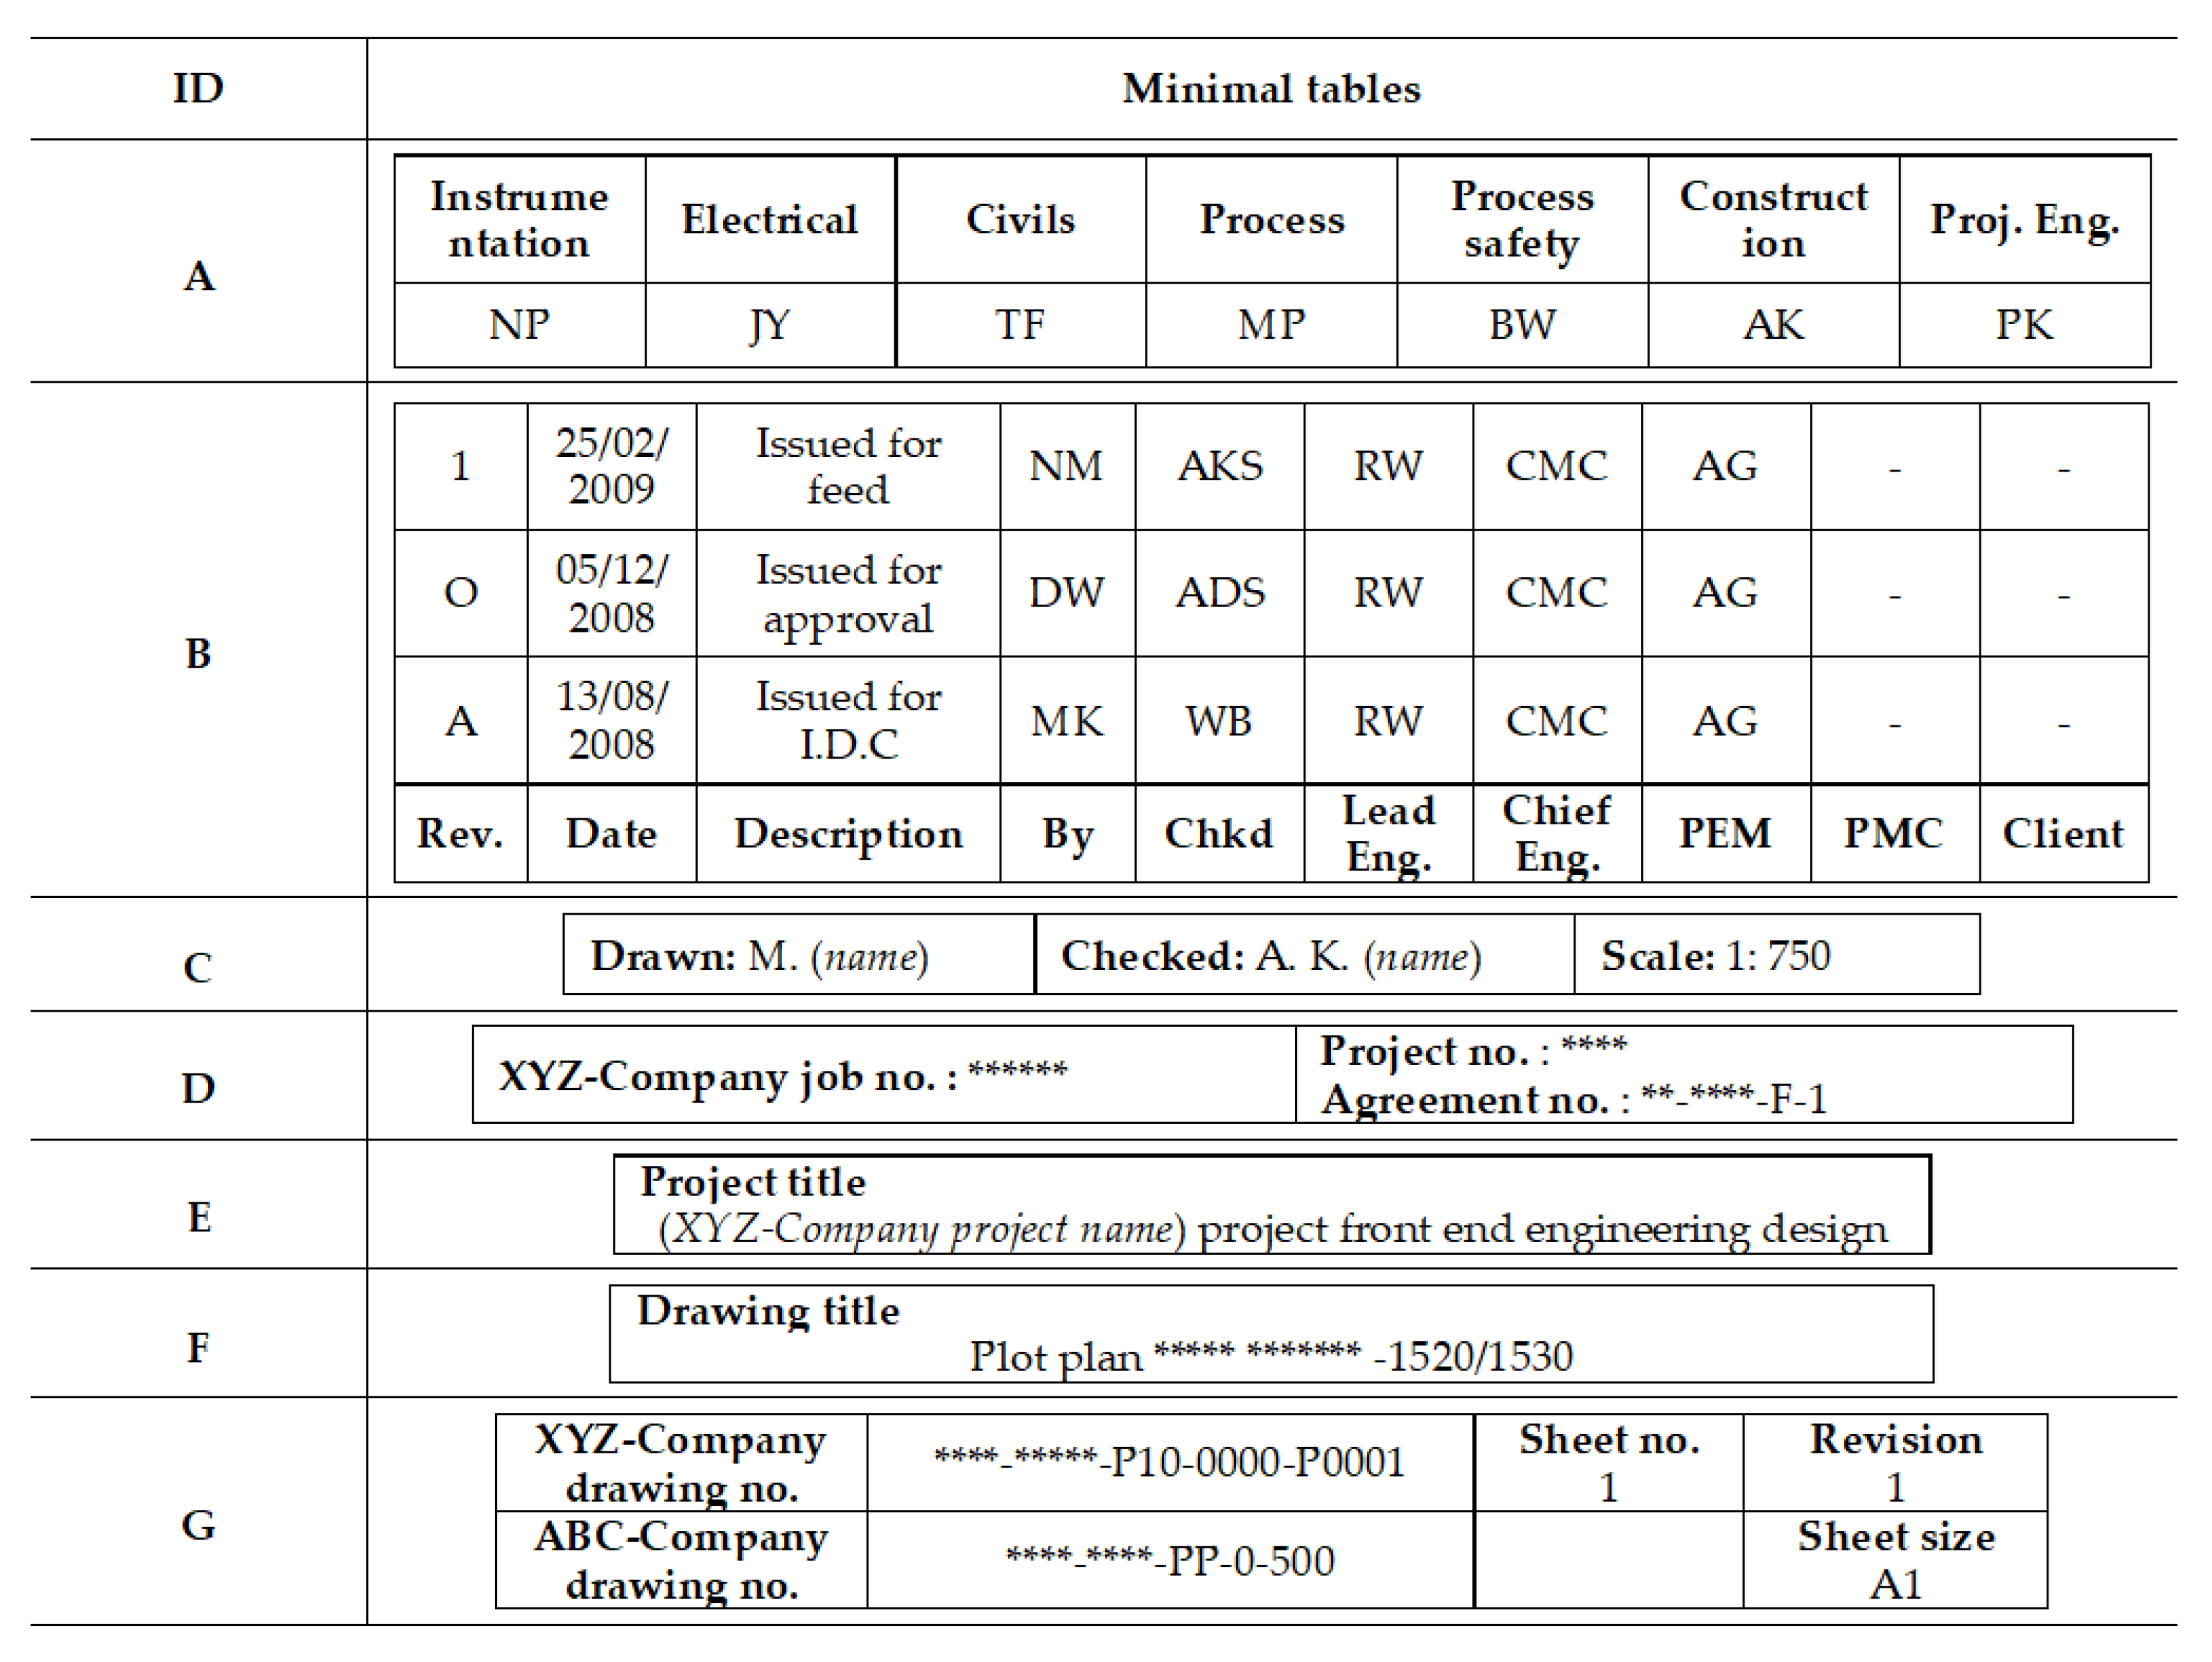
Figure 2 shows a table example in an engineering specification drawing. Tables in engineering drawings include meta-information of drawings such as drawing version, people involved in the drawing, related project information, and so on. Tables in an engineering specification drawing are fitted into one big rectangle to minimize the size of tables. Engineers can classify different information in the big rectangle by separating sub-tables with geometric line and space patterns. Then, engineers can understand each sub-table as they did for the table in
Figure 1.
Keyword-based search is frequently used by engineers to find product specification. Although engineers may obtain data they are looking for, the keyword-based search technique has two issues. First, it may return the overload search results. The overload results require engineers to spend more time on information acquisition. Second, if computers could not establish correct relationships among the searching keywords, they cannot return the specification engineers want. The problems are a consequence of the inability of the machine to capture the logical representation of tables in engineering specification documents. If tables in engineering specifications are handled separately from other texts, and if a computer can understand logical relationships among data in a table, engineers get benefits on searching product specification from engineering documents.
Table understanding means recovering relationships among data values, labels (attributes), and domains (dimensions) in the table [
1]. As defined in [
2], the understanding table involves five sub-problems; (1) table detection (to detect positions of a table inside a source), (2) table recognition (to recover individual cells), (3) table functional analysis (to find labels and data in cells), (4) table structural analysis (to learn relationships between cells), and (5) table interpretation (to learn facts from a table). The proposed framework focused on the last four sub-problems except for the first sub-problem. Algorithms for table detection are heavily affected by the types of electrical formats of engineering documents [
3], but the first problem becomes rather a simple issue if lines of a table fully exist and only well formatted text exists. Most engineering specification tables have solid lines and well formatted text for engineers to easily understand tables and to distinguish tables from other drawing images or descriptions of products. Once a table is detected with table’s boundary lines, table recognition to find individual cells also becomes simple to find sub-tables from a complex table.
Many previous works tackled the functional analysis and structural analysis of tables. Rule-based approach [
4,
5,
6], classification approach [
7], deep learning approach [
8], and natural language processing approach [
9] were applied to the functional analysis and structural analysis of tables.
Most of the tables in engineering specification documents do not have a highly complex structure, but their structures vary depending on the context of product specifications. An engineering table understanding framework was proposed in this paper, and it consisted of three steps: (1) Identification of minimal tables, (2) Classification of cells into labels and data, (3) Extending a domain knowledge map. The first step is pre-processing and functional analysis of tables. The XY-tree algorithm was adopted to find sub-tables in a complex engineering table. The second step is structural analysis of table, which used a neural network algorithm to classify cells into labels and data. The last step is interpretation of tables using rule-based ontology extending algorithm. Ontology and rule-based approaches were adopted for the table interpretation like previous works [
2,
9,
10], but the proposed approach incorporated natural language processing of the terms in tables with rule-based approach to extend a domain ontology.
This paper is organized as follows. Previous works are explained in
Section 2.
Section 3 presents an overview of the proposed framework to understand tables in engineering specification documents.
Section 4,
Section 5, and
Section 6, respectively, describe each step in the proposed framework. Each step is illustrated with table understanding examples. Finally, the conclusions and future works are presented in
Section 7.
2. Previous Works
Previous works developed different approaches for table functional analysis, table structural analysis, and table interpretation [
11]. Each approach was depending on its context and the source of tables.
Table 1 shows approaches of previous works and their application context.
Douglas et al. [
9] suggested a method for interpretation and canonicalization of tables, which are contained in specifications used in the construction industry. Hu et al. [
12] introduced a hierarchical clustering algorithm to group the words in a table according to the closeness of their beginning and end positions. E Silva et al. [
13] developed domain rules for functional and structural analysis of tables. Kim and Lee [
14] also proposed a rule-based approach for extracting logical structures from HTML tables and transforming them into an XML representation. Tijerino et al. [
10] addressed the creation of ontologies from tables in a web page. They suggested heuristic rules to create ontologies based on WordNet and domain ontologies. Embley et al. [
15] used domain ontology to understand tables in web pages. Wang et al. [
16] also used domain ontology to understand structure of tables in web pages, but it is limited to structural analysis of tables. Shigarov [
5,
6] used a rule engine to convert unstructured tabular data to a structured form of databases. Domain-specific natural language information and domain-independent graphical information were used to functional and structural analysis of tables. Chen and Cafarella [
17] used CRF (Conditional Random Field) and classification algorithms to find labels and their hierarchical structure in spreadsheets on web pages. Rastan et al. [
18] studied the patterns that commonly occur in table layouts based on observation from a variety of tables in public table dataset and described automatic table processing systems. Recently, deep learning and word embeddings are used to learn a real-valued vector representation for tables in different Natural Language Processing tasks. Schreiber et al. [
8] adopted deep learning algorithms for table functional and structural analysis. Nishida et al. [
19] proposed a hybrid deep neural network architecture combining an RNN (Recurrent Neural Network) and CNN (Convolutional Neural Network) for table type classification, and Chen et al. [
20] proposed a semantic annotation framework combining knowledge lookup and machine learning to predict a column type.
The existing approaches for table understanding described above were based on different methods, e.g., heuristic, probabilistic, dynamic programming, or machine learning methods. They used different assumptions about table structures to reduce the complexity of their own tasks. Those assumptions were embedded in their algorithms and restricted types of tables that could be processed. The previous works focused on tables in a pre-defined form, or tables in HTML documents or financial documents. They did not consider the characteristics of tables in engineering specification.
Structure of tables in engineering documents is relatively simple compared to the structure of financial statistical tables, but location of labels and relationships between labels and data are relatively diverse. It means the structures of tables in engineering documents could be different for every table in an engineering document. The variations of table structures make it hard to create a set of rules for different structures so that existing rule-based approaches were limited to do structural tables analysis in engineering specifications. Machine learning approaches like Schreiber et al. [
8] are necessary for functional and structural table analysis in engineering documents. A deep learning algorithm requires a lot of training data to work well, but tables in engineering specifications are domain dependent so that it could be difficult to gather such many training data from one company. The proposed framework suggested using heuristic rules and neural network approach for functional table analysis and structural table analysis, respectively.
Interpretation of tables in engineering documents requires understanding the meaning of terms used in tables. Domain ontologies help to specify the meaning of concepts and relationships. Computers can understand the terms in tables by mapping the terms to concepts and relationships in domain ontologies. Rules were used to find the mapping relationships between terms in tables and concepts in ontologies. Domain ontology for engineering specification should be extendable because a new concept related to an existing product or part might be introduced in tables. As many previous works applied ontologies and rules for table interpretation, the proposed framework also used ontologies and rules for table interpretation. In addition, the proposed framework suggested rules with text analysis to extend domain ontologies for the new terms in tables.
In the next section, the proposed framework will be presented and explained how to address the characteristics of engineering specification tables in order to make computers understand tables.
3. Overview of the Proposed Approach
Recognizing cells in engineering tables is relatively easy if engineering tools create the patterns of tables with lines and blank space. Tables created by engineers are also simple enough to find the patterns, but the location of labels and the relationships between labels and data are relatively diverse. The proposed framework addresses the issues with the following steps in
Figure 3.
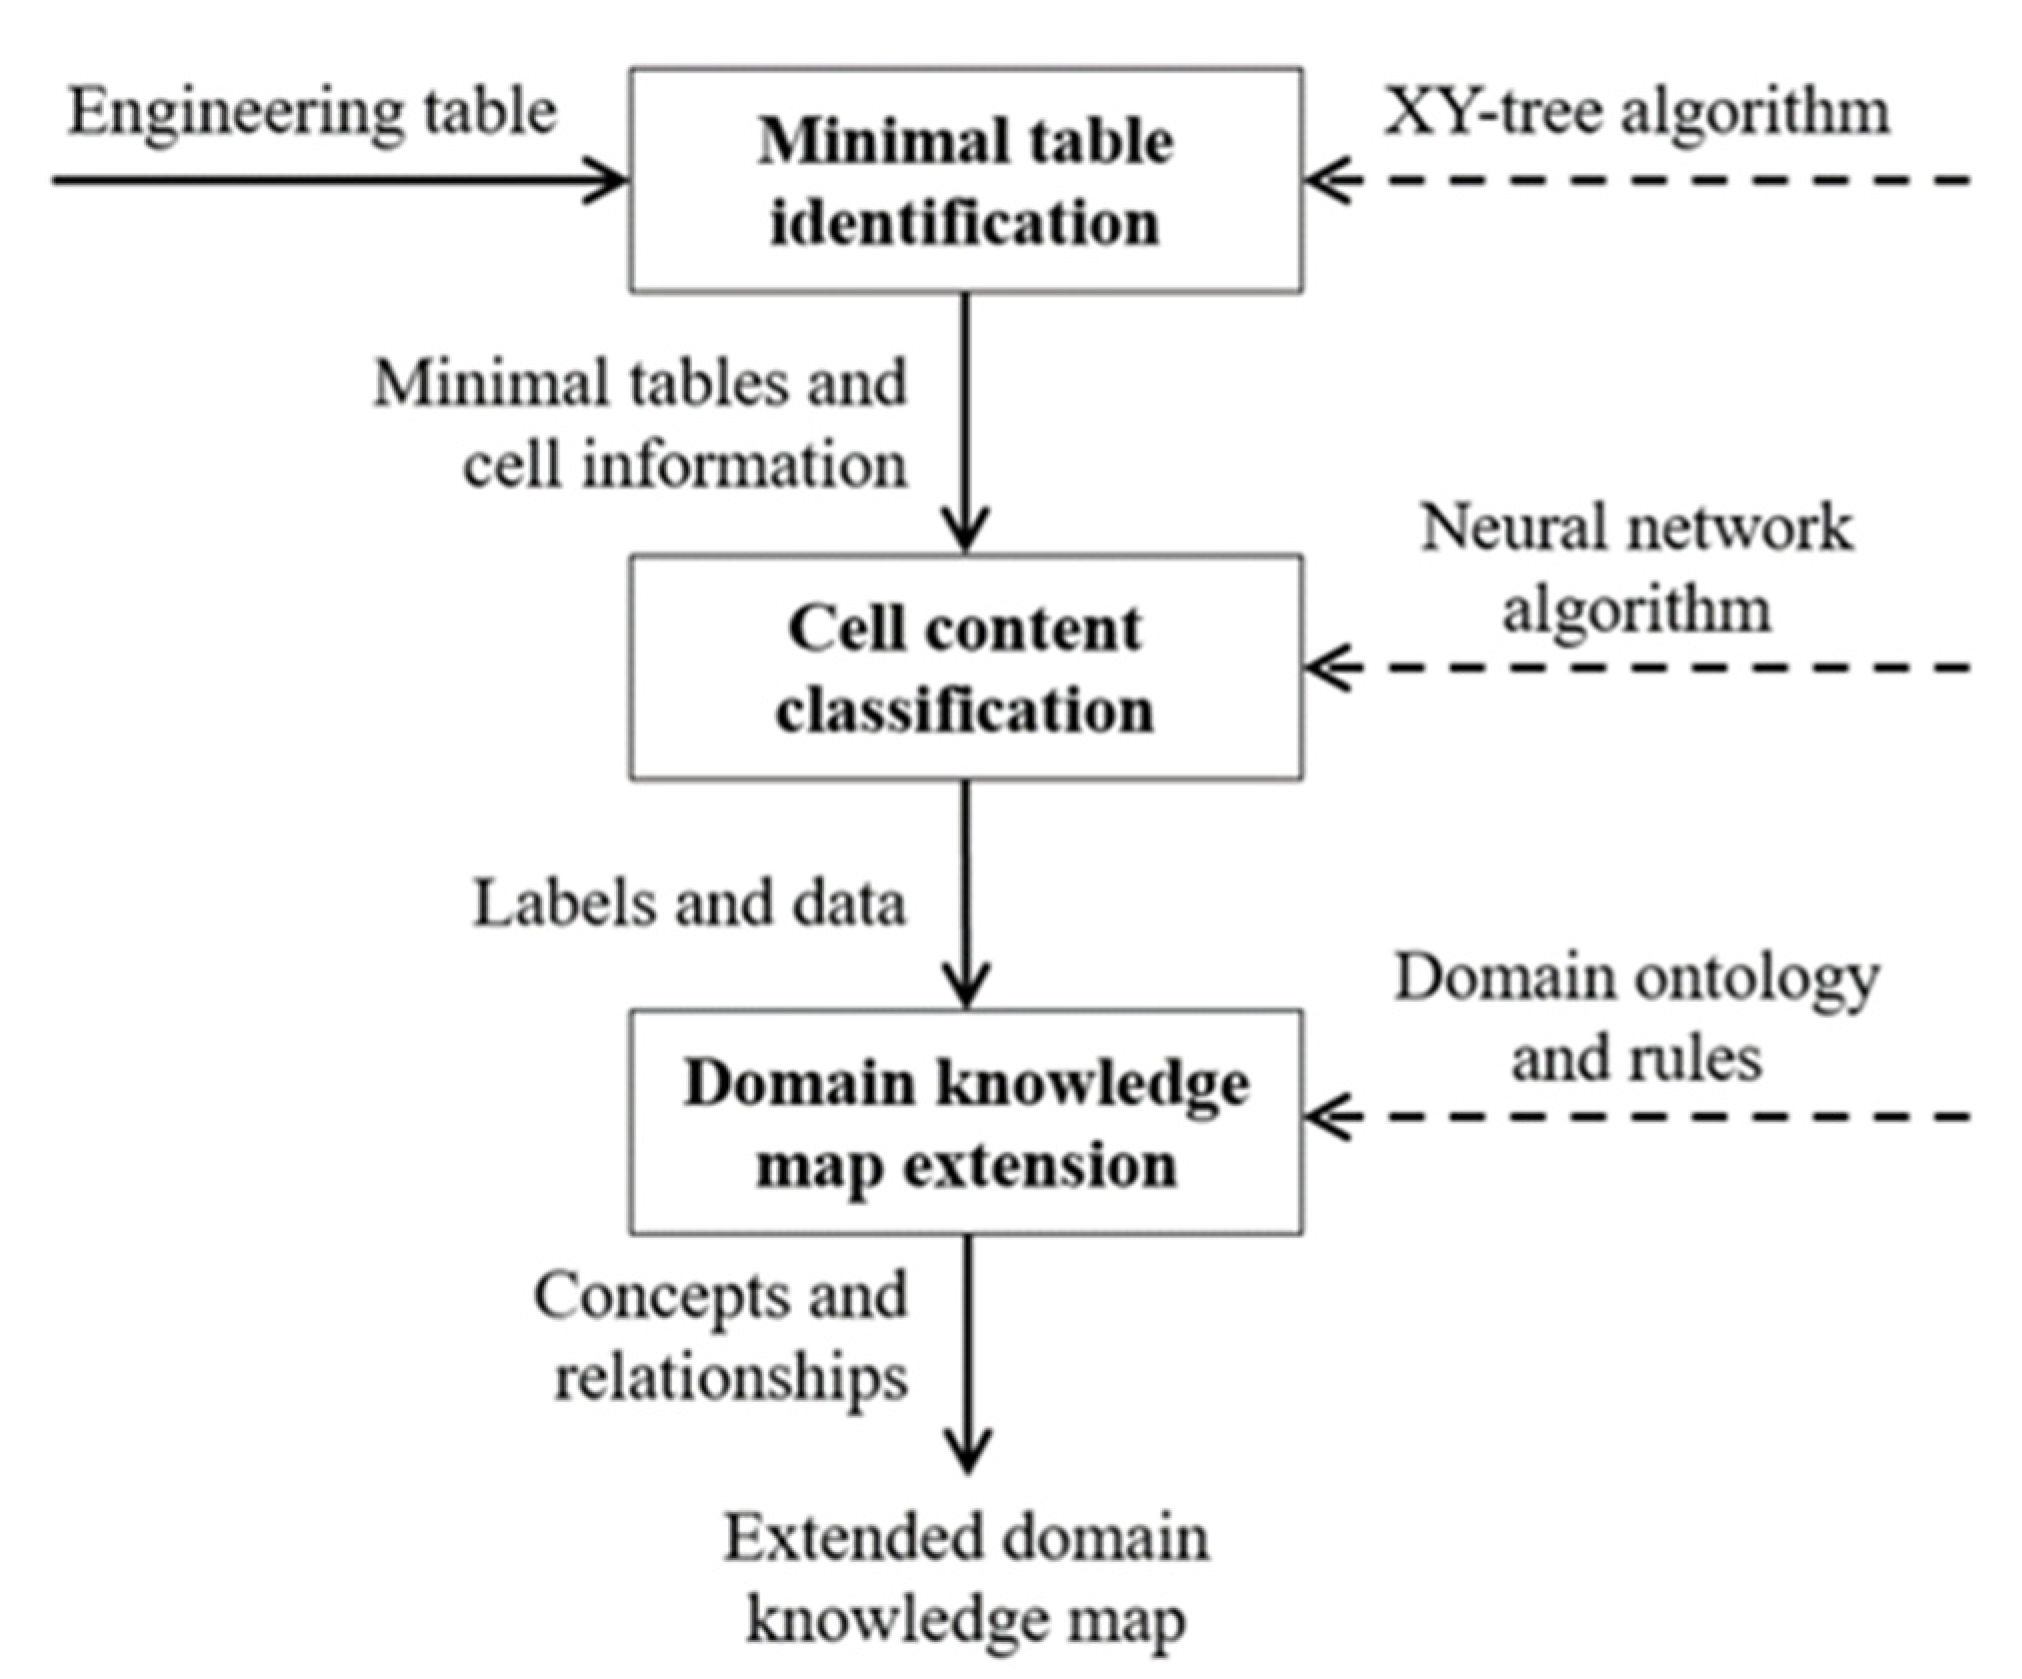
Rectangular box in
Figure 3 represents a step of the proposed framework. Solid arrows represent inputs and outputs of steps. Dashed arrow represents algorithms or methods applied to each step. First step is to identify minimal tables from an input table. This step is necessary for tables like
Figure 2. The XY-tree algorithm [
21] was adopted to find the structure of an input table. Second step is to classify cells in a minimal table into labels and data. A neural network algorithm was adopted. Rule-based approach is limited to be adopted because structure of minimal table looks similar, but some variations always exist. The last step is to interpret terms in labels so that computers can create a knowledge map of the table with domain ontologies and rules.
4. Minimal Table Identification
The XY-tree algorithm [
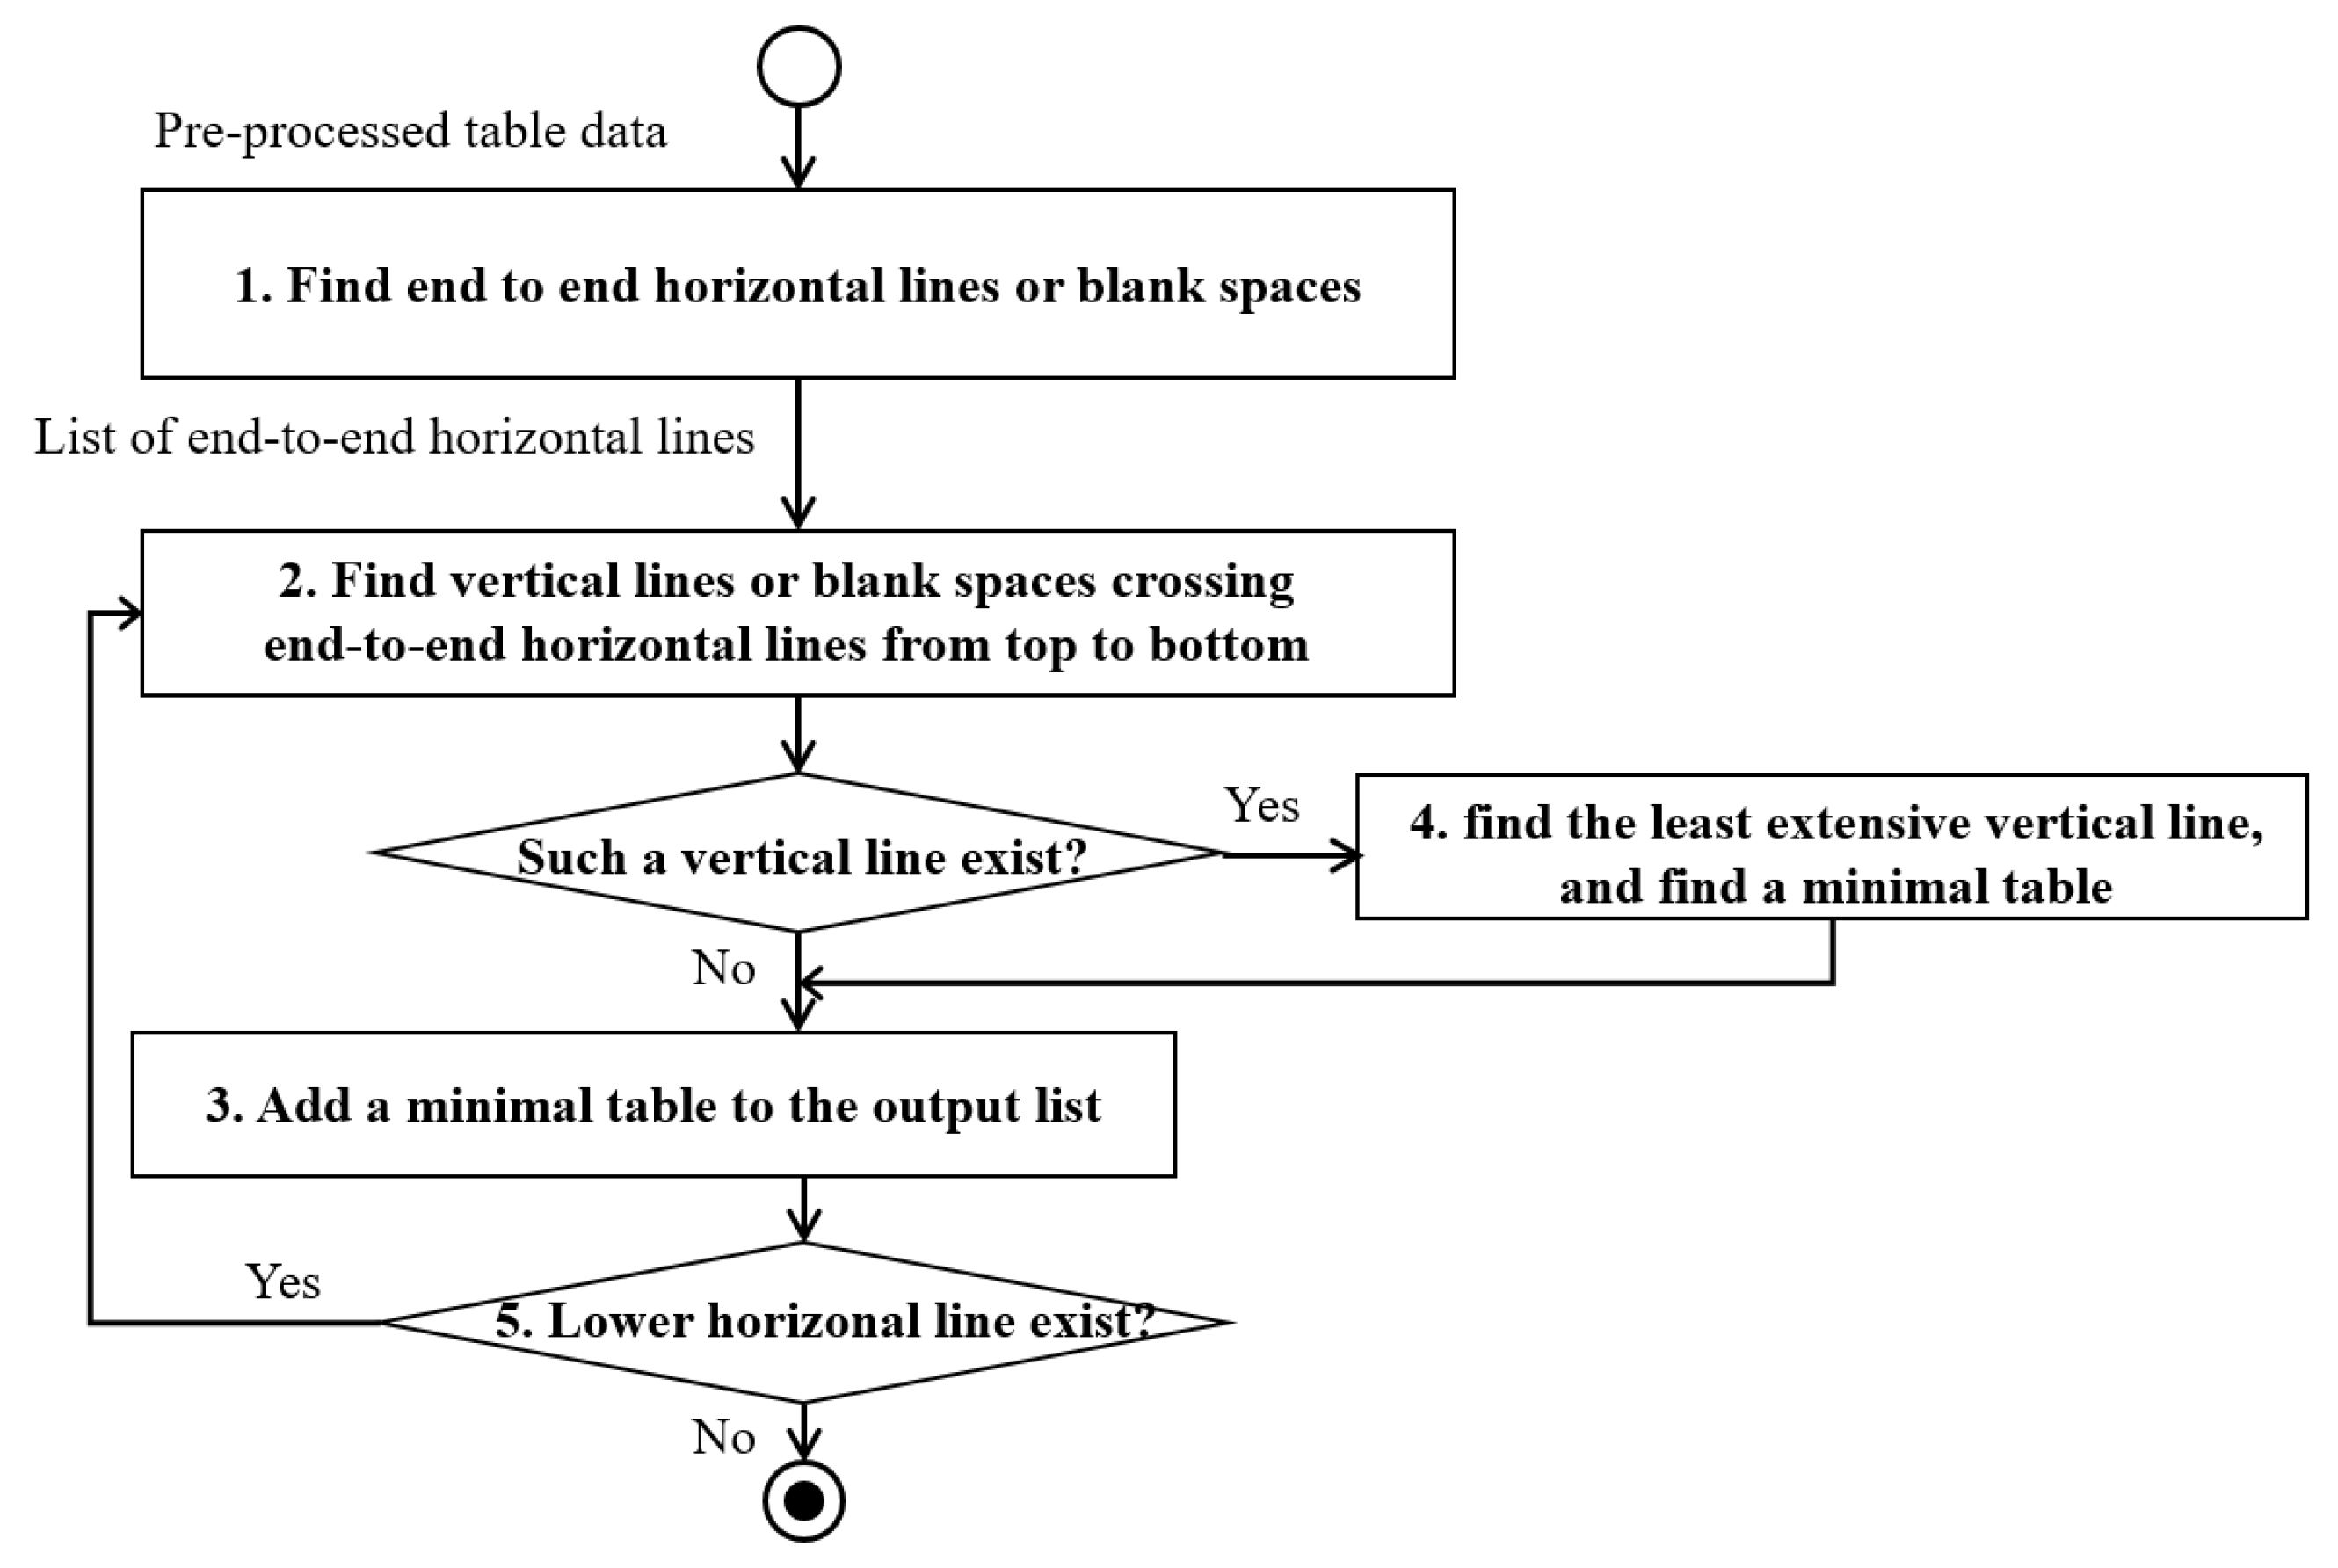
21] can make a tree structure of cells in a table. The algorithm utilized geometric information of lines composing the table in order to separate chunks of cells. The algorithm was modified to find sub-tables in a complex table. In addition, a blank space between two texts also gives information to separate cells, the XY-tree algorithm was modified to consider a blank space between two texts. A minimal table is a rectangular table which has a matrix form. The proposed algorithm identifies minimal tables with five steps in
Figure 4, which shows a flowchart of the five steps.
The input of the proposed algorithm is a set of pre-processed graphical features of a given table image. The pre-processed graphical data include a list of lines, boxes, and blank spaces. Each line has geometry data such as a starting point, an end point, and thickness data. Each box represents texts in the table, and its geometry data include left-top and right-bottom points. Blank space represents an invisible line in a table so that its data consist of a starting point and an end point. A blank space can be found if horizontal or vertical spaces between two lines of texts are relatively larger than average space between two texts. The description of the five steps is elaborated as followings:
Find horizontal lines or blank space from end to end from a pre-processed table data.
Find vertical lines or blank spaces that cross the end-to-end horizontal line from the top horizontal line.
If there is no such a vertical line or blank space, the next horizontal line or blank space is recognized as the end of the minimal table. Then, it performs the S2 from the lower horizontal line or blank space.
If there are multiple vertical lines or blank spaces, find the least extensive vertical line or blank space starting from the same end-to-end horizontal line or blank space. Then, a line or blank space up to the horizontal line or blank space where the shortest line or blank space meets is recognized as the end of the minimal table.
If the lower horizontal line or blank space is the last, end the algorithm. If it is not the last horizontal line, perform the S2.
The gross output of this step is a list of minimal tables. This step breaks down a complex structure of a given table to several sub-tables.
Figure 5 shows the outputs of the proposed algorithm when it is applied to the table in
Figure 2. The table in
Figure 1 is a minimal table itself.
From each cell of a minimal table, contents of cells are collected to create a dataset for the next step, which classifies cells into labels and data.
5. Cell Classification
Once a minimal table is identified, it is assumed a minimal table consists of labels and data cells. Labels are texts, while data may be digits and/or texts. Label cells describe domains of data in the data cells, and data cells have specific data values of the domain.
Tables in engineering specification documents have various forms so that label cells may not always locate at the top row of a table. It could be found at the bottom row of the table, or left or right columns of the table. It also could be composed of multiple rows or columns in a nested format. The variations make it hard to develop a set of rules. Machine learning algorithms are appropriate for the classification. A neural network algorithm was adopted to distinguish types of cells between two possible categories: “label” and “data”.
A neural network algorithm was adopted because it is supposed to be more accurate than other algorithms for the type of data we classified. Decision tree algorithm and Support Vector Machine algorithm were compared with the neural network algorithm. A neural network algorithm showed a better accuracy result than the other two algorithms when the neural network has 2 hidden layers and 20 hidden neurons.
A training dataset for neural network algorithm consists of cell feature vectors. A cell feature vector characterized geometry features and content features of a cell. A cell feature vector consists of geometry features vector and data type and text feature vector.
Cell feature vector = [Geometry feature vector] + [Data type and text feature vector].
Geometry feature vector:
Table 2 shows geometry features captured in the example. Nine geometry features were captured for a geometry feature vector, but the number of features is not restricted. Geometry features can be expanded according to engineering domain characteristics.
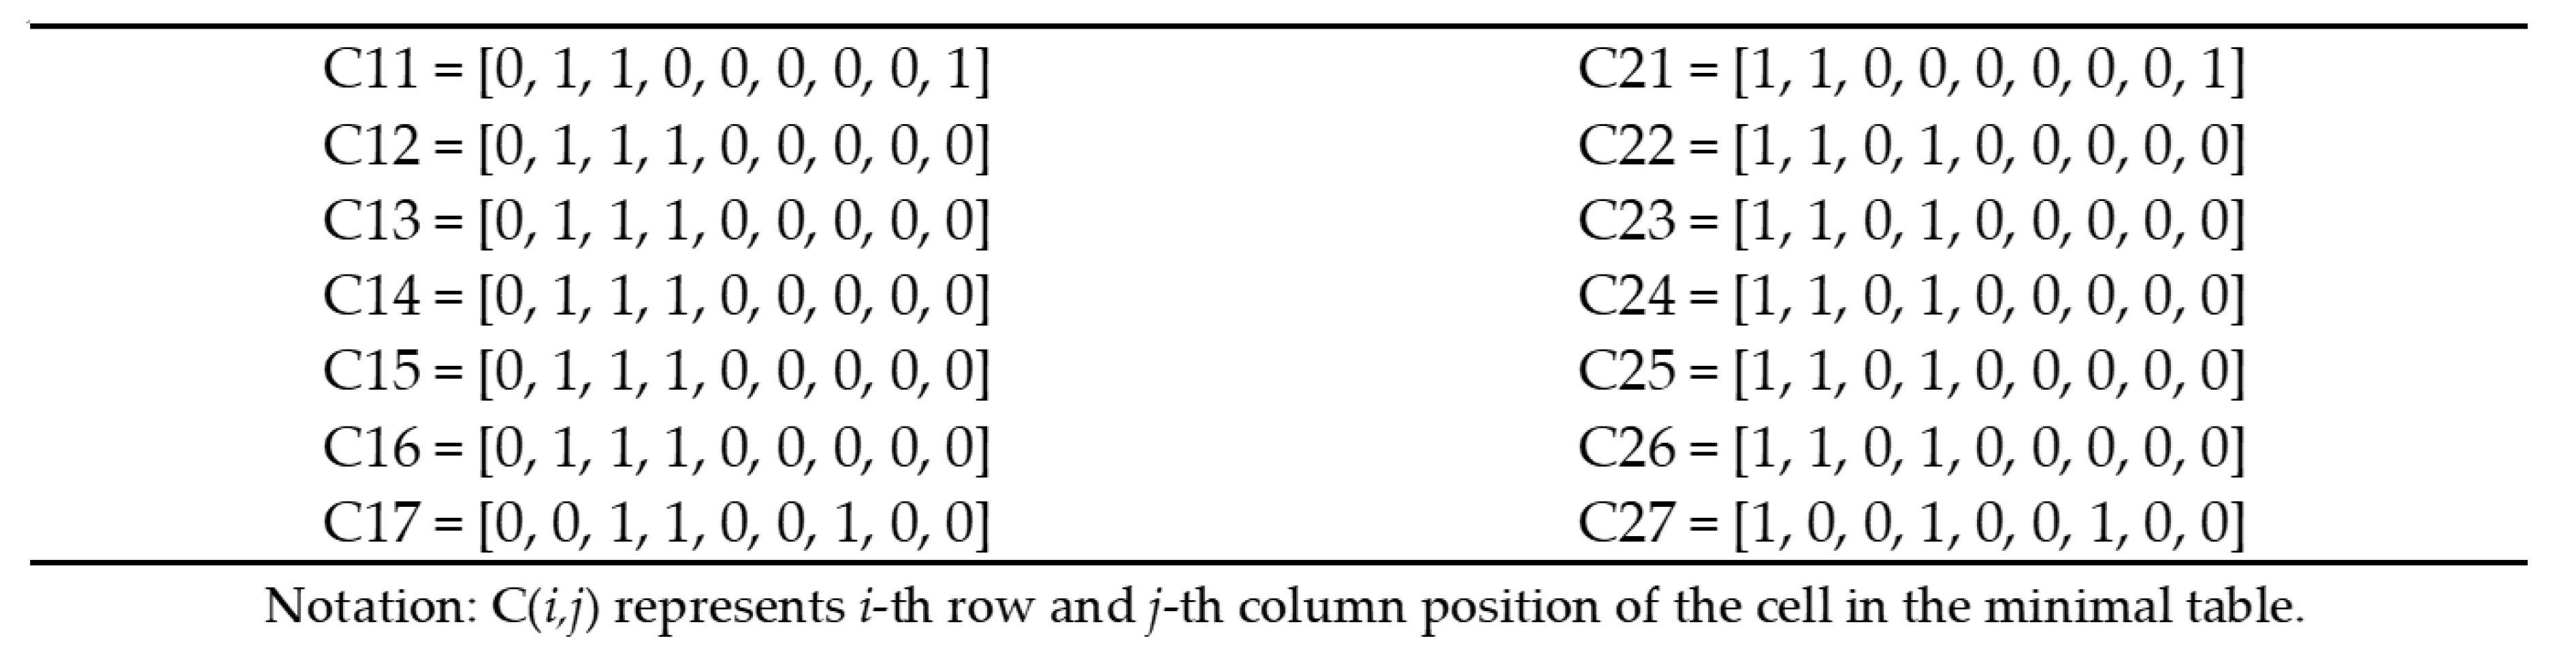
With the description of geometry feature vector in
Table 2 above, examples of geometry features can be described for the cells in the minimal table ‘A’ in
Figure 5. The geometry feature vectors of each cell are shown as
Figure 6.
Data type and text feature vector:
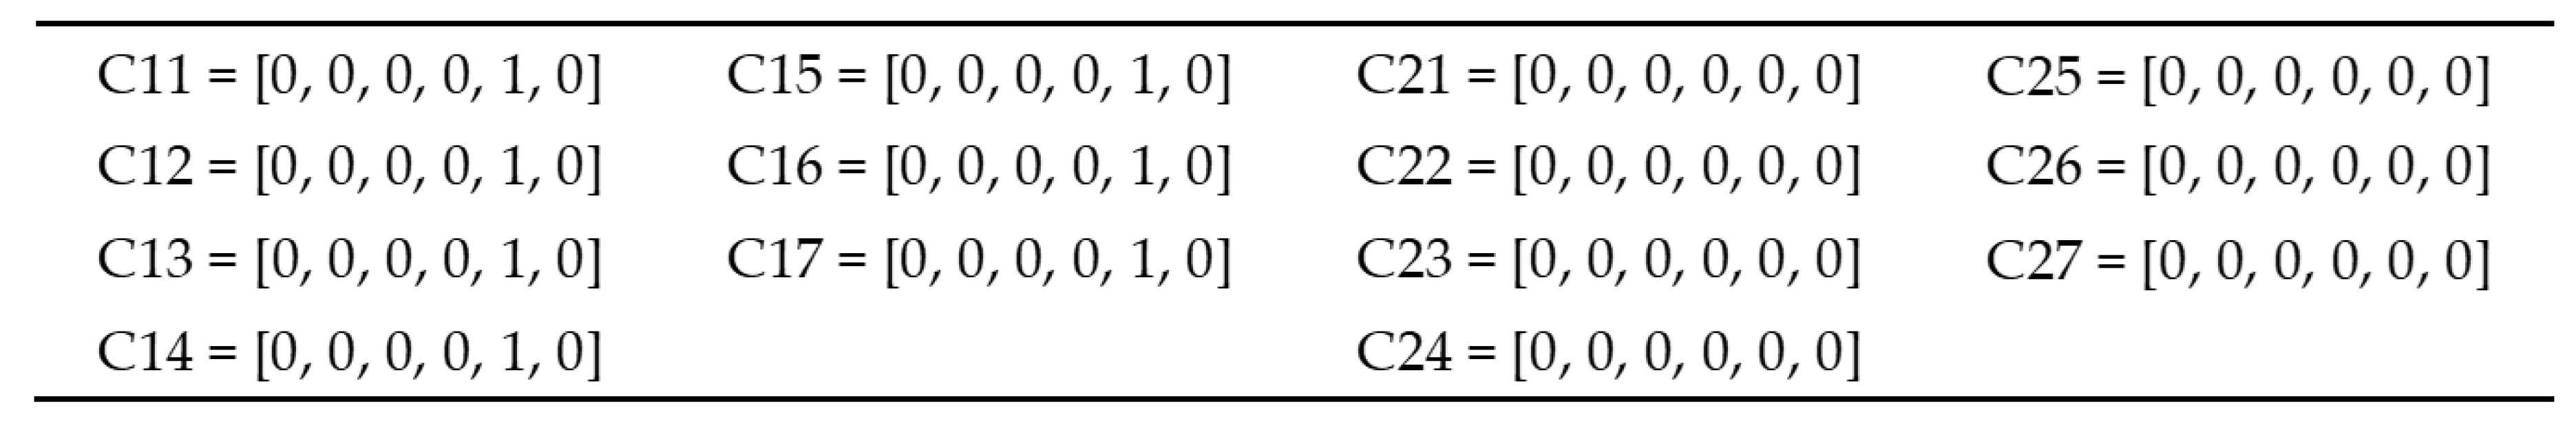
Table 3 shows six coordinates for the data type and text feature vector. Each coordinate depends on defining data type and text characteristics of the cell content. The number of coordinates of the data type and text feature vector is not restricted, and it can be extended according to engineering domain characteristics.
The vectors in
Figure 7 illustrate the description of data type and text feature vector for the first minimal table “A” obtained in
Figure 5:
For training and testing a neural network, each cell data should have a correct classification result. A classification result should be given by domain experts, and it is simply 0 or 1 depending on classification of the cell. If a cell represents a label, its classification result is 1, and otherwise it is 0.
A list of cell feature vectors for engineering tables was used to train a neural network. A set of table training data should have four columns: “row_id”, “text”, “cell feature vector”, “classification result”. In the training stage, a set of training data is prepared to update parameters of a neural network. After training, a set of test data is provided to evaluate the neural network. A dataset for 80 tables was used, and 60 of them were used for training and the rest were used for testing. The 80 tables were randomly selected from engineering specification documents related to a plant construction project. The selected tables were expressed in the pdf format so that cell feature vectors were pre-processed by an image and text processing program. The program was developed using the C# program language. Classification results of each text are manually given. The set of table data were prepared in an Excel file. The neural network evaluation result showed that 95% of cells were classified correctly.
After labels and data were classified, labels should be interpreted as concepts, and then their relationships should be inferred to understand a table correctly.
6. Domain Knowledge Map Extension
Understanding table occurs when computers understand the semantics of the tables through the interconnections of concepts in a knowledge base [
16]. The labels found in the classification step should be interpreted as concepts, and they should be related to existing concepts of domain ontology.
The domain knowledge map extension process consists of three steps: (1) Pre-processing terms in labels, (2) mapping terms to concepts and finding relationships, and (3) assigning unmatched terms to new concepts.
6.1. Pre-Processing Terms in Labels
Some terms in engineering documents are expressed in abbreviation, and some terms are expressed in either plural or singular terms. Expressing a concept with different terms makes computer hard to match terms to their corresponding concepts. In pre-processing stage, abbreviated terms should be replaced with full terms, and a plural term should be replaced with its singular term. A domain specific abbreviation dictionary and plural dictionary should be prepared for the pre-processing.
In addition, Part-of-Speech (POS) tag of terms should be specified for text processing. Stanford POS tagger [
22] was used to give POS tags on the English terms in labels. For example, a POS tag of “Project” term is “NN”, which means noun. “Project Number” term has “NN” and “NN” tags, and it is represented as “NN + NN” in this paper. POS tags help to understand the meaning of terms and to clarify whether it is a sentence or compound nouns. The POS information is essential to give mapping relationships between labels and concepts of a domain ontology.
Figure 8 shows a pre-processing result of the table example in
Figure 1. Plural term “pumps” is changed to the singular term “pump.” POS tags, the number of words, existence of preposition “of” and existence of related data are captured after pre-processing.
6.2. Mapping Labels to Concepts and Finding Relationships
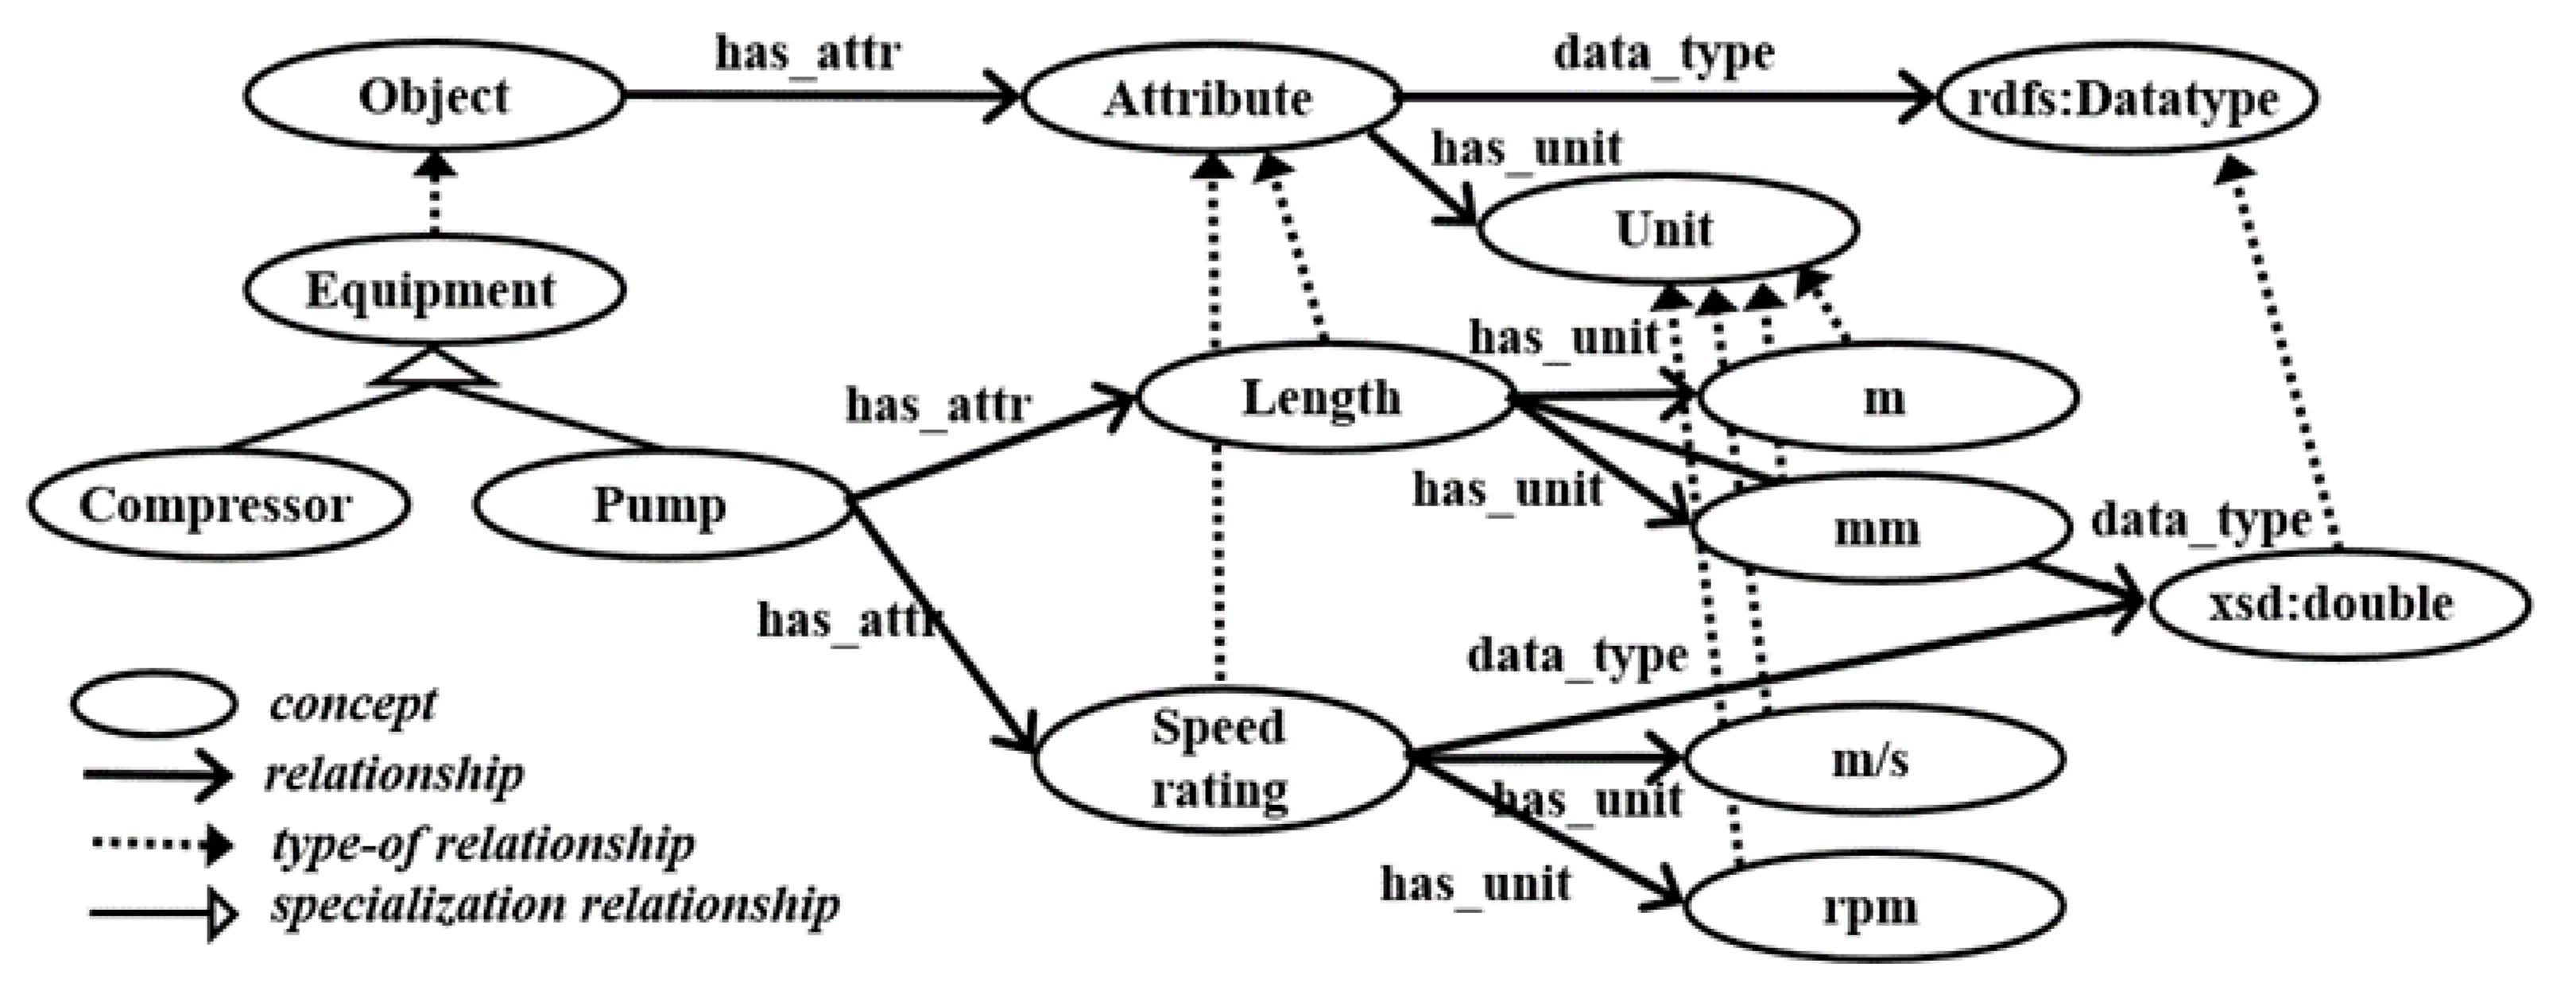
An ontology has concepts and relationships, and it can explicitly represent meanings of them. Terms in labels for engineering specification tables should express some concepts related to engineering specification. Let us assume that a domain ontology was developed and used to represent product specification as shown in
Figure 9.
Rules were developed to find mapping relationships between labels and concepts in the domain ontology. The rules are applied to POS-tagged labels, and the rules determine whether or not a tagged label is a sub-concept of “Object”, “Attribute”, or “Unit”. The rules reused existing concepts and their relationships to introduce a new term as a concept so that they can extend an existing domain ontology. The rules are shown in the followings:
If [NN]* exists in the ontology, then its concept is the existing one. For example, “pump” term is the concept “pump” which is an object and a sub-concept of “Equipment”.
If a label is [NN1] *+ [NN2] *, and [NN1] * includes an object, and [NN2] * is an attribute, then the object in [NN1] * and [NN2] * attribute are linked with “has_attr.” For example, “central pump max speed” means “pump” has a “max speed” attribute.
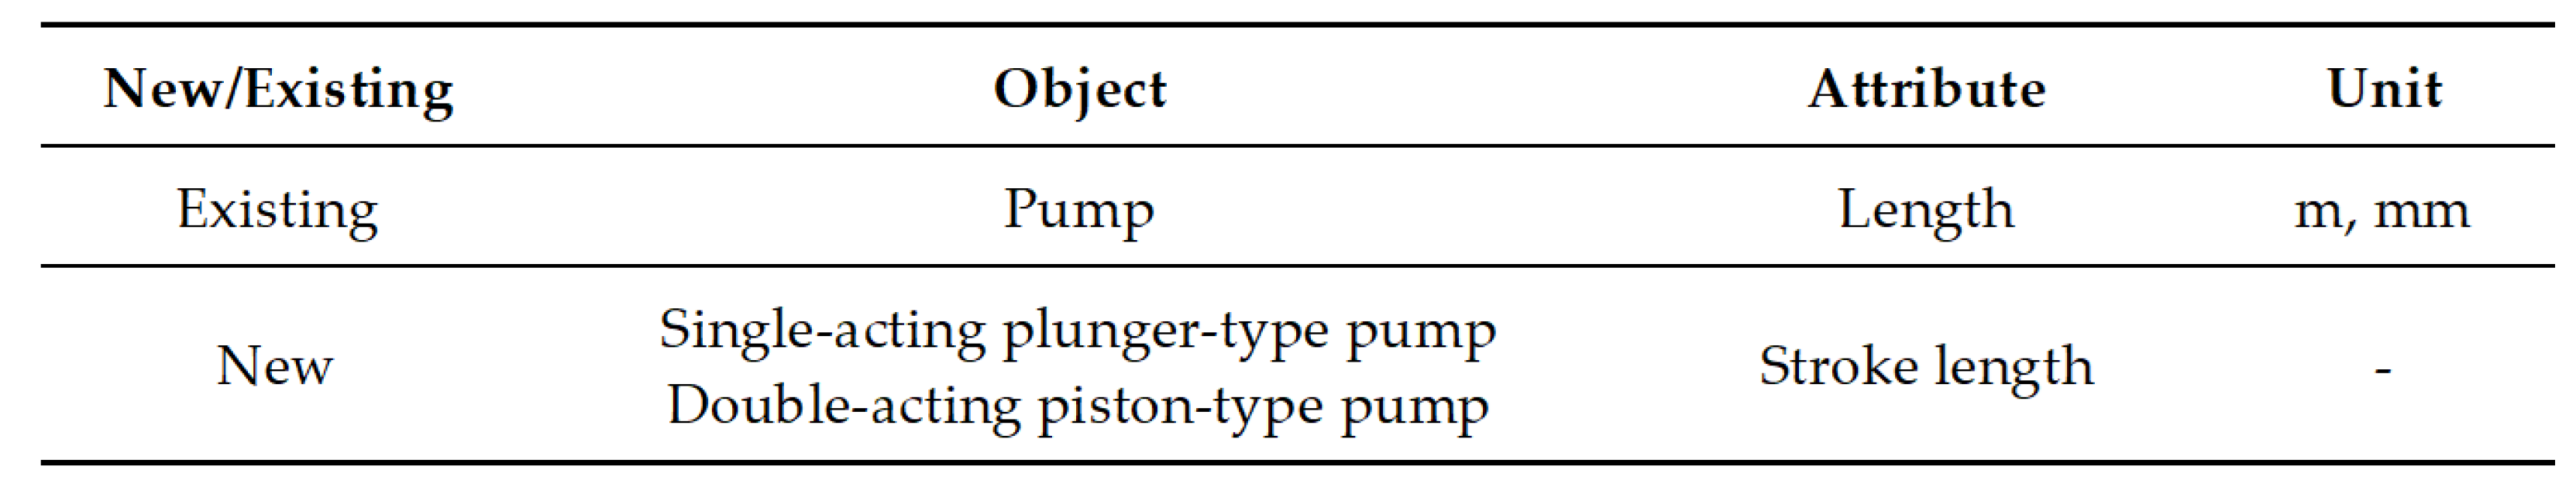
If a label is [NN1] *+ [NN2] *, and [NN1] * does not include an object, and [NN2] * is an attribute, then the [NN1] *+ [NN2] * becomes a sub-concept of [NN2] * attribute. For example, “stroke length” becomes a sub-concept of “length” attribute.
If the label is [NN1] *+ “of” + [NN2] * and [NN1] * is an attribute, then [NN2] * is an object and [NN1] * is an attribute of [NN2] *. For example, “total weight of central pump” means that “central pump” has an attribute “total weight.”
If the label is [NN] * + [object] and the object exists in the ontology, then the [NN] * + [object] becomes a sub-concept of the object. For example, “Single-acting plunger-type pump” becomes a sub-concept of “pump”.
The rules defined above discover whether classified and tagged labels in a minimal table are an object, an attribute or a unit, and further the relationships that exist between them.
Figure 10 shows the concepts (object, attribute, and unit) that matched with the labels (pump, stroke length, speed rating, rpm, m/s, m, and mm), and how they are related to each other. Two new concepts “single-acting plunger-type pump” and “double-acting piston-type pump” are defined as a sub-concept of “pump” because of rule 5. By rule 3, “stroke length” becomes a sub-concept of “length.”
6.3. Assigning Unmatched Labels to Concepts
The rule-based matching labels to concepts can work only if labels include terms defined in the pre-defined ontology. If no terms in a label are matched to concepts in the ontology, the label should be temporally assigned to a concept considering the matching relationship of its nearby labels. Since the rules are applied to a minimal table, a label could be matched to either object, attribute, or unit. If a left or right label in the same row or column is matched to an attribute, the unmatched label may have a high chance of being matched to the same concept. This approach is a rule-of-thumb, so engineers should check if the temporal matching relationships are correct or not. In the beginning stage of building and extending domain ontology, it may require efforts and time of engineers. However, once a domain ontology was built by engineers, the ontology can be reused to build other domain ontology and it may save a lot of time and efforts for engineers.
For example, a minimal table “B” in
Figure 5 showed ten attributes of “Drawing” object. If a domain ontology had only a few of them such as “Rev.”, “Date”, and “Description,” the other seven labels could be assigned to attribute concepts of “Drawing” object. If an engineer confirmed that the other seven labels are attributes of “Drawing” object, they can be reused when other project domain ontology needs the “Drawing” concept.
7. Conclusions
In practice, searching product specification defined in tables in engineering specification documents becomes more popular as engineers adapted to sophisticated searching functions. Once table data are converted to computer readable format, it is efficiently available for use in product development and knowledge discovery. The proposed framework of table understanding can be used for the conversion of data/information from table sources to domain knowledge map. The domain knowledge map can be represented in OWL (web ontology language), and it can be applied to search specific product data and find product information hidden in tables in engineering documents. Once many product specification tables were interpreted by computers, various product specification related data could be stored in a big-data platform, and the knowledge map can be used as metadata of the large distributed storages [
23]. The analysis of the knowledge map could provide engineers with extra-insight like analyzing a data-cube [
24] about specific product specifications.
The proposed framework has three steps of table understanding: (1) Identification of minimal table, (2) Classification of cells into labels and data, (3) Extending domain knowledge map. Each step was explained with engineering table examples. The first step was designed to find sub-tables in a complex engineering table. It modified the XY-tree algorithm to find sub-tables in matrix form, which are called minimal tables in the framework. The second step was designed to classify cells into labels and data in a minimal table. Neural network algorithm was adopted for the classification. The third step was designed to build a domain knowledge map by mapping between terms in labels and concepts in an existing knowledge map. Natural language processing was adopted to analysis terms in labels, and language grammar-based rules were proposed for mapping between terms in labels and concepts in the domain knowledge map.
The proposed framework contributed to make computers understand tables, especially in engineering specification documents. The proposed framework could be applied to retrieve table type product-related data from printed or scanned formats. For example, table type product data in 2D drawing images or scanned files can be retrieved by the proposed framework and can be stored in a database for future needs. Since many companies exchange pdf-type or image-type documents including product data, the proposed framework could be useful to extract table formatted product data from those documents.
Although the proposed framework works well for engineering tables based on the illustration examples, it still could not work or fit with other different types of tables. Since the text processing module was implemented with the Standford POS tagger, only engineering tables in English can be considered as input tables. If a table described in other languages needed to be processed, its corresponding POS tagging module is required. In addition, rules for knowledge map extension should be changed because they were affected by the grammar of the language. As future research, additional rules to automate the knowledge map extension need to be developed. Also, deep learning algorithms should be tested for tables in engineering specifications. Deep learning algorithms could not be tested in the paper because of shortage of training tables.


