Article

Development and Validation of Overpressure Response Model in Steel Tunnels Subjected to External Explosion

1
Department of Civil Engineering and Resource Management, Dahan Institute of Technology, No.1, Shu-Ren St., Dahan Village, Sincheng Township, Hualien County 97145, Taiwan
2
Department of Civil Engineering, R.O.C. Military Academy, No.1, Wei-Wu Rd., Fengshan Dist, Kaohsiung 83059, Taiwan
3
Department of Power Vehicle and Systems Engineering, Chung Cheng Institute of Technology, National Defense University, 75, Shiyuan Rd., Dashi Dist., Taoyuan 335, Taiwan
4
Department of Harbor and River Engineering, National Taiwan Ocean University, No. 2, Pei-Ning Rd., Zhongzheng Dist., Keelung City 20224, Taiwan
*
Author to whom correspondence should be addressed.
Appl. Sci. 2020, 10(18), 6166; https://doi.org/10.3390/app10186166
Submission received: 7 August 2020 / Revised: 27 August 2020 / Accepted: 1 September 2020 / Published: 4 September 2020
(This article belongs to the Section Civil Engineering)

Abstract

:
This study employed C4 explosives to evaluate the overpressure response in steel tunnels subjected to external explosions. The explosive scaled distance of the C4 charge from 2.15 to 3.26 m/kg1/3 was evaluated by experiments and the hydrodynamic finite element code LS-DYNA. The numerical results are in agreement with the experimental results. A simple way to estimate the overpressure in steel tunnels was proposed in this paper. The proposed methodology is both useful and efficient and can be further developed for designing protection for military structures and other facilities against explosion.

1. Introduction

Many countries’ major military facilities and command posts were established underground or within tunnels to enhance defense. With the development and advancement of weapon precision, various missiles and weapons can now hit the portal of a tunnel directly. In addition, the impact of an explosion is sufficient to constitute a great threat to internal personnel and equipment, which mayeven lead to equipment damage and workplace injuries. Therefore, it isnecessary to evaluate the techniques applied for explosions at portals.
The study of the dynamic response of structures subjected to air blast loading received a lot of attention in the last few decades [1,2,3,4,5,6,7]. In 1993, Scheklinski-Glück [8] conducted a 0–90° explosion test at different distances within a radius five times the size of the tunnel diameter from portals using different amounts of charge. The results showed that the blast pressure in the tunnels was attenuated with an increase in distance. In 2004, McMahon et al. [9] usedspherical Comp. B charges on a circular tunnel with a diameter of 0.298 m and a length of 54.3 m. The experiments were conducted with explosives placed at the portal. The results also showed that the blast pressure within the tunnel decreased with an increase in distance, while the impulse response nearly maintained a constant value for different locations in the tunnel. In 2005, Welch et al. [10] investigated the relation between subscale and full-sized explosion tests; the results indicated that the subscale explosion tests could be an effective substitute for full-sized tests.
The main purpose of this paper is to investigate the explosive pressure response in steel tunnels when subjected to external explosion. Both field tests and the hydrodynamic finite element code LS-DYNA were employed. A comparison with the experimental results indicated that the present numerical method is accurate and efficient for finite element analysis of explosive loading. A simple way to estimate the overpressure in steel tunnels was proposed. The proposed methodology is both useful and efficient and can be further developed for designing protection for military structures and other facilities against explosion.

2. Analytical Model

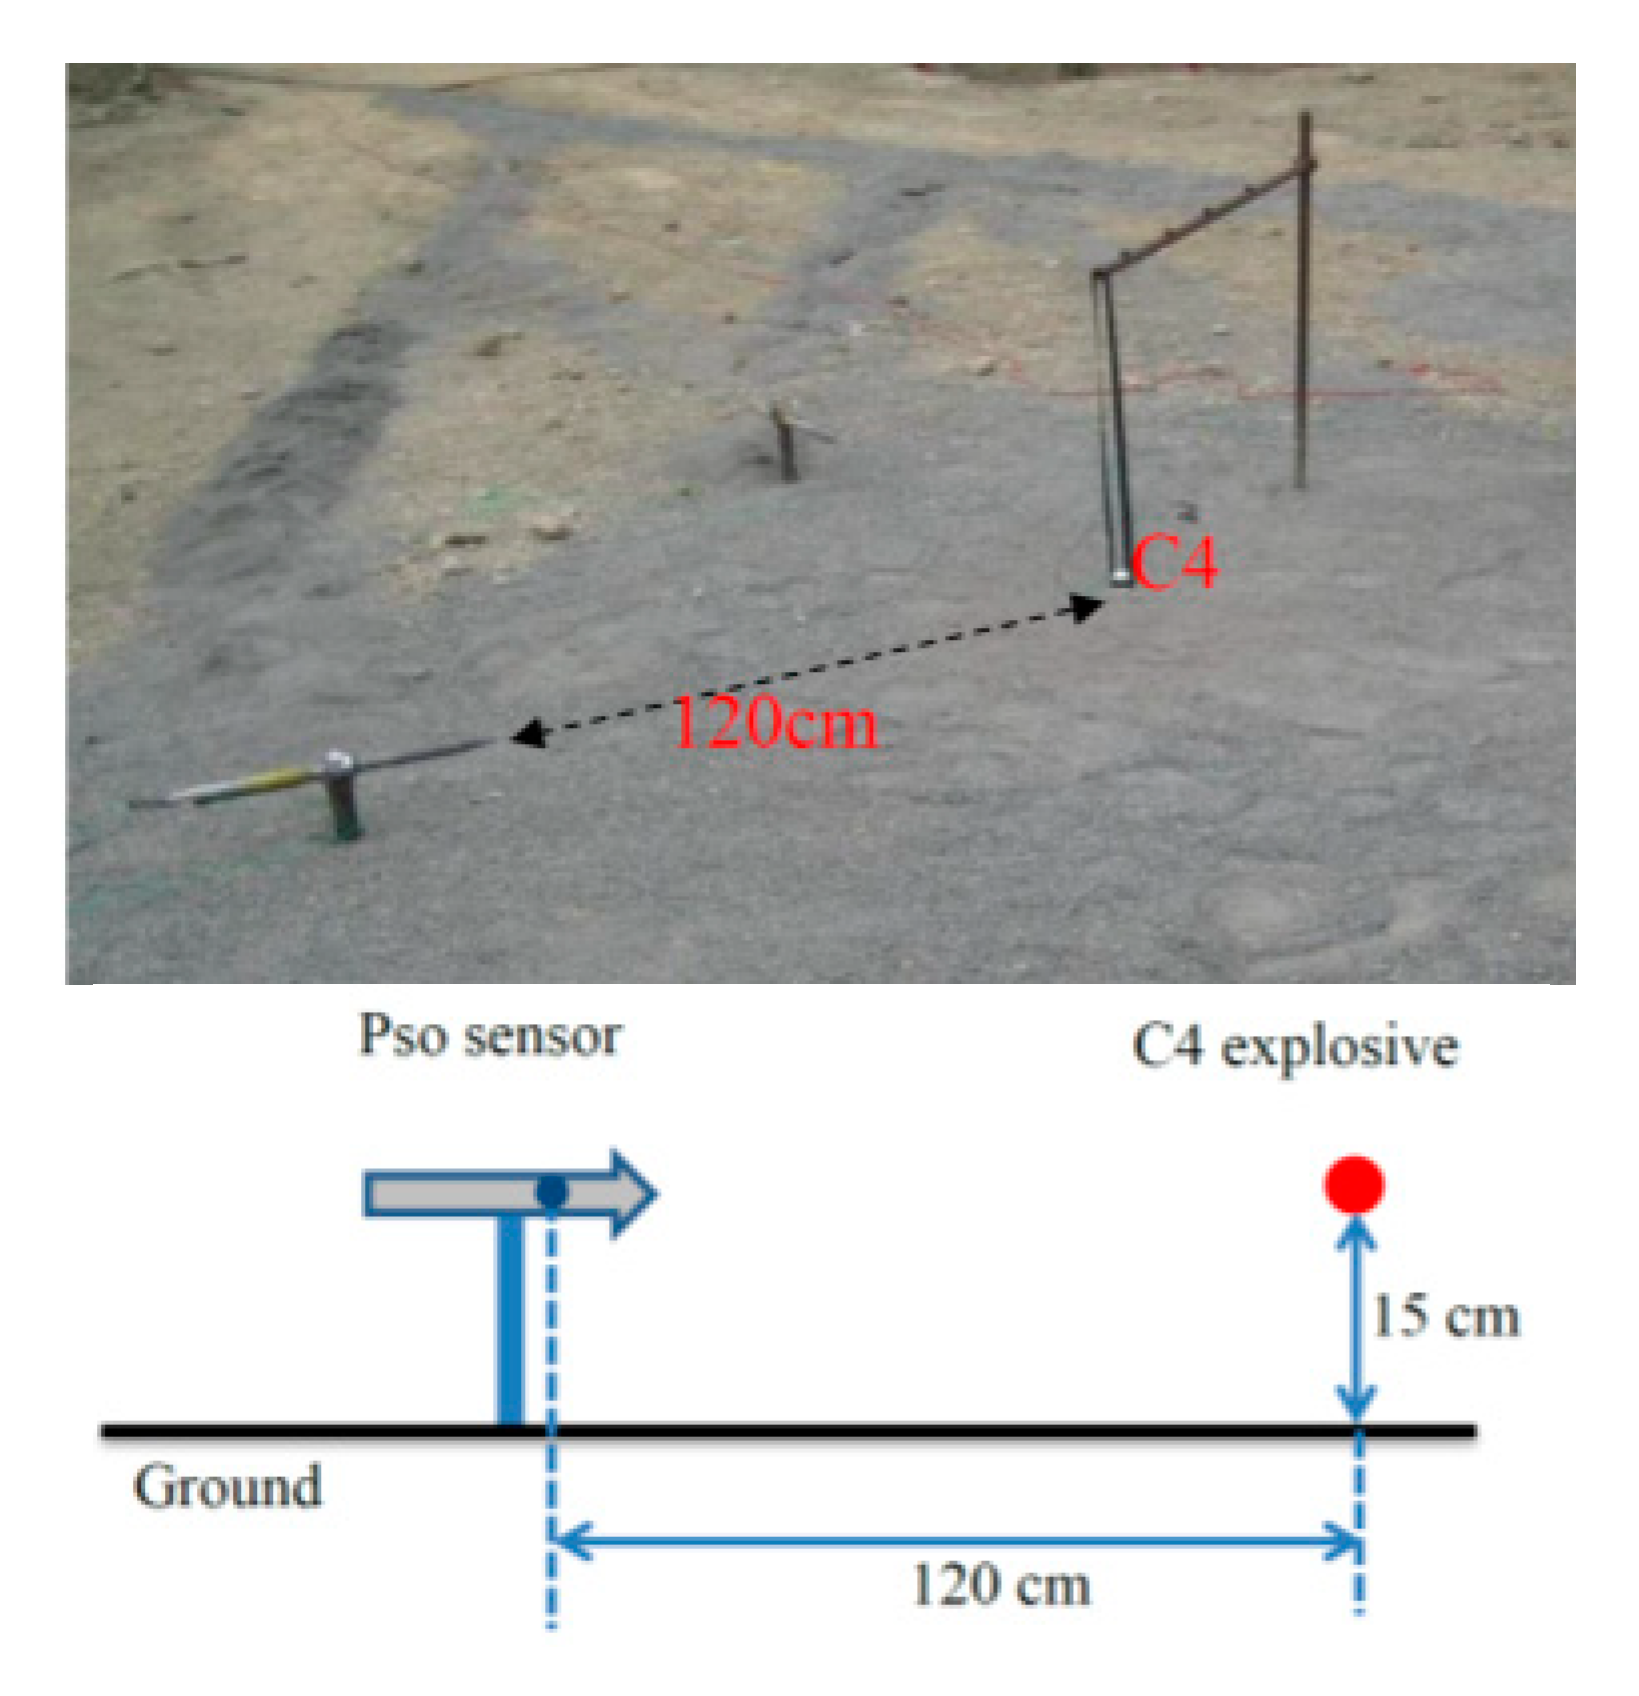
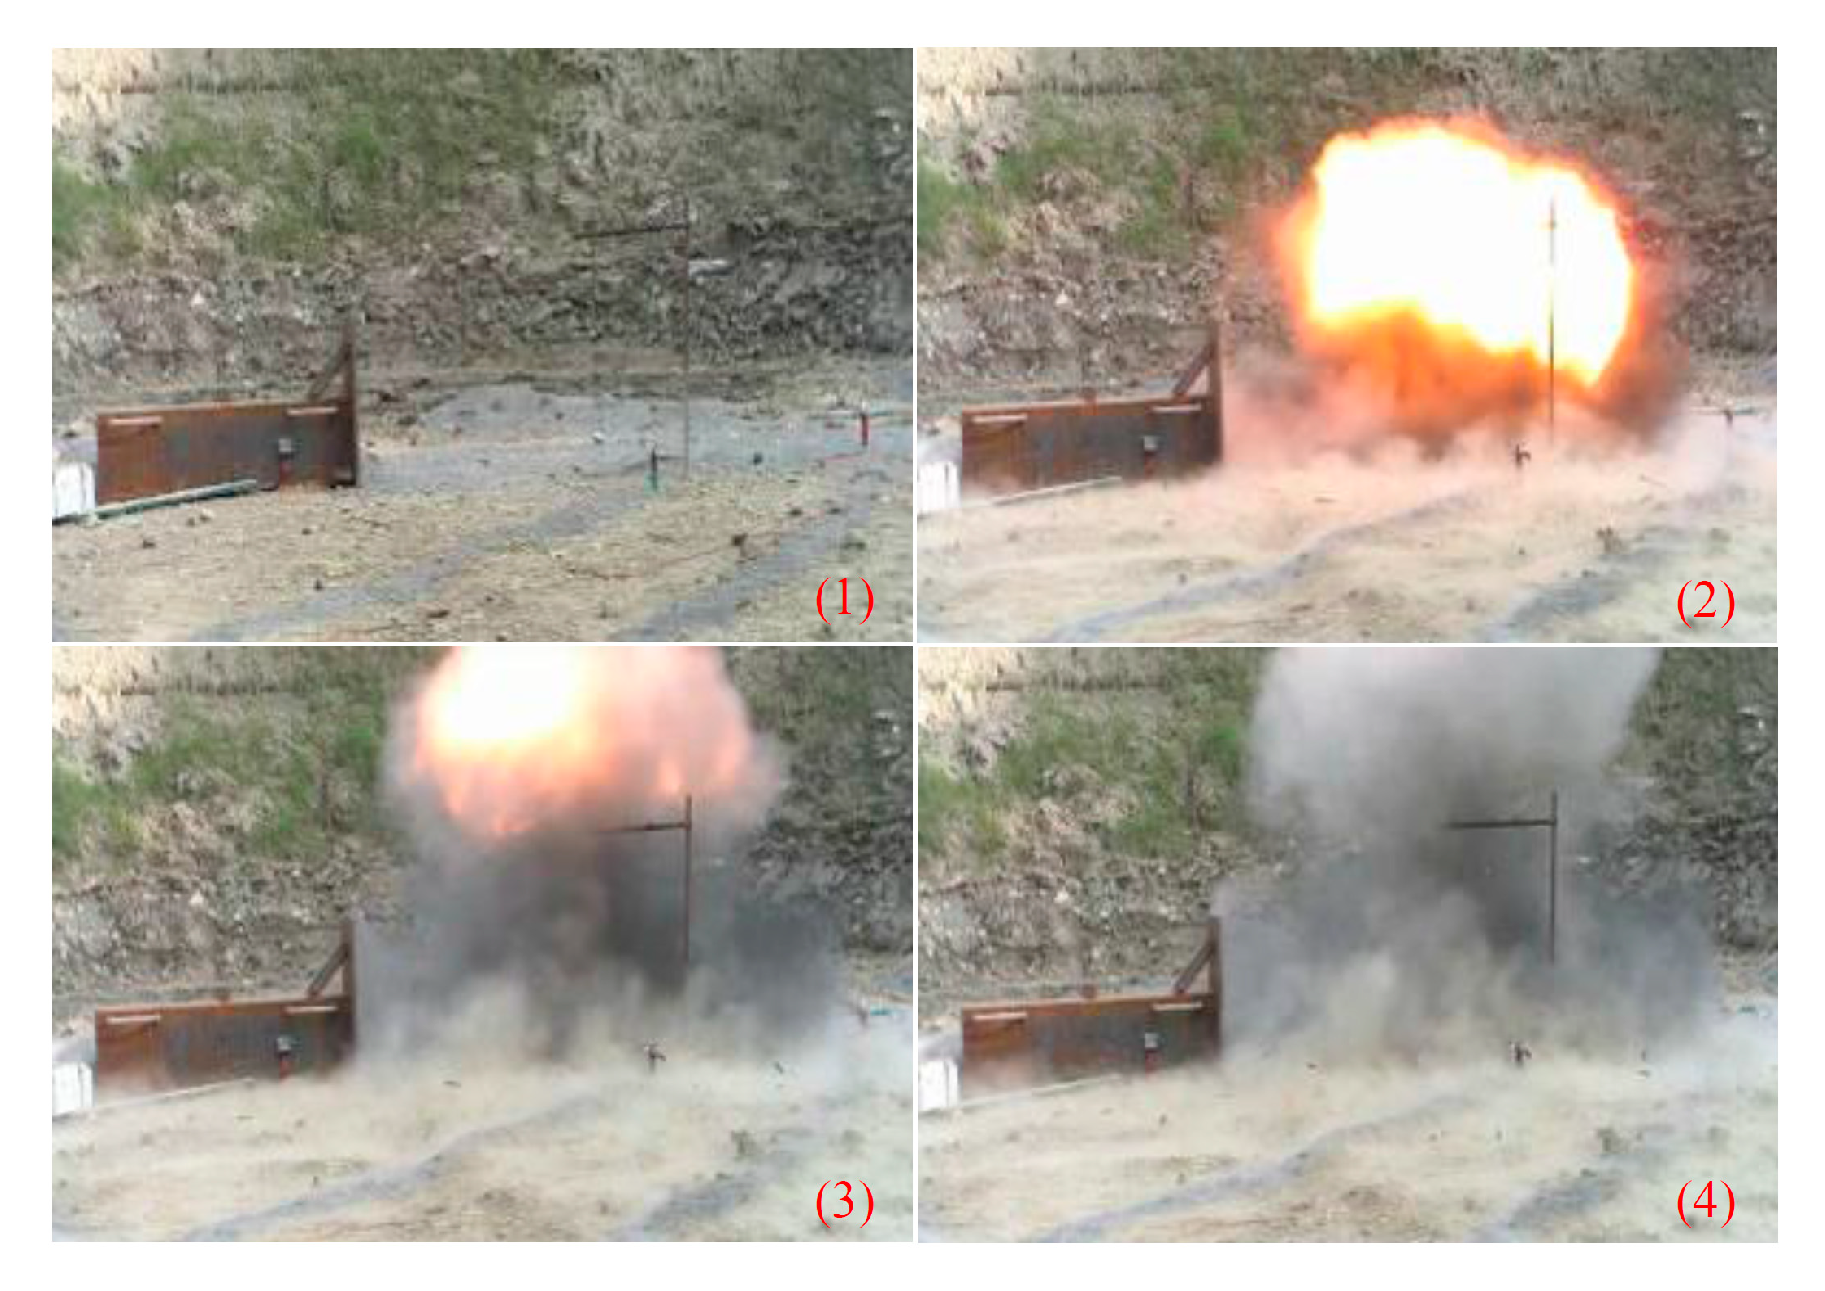
2.1. Near-Surface Burst Experiments

For near-surface burst experiments, spherical C4 charges weighing 50, 100, 120, 150 and 175 g were used, where the center of charge was 15 cm above ground. A free-field blast pressure probe was set 120 cm away from the center of charge to measure the blast pressure, as shown in Figure 1.

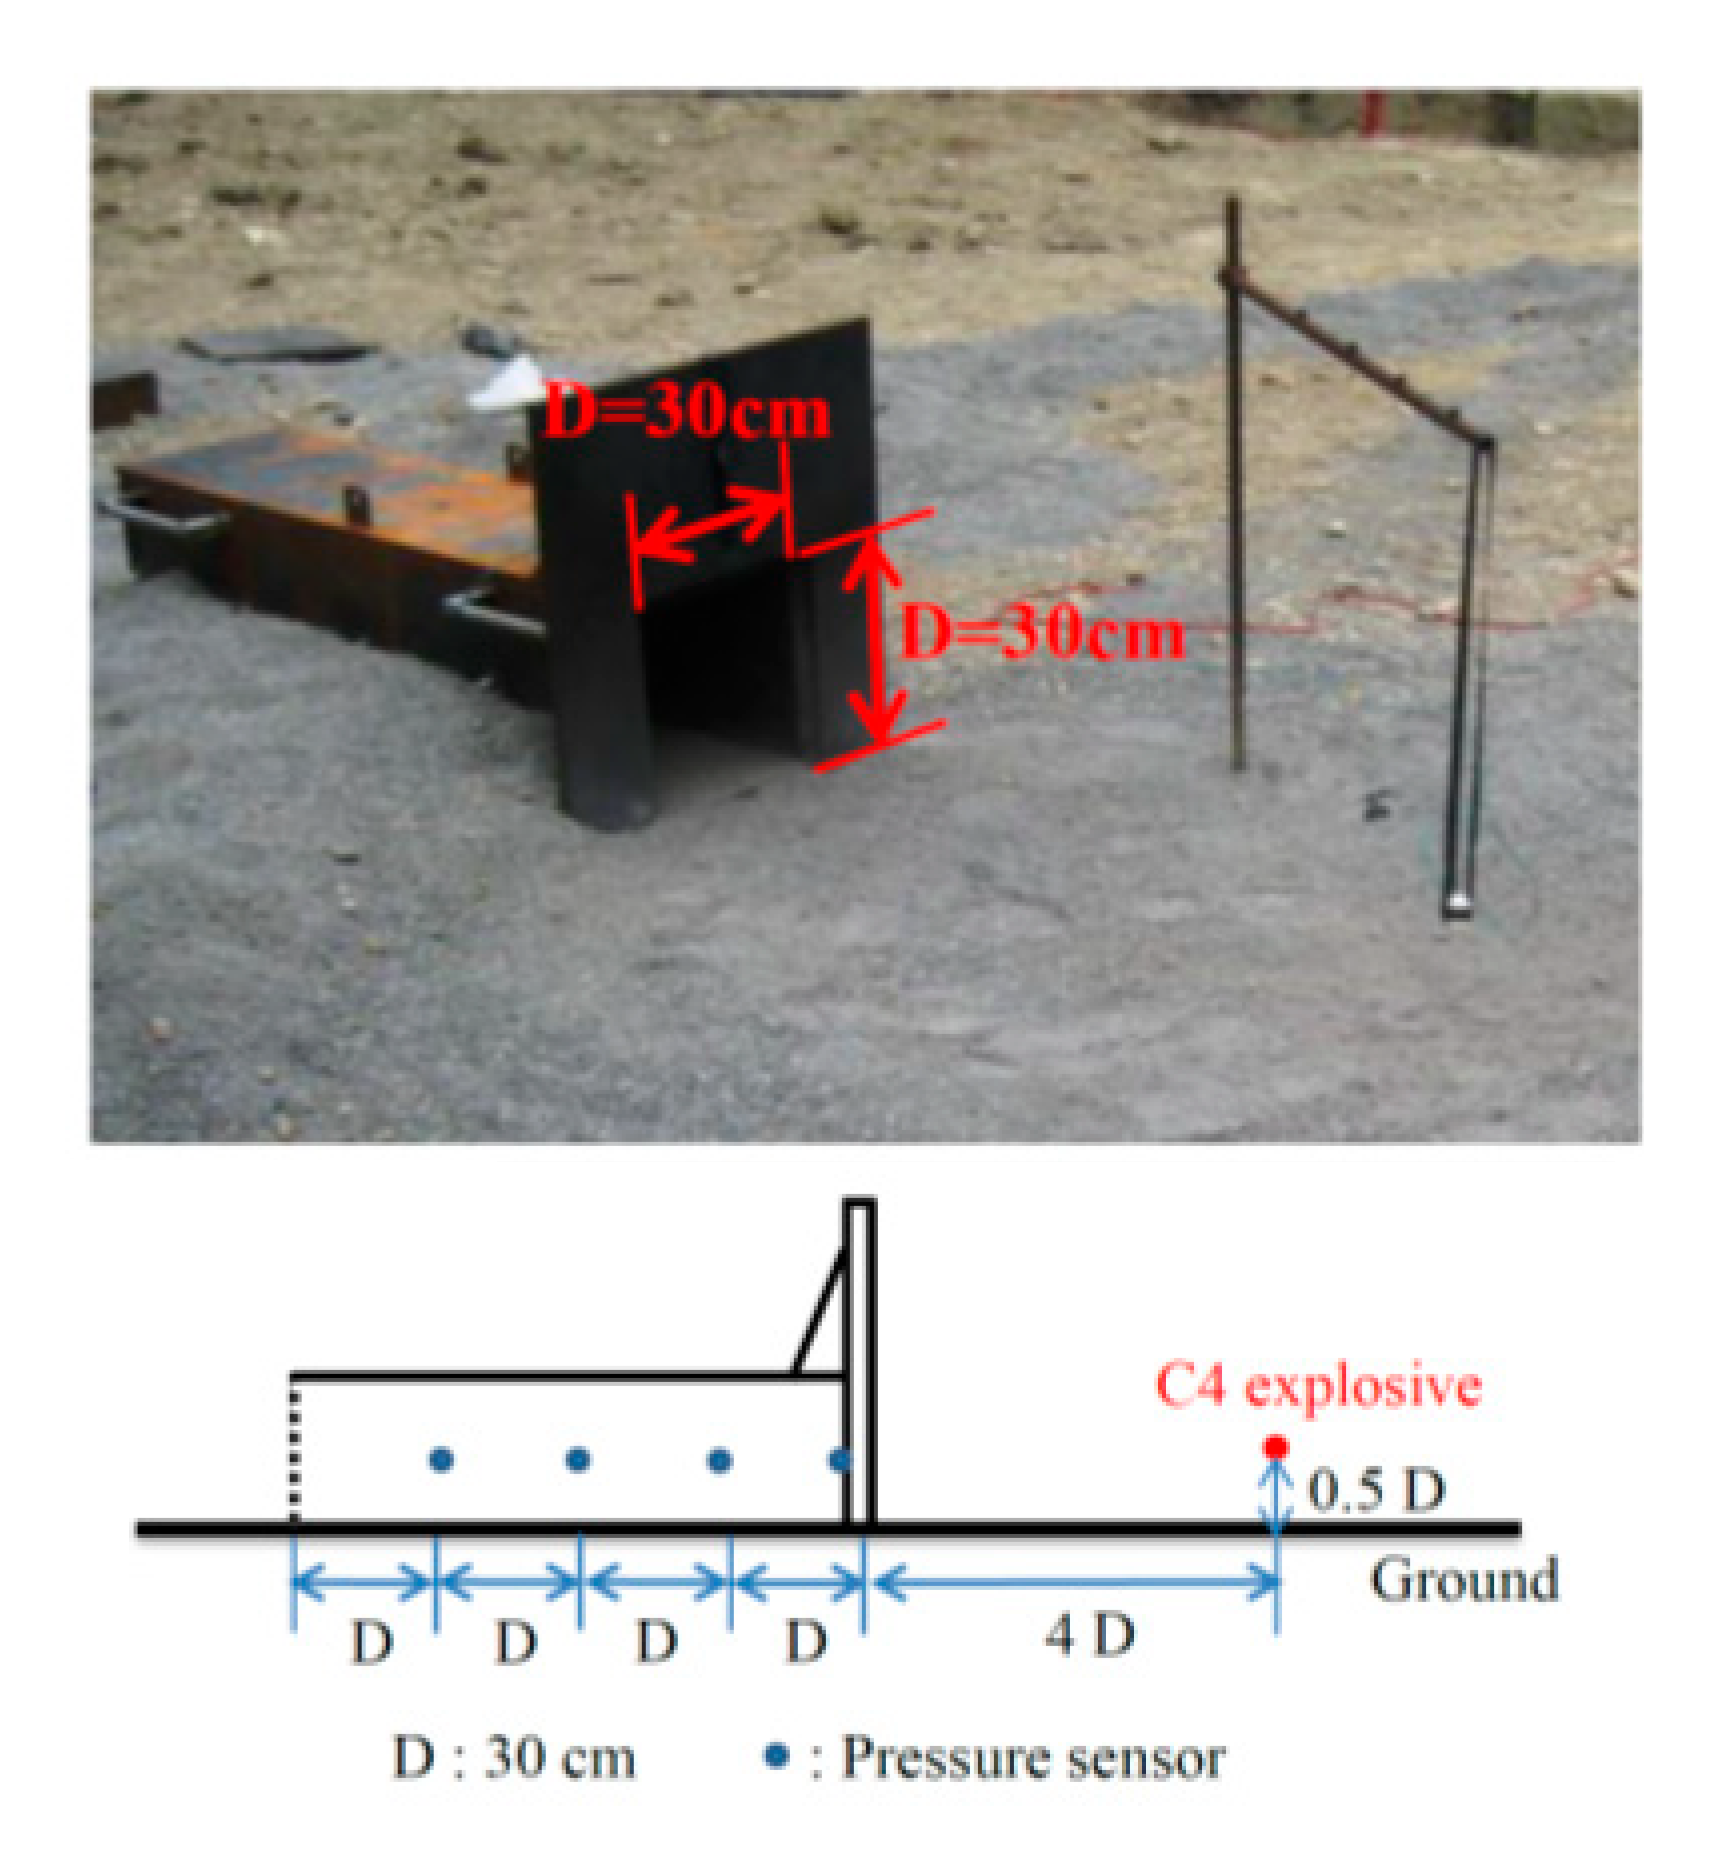
2.2. External Tunnel Explosion Tests

Four steel plates with a thickness of 2 cm were welded together to assemble a rectangular tunnel for blast tests. The tunnel’s dimensions were 30 × 30 × 120 cm. In order to remain consistent with the tunnel’s form, steel plates were added above and on both sides of the tunnel to ensure that the blast pressure generated by external explosions couldsufficiently enter the portal. The external tunnel explosion tests were conducted with a subscale tunnel model and 50–175 g of spherical C4 charges. The charges were placed 120 cm away from the portal, and the center of chargewas placed 15 cm above ground. The pressure sensor was set on the right side of the wall in the tunnel at 2, 30, 60 and 90 cm away from the portal. The explosion experiments were arranged as shown in Figure 2. The portal overpressure was measured for scaled distance Z between 2.15 and 3.26 m/kg1/3. The scaled distance Z is expressed as follows:
Z = R W 1 / 3
where R is the standoff distance (m), and W is the mass of charge (kg).
C4 charges from a US M5A1 pack can be formed intovarious shapes that are suitable for multiple applications. M6 detonators were used and were connected to C4 explosive charges. The 137A23 free-field blast pressure pencil probe made by the US PCB Piezotronic Corporation was used to obtain the free-field blast pressure. The 137A23 pressure probe has the capability to measure the blast pressure up to 345 kPa, which is about 3.4 times the atmospheric pressure. The 113A23 pressure sensor, also from PCB, was installed inside the tunnel and had a maximum pressure capability of 103,420 kPa. The 5054A (4 channels) oscilloscope made by US Agilent Technologies was used for signal acquisition, in which the maximum bandwidth was 100 MHz and the maximum sampling rate was 4 GHz.

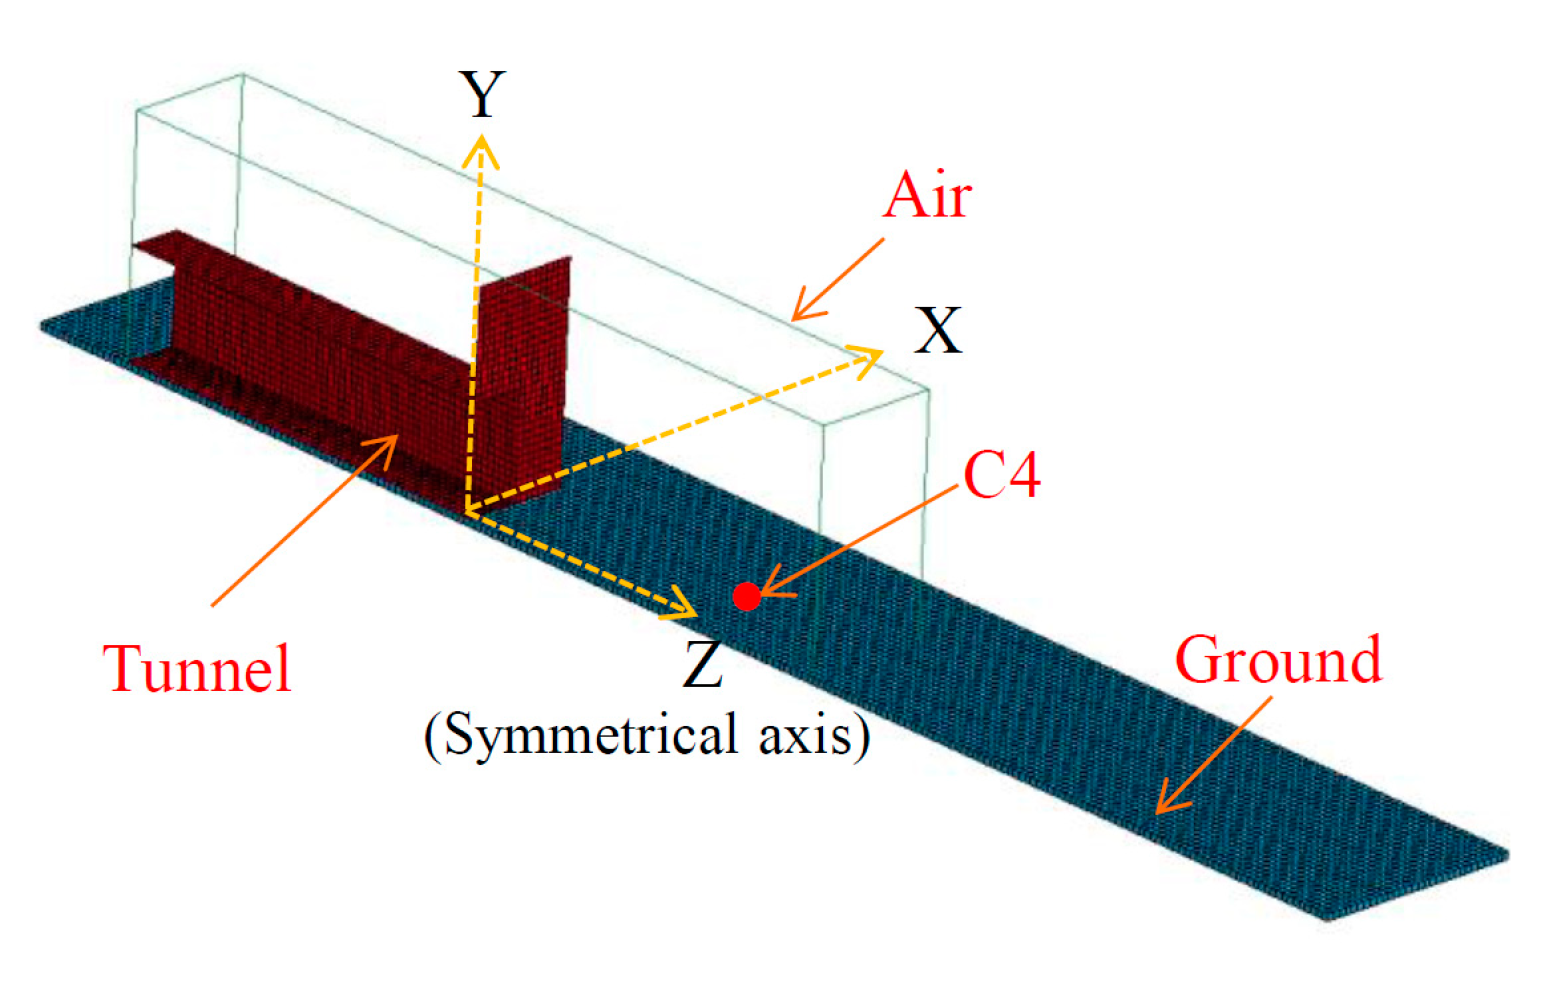
2.3. Numerical Simulation

Numerical simulations of the explosion response of steel tunnels were conducted using hydrodynamic finite element code LS-DYNA. Arbitrary Lagrangian–Eulerian (ALE) algorithm for the fluid–structure interaction (FSI) model of the LS-DYNA was adopted. The structure model was discretized into a finite number of sections, and the conservation and constitutive equations were solved. There are four materials in the numerical models: air, explosives, steel tunnels and soil ground. The constitutive models and material parameters used in this paper are shown in Table 1 and described below [11].
For air material, the MAT_NULL equation was used and combined with a linear polynomial equation of state (EOS) as shown in Equations (2) and (3), respectively.
P = C 0 + C 1 μ + C 2 μ 2 + C 3 μ 3 + ( C 4 + C 5 μ + C 6 μ 2 ) E 0
E 0 = ρ 0 C V T
where P is air pressure, ρ 0 is the initial density of air, C V is the specific heat of air at constant volume and T is the initial temperature of air. E 0 is the initial internalenergy per unit volume, and μ is the volumetric strain. The linear polynomial equation of state may be used to model air by setting C1, C2, C3, and C6 to zero and setting C4 = C5 = γ − 1,where γ = 1.4 is the ratio of the specific heat of air. The equation of state can be further simplified for perfect gas as follows:
P = ( γ 1 ) ρ ρ 0 E 0
where ρ is the current density of air.
For highly explosive materials, including C4, MAT_HIGH_EXPLOSIVE_BURN was used. The Jones-Wilkins-Lee (JWL) equation of state was necessary to simulate the behavior of explosive wave propagation and is expressed asfollows:
P = A ( 1 ω R 1 V ) e R 1 V + B ( 1 ω R 2 V ) e R 2 V + ω E 0 V
where A, B, R1, R2 and ω are coefficients for a specific explosive; P is pressure; V is the relative volume; and E 0 is the initial internalenergy per unit volume. If A and B are set to zero and ω is γ − 1, Equation (5) represents the equation of state for an ideal gas [12].
In the FSI model as shown in Figure 3, both the explosive and the air were modeled with Eulerian meshes, while the tunnel and soil ground were modeled with Lagrangian meshes. To obtain accurate solutions, one Lagrangian element should cover two Eulerian elements when coupling the two meshes [16]. The mesh lengths of air and C4 charges were 1 cm, while those of the tunnel and the ground model were 2 cm. The tunnel structure and ground were made out of used shell elements. The air and explosive charges were represented by solid elements. The Constrained Lagrangian in Solid command was adopted for the coupling between Lagrangian elements and Eulerian elements.

3. Results and Discussion

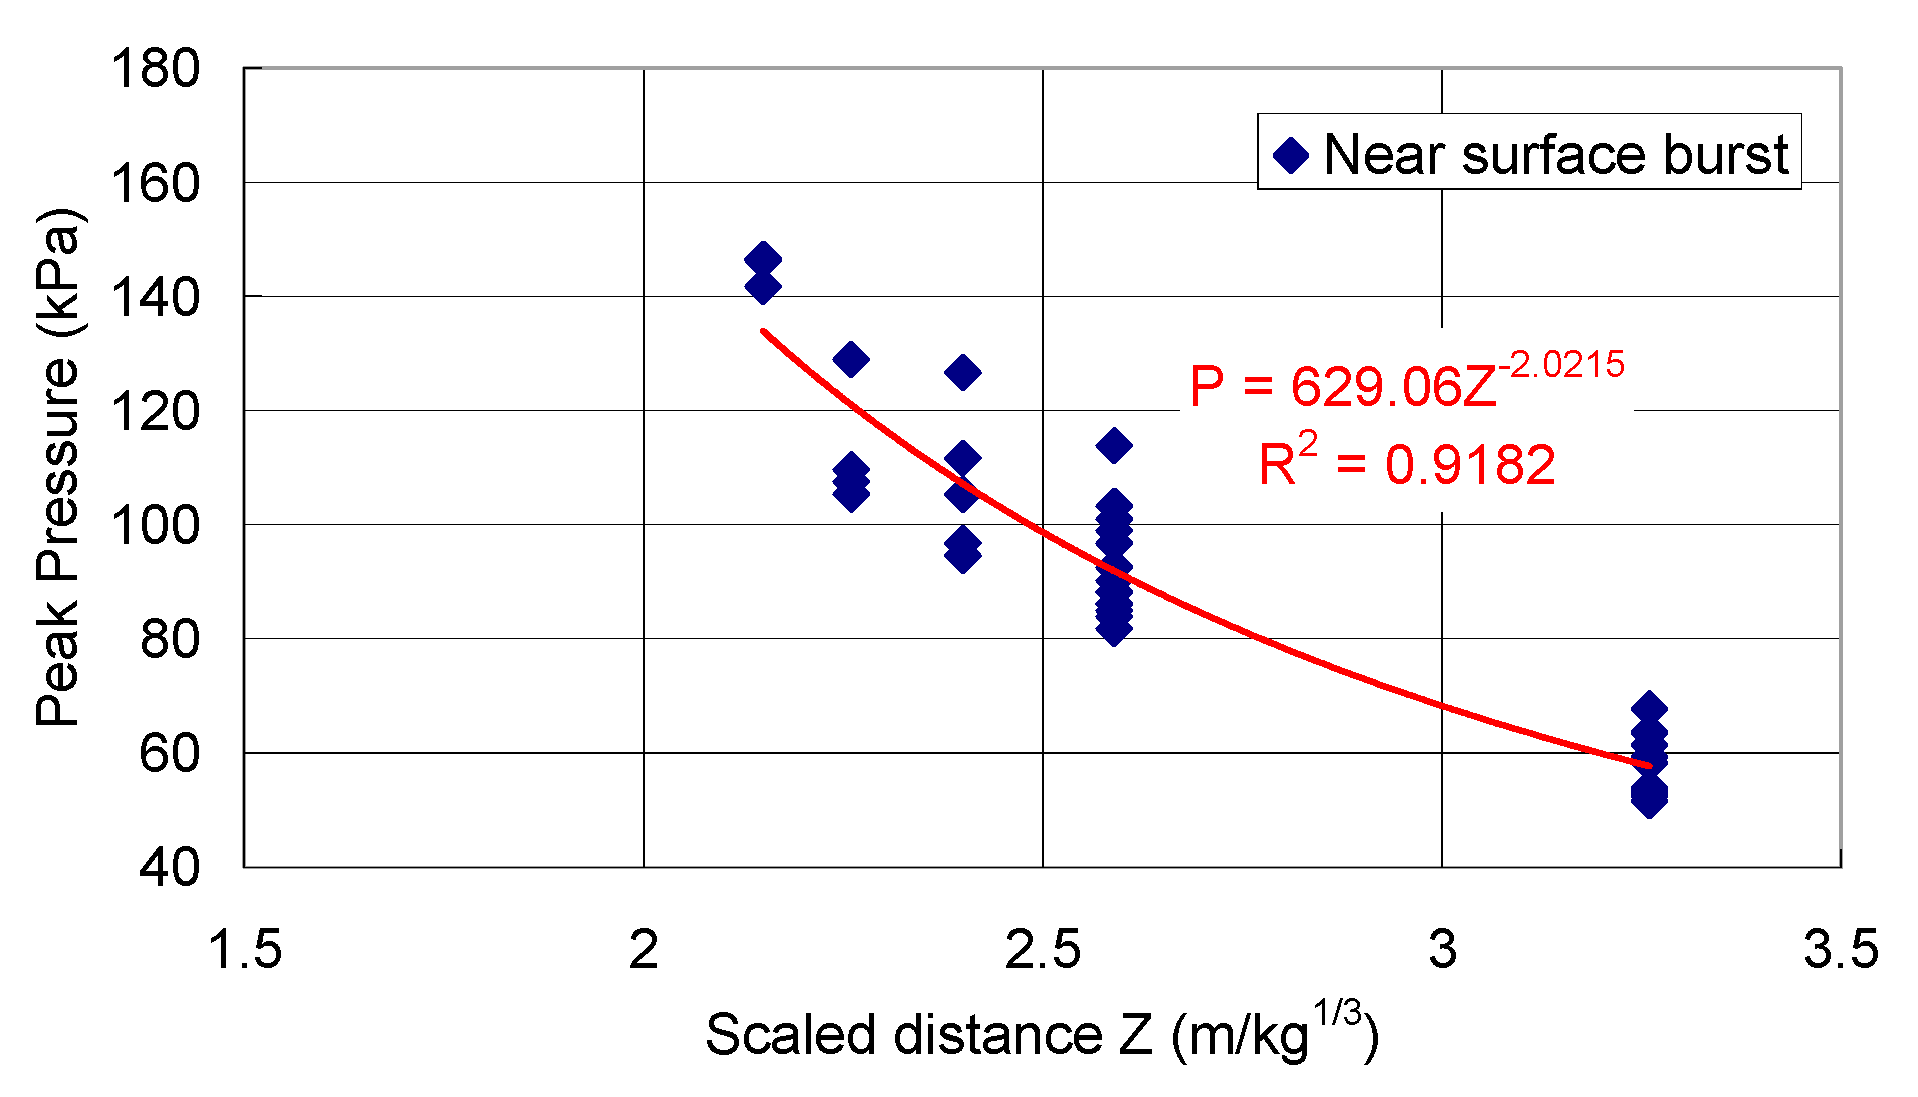
3.1. Near-Surface Burst Experiments

A total of 45 effective data resulted from the near-surface burst experiments, as shown in Figure 4. The coefficient of determination for regression analysis of scaled distance and peak overpressure (kPa) was 0.92, which indicates a negative relationship between the two variables. In order to determine the degree of dispersion of each blast in the experiment, the mean, standard deviation and coefficient of variance of Z = 2.15 to 3.26 m/kg1/3 are shown in Table 2.
The coefficient of variance is between 1.76–14.8%, indicating that there is no significant dispersion in the data of this experiment. To determine the regression analysis of near-surface burst experiments, the power regression model with a maximum coefficient of determination (R-squared value of 0.92) was the best-fitting regression formula that can be used as an empirical equation for near-surface bursts at the portal of tunnel. The power formula of near-surface burst pressure, Pso, is given as follows:
P S O = 629.06 Z 2.02

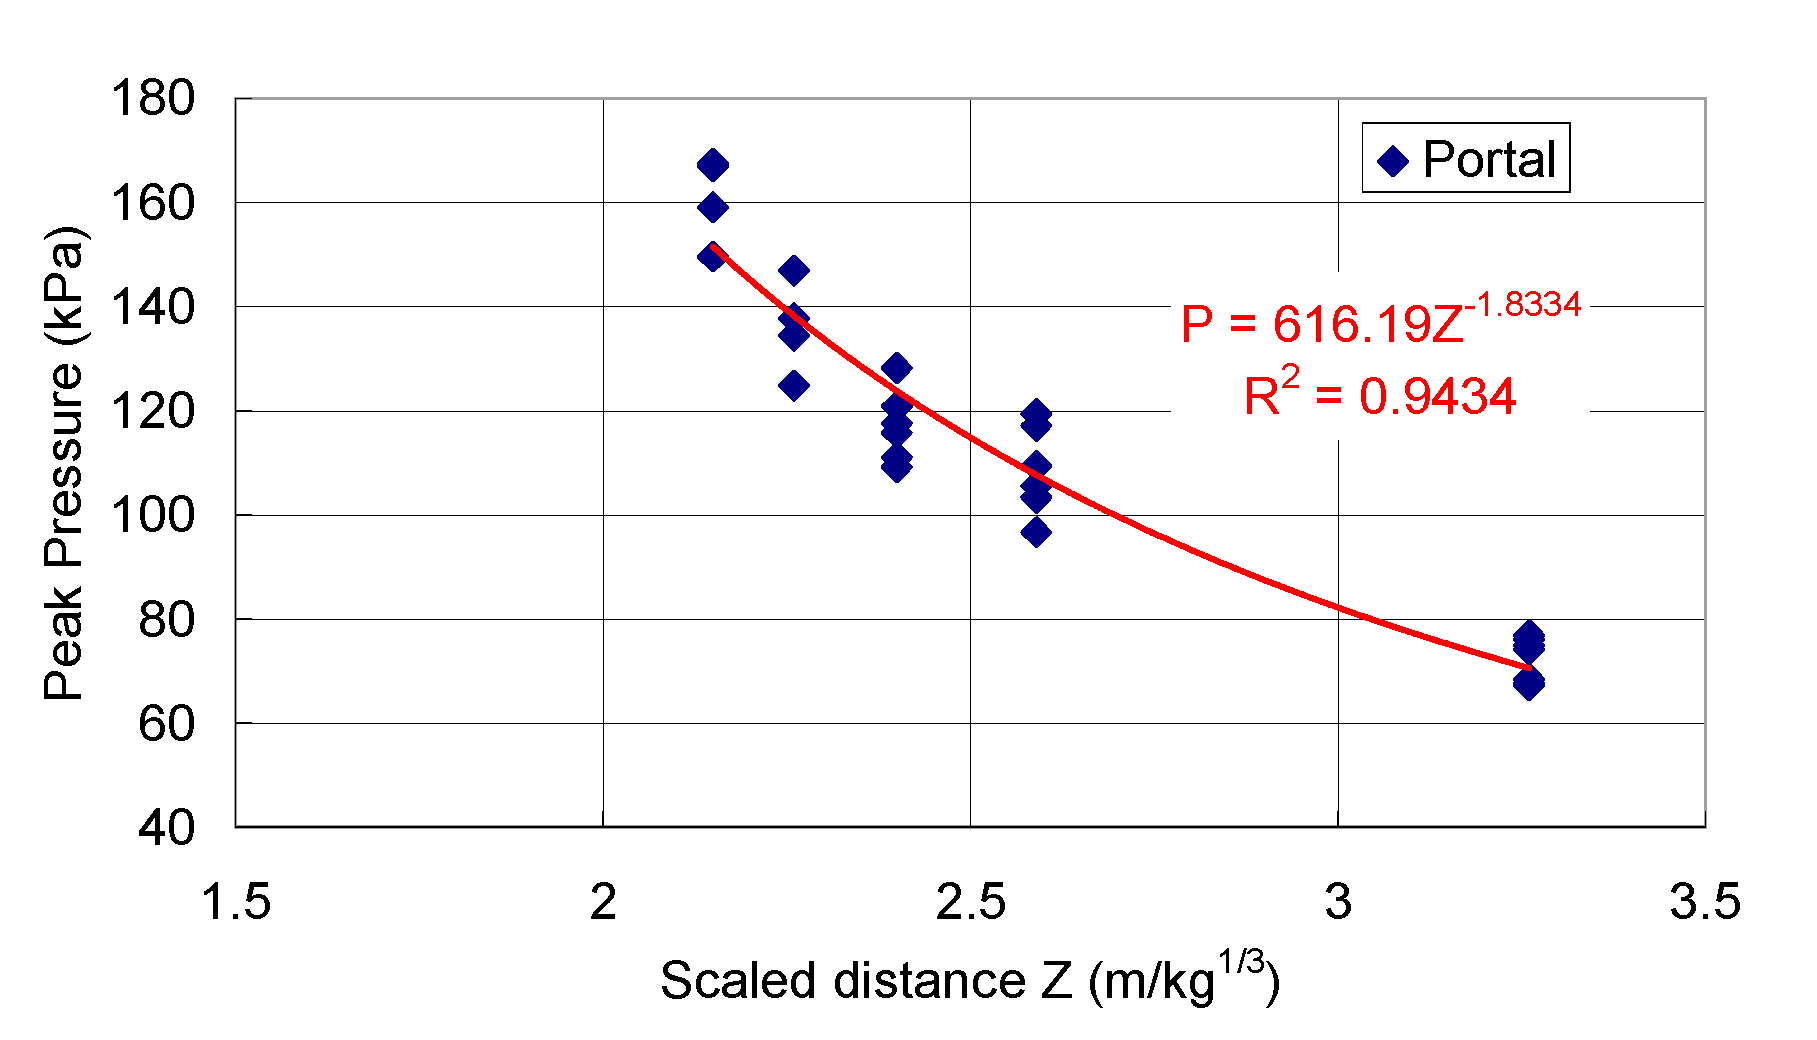
3.2. Portal Overpressure

Figure 5 shows the stages of the external tunnel explosion. A total of 31 effective data resulted from the blast experiments at the portal, as shown in Figure 6. The coefficient of determination for regression analysis of scaled distance and portal pressure was 0.94, which indicates a negative relationship between the two variables. The mean, standard deviation and coefficient of variance of each data set were shown in Table 3. The coefficient of variance is between 5–8%, indicating there is no significant dispersion in the data of this experiment.
To determine the regression analysis of the portal overpressure, the power regression model with a maximum coefficient of determination, the R-squared value of 0.94 was the best fitting regression formula that can be used as an empirical equation for near-surface bursts at the portal of tunnel. The power formula of the portal pressure, Pportal, is given as follows:
P p o r t a l = 616.19 Z 1.83
Table 4 displays the near-surface burst pressure (Pso) with the portal pressure (Pportal) for different C4 charges at scaled distance Z. It can be observed in Table 4 that the near-surface burst pressure was smaller than the portal pressure, with a variance of −9.07 to −19.10%. This might be because the shock wave was compressed or diffracted when entering the portal, leading to an increment in blast pressure at the portal. Table 4 also shows the results when taking into consideration the ratio of the portal pressure to the near-surface burst pressure. Consequently, the blast pressure at the portal section was on average approximately 1.17 times greater than the near-surface burst for the scaled distance Z between 2.15 and 3.26 m/kg1/3. The relationship between Pportal and Pso is shown in Equation (8).
P p o r t a l = 1.17 × P s o

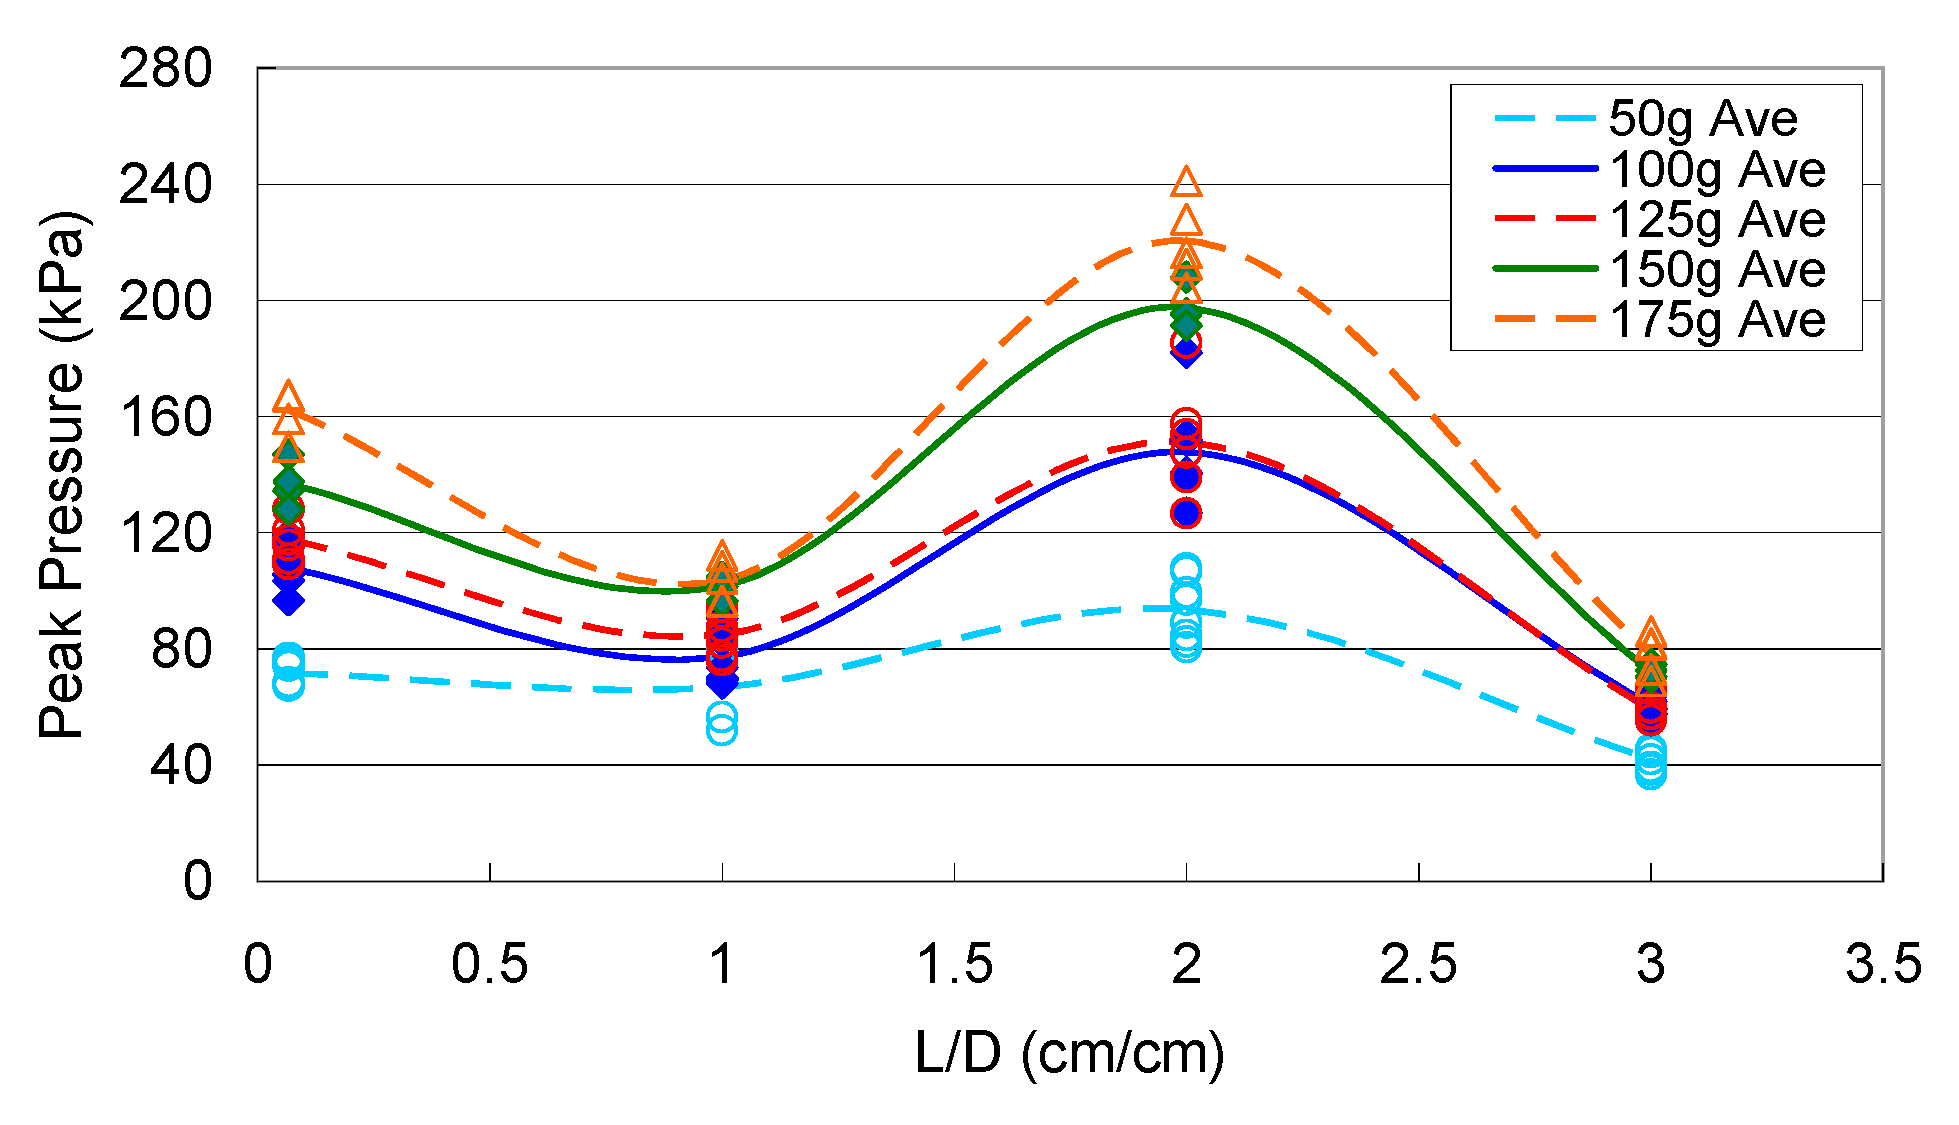
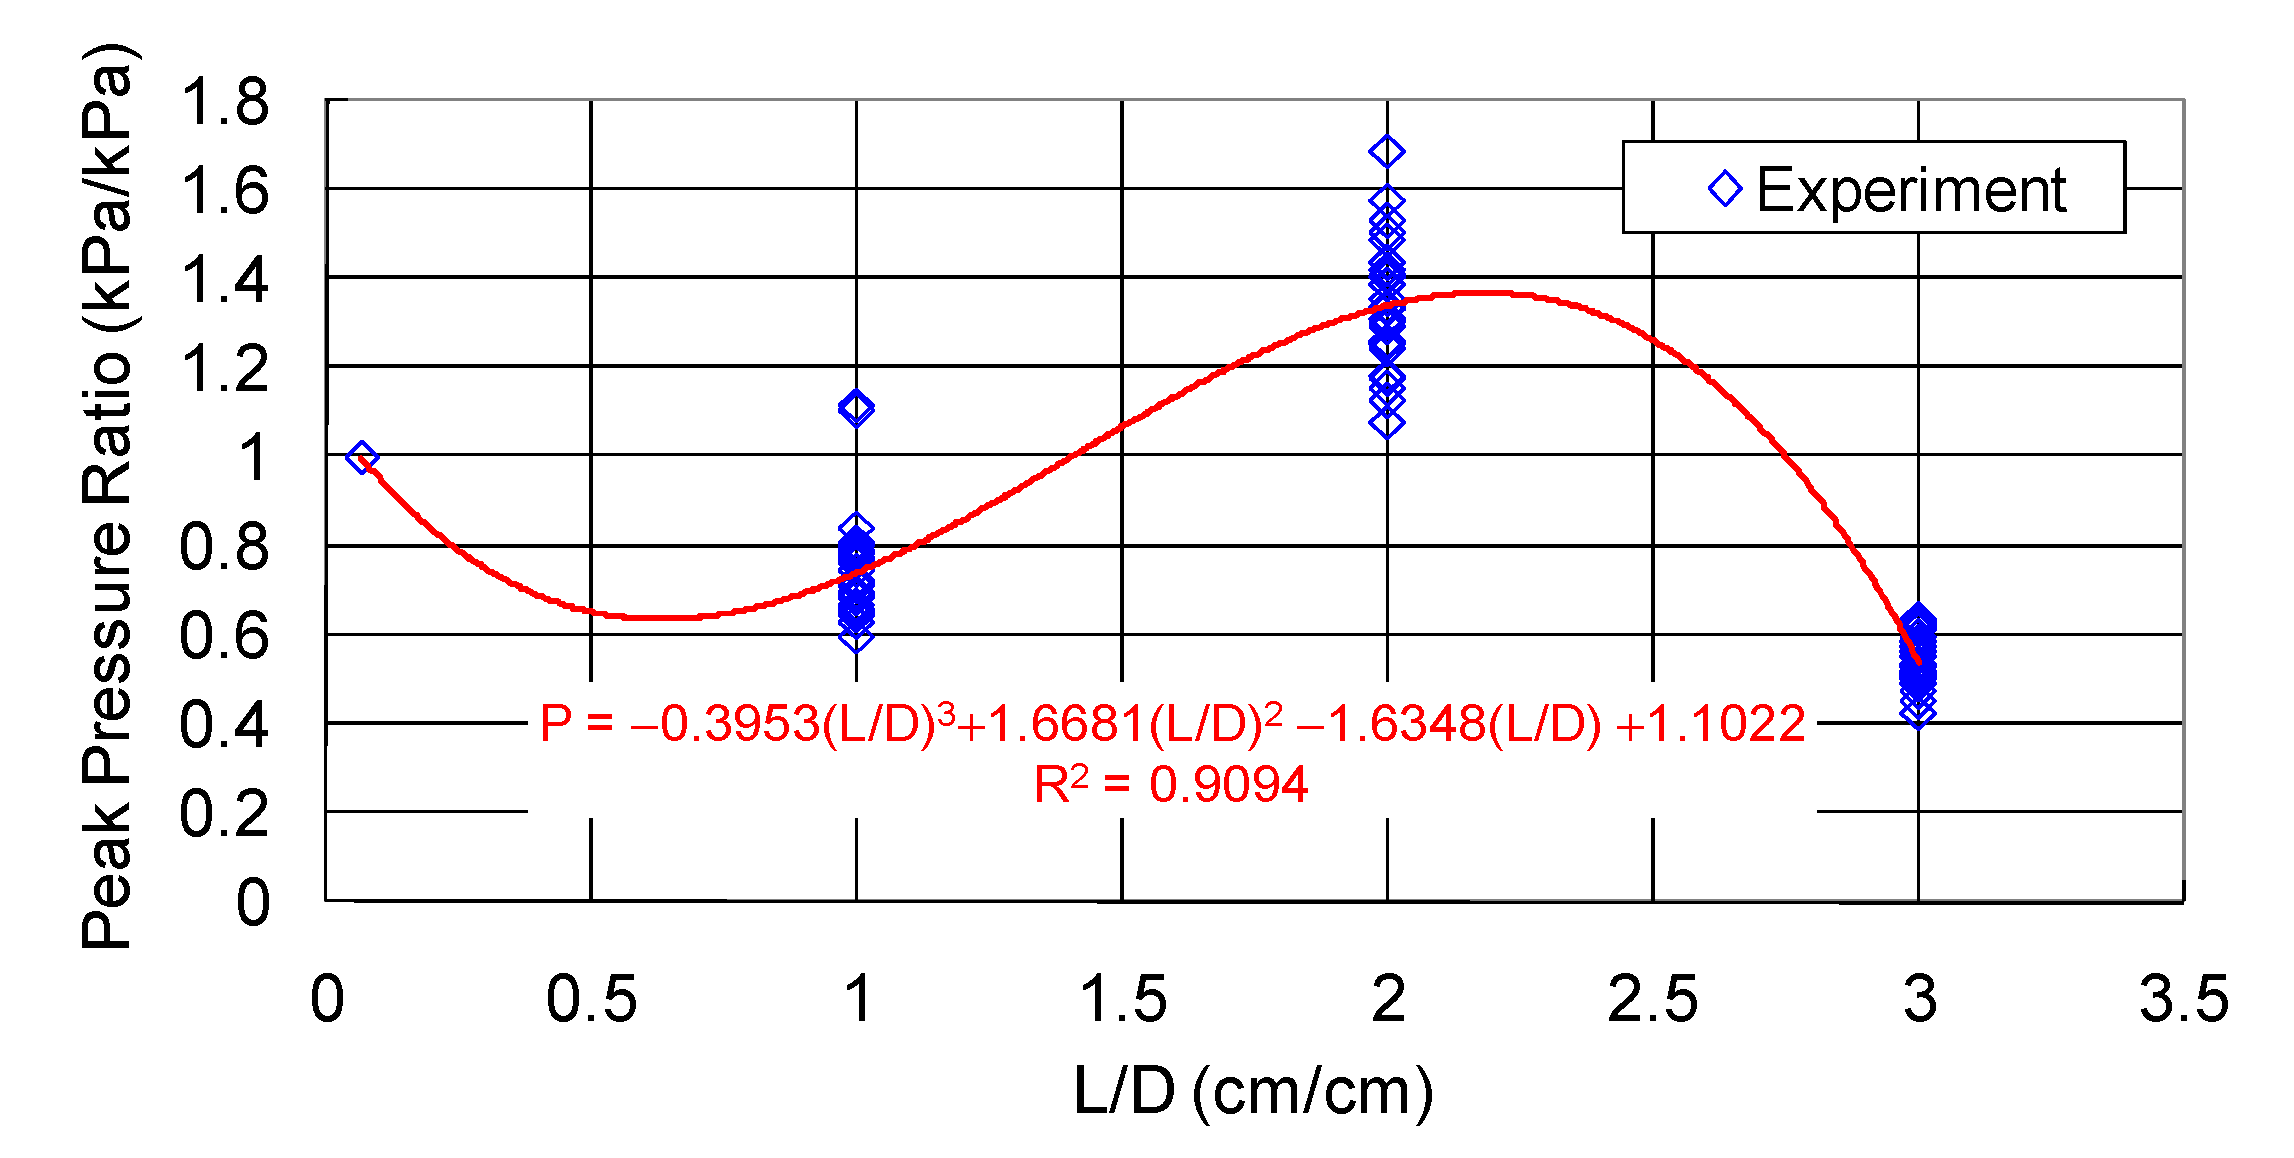
3.3. Internal Tunnel Overpressure

Pressure sensors were set at 2, 30, 60 and 90 cm in the tunnel to measure internal overpressure. The distance between the portal and the pressure sensor location L, divided by the diameter of the tunnel D (30 cm) to be dimensionless, resulted in L/D = 0.067, 1, 2 and 3, respectively. Figure 7 shows a comparison of the blast pressures measured at the portal and the internal sections of the tunnel with different amounts of C4 charges.When the shock wave propagated between the portal section and the L/D = 1 section, the blast pressure was attenuated, but it increased as the shock wave moved towards the L/D = 2 section, which might be due to reflection waves and superposition by blast waves generated on the inner walls causing the blast pressure measured at that section to be greater than the others. Finally, the blast pressure was attenuated as the shock wave moved towards the L/D = 3 section.
For comparing the relation between peak pressures measured in the tunnel and portal section, the peak pressures measured by sensors were normalized, and the portal section was set at 1 ( P s o = P i n t e r n a l / P p r o t a l ). The peak pressures of sections L/D = 1, 2 and 3 were compared with the portal section, as shown in Figure 8. The cubic polynomial regression equation ofmaximum coefficient of determination (R-squared value of 0.91) was used as the best regression equation for internal overpressure ratio, as shown in Equation (9).
P s o = 0.395 ( L D ) 3 + 1.67 ( L D ) 2 1.63 ( L D ) + 1.1

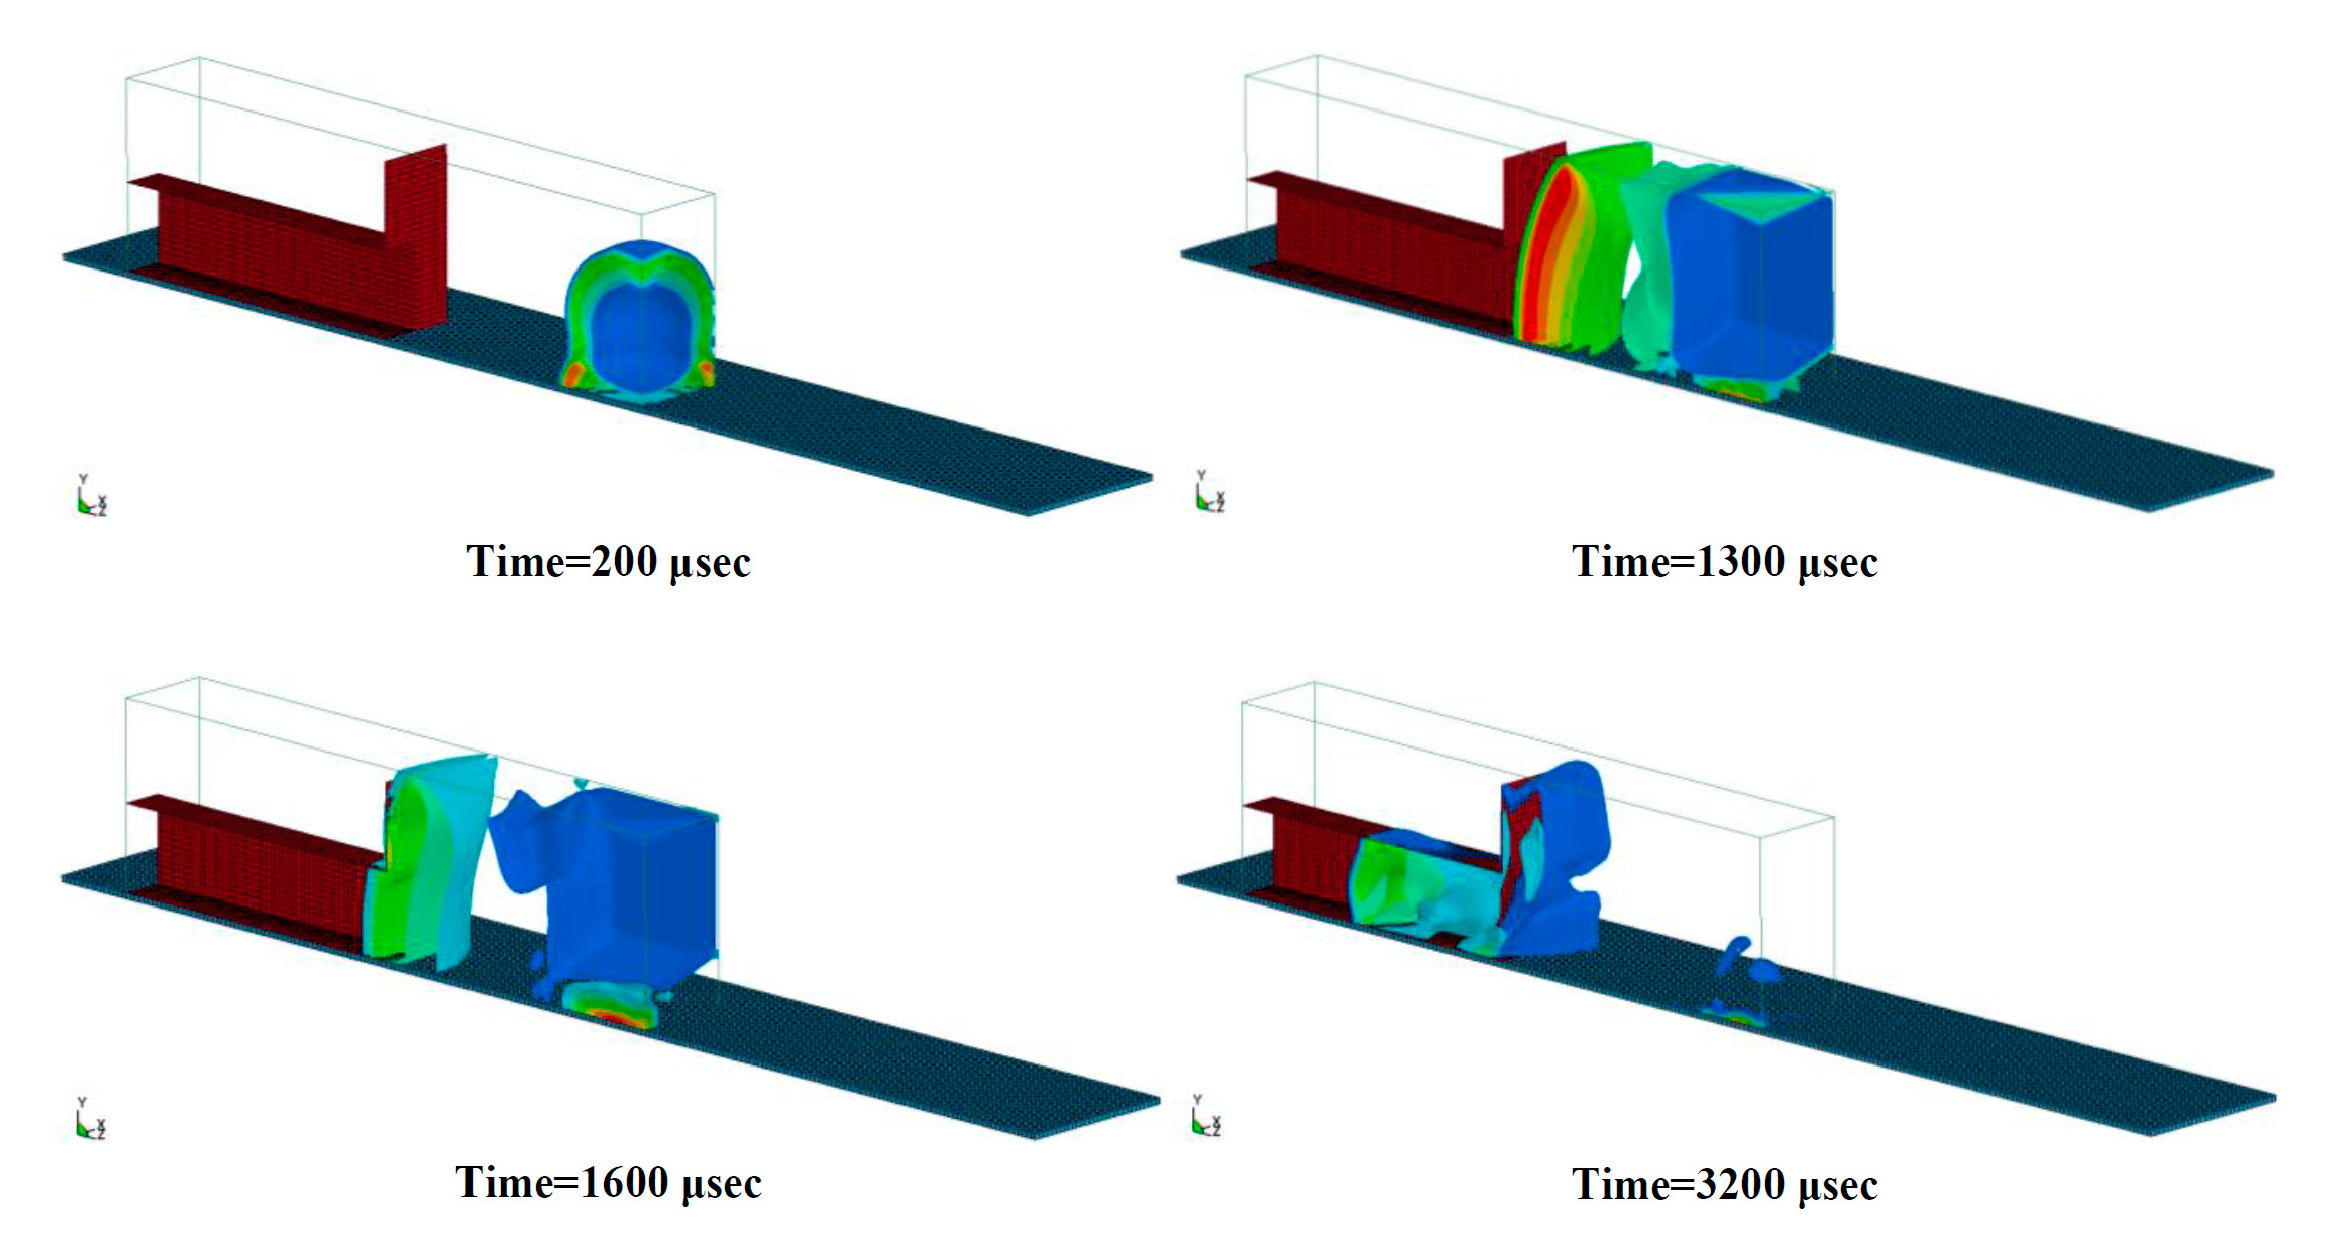
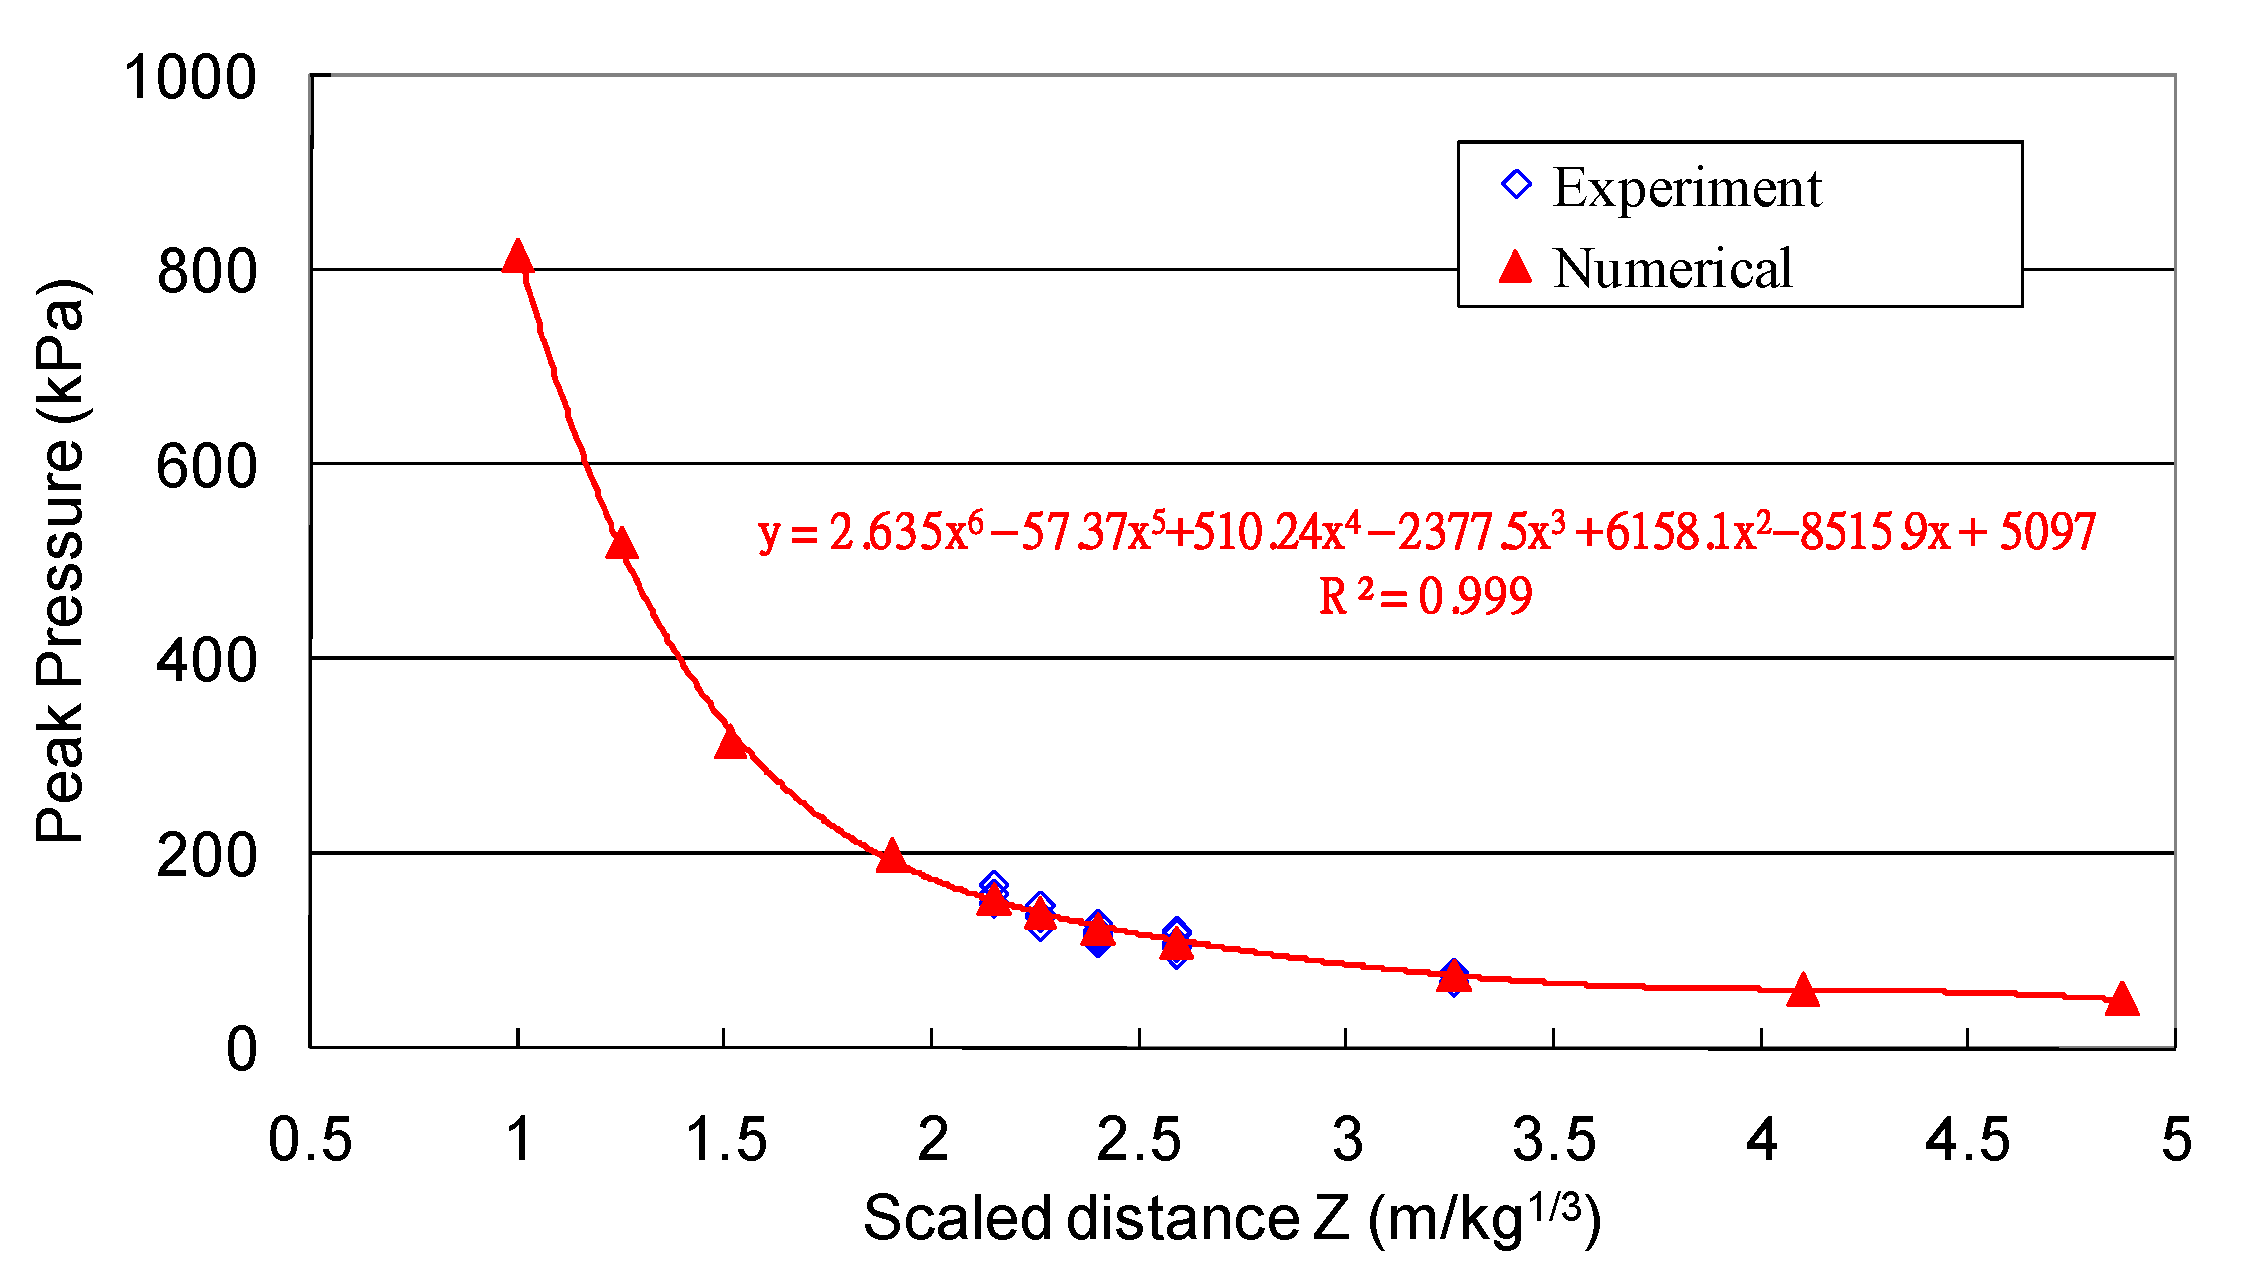
3.4. Numerical Simulation Results

The computed near-field pressure distribution due to explosion is shown in Figure 9. The propagation of the shock wave within the tunnel structure at different times is clearly observed. Table 5 shows the experimental and numerical results for portal blast pressure. The numerical results obtained by LS-DYNA and shown in Table 5 also illustrate that the pressure at the portal was attenuated when the scaled distance Z increased. In Z = 2.15 to 3.26 m/kg1/3, the relative difference between numerical simulation and the experiment was less than 6%. Numerical results are in agreement with the experimental results and can be extended for further analysis.
In order to expand the overpressure response where were not available in experiments. In numerical study increased the scaled distance Z to 4.95 m/kg1/3 and decreased the scaled distance Z to 0.97 m/kg1/3. The numerical results are shown in Figure 10, and the polynomial regression equation of the maximum coefficient of determination (R-squared value 0.99) was used as the best regression equation for portal overpressure, as shown in Equation (10).
P L S D y n a = 2.64 Z 6 57.38 Z 5 + 510.24 Z 4 2377.5 Z 3 + 6158.1 Z 2 8516 Z + 5097

3.5. Establishing the Predictive Model of Tunnel Overpressure

According to the burst test and the numerical analysis results, this study provides three types of empirical formulaeto estimate the internaltunnel overpressure when subjected to external explosion.
1.
Method I:
(1)
Use Equation (6) in Section 3.1 to determine the overpressure of near-surface burst ( P s o )
(2)
Use Equation (8) in Section 3.2, which indicates that the blast pressure at the portal is 1.17 times greater than the near-surface burst, to determine the portal pressure ( P p o r t a l ).
(3)
Use Equation (9) in Section 3.3, which indicates the relation between the peak pressures measured by each pressure sensor and at the portal section, to determine the overpressure ratio ( P s o ).
(4)
Use Equation (11) to determine the in-tunnel pressure ( P i n t e r n a l ).
P i n t e r n a l = P p o r t a l × P s o ,
2.
Method II:
(1)
By using Equation (7) in Section 3.2, which indicates the power regression equation ofblastpressure at the portal, the portal pressure ( P p o r t a l ) may be determined.
(2)
Use Equation (9) in Section 3.3, which indicates the relation between the peak pressures measured by each pressure sensor and at the portal section, the overpressure ratio ( P s o ) may be determined.
(3)
Use Equation (11) to determine the in-tunnelpressure ( P i n t e r n a l ).
3.
Method III:
(1)
By using Equation (10) in Section 3.4, which indicates the polynomial regression equation of the verification of combined numerical simulations and prediction models, the blast pressure atthe portal ( P p o r t a l ) may be predicted.
(2)
Use Equation (9) in Section 3.3, which indicates the relation between the peak pressuresmeasured by each pressure sensor and at the portal section, to determine the overpressure ratio ( P s o ).
(3)
Use Equation (11) to determine the in-tunnel pressure ( P i n t e r n a l ).

4. Conclusions

This study used small amounts of C4 charges and small-sized tunnelspecimens to evaluate the overpressure response in steel tunnels subjected to external explosion. The explosive scaled distance of C4 charges from 2.15 to 3.26 m/kg1/3 was evaluated by experiments and numerical analysis. The numerical results are in agreement with the experimental results. A simple way to estimate the overpressurein steel tunnels was proposed. The proposed methodology is both useful and efficient and can be further developed for designing tunnel structures that are protected against explosions.

Author Contributions

Methodology, B.-C.S.; software and writing—original draft preparation, C.-W.H.; writing—review and editing, P.-W.W.; project administration, T.-A.C.; funding acquisition, H.-H.L. All authors have read and agreed to the published version of the manuscript.

Funding

The financial support of the Ministry of Science and Technology, Taiwan, under grant NSC 99-2623-E-606-005-D is gratefully acknowledged.

Conflicts of Interest

We declare that we have no financial and personal relationships with other people or organizations that can inappropriately influence our work; there is no conflicting professional or other personal interest of any nature.

References

  1. Smith, P.D.; Vismeg, P.; Teo, L.C.; Tingey, L. Blast wave transmission along rough-walled tunnels. Int. J. Impact Eng. 1998, 24, 419–432. [Google Scholar] [CrossRef]
  2. Yu, W.F.; Hung, C.W.; Cheng, D.S. Effect of Subdividing Stacks on Blast Overpressure from Explosion inside Ammunition Storage Magazine. J. Explos. Propellants 2008, 24, 25–40. [Google Scholar]
  3. Luccioni, B.; Ambrosini, D.; Nurick, G.; Snyman, I. Craters produced by underground explosions. Comput. Struct. 2009, 87, 1366–1373. [Google Scholar] [CrossRef] [Green Version]
  4. Yu, W.F.; Hung, C.W.; Cheng, D.S. Effect of Blast wall on Safety Distance of Ammunition Storage Magazine Subjected to Internal Explosion. J. Chung Cheng Inst. Technol. 2010, 39, 131–145. [Google Scholar]
  5. Cheng, D.S.; Hung, C.W. Experiment and Numerical Simulation of Peak Overpressure of C4 Explosives in the Airblast. J. Explos. Propellants 2010, 26, 75–96. [Google Scholar]
  6. Pi, S.J.; Cheng, D.S.; Cheng, H.L.; Li, W.C.; Hung, C.W. Fluid-Structure- Interaction for a Steel Plate subjected to Non-Contact Explosion. Theor. Appl. Fract. Mech. 2012, 59, 1–7. [Google Scholar] [CrossRef]
  7. Zakrisson, B.; Wikman, B.; Häggblad, H.Å. Numerical simulations of blast loads and structural deformation from near-field explosions in air. Int. J. Impact Eng. 2011, 38, 597–612. [Google Scholar] [CrossRef] [Green Version]
  8. Scheklinski-Gluck, G. Blast in Tunnels and Rooms from Cylindrical HE-Charges outside the Tunnel Entrance. In Proceedings of the Sixth International Symposium on Interaction of Nonnuclear Munitions with Structures, Panama City Beach, FL, USA, 3–7 May 1993. [Google Scholar]
  9. McMahon, G.W.; Taylor, S.R. In-Tunnel Airblast from Near Portal Detonations; ERDC Report; ERDC: Vicksburg, MS, USA, 2005. [Google Scholar]
  10. Welch, B.; McMahon, G.W.; Kim, D. Transportation Tunnels and Terrorist Attacks; ERDC: Vicksburg, MS, USA, 2005. [Google Scholar]
  11. LS-DYNA. Version 971/Rev 5 User’s Manual; Livermore Software Technology Corporation: Livermore, CA, USA, 2010. [Google Scholar]
  12. Pricop, M.V.; Wang, B.; Rehn, W. Fluid-Structure-Interaction for the Detonation of a Gaseous Mixture in a Nuclear Reactor Containment; Institute National de Cercetari Aerospatiale: Bucharest, Romania, 2002. [Google Scholar]
  13. Mullin, M.J.; O’Toole, B.J. Simulation of Energy Absorbing Materials in Blast Loaded Structures. In Proceedings of the 8th Internation LS-DYNA Users Conference, Dearbon, MI, USA, 2–4 May 2004; pp. 67–80. [Google Scholar]
  14. Dobratz, B.M. LLNL Explosives Handbook Properties of Chemical Explosives and Explosives Simulants; Lawrence Livermore National Laboratory: Livermore, CA, USA, 1981; pp. 8–23. [Google Scholar]
  15. Wang, J. Simulation of Landmine Explosion Using LS-DYNA 3D Software: Benchmark Work of Simulation of Explosion in Soil and Air; DSTO-TR-1168; Aeronautical and Maritime Research Laboratory: Fishermans Bend, Australia, 2001; pp. 1–30. [Google Scholar]
  16. Gebbeken, N.; Ruppert, M. On the Safety and Reliability of High Dynamic Hydrocode Simulations. Int. J. Numer. Methods Eng. 1999, 46, 839–851. [Google Scholar] [CrossRef]
Figure 1. Near-surface burst experiments.
Applsci 10 06166 g001
Figure 2. External tunnel explosion experiments.
Applsci 10 06166 g002
Figure 3. Numerical simulation model.
Applsci 10 06166 g003
Figure 4. Near-surface burst peak side: overpressure vs. scaled distance.
Applsci 10 06166 g004
Figure 5. C4 explosive detonation stages.
Applsci 10 06166 g005
Figure 6. Portal peak side: overpressure vs. scaled distance.
Applsci 10 06166 g006
Figure 7. Internal overpressure vs. L/D.
Applsci 10 06166 g007
Figure 8. Peak overpressure ratio vs. L/D.
Applsci 10 06166 g008
Figure 9. Fluid–structureinteraction for external tunnel explosion process (50gC4).
Applsci 10 06166 g009
Figure 10. Portal blast experiment and numerical simulation vs. scaled distance.
Applsci 10 06166 g010
Table 1. The material parameters of the external tunnel explosion analysis.
Air [13] MAT_NULL, EOS_LINEAR_POLYNOMINAL
ρ C0C1C2C3C4C5C6E0
(g/cm3)(Mbar)
1.29 × 10300000.40.402.5 × 10−6
Explosive [14] MAT_HIGH_EXPLOSIVE, EOS_JWL
ρ DPCJABR1R2 ω E0V0
(g/cm3)(cm/μs)(Mbar)(Mbar)(Mbar)(Mbar)
1.6010.8190.286.0970.12954.51.40.250.091.0
Tunnel [15] MAT_PLASTIC_KINEMATIC
ρ EPRSIGY
(g/cm3)(Mbar)(Mbar)
8.02.030.32.2 × 103
Soil Ground [15] MAT_RIGID
ρ EPR
(g/cm3)(Mbar)
1.82.0 × 10−30.498
Table 2. Coefficient of variation for near-surface burst experiments.
ZPsoStandard DeviationCoefficient of Variation
(m/kg1/3)(kPa)(kPa)(%)
3.2657.975.068.73
2.5992.818.539.19
2.40106.9712.9814.80
2.26113.379.978.96
2.15143.612.531.76
Table 3. Coefficient of variation for portal overpressure.
ZPsoStandard DeviationCoefficient of Variation
(m/kg1/3)(kPa)(kPa)(%)
3.2671.664.255.93
2.59107.848.097.50
2.40117.646.475.50
2.26135.979.126.71
2.15162.047.844.84
Table 4. Overpressure comparison between Pso and Pportal.
ZPsoPportalDifference *1Ratio *2
(m/kg1/3)(kPa)(kPa)
3.2657.9771.66−19.101.24
2.5992.81107.84−13.941.16
2.40106.97117.64−9.071.10
2.26113.37135.97−18.091.22
2.15143.61162.04−11.371.13
*1: (Pso − Pportal)/Pportal × 100. *2: Pportal/Pso.
Table 5. Overpressure comparison between PLS-DYNA and Pportal.
ZPLS-DYNAPportalDifference
(m/kg1/3)(kPa)(kPa)(%)
3.2675.8171.665.79
2.59108.45107.840.57
2.40123.39117.644.89
2.26139.59135.97−0.28
2.15154.48162.04−4.67

