Article

Benchmark Sea Trials on a 6-Meter Boat Powered by Kite

1
French Air Force Academy, CREA, BA 701, F-13661 Salon Air, France
2
HALEHAU, 29200 Brest, France
3
French Sailing Academy, Beg Rohu, 56510 Saint-Pierre-Quiberon, France
4
ENSTA Bretagne, FRE CNRS 3744, IRDL, F-29200 Brest, France
*
Author to whom correspondence should be addressed.
Appl. Sci. 2020, 10(18), 6148; https://doi.org/10.3390/app10186148
Submission received: 1 June 2020 / Revised: 19 July 2020 / Accepted: 26 July 2020 / Published: 4 September 2020
(This article belongs to the Special Issue Ship Energy Systems)

Abstract

:
This paper presents sea trials on a 6-m boat specifically designed for kite propulsion. The kite control was automatic or manual, dynamic or static, depending on the point of sailing. The measurement system recorded boat motion and load generated by the kite. A particular attention was paid to wind measurement with several fixed and mobile locations directly on the kiteboat or in the vicinity. A high resolution weather modelling showed that a classical power law, describing the wind gradient, was not satisfactory to get the wind at kite location. 5-min measurement phases were systematically recorded. In the end, 101 runs were carried out. Data were processed with the phase-averaging method in order to produce reliable and accurate results.

1. Introduction

The interest of the kite in terms of energy production is highlighted by Loyd in 1980 [1]. Over the past decade, kite research has taken off. However, it is essentially focused on electrical power production [2,3,4,5,6,7,8]. To a lesser extent, kites are investigated as an auxiliary propulsion device for merchant ship [9,10,11,12,13,14,15].
There is a fundamental difference between using a kite to generate electricity and using it for ship propulsion. While, in the first case, it is sought to maximise the tether tension, in the second case the aim is to maximise the component of this force in the ship advance direction. Thus, the kite flies always in dynamic mode (crosswind condition) in the case of electricity production, while flight conditions are varied in the case of ship propulsion. Leloup shows that the static flight is optimal under 50° in true wind angle [15]. For less close-hauled points of sail, dynamic mode becomes advantageous. There is a varied optimal figure-8 position and orientation for each wind angle (Figure 1). The cross wind situation is only optimal for the full downwind point of sail.
Although there is a large number of scientific publications on experiments carried out onshore [3,16,17], there is a clear lack of experimental data for ships towed by kite. Of course, there is the invaluable feedback from the Skysails Company, which developed the most convincing industrial propulsion device based on kite [13,18,19,20]. However, the data is incomplete and insufficient to allow the experiment to be replicated. Moreover, Skysails is a commercial enterprise and the authors being all staff members, it is possible that the results presented a biased view of the facts. There is also the Dadd et al. [16] experiment, but it takes place on the ground just like that of Behrel et al. [21]. Therefore, they do not allow the measurement of the interaction between the ship and the kite or the determination of the actual performance without being dependent on the limits of the modelling used (zero-mass, straight and rigid lines, roll and drift neglected etc.). Canale et al. [22,23,24,25] present a study with results on a kite used to propel a ship. Everything about the kite is well documented but the information on the ship is incomplete and the wind is only measured on the boat. In addition, the tests are only made for a single wind direction (135°. Paulig et al. [20] report from the skysails experience that one of the major issues is the overloads caused by the vertical movements of the ship. To better understand this issue it is therefore necessary to model it. Bigi et al. [26,27] proposed a numerical modelling associating the strip theory for the ship motion simulation [28,29] and the zero-mass modelling formulated by Leloup et al. [15] for the kite force and motion simulation. The studies show an interesting lock-in phenomenon between the kite and the ship motions. The numerical tools are partially validated, on the one hand, for the ship motion, with the experiments from the University of Iowa [30,31], on the other hand, for the kite dynamics, with the Behrel onshore experiments [21]. However, the interaction modelling between the kite and the ship requires an experimental database for validation, which is not available until now.
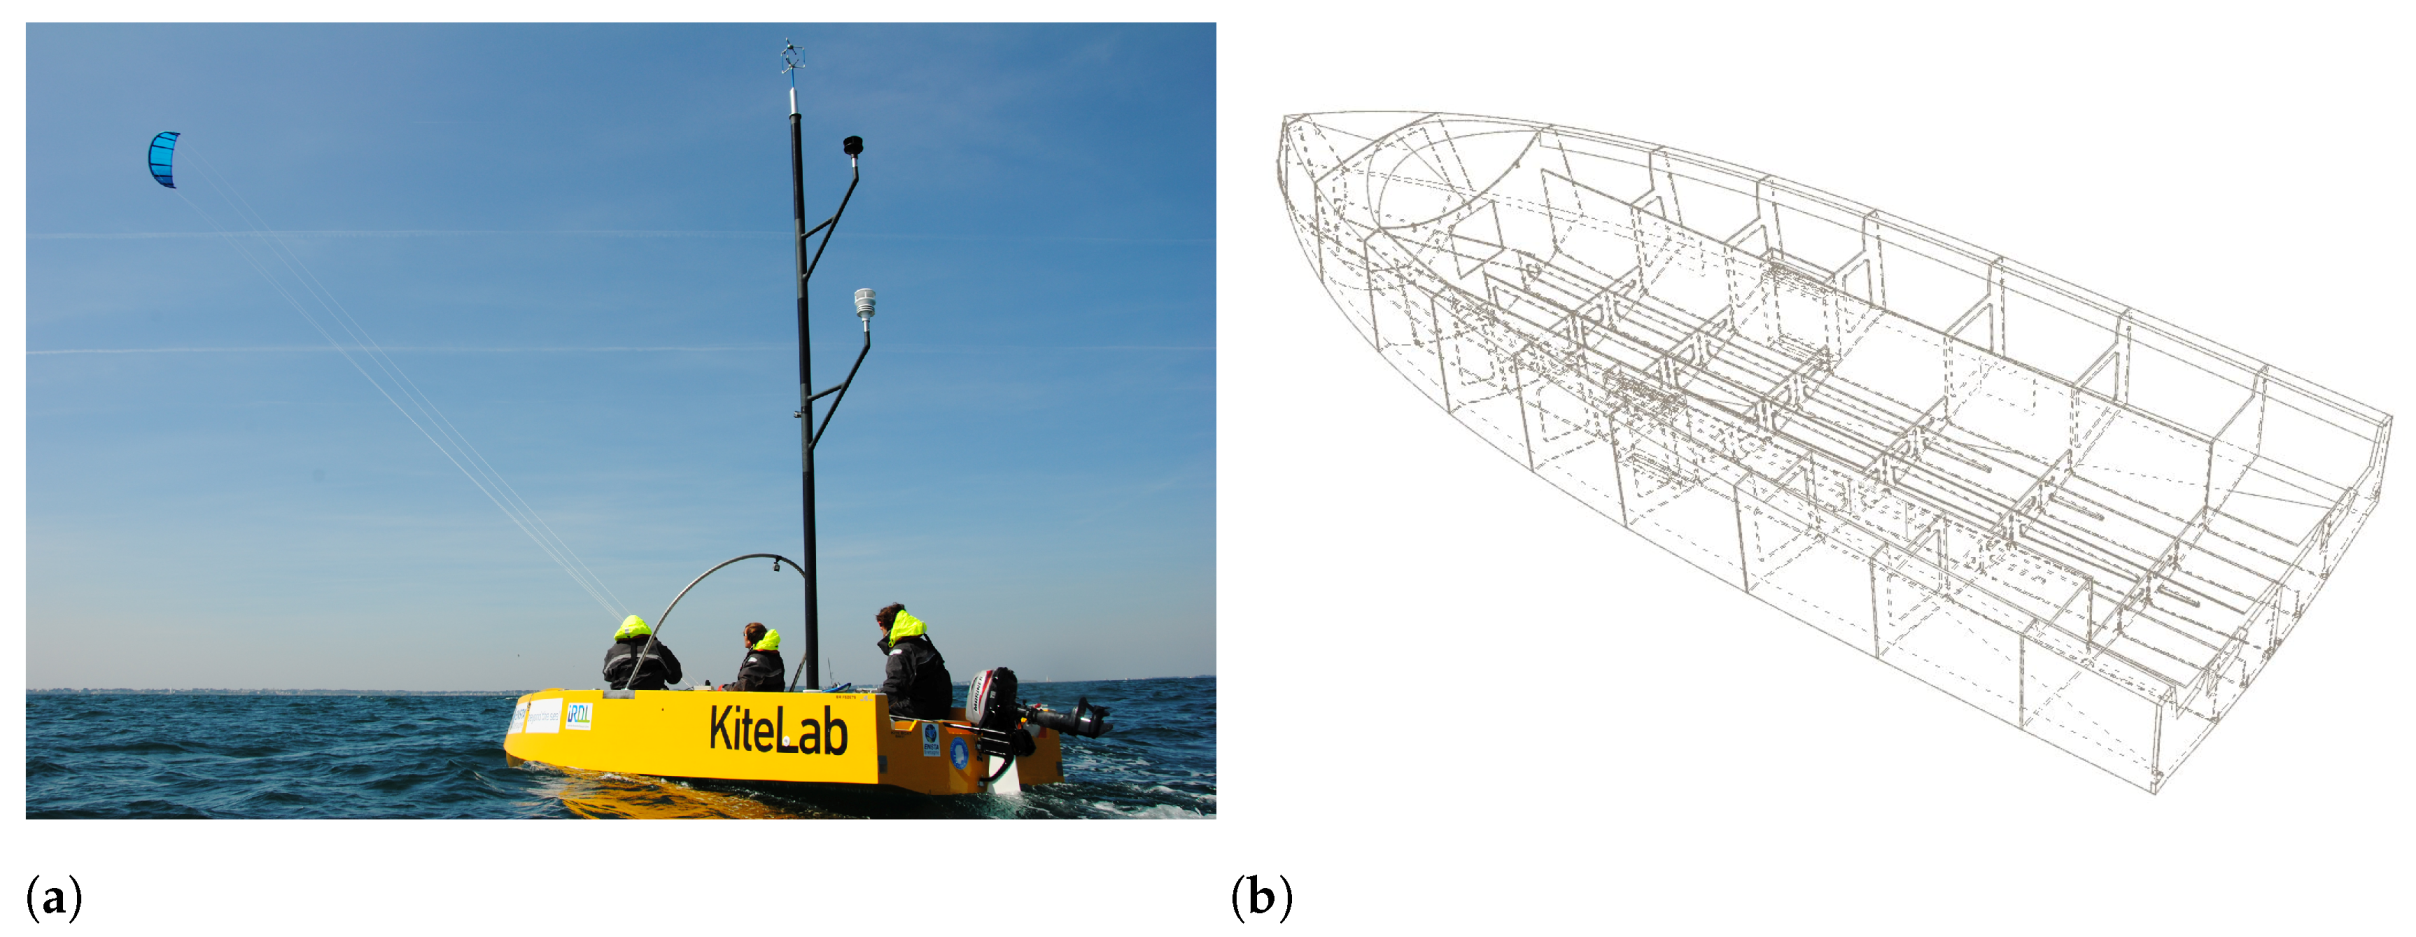
The aim of the present study was to provide a reliable database. An earlier attempt showed the need for an instrumented vessel dedicated to this purpose [32]. A 6-m prototype was designed and built (Figure 2b). An experimental device was deployed to ensure satisfactory assessment of the wind at kite position. The phase-averaging method developed by Behrel et al. [21] was used in order to obtain accurate and reliable results.
Section 2 presents the reference frames used. Section 3 details the measurement systems on the kiteboat and on the sailing area. Then, the methods for post processing the data, like boat motions (phase averaging) or the 3D wind assessment on the entire sailing area, are described. Section 5 shows the first results, which are discussed in a Section 6 before concluding.

2. Reference Frames

The reference frames used in this study are introduced below and detailed with drawings in the following paragraphs. They are in conformity with the International Towing Tank Conference (ITTC) recommendations from the Group [33] and directly compliant with the standard from the International Organization for Standardization ISO 1151-1-4 [34]. They are identified with one or two letters, printed in subscript under the normalized vectors ( x ̲ , y ̲ , z ̲ ) forming the axis system. When the considered reference frame needs to be specified, this one is then printed under parenthesis in superscript above the variable: for example, if the vector A ̲ b is expressed in the reference frame R r e f , it will be denoted as A ̲ b ( r e f ) .

2.1. North East Down (NED) Reference Frame

The earth-fixed reference frame used in this study is the North East Down axis system (Figure 3). It is denoted R n e d . The x-axis points to North, the y-axis points to the East and the z-axis points Down towards the center of the planet. Its origin O is the center point of the sailing area at the still water surface (Figure 4b).

2.2. Heading Reference Frame

The heading reference frame R ψ is based on the heading angle ψ of the ship relatively to the true north direction. It is the result of a rotation about z ̲ n e d of angle ψ applied to frame R n e d , where ψ is the first of the three Euler angles. Its origin O s is located in the center plane of the ship, at mid-ship, and at the Design Water Line (DWL).

2.3. Ship Reference Frame

The ship reference frame is rigidly fixed to the ship, and is the result of the two other rotations from the remaining Euler angles—the pitch θ s and the roll ϕ s . At first, a rotation about y ̲ ψ of an angle θ s is applied, followed by a rotation about x ̲ s of an angle ϕ s . It share its origin O s with the The heading reference frame.

2.4. Onshore Measurement Wind Reference Frame

The onshore measurement wind reference frame R w s is the axis system of the wind measurement device when deployed onshore, and not rigidly fixed to the experimental setup. Here, this the case for the Sonic Detection And Ranging (SODAR) device. Thus, wind measurements are output in this reference frame. This frame is the result of a triple rotation of onshore wind Euler angles ( ψ w s , θ w s , ϕ w s ) applied to the heading reference frame R ψ . Its origin is located at wind measurement point W .

2.5. Relative Wind Reference Frame

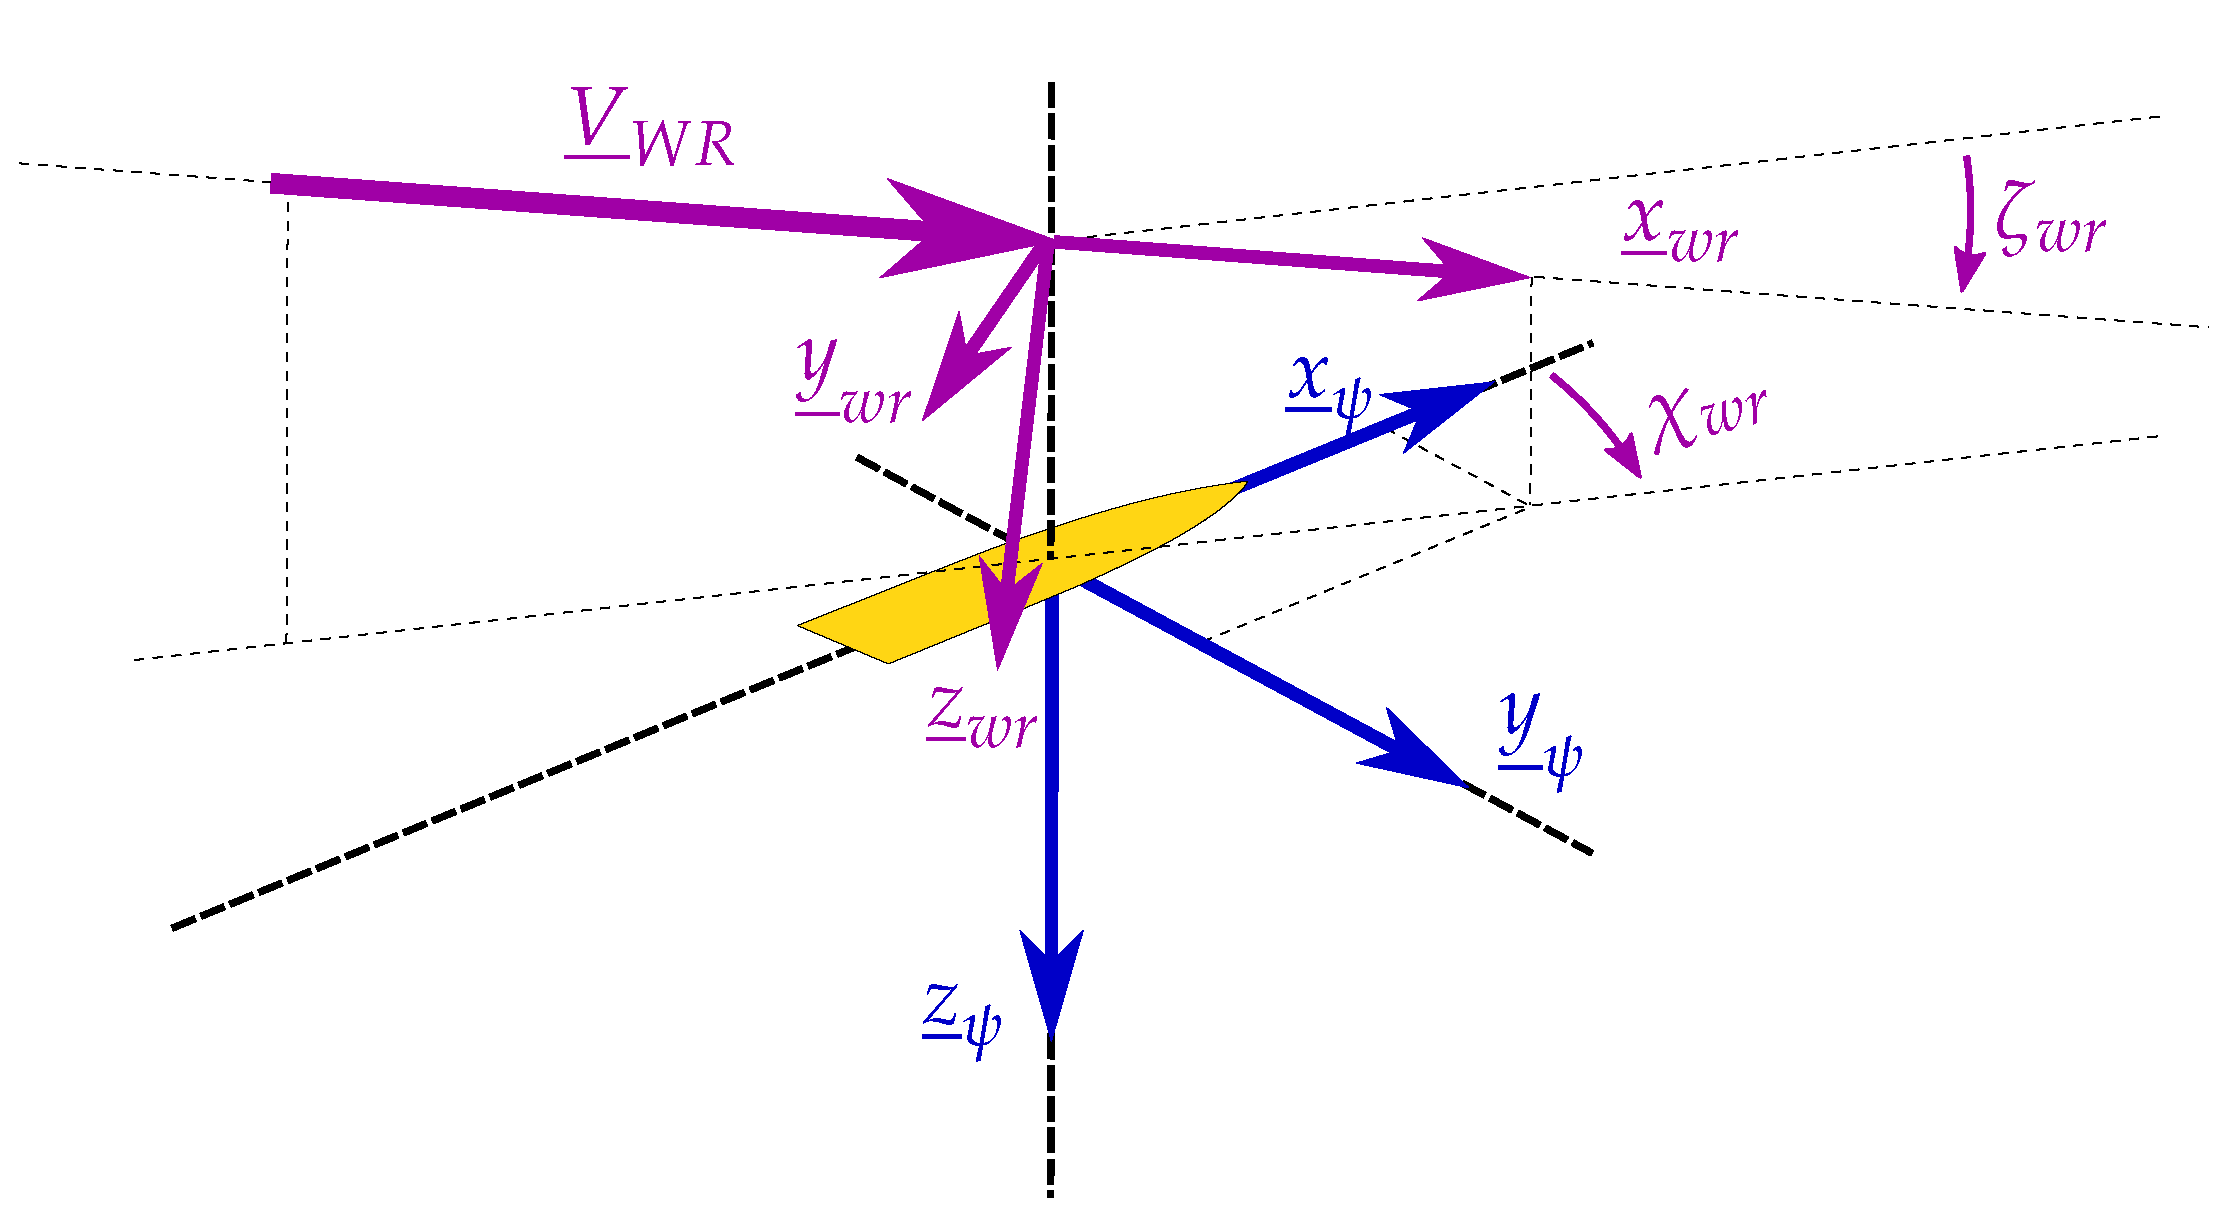
The relative wind reference frame is defined from the heading reference frame. For a known relative wind velocity vector V ̲ W R , The x w r -axis is set co-linear to V ̲ W R (see Figure 5). Thus, the R w r reference frame is the result of a first rotation about z ̲ ψ of an angle χ w r , followed by a second one about y ̲ w r of an angle ζ w r . Therefore, χ w r and ζ w r angles are the two first Euler angles and the transfer matrices M ̲ ̲ χ W R and M ̲ ̲ ζ W R can also be defined. The relative wind angle β W R , generally used by sailors as in this study, is related to the angle χ w r with the following formula:
β W R = χ w r + π

2.6. Aerodynamic Reference Frame

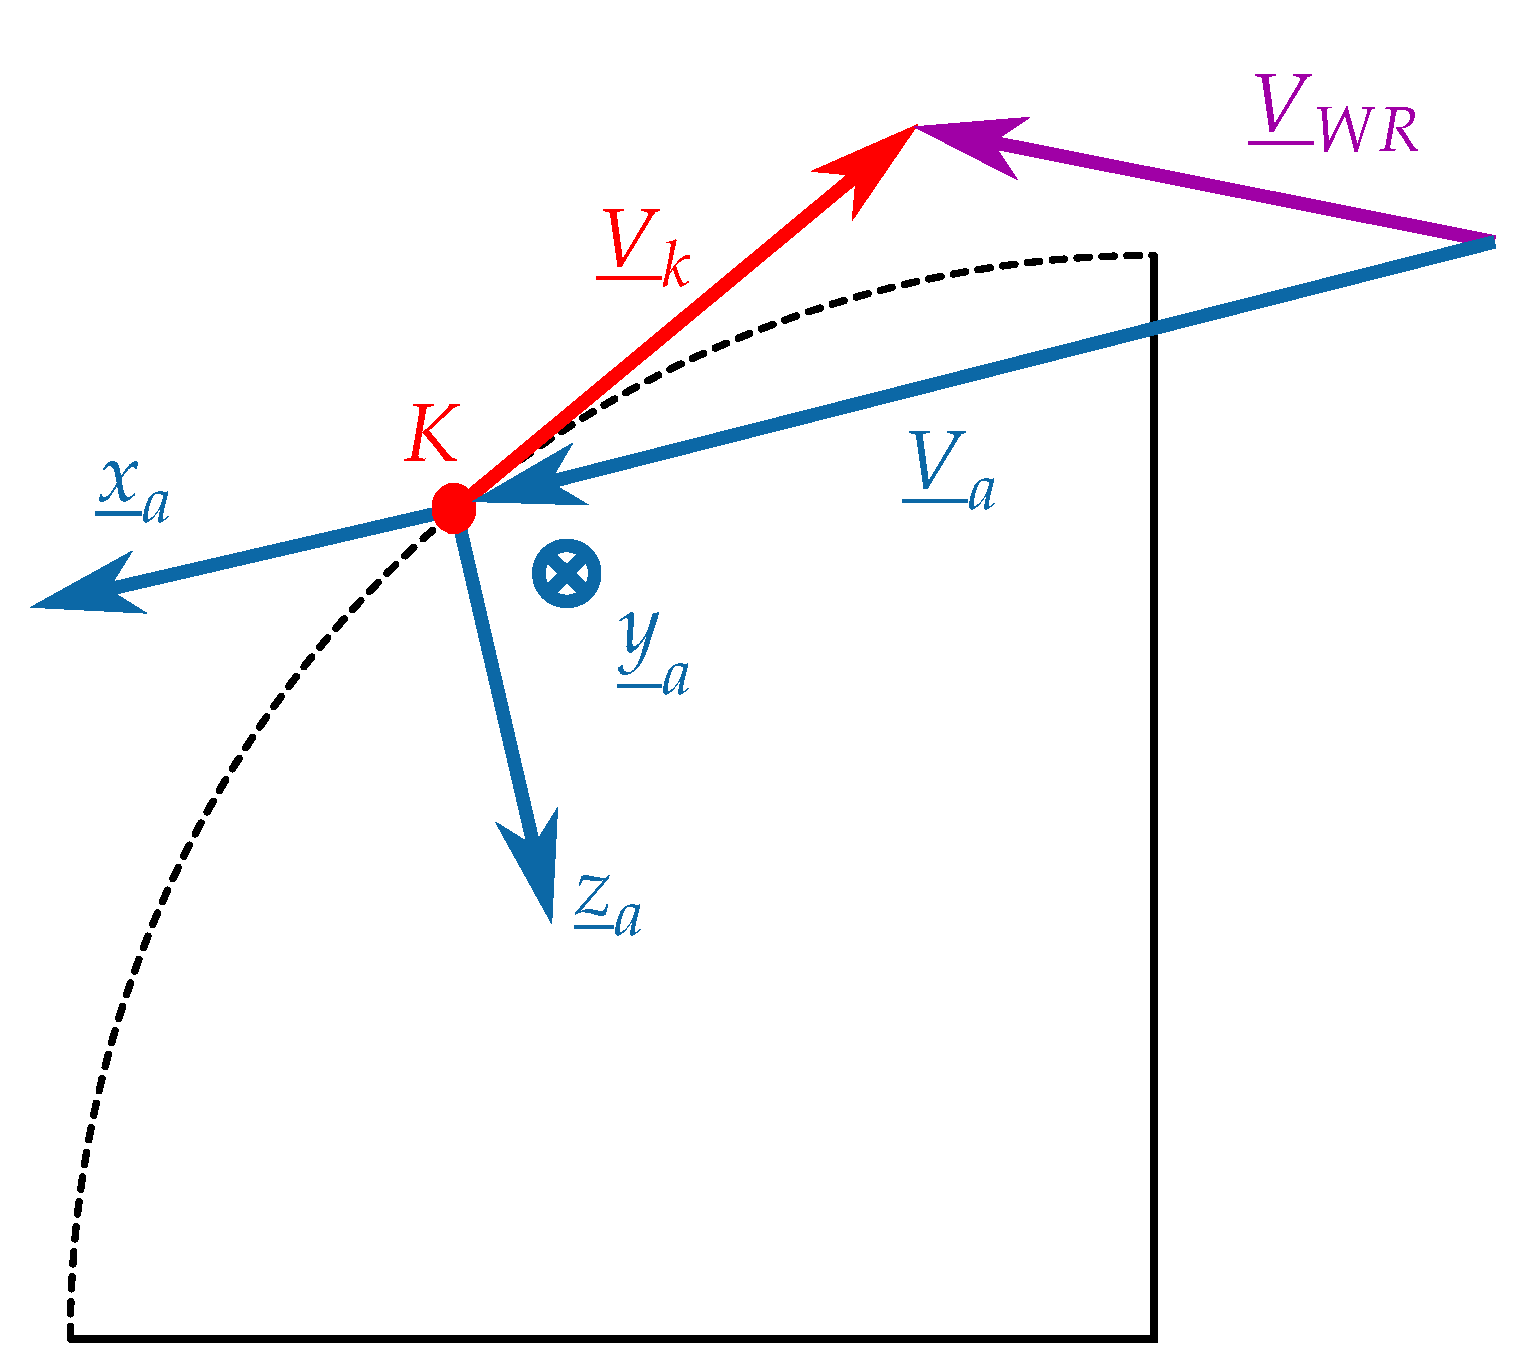
Similarly to the relative wind reference frame, the aerodynamic reference frame R a is defined from the apparent wind velocity on the kite, as shown in Figure 6, with the x a -axis co-linear to V ̲ a and pointing in the same direction. The y a -axis is orthogonal to the plane formed by the vectors V ̲ a and V ̲ k , and the z a -axis is completing the axis system, pointing down. Kite tethers and kite attachment point are not necessarily contained in this plane. The y a -axis orientation is selected to obtain a direct reference frame. K is the center of the aerodynamic frame.

2.7. Kite Position

Within this study, only kite seen as a point is considered, with no rigid body motion. This means that only the position of the kite K is considered while its attitude is not measured. Therefore, three variables only are requested to position the kite. Because the kite is nearly flying on a sphere, spherical coordinates ( r , θ , ϕ ) are particularly suitable. However, cartesian coordinates ( P x , P y , P z ) are sometimes necessary.

3. Experimental Set-Up

3.1. Kiteboat Specific Sensors

Most of the components were already integrated in the kite control box (see Reference [21]) and in the two associated waterproof boxes. However, a few sensors had to be fixed directly on the kiteboat as pictured in Figure 7. On-board anemometers will be presented in Section 3.2.

3.1.1. GPS and IMU

An Inertial Motion Unit (IMU) combined with a dual antenna GPS receiver provided boat orientations and velocities. This sensor was a VectorNav VN-300 Rugged. In addition to provide boat position and velocity, the dual antenna GPS receiver gave also an accurate heading measurement apart from any magnetic interference.

3.1.2. Rudder Angle

The rudder angle was measured using a rotary potentiometer integrated into the steering system. Calibrations were carried out at the laboratory and zero balance was done and checked several times a day.

3.2. Wind Measurements

Wind measurement is one of the most important aspects for computing post-processing. However, getting a good estimate of the wind speed on the kite is challenging, especially on a moving platform and when measurements are done at sea.

3.2.1. Kiteboat Sytems

To get the wind over the kiteboat, three ultrasonic anemometers were fixed on the mast at three different altitudes. The three sonic anemometers were manufactured by Gill, but were from different models. The higher one was fixed on the head of the mast with a measurement altitude of 5.5 m above the sea level. It was a WindMaster, a three dimensional sonic anemometer with a data flow rate of 20 Hz. The second one was a 2D anemometer WindSonic placed at 4.2 m above the sea level and deported from the mast by 0.6 m, with a data flow rate of 4 Hz. The last anemometer was a MaxiMet 500 (3.0 m above sea level, frequency 1 Hz). A picture of the wind measurement mast mounted on the kiteboat is given in Figure 2a.

3.2.2. Bay of Quiberon Wind Measurement Systems

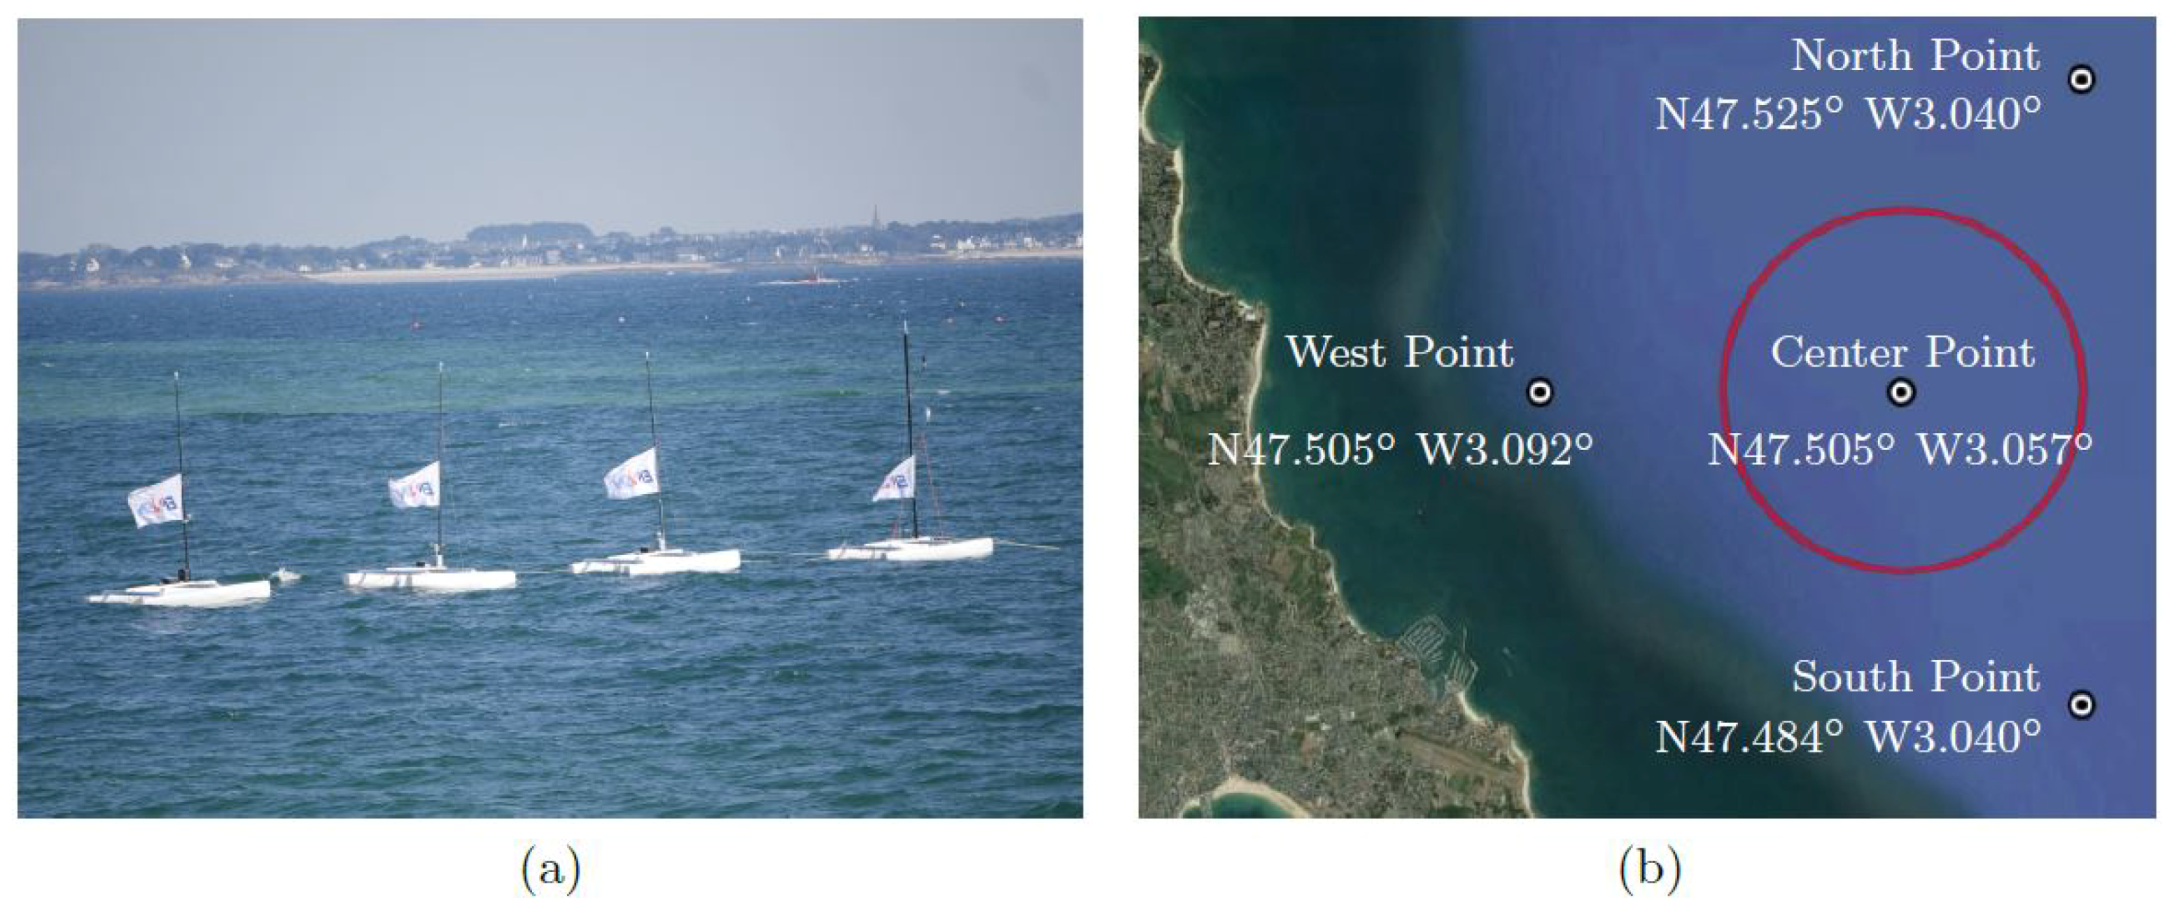
To ensure an even more accurate estimate of wind at kite position, a set of fixed measurement points was deployed in the bay of Quiberon, inspired from previous work [14,35]. The system was based on 3 catamarans KL15, fitted with a five-meter mast and a 2D ultrasonic anemometer at the top. The sensor is a CV3F by LCJ Capteurs. A compass provided the heading of the platform. The GPS provided position and absolute time, and it was used to synchronize data with the kiteboat acquisition system. Platforms location are given in Figure 4b. A fourth catamaran KL15 was moored at the center of the inscribed circle of the triangle formed by the three other catamarans. This one was fitted with the same wind measurement mast as the one mounted on the kiteboat and presented in the previous paragraph.

3.2.3. Sailing Area

The chosen site for fieldwork was Quiberon Bay (South Brittany, France). Experiments were carried out in the area covered by the fixed-point wind sensors, shown in Figure 4. This sailing area has the advantage of being quite well documented in the literature [14,35,36]. Moreover, Quiberon bay is surrounded by several wind sensors belonging to the Wind Morbihan network (http://windmorbihan.com/).

3.3. Design of Experiments

A set of parameters were varied during the fieldwork from one run to another. The inputs of the experience matrix are described in the following paragraphs.

3.3.1. Kite

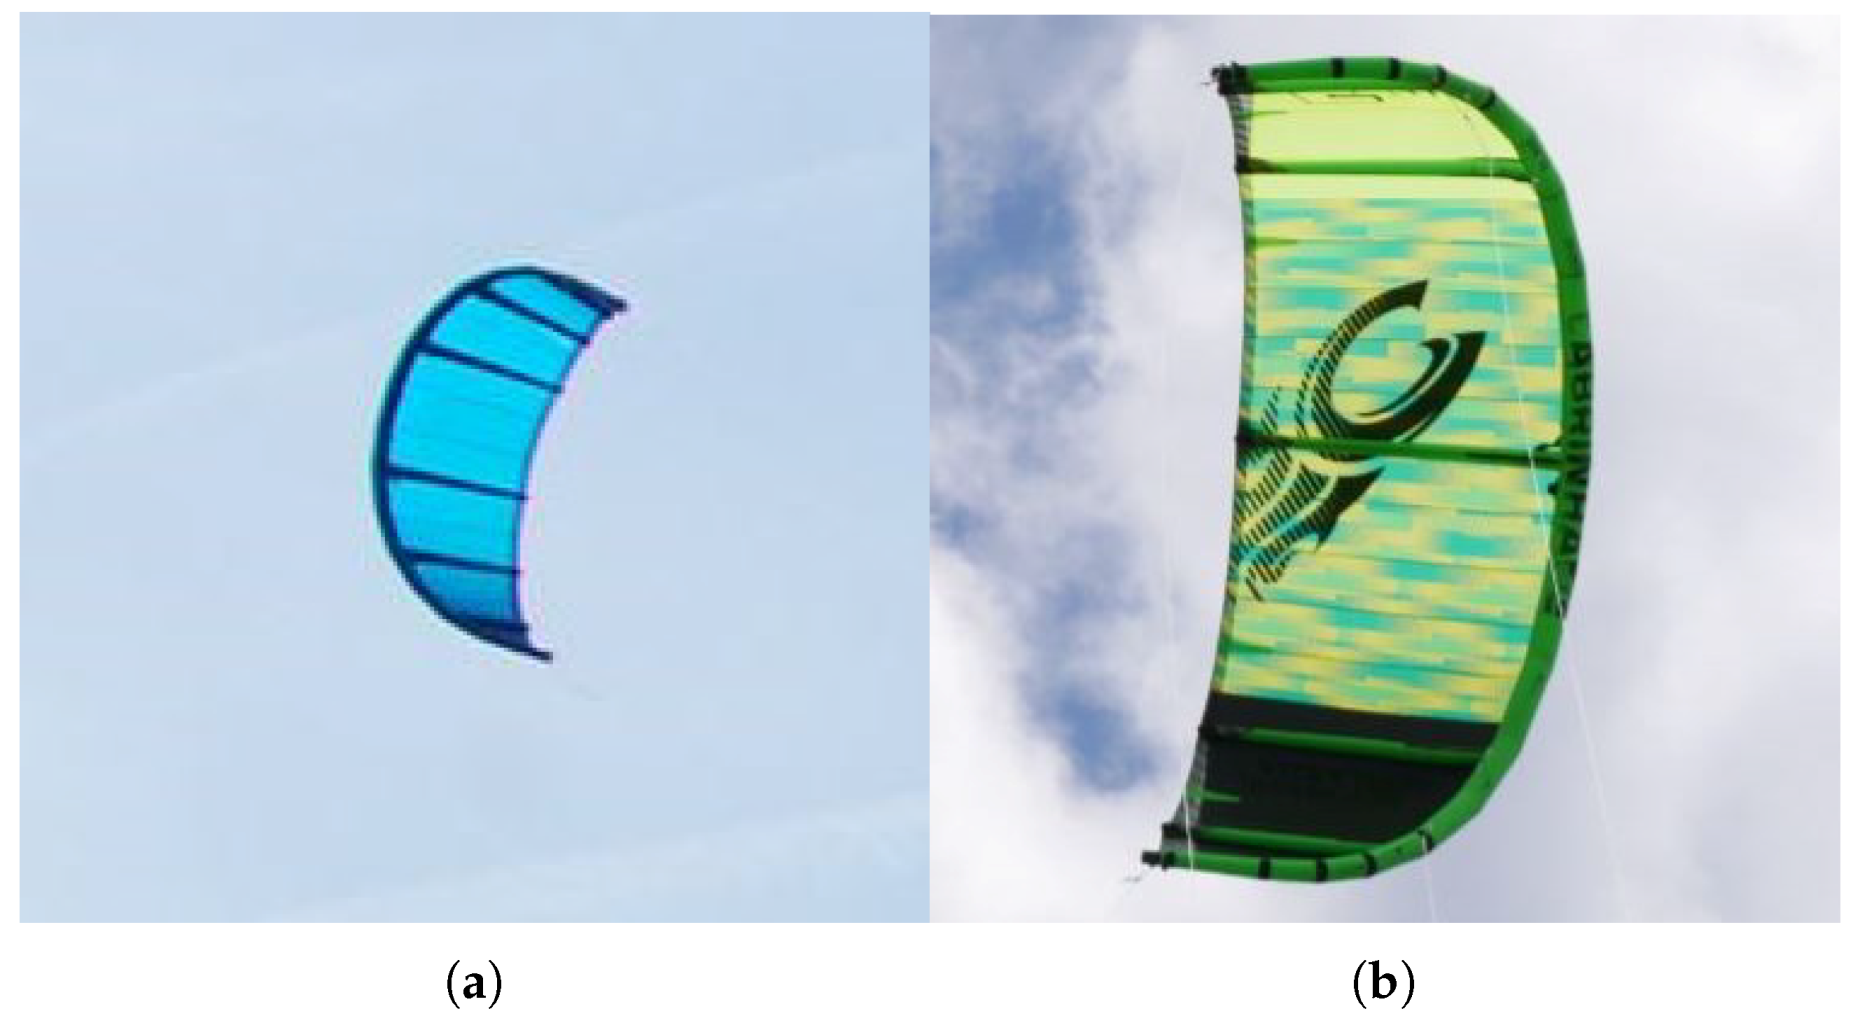
Three different kites were used: two Cabrinha ® Switch blade (2016 model) kites with an area of 5 and 12 m 2 , and a third one built especially for the kiteboat by the beyond-the-sea ® company. This kite had an area of 5 m 2 , but it was delivered only on the last two days of the sea trials. The major difference with the two Cabrinha ® kites was that it was designed to stand wingload (or Safe Working Load [20]) up to 100 kg/m 2 . As a comparison, Behrel et al. [21] show that wings designed for Kite-surf such as the two Cabrinha ® Switchblade only withstand Safe Working Load (SWL) up to 20 to 30 kg/m 2 . Both kite types are shown in Figure 8.

3.3.2. Daggerboards

Two set of daggerboards were used. The first one was the set initially designed for the kiteboat. These appendages were named Standard daggerboards, shorten with the letters STD when necessary. The daggerboards of the second set were are named Black daggerboards, shorten with the three letters BCK when necessary. Their surface area were twice that of the standard set (from 0.683 m 2 to 1.265 m 2 in wetted projected area each). The main differences were the span and, to a lesser extent, the chord law. The thickness law and profiles were quite identical.

3.3.3. True Wind Angle

Numerous true wind angles were tested, from upwind sailing with true wind angles about 60°, to full downwind (180°). The objective was to cover a wide range of true wind angle with an increment of 20°.

3.3.4. True Wind Speed

The magnitude of the wind is obviously a parameter that cannot be ruled. Consequently, runs were done whatever the wind magnitude was, and they were then sorted to group together runs with similar wind magnitude.

3.3.5. Tether Lengths

The same two sets of tethers as those used in Reference [21] were considered, with lengths of 50 m and 80 m.

3.3.6. Kite Flight

For low true wind angles (lower than 80°), only static flight could be achieved. For medium true wind angles (between 80° and 100°), the dynamic flight was possible, but not with the automatic pilot. Indeed, in this case, the kite needs to fly close to the wind window edge and the current autopilot was not able to deal efficiently with this type of situation. Thus, one of the crew member manually controlled the kite with the joysticks. For larger true wind angle, from 100° to 180°, the autopilot presented in Reference [21] based on the work by Fagiano et al. [37] controlled the kite. Autopilot settings were changed as little as possible from one run to another. However, it was sometimes necessary to adjust some settings to ensure a regular flight. Moreover, these settings resulted from manual choices, based on empirical experiences.

3.3.7. Kite Attachment Point

Four longitudinal locations of the kite attachment point were at first defined. They were equally distributed along the boat cockpit. However, it soon became clear that the extreme positions initially foresaw were practically inoperable due to maneuverability issues. Eventually, a single position was used most of the time, with a kite attachment point located at 2.68 m forward the transom. This position was named “C2bis”. A second position, named “C1bis”, was tried for few runs at 2.48 m forward the transom. The position of the crew members and additional waterproof boxes were then adapted to maintain the center of gravity at the same position at all time.

3.3.8. Propulsion

Some of the runs were done with the outboard engine working. This allowed upwind runs not always achievable with the kite alone, especially in light wing condition with the small kite areas. It also allowed to consider the effect of kites on a motor boat, which is the end purpose of the Beyond the sea ® project.

3.4. Available Data

3.4.1. Kiteboat Data

For each runs with kite, many data were recorded. An overview of the most relevant ones is given in Table 1.

3.4.2. Wind Data

A partnership was engaged with the company EXWEXs, which specializes in weather forecast and weather modelling. The objective was to get a fine modelling of the wind over the sailing area. Details on the modelling with the associated physic and outputs are given in Reference [38]. The Weather Research and Forecasting (WRF) model [39] was implemented. The modelling strategy for such a forecast was to nest several spatial domains centered on the area of interest, from the largest to the smallest with, at the end, an expected resolution of 110 m on the sailing area. The time step of the finest domain was set to 0.72 s. Because a real time forecast was not necessary, initial conditions and boundary conditions were taken from reanalysed data coming from the National Center for Atmospheric Research (USA). The five domains, with their topography, are plotted in Figure 9, and Table 2 illustrates induced resolutions and corresponding locations. It shows a constant vertical resolution of 20 m between the layers at a constant altitude of up to 300 m.
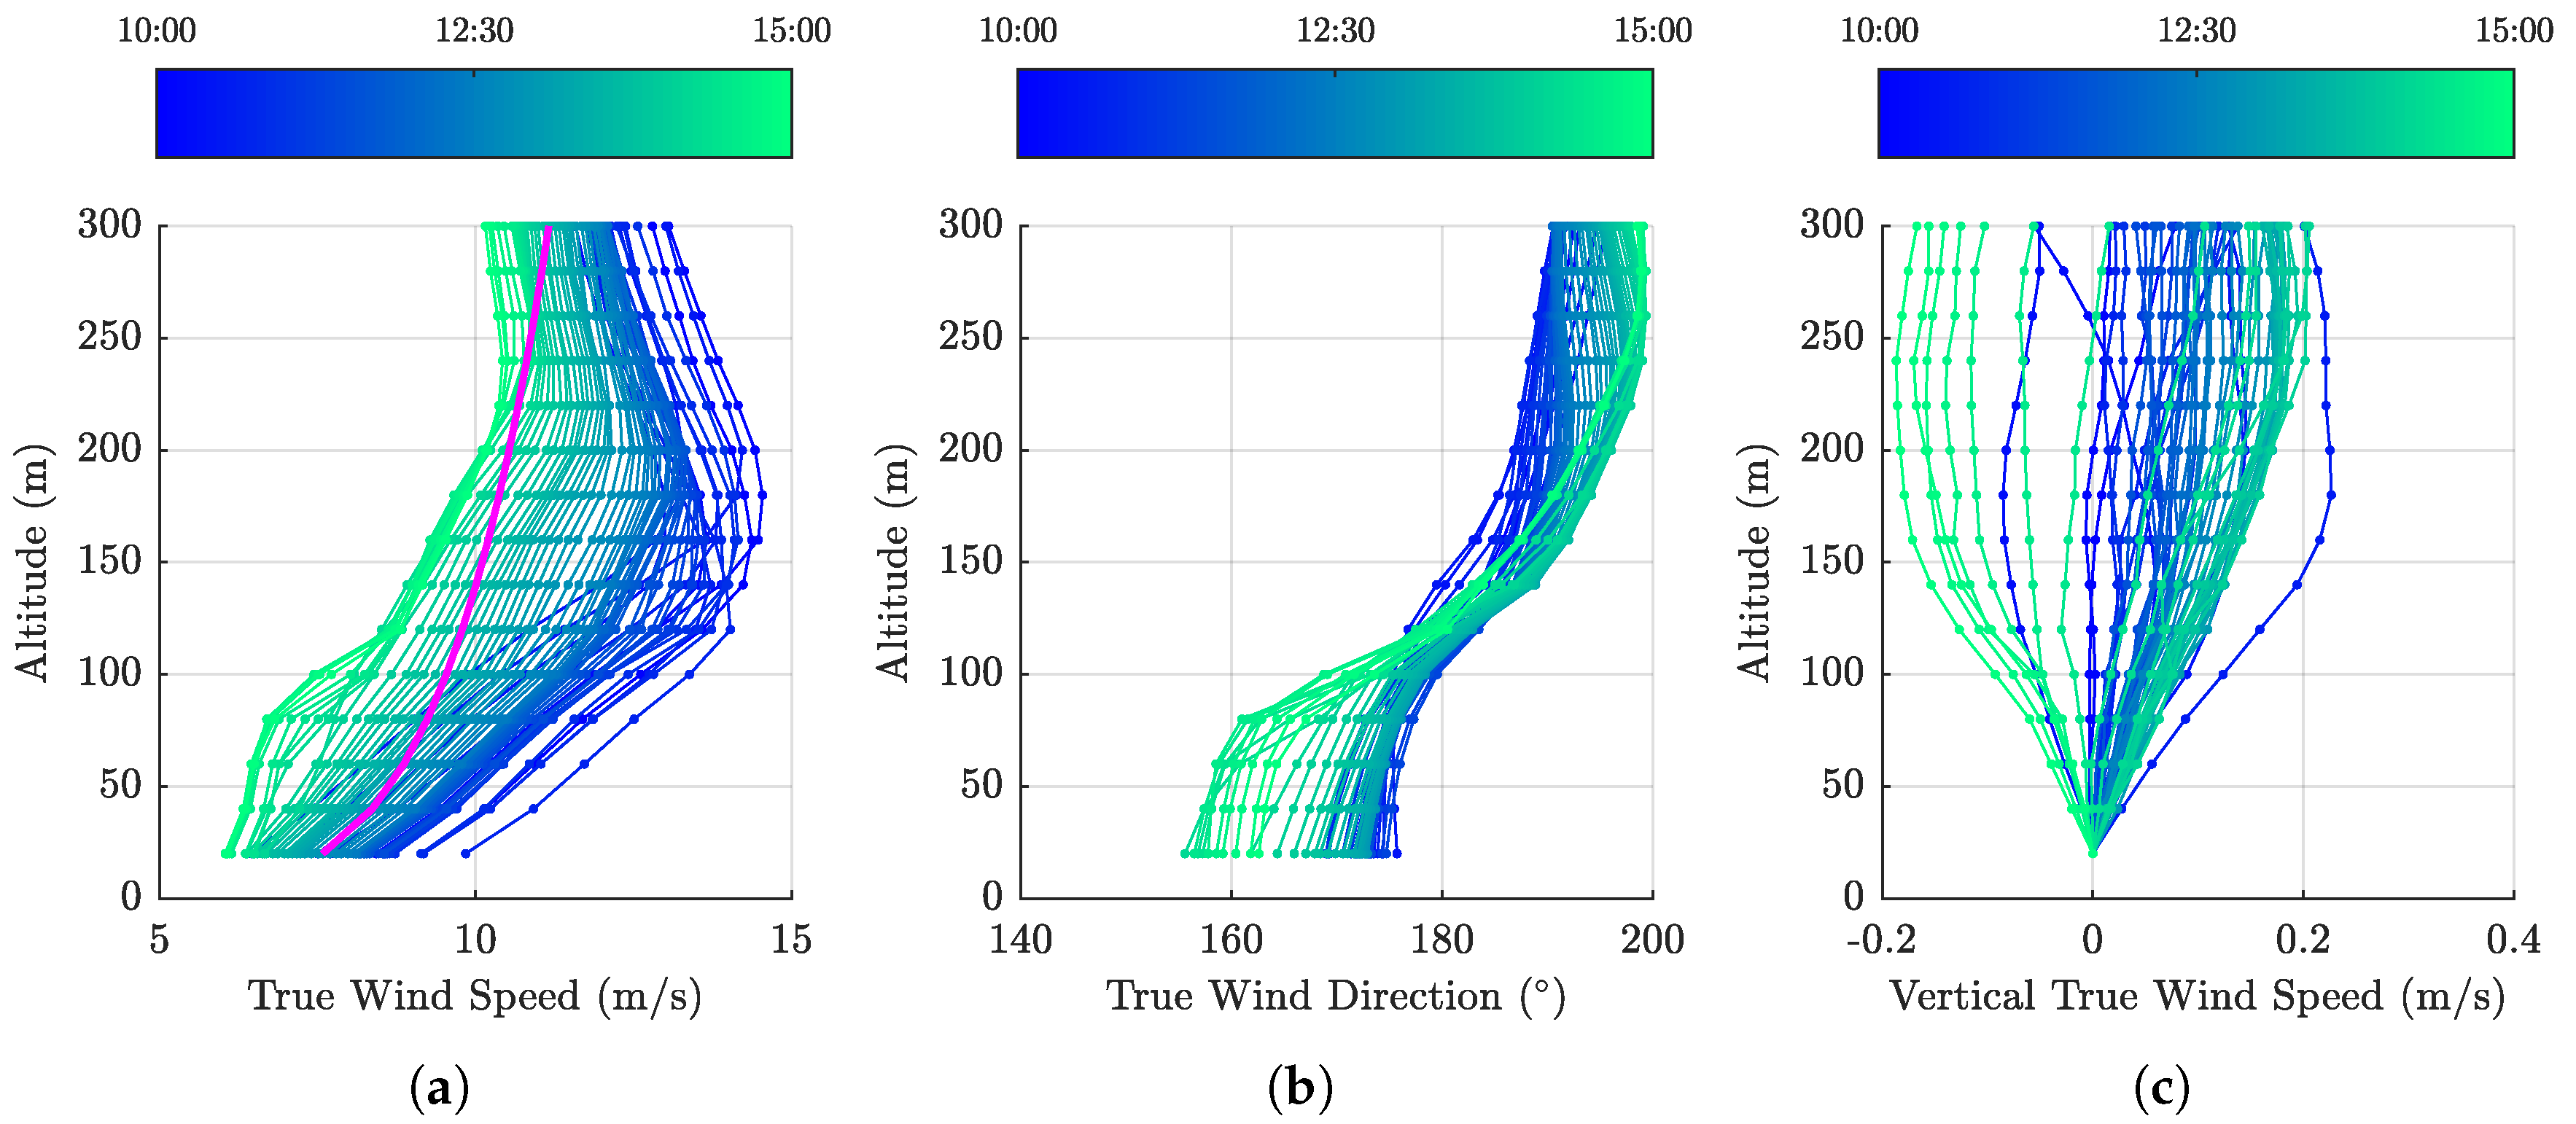
The outputs of the modelling are weather data along the altitude (from 20 m to 300 m) for 222 points of the grid spread over the sailing area and for each time step. The most interesting data, in our case, are the three components of the wind velocity, the temperature and the pressure. The results of a few hours of modelling outputted at the location of the center measurement platform are given in Figure 10.

4. Post Processing

The post-processing of the kiteboat data is very close from that presented in [21]. Vectors are still expressed into the heading reference frame R ψ , unless otherwise noted. Velocities are given with respect to the Earth, unless otherwise noted.

4.1. Boat Related Equations

The velocity of the ship V ̲ s is defined as the velocity of a point O s , with respect to the Earth. The velocity of the ship (i.e., Course Over Ground)), can be obtained from the velocity of the point U (coming from the measurements of the IMU):
V ̲ s = V ̲ U + O s U ̲ Ω ̲ s .
The rotation speed vector of the boat Ω ̲ s ( s ) expressed in the ship reference frame R s is directly the measurement of the turn rates ( p , q , r ) provided by the IMU. Thus Ω ̲ s expressed in R ψ can be obtain using the transfer matrices:
Ω ̲ s = ( M ̲ ̲ θ s M ̲ ̲ ϕ s ) Ω ̲ s ( s ) .

4.2. Equations Related to Wind Data from Onboard Sensors

This part deals with the wind measurements carried out directly on the kiteboat. The onboard wind measurements are firstly computed in the heading reference frame, going at first from the sensor reference frame R w m to the ship reference frame R s , and secondly to the heading reference frame R ψ :
V ̲ W M = ( M ̲ ̲ θ s M ̲ ̲ ϕ s ) ( M ̲ ̲ ψ w M ̲ ̲ θ w M ̲ ̲ ϕ w ) V W M ( w m ) .
Then, the relative wind velocity at the altitude of the measurement point z 0 can be computed, taking into account velocity of wind sensor with respect to the point O s belonging to the boat:
V ̲ W R , z 0 = V ̲ W M V ̲ W / O s = V ̲ W M + O s W ̲ Ω ̲ s .
From there, the true wind speed at the measurement point can be calculated:
V ̲ W T , z 0 = V ̲ W R , z 0 + V ̲ s .
The estimation of the wind at any other altitude will be discussed in another section. The relative wind on the kite can be obtain by subtracting the velocity of the kite attachment point V ̲ A to the true wind speed on the kite (tethers are considered as perfectly straight, therefore the translations motions of the kite attachment are entirely transmitted to the kite):
V ̲ A = V ̲ s + A O s ̲ Ω ̲ s
V ̲ W R = V ̲ W T V ̲ A .

4.3. Kite Related Equations

At first, forces into front tether are computed in the heading reference frame instead of the frame of the boat:
F ̲ f = M ̲ ̲ θ s M ̲ ̲ ϕ s F ̲ m ( s ) .
Then, back tether forces are added to front tether vector, to create the total kite force F ̲ k at kite attachment point A on the boat:
F ̲ k , A = F ̲ f F ̲ f ( F ̲ f + F b l + F b r ) .
With the hypothesis of perfectly straight tethers with constant length, the total kite force vector at attachment point on the boat equals the opposite of the force generated by the kite at the kite position:
F ̲ k = F ̲ k , A .
With the same assumption, the kite position P ̲ k and the kite velocity V ̲ k can also be computed with respect to the point A (kite attachment point):
P ̲ k = F ̲ f F ̲ f L t .
V ̲ k = d P ̲ k d t
With the zero-mass assumption, the aerodynamic force F ̲ a generated by the kite is directly equal to the opposite of the force generated by the kite:
F ̲ a = F ̲ k .
Knowing the relative wind vector at the altitude of the kite and the kite velocity, the apparent wind on the kite V ̲ a can be computed:
V ̲ a = V ̲ W R V ̲ k .
This apparent wind vector allows us to define the aerodynamic reference frame R a , and is detailed in Section 2.6. The drag vector D ̲ can be obtained by projecting the aerodynamic force F ̲ a on x ̲ a , and the lift vector L ̲ is then the difference between F ̲ a and D ̲ :
D ̲ = ( F ̲ a · x ̲ a ) x ̲ a ,
L ̲ = F ̲ a D ̲ .
The lift to drag ratio f is then obtained by computing the ratio of the norm of the lift and drag vector:
f = L D = L ̲ D ̲ .
Finally the lift coefficient C l is also obtained, with A k the kite area, and ρ the density of the air.
C l = L ̲ 1 2 ρ A k V a 2 .

4.4. Wind Estimation on the Kite

The present section focuses on the different methods used to estimate the wind on the kite.

4.4.1. Power Law

The wind profile is fitted by a power-law of exponent 1/7 [33]. The limits of such a method have already been pointed out [21]. The difference between the weather modelling and the power law is shown in Figure 10a.

4.4.2. Profiler Data

The SODAR used during the onshore work presented in Reference [21] was also used during this work, but with a different purpose. Indeed, the SODAR was installed onshore in the ENVSN facilities, and was there to get data in order to feed the weather modelling (introduced in Section 3.4). Therefore, the settings were quite different from those used previously, leading to an altitude range of measurement going from 30 m to 600 m. The distance between the SODAR and the center of the sailing area was 2.5 NM.

4.4.3. Solution Based on the Profiles from the Weather Modelling

The first considered solution was to use the weather modelling in order to get a wind magnitude profile above the kiteboat, and then to scale this profile with measurements carried out on the kiteboat. In this case, no twist of the True Wind Direction (TWD) along the altitude was assessed. The true wind direction was calculated with the data coming from the on-board sensors (anemometer for wind and GPS-IMU for boat velocity). However, the altitude of the on-board measurement of the wind and the altitude of the lowest point outputted by the modelling were not identical. Therefore, a wind estimate at the measurement point was linearly interpolated in time and space from the modelling data. A scale factor could then be calculated by dividing the measured value by the extrapolated one:
V W T , z = V W T , m o d , z V W T , k b , z 0 V W T , e x t r a p , z 0 S c a l e F a c t o r .

4.4.4. Solution Based only on the Data from the Weather Modelling

This last option consisted of directly interpolating the wind profile in the data provided by the modelling, without taking measurements into account.

5. Results

5.1. Overview of the Achievements

The fieldwork was carried out during a four-week period, with 10 days with useful measurements (which was the initial target). This led to 101 runs with a kite in the sailing area. If we add the other specific runs like seakeeping or manoeuvrability tests, this ultimately corresponds to more than 9 h and 40 min of relevant recordings. This required more than 80 h on the water taking into account all steps of the trials. A presentation video is available on YouTube (https://www.youtube.com/watch?v=Zgd8KkaCavg).
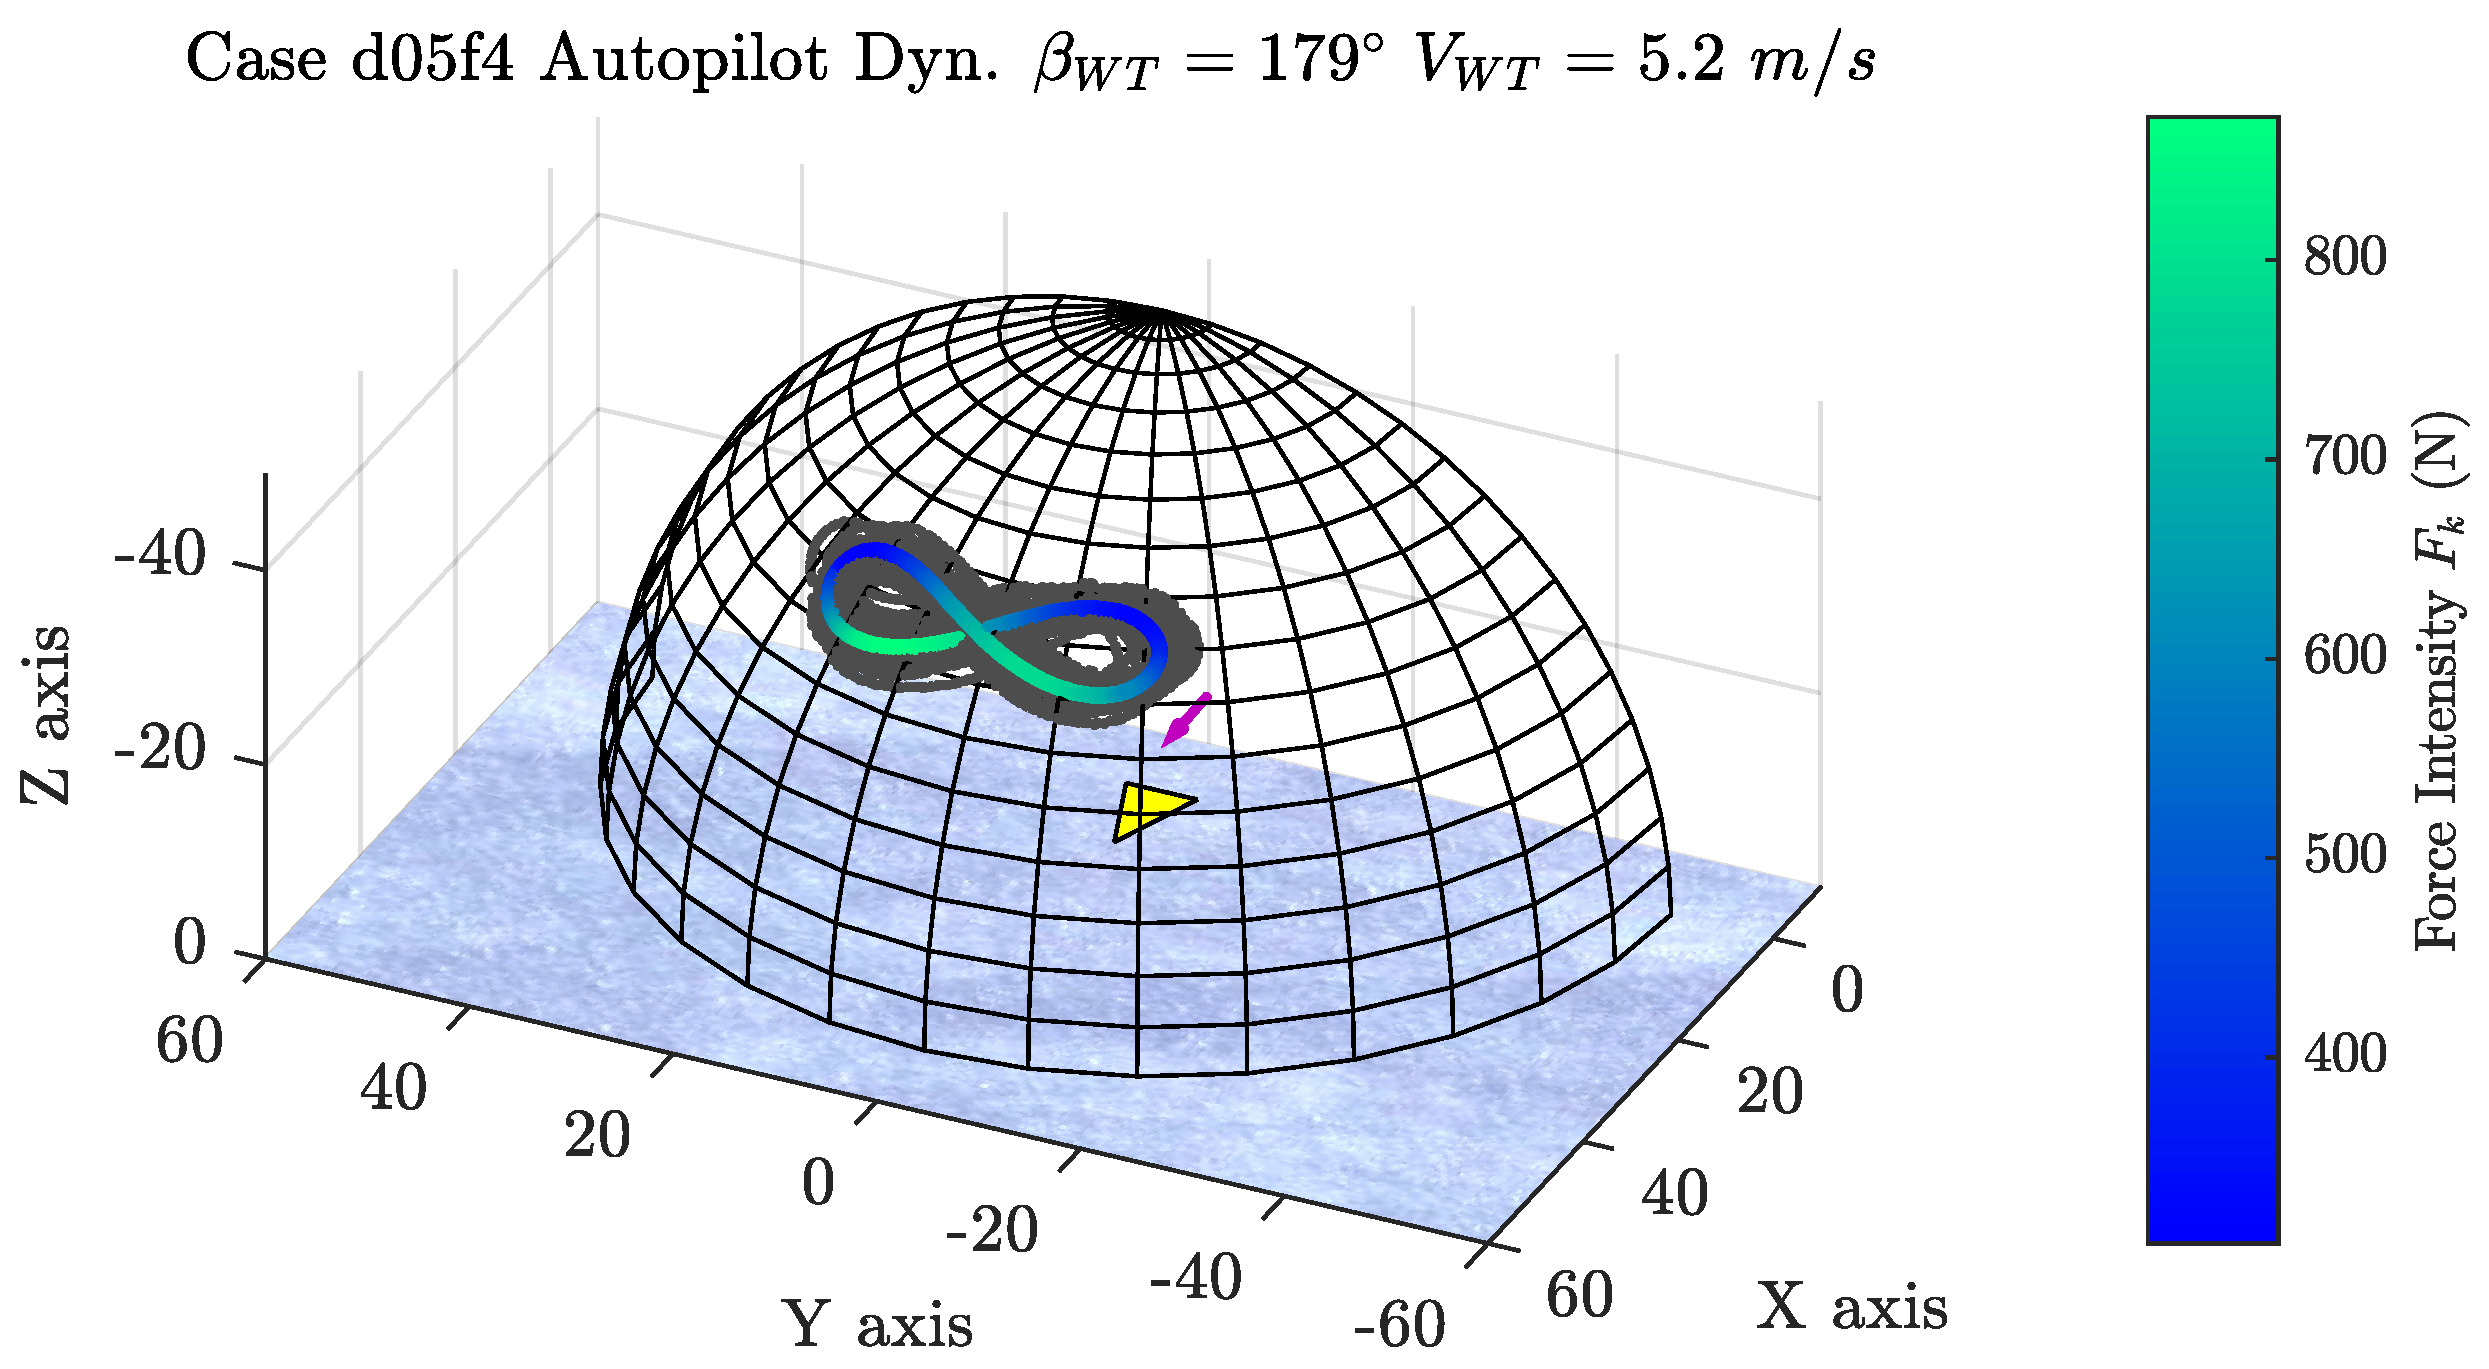
This section aims to point out some relevant elements regarding the global objective of the project. A representative case among the various trajectories achieved by the kite during the the 101 runs, is given in Figure 11. The plot shows the trajectory of the kite, steered by the autopilot, flying in dynamic mode. This case was possible only for downwind and reaching conditions (true wind angles not smaller than 100°, see Section 3.3). Keep in mind that autopilot gave much better reproducibility than manual steering. Which made it possible to apply the phase averaging method with increased accuracy on the results, as presented in Section 5.4.

5.2. Benchmark of Redundant Wind Data

With the large number of sensors deployed for this work and presented in Section 3, some data were redundant. This enabled the comparison of the sensors with each other to check their accuracy and possibly identify defective ones. In the present paragraph focus was placed on the on-board anemometers. Three anemometers were mounted on a dedicated mast, at three different heights (details in Section 3.2). Data coming from these three devices were compared. An example of this work is given in Figure 12a. The correlation of the direction data (left plot) is very good. The plot of the true wind speed (right plot) shows that the uppers sensors measure stronger winds. This is consistent with boundary layer theory. Indeed, in part (b) of the same figure, the average values of run for each sensors is plotted with respect to the altitude of measurement. They are compared with the power law profile calculated from the highest measurement. In regard to these satisfactory agreements, the wind measured by the highest sensor (WindMaster) was used when only one point of measurement was deemed sufficient (i.e., most of the time in the present study). This sensor being located at the top of the mast, no risk of blanketing effect was to fear. Moreover, this sensor had a better output rate and it measured the wind vertical component.

5.3. Average Data

For each of the 101 runs, data were averaged. This allowed to globally analyse the effects of parameters on the kiteboat performances and its behaviour. Results are summarized in a two-page Table in Appendix A.
To keep notations as simple as possible, in this section and related figures and tables, the fact that all data are averaged is implied.

5.3.1. Roll and Pitch Offset Compensation

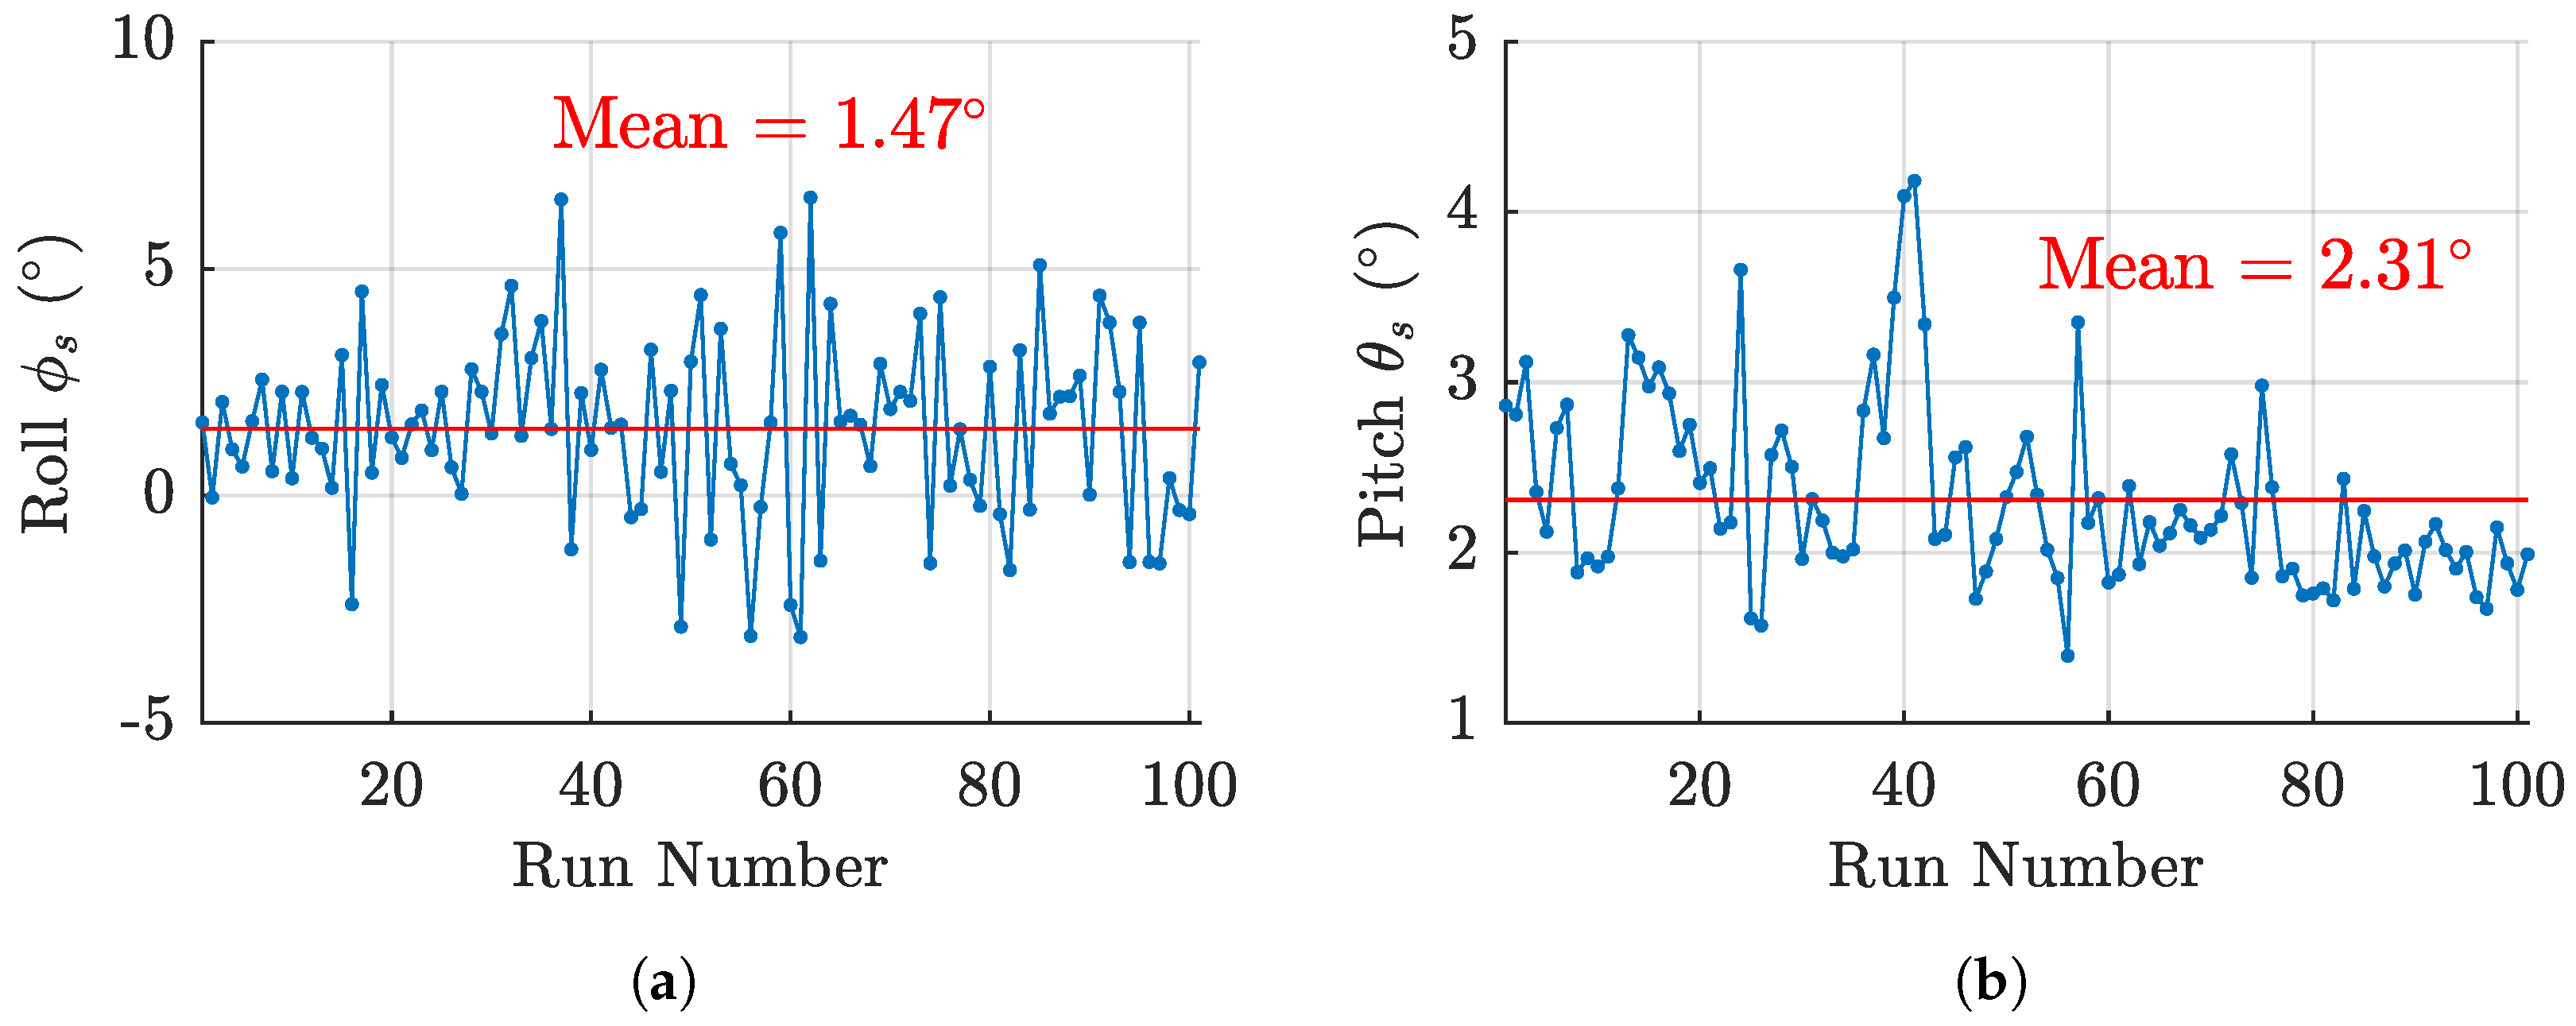
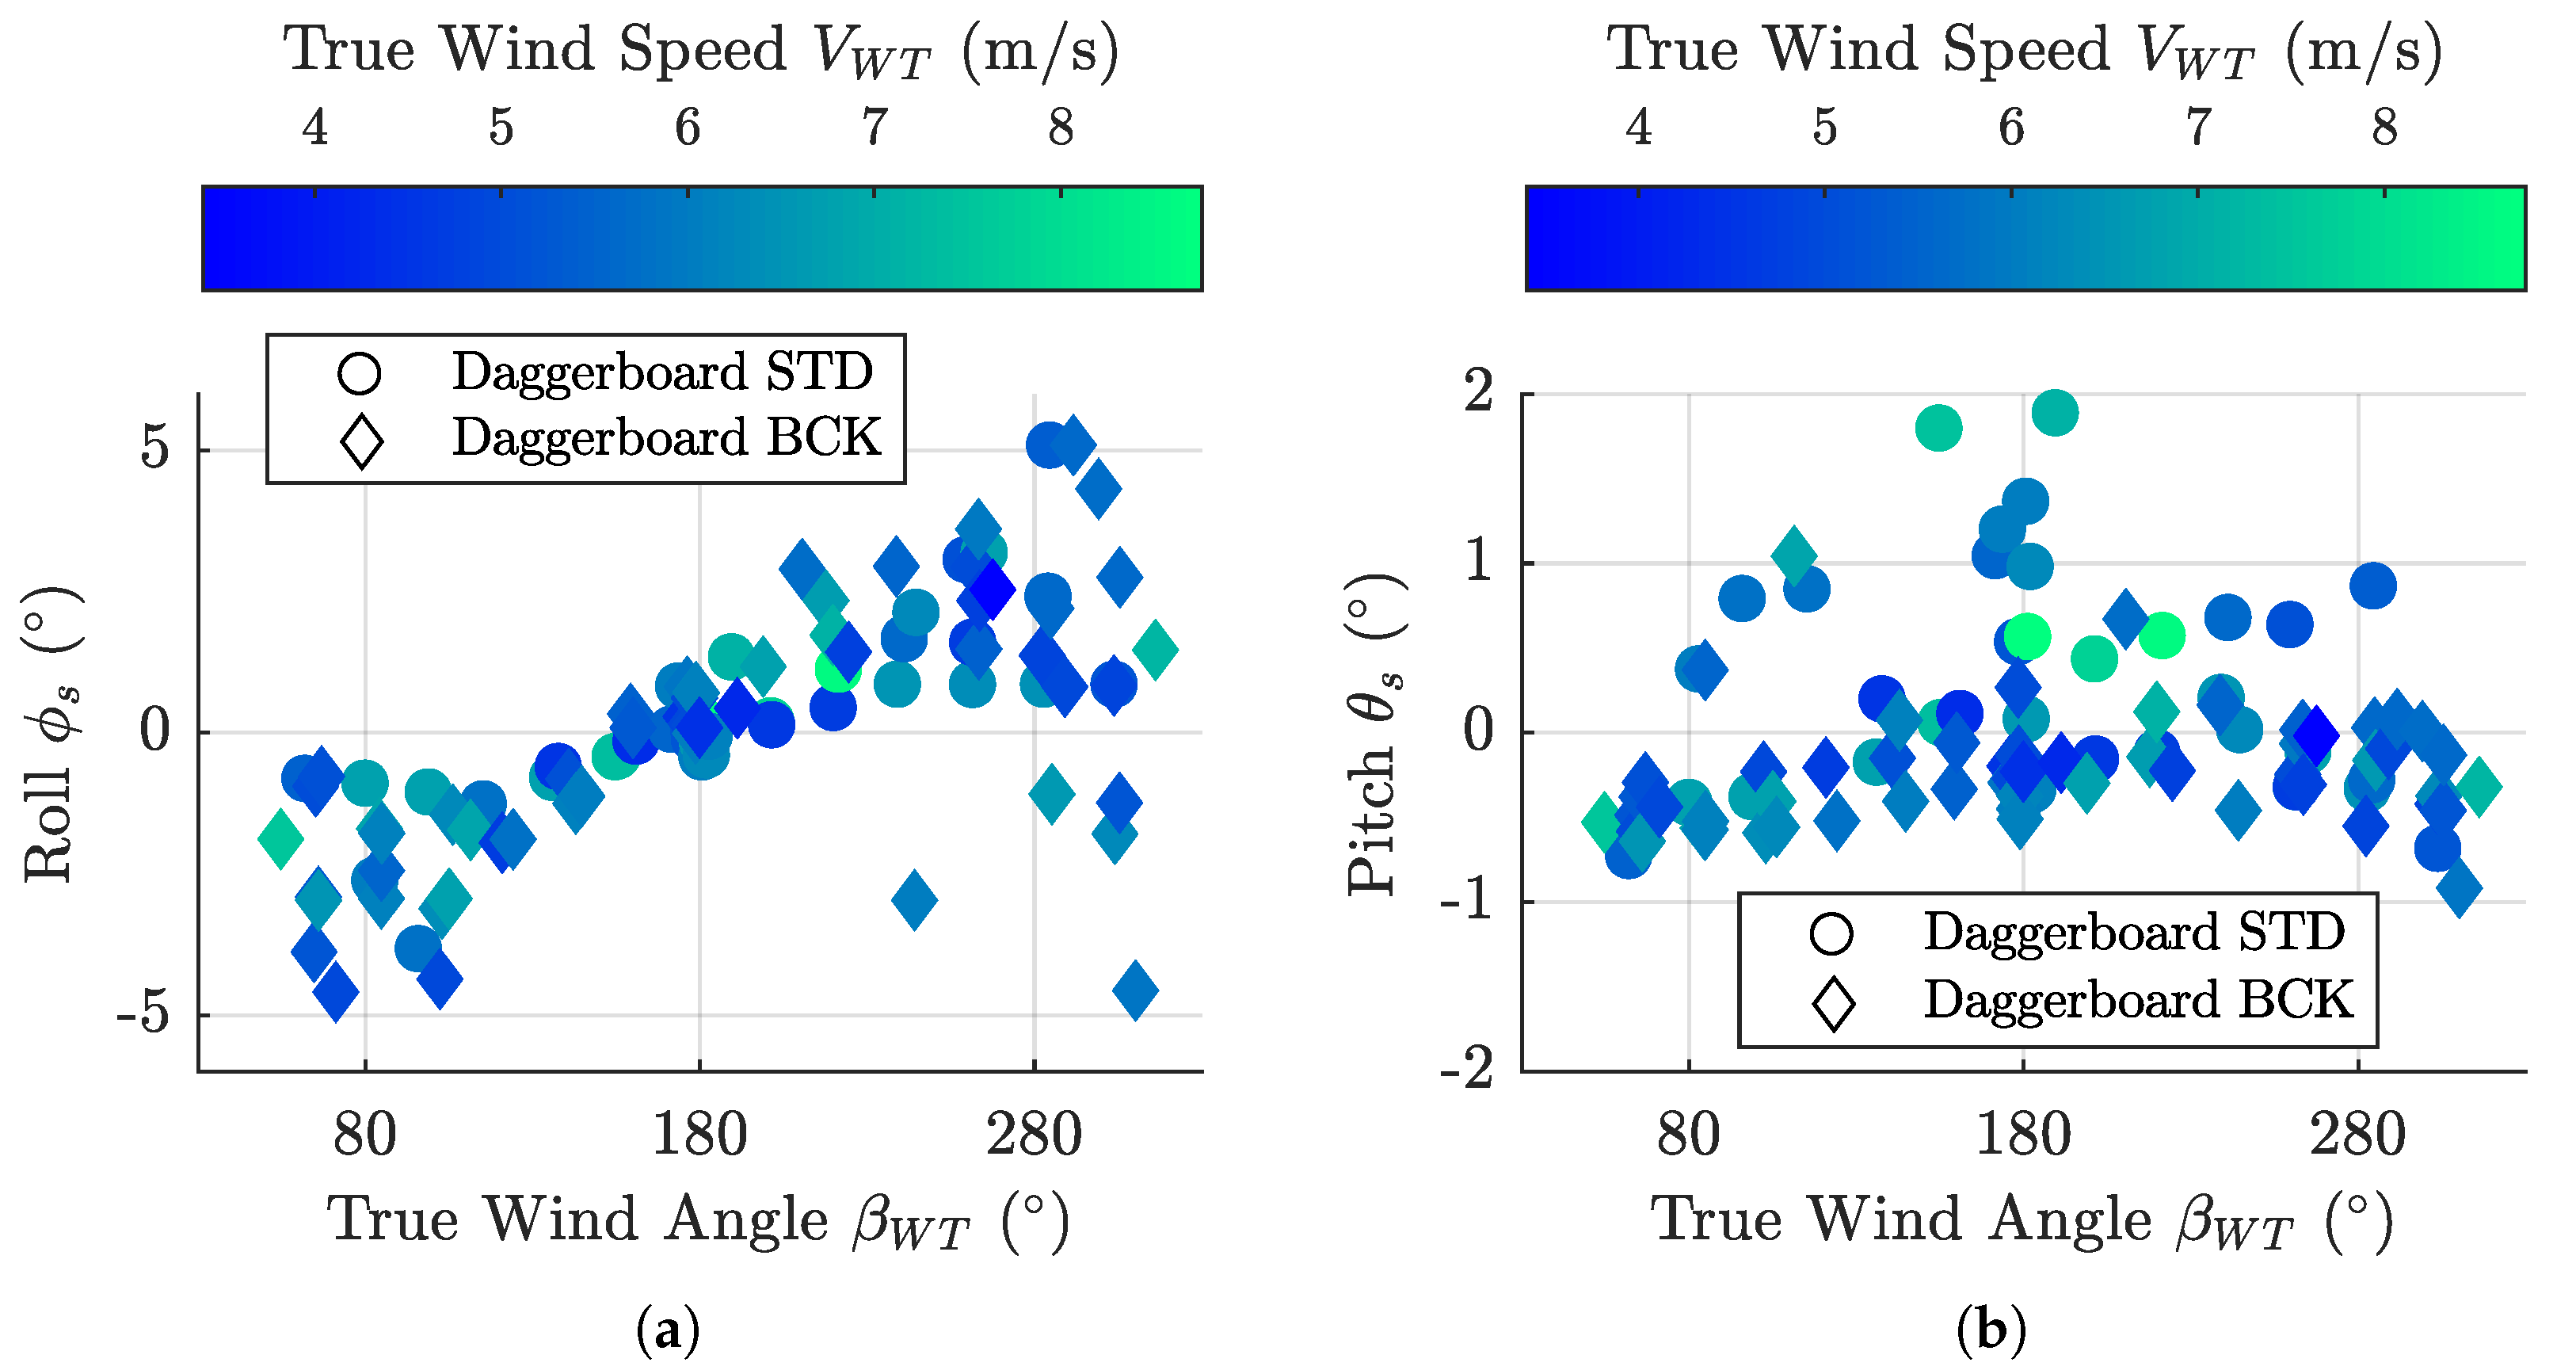
Average roll and pitch angles of the kiteboat for all runs are plotted in Figure 13. These two values depend on forces applied on the kiteboat: hydrodynamic loads on the hull and appendages, kite force, and distribution of moving weights. With a kite providing the totality of the propulsive force, the hydrodynamic loads on all immersed parts of the boat and the kite force are strongly coupled. No devices were installed to measure the moving weights onboard. It was decided to fix the positions of the boxes and crew members in order to maintain the overall center of gravity at the same position at all times. However, with a crew of three, it was not possible to distribute the masses symmetrically. As a result, the helmsman was permanently seated on the starboard bench. This is visible on the average value of the roll, with an offset of +1.47°. In the following analyses, this value was subtracted from the data to center the cloud of points on 0 and, thus, get reader-friendly plots. The average offset on pitch values was also subtracted from the data for the same reason.

5.3.2. Polar Diagrams of the Kiteboat

The aim of this section is to draw a polar diagram of the kiteboat, associating the true wind angle of the runs with the boat speed. In order to obtain reliable data, the other parameters had to remain as constant as possible. Cases were selected from the experience matrix with this requirement. This meant setting the configuration for: the kite, the tethers length, the daggerboard, the location of the attachment point and the propulsion. The choice of the retained cases among the given parameters was achieved by maximizing the number of runs. Hence, 54 cases were selected fitting these criteria:
  • Kite Cabrinha ® 12 m 2
  • 50 m tethers
  • Black daggerboard
  • Kite attachment point at 2.68 m
  • No Motor
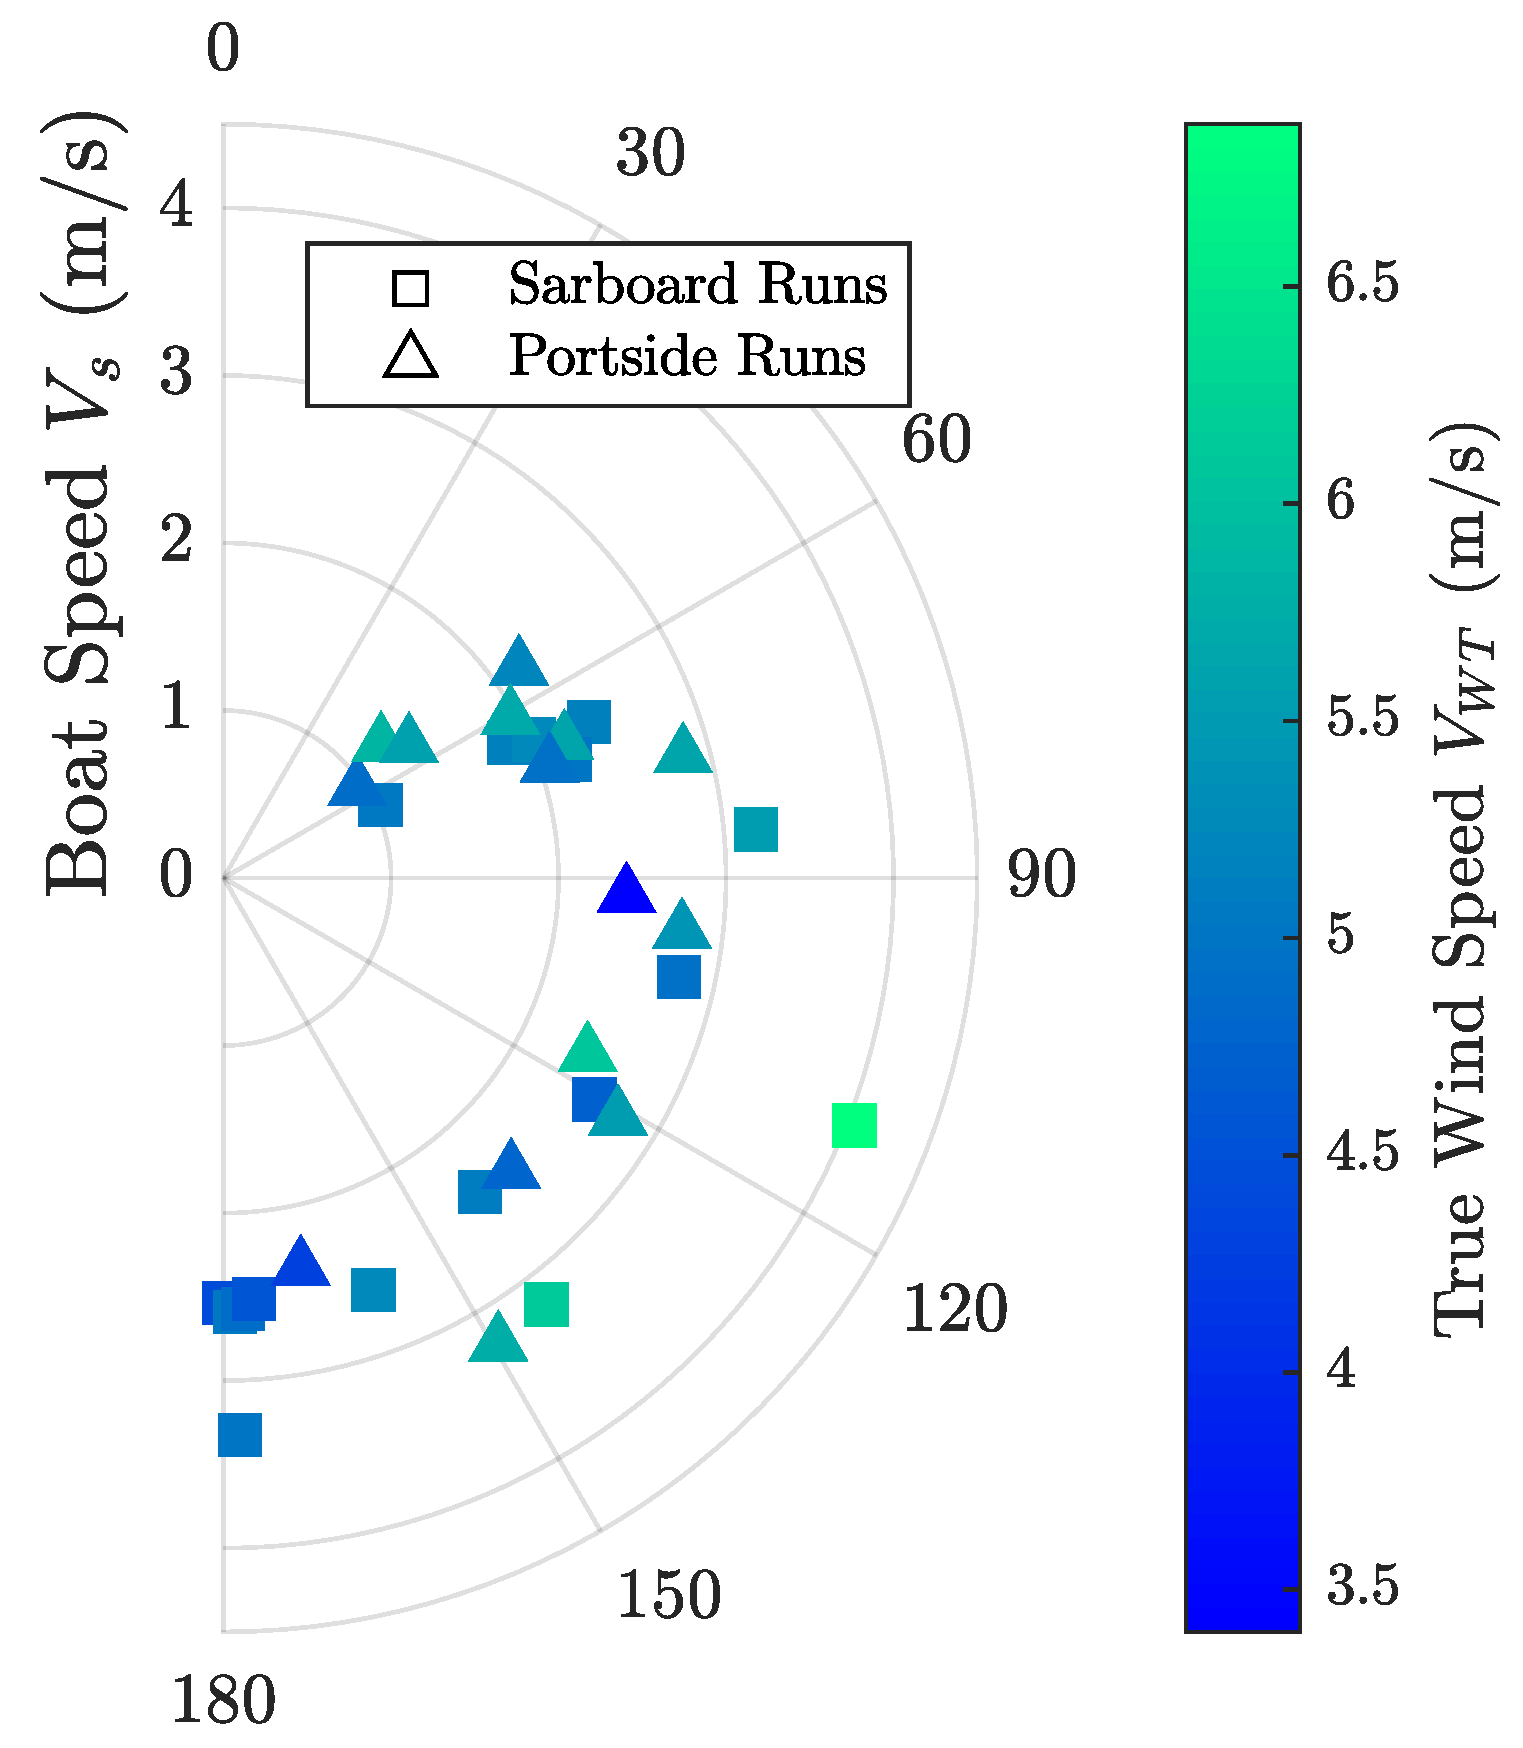
All selected runs are shown in Figure 14, with the average true wind speed of the run given thanks to the colorbar. In order to have a more consistent plot, by symmetry consideration, true wind angles for all runs are concentrated between 0 and 180°. The port side runs (with negative true wind angle) are, however, denoted with another symbol than the starboard runs. No symmetry issue between port side and starboard runs can be noticed.
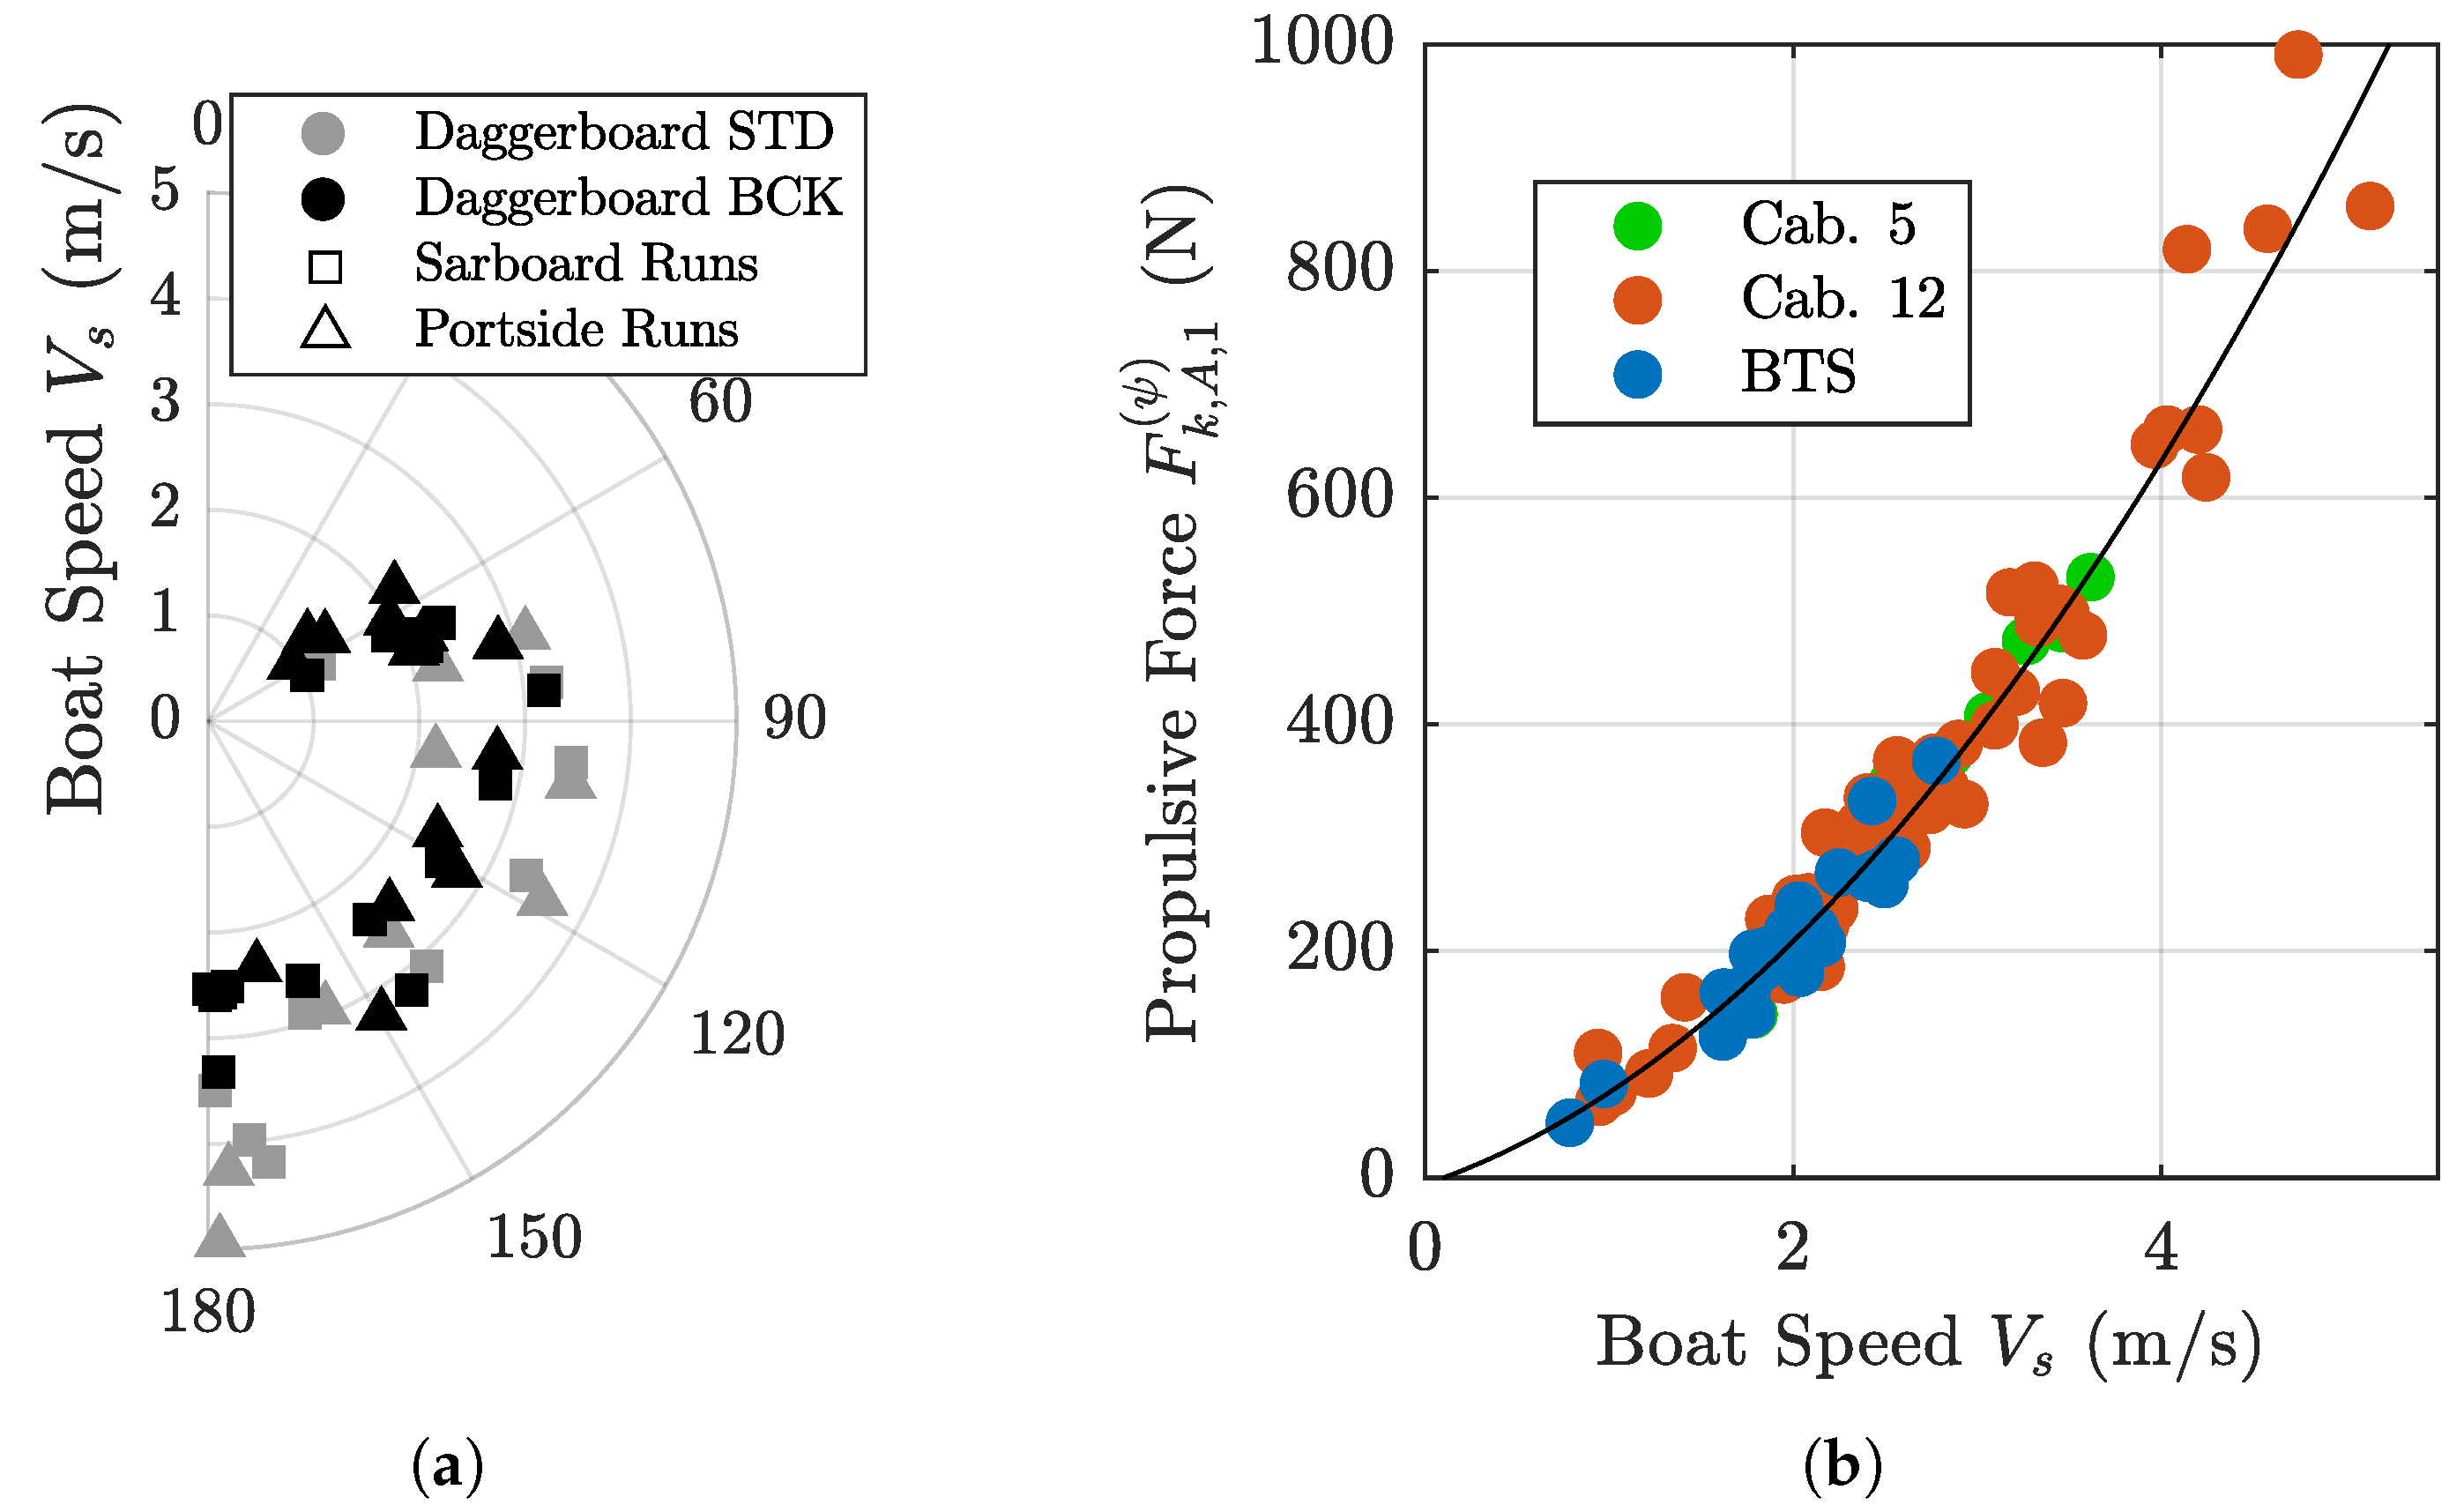
Other choices can be made on the parameter set. Thus, in Figure 15a, the true wind speed is limited to remain within the range from 4.5 to 6 m/s. The impact of the daggerboard choice is highlighted by plotting the runs done with the two types of daggerboard with different markers. Other parameters remain identical to the previous plot. On the one hand, it is immediately visible that the black daggerboards allow runs closer to the wind than the standard daggerboards. On the other hand, when no significant lift is produced, the black daggerboards generate larger drag than the standard set due to their larger wetted surface. The diagram highlights the significant impact of this increase in drag on boat speed during downwind runs.

5.3.3. Running Resistance Curve of the Kiteboat

The running resistance curve of the kiteboat is plotted in Figure 15b, based on all the runs achieved without additional power from the motor. Thus, the value of the propulsive force generated by the kite (in other word the projection of the kite force F k on the x-axis of the heading reference frame) is analysed with respect to the boat speed. Moreover, the kite in use during each run is also specified using a color code. The agreement is good between the regression curve, for measurement at sea, considering the number of uncontrolled parameters as the wind speed, the sea state or the surface current. A quadratic fitting was applied to the entire set of points, leading to the following equation:
F k , 1 ( ψ ) = 26.2 V s 2 + 54.8 V s 5.7 .
Nevertheless, a second order regression curve is clearly a rough estimate. An increased discrepancy between the different measurement points can be observed in the higher part of the curve. Three points seems to begin a plateau, which could corresponds to the planning regime as Froude number is about 0.6. The highest point in terms of resistance corresponds to a broad reach point of sail with significant side force. In this situation, induced drag on daggerboards explains the gap in tendency with the three points cited above. To complete this analysis, it is interesting to include a fourth point to this group, which is the highest in the graph. The two leftmost points of the regression curve are for closer wind angles and “black daggerboard”, while the two rightmost points are those with higher wind angles and “standard daggerboards”. Therefore, a simple modelling of the type of the wing theory could satisfactorily represent the difference between the regression curve and these points by applying it to the daggerboards. Moreover, even if it was weak in the sailing area, the current should be taken into account in a further analysis to obtain the true hydrodynamic velocity of the boat.

5.3.4. Effects of Daggerboards on Boat Motions

The impact of the daggerboard choice on boat attitudes was also investigated. Thus, the average roll and pitch angles are plotted according to the true wind angle, the daggerboard type, and the true wind speed. No constraint was added to reduce the number of runs, except that the motor shall not be used. Results are given in Figure 16. Whatever the daggerboard choice, the absolute value of the roll angle increases when the runs are closer to the wind (Figure 16a). This can be easily explained by analysing the evolution of the side force generated by the kite. In case of significant side force, the hydrodynamic anti-drift force acting on the daggerboards increases and dominates the overall hydrodynamic side force. On the one hand, As first estimate, its point of application can be considered at the center of the daggerboard planform. On the other hand, The side force produced by the kite is applied at the attachment point, above the waterplan and in the centerplan. Hence, the lever arm created between the side force produced by the kite and the anti-drift force on the daggerboards induced a roll moment on the ship. The side forces are much stronger in reaching conditions, thus it induces a stronger heeling moment. The sign of the roll angle is consistent with this explanation: true wind angles between 0 and 180° are associated with starboard tacks, and induced side forces are consequently negative. The heeling moment is also negative and so is the roll angle. During port tacks (TWA from 180° to 360°), side forces are positive leading to positive roll angles. The 4 negative values associated with port tack, related to the black daggerboard, deal with runs with a kite that is manually steered. In this case, the crew members’ position was changed to ensure a good position of the member in charge of the kite steering. The black daggerboards, the larger of the two sets, also seem to lead to a greater value of the roll angle. This makes sense because, with the larger span of the black daggerboard, the center of effort of the hydrodynamic force generated by the daggerboards is located lower. The associated heeling moment is therefore larger.
The pitch angle is also affected by the daggerboard choice as shown in Figure 16b. Indeed, amplitudes of pitch angles are lower with the black daggerboard. This can also be explained by the lower position of the application point of the hydrodynamic force on daggerboards. Plot (b) seems also to show a slight decrease of pitch when runs come closer to the wind. As the side force increases, the drag on the daggerboards also increase. Therefore, it takes a greater part in the overall hydrodynamic resistance and lowers its point of application. The induced pitch moment being negative, this leads to a decrease in pitch angle.

5.3.5. Back Tether Ratio

The ratio between the force in back tethers and the total kite force was computed, as it is done in Reference [21], using the following formula:
r b = F b l + F b r F k .
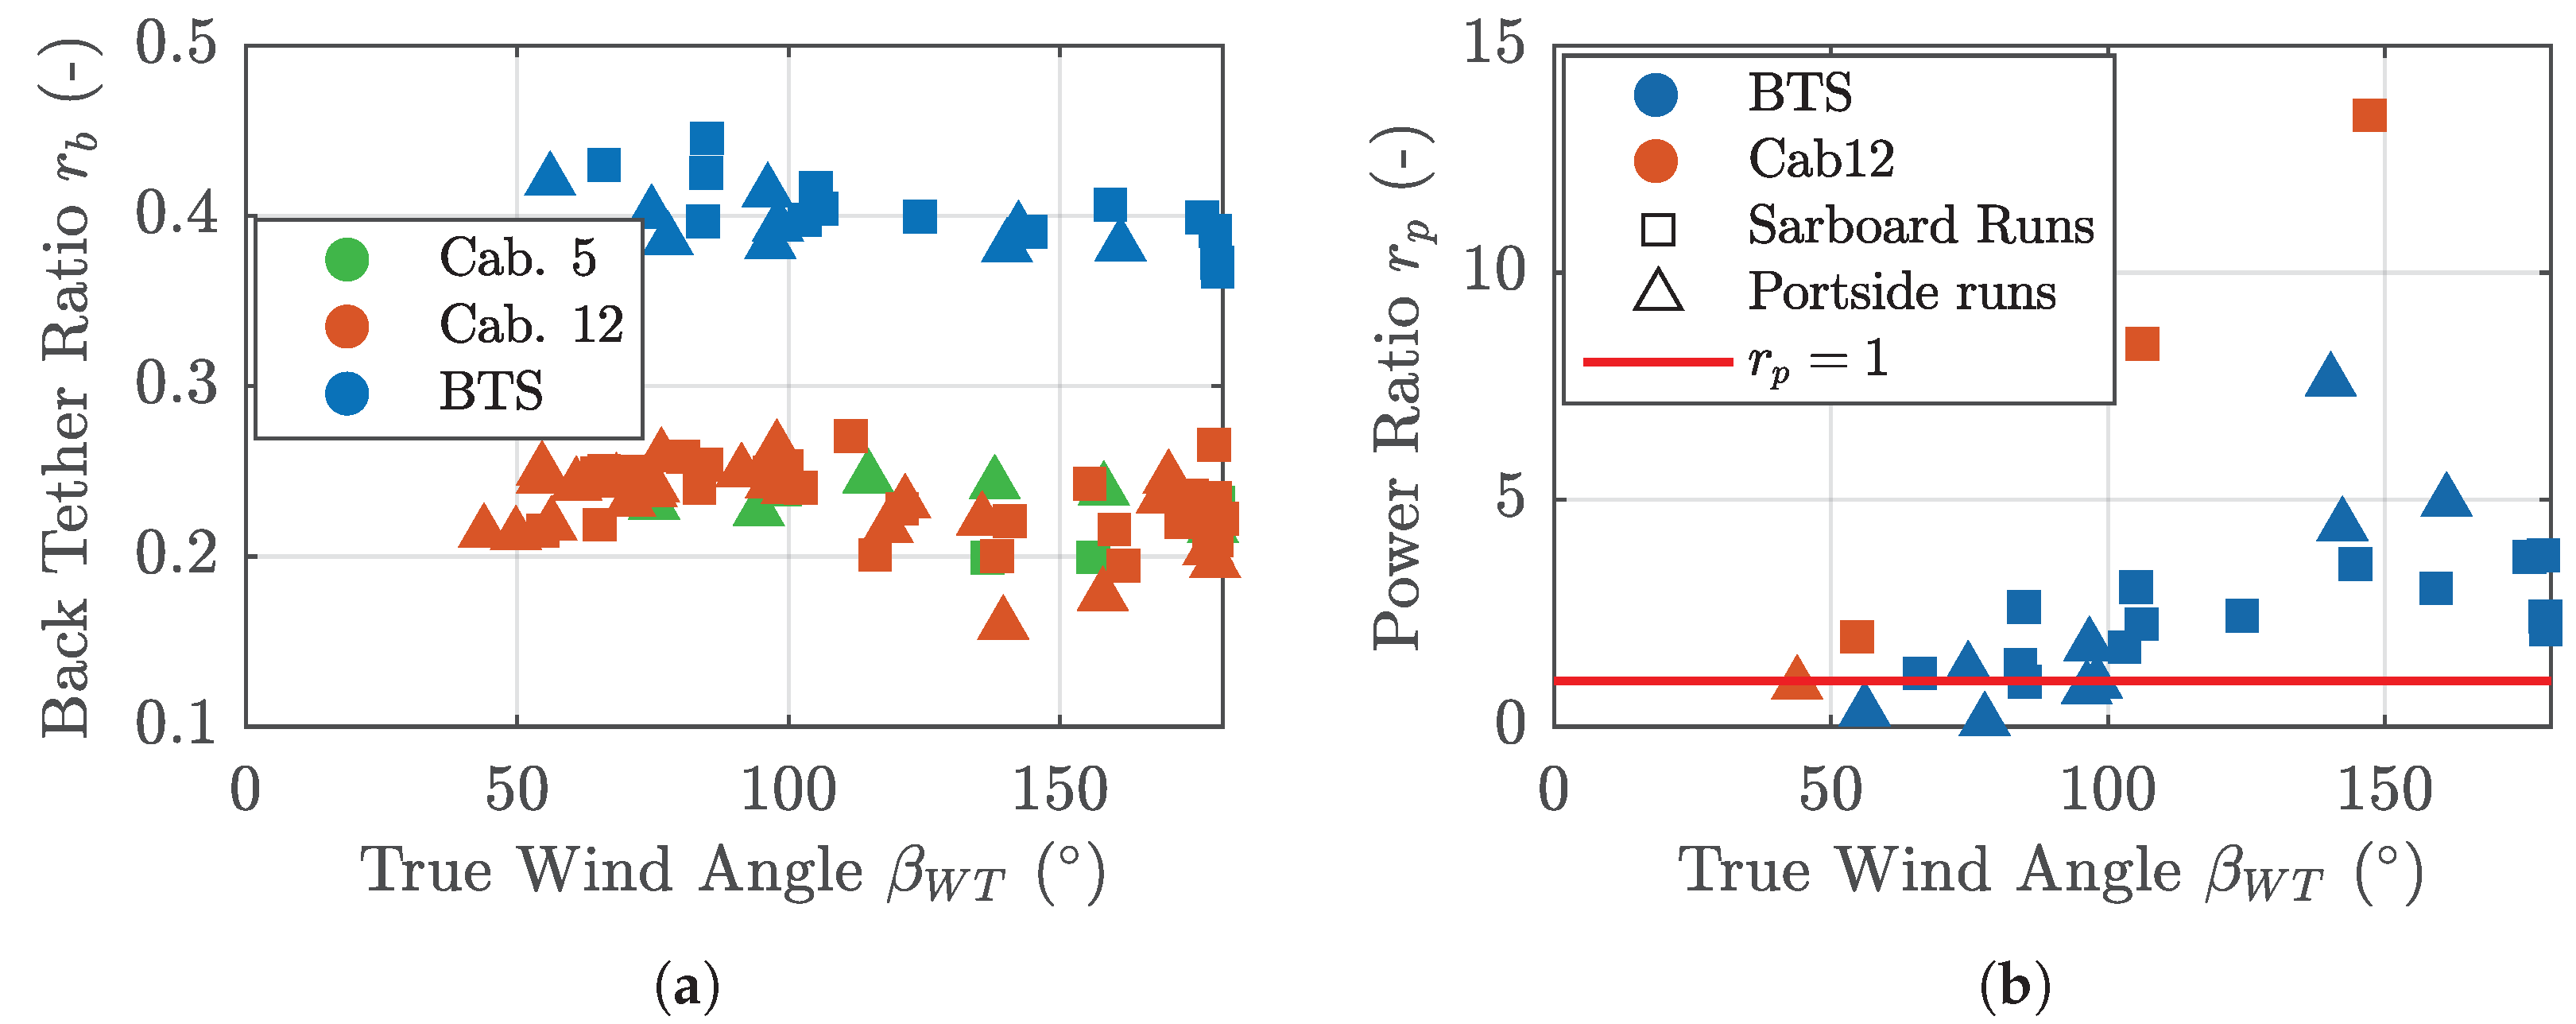
As expected, the ratio for the two Cabrinha ® kites are close to the ones obtained onshore [21], with an average value of 23%. However, this ratio for the third kite is quite different, with an average value of 40 %. This difference can be explained by the special design of the BTS kite with an added line linking back and front bridle system.

5.3.6. Power Ratio.

During the last two days of measurements, the main battery voltage was recorded as well as the intensity of each channel of the power board. Therefore, the electrical power P e consumed by actuators can be analysed. However, the data rate was low (1 Hz), so that a fine analysis of the consumption along a trajectory cannot be performed and only average values will be considered. This quantity is interesting to analyse, particularly in comparison with the propulsive power generated by the kite P p r o p , which is the product of the propulsive force of the kite by the speed of the boat:
P p r o p = V s F ̲ k · x ̲ ψ .
This make it possible to define the ‘power ratio’, which is denoted r p :
r p = P p r o p P e .
When this ratio is lower than 1, the control of the kite requires a level of power higher than the towing power provided. Results are given in Figure 17. During these two days, runs were mostly carried out in light wind with the BTS kite. Only 4 runs proceeded with the Cabrinha ® 12 m 2 . For runs with low true wind angles, the power ratio is close to 1 and even below for some runs. This is not surprising, because for these points of sail, most of the kite force is along the transverse axis of the boat. Therefore, the propulsive force is low, so the power ratio. For greater true wind angles, the ratios increase, but remain relatively low for the BTS kite. On the contrary, the power ratios of the Cabrinha ® 12 m 2 seems to be much better. However, more data would be necessary with the Cabrinha ® kite to do a fair comparison. Further works have to be carried out to measure more accurately the power ratio. It should also be noted that the present steering system was only designed for measurement and not with an energy efficiency approach. The bevel gear box change should already improve the power consumption by more than 20%.

5.4. Results Processed with Phase-Averaging Method

The phase-averaging method, presented in Reference [21], was adapted to take into account the additional data induced by the boat. All the 101 runs are not suitable. Indeed, a minimum reproducibility of the trajectories is required, and some sailing configurations, as the manual steering, do not allow meeting this requirement. Eventually, 10 runs were selected and results are presented in Table 3. The back tether ratio r b (Equation (22)) and the amplitude ratio r a were already considered in Reference [21]. The amplitude ratio is the amplitude of the force divided by the averaged force value along the trajectory. In addition, two others ratio are introduced here: the propulsive ratio r p r o p and the amplitude speed ratio r s . The first one denotes the part of the kite load useful for propulsion (i.e., the projection of the kite force on the x ψ -axis):
r p r o p = F ̲ k · x ̲ ψ F k .
The amplitude speed ratio denotes the maximum speed variation during the kite eight pattern in comparison with the average speed:
r s = max ( V s ) min ( V s ) μ V s = V s μ V s .
Moreover, other quantities are introduced denoting the variation of some parameters for the boat, as the amplitudes of the rudder angle δ R , the heading angle ψ , the roll angle ϕ s and the amplitude of the pitch angle θ s . On the kite side, the amplitude of the kite steering command δ , the amplitudes in azimuth ϕ and in elevation △θ are shown in Table 3. The first three columns denote the short name of the case, the kite used and the true wind angle β WT . This parameter is very sensible. The case d04f1 is remarkable for the very low amplitude in elevation angle. This represents a turning radius of about 3 meters, which is very tight given the size of the kite and well below the limit identified by Fagiano [3].
The force coefficient, Ck, already used for onshore trials in Reference [21], was naturally computed here with the relative wind speed instead of the true wind speed. This parameter is very sensible. For two very close configurations (D02f5 and D02f6 in Table 3), dramatic differences are observed. Thus, the propulsion power is doubled, while at the same time, the force coefficient goes from 4.8 to 12.9. The only culprit appears to be a 15° change in elevation angle from 65° to 50°. The speed of the boat was therefore increased by more than 26%. Another interesting thing to note is the fall of 65% in terms of the amplitude of the rudder angle, reflecting an appreciable increase in stability. Compared to onshore results, in the present study, the force coefficients recorded values were significantly lower by more than 20%. This may be explained by the fact that in the onshore campaign, all tests were conducted in “crosswind conditions”, as called by the AirborneWind Energy (AWE) research community (i.e., full downwind). Instead, the results presented in the Table 3 were obtained with true wind directions from the beam reach (106°) to the full downwind (180°). In line with the zero-mass model, the results showed a sharp decrease in the force coefficient as the wind angles decreased. Thus, the lowest value of 3.2 in force coefficient corresponds to the lowest wind angle (106°) while the highest value (12.9) corresponds to full downwind (182°). Force coefficient was also computed with the method presented in Section 5.3 (see Appendix A). A top value of 20 was reached in the full downwind case (d05f10), which is significantly higher (+24%) than that obtained onshore [21]. This result may be sensitive to wind estimation at kite altitude. A sensitivity analysis should then be carried out using the different methods described in Section 4.4 to verify the consistency of this result.
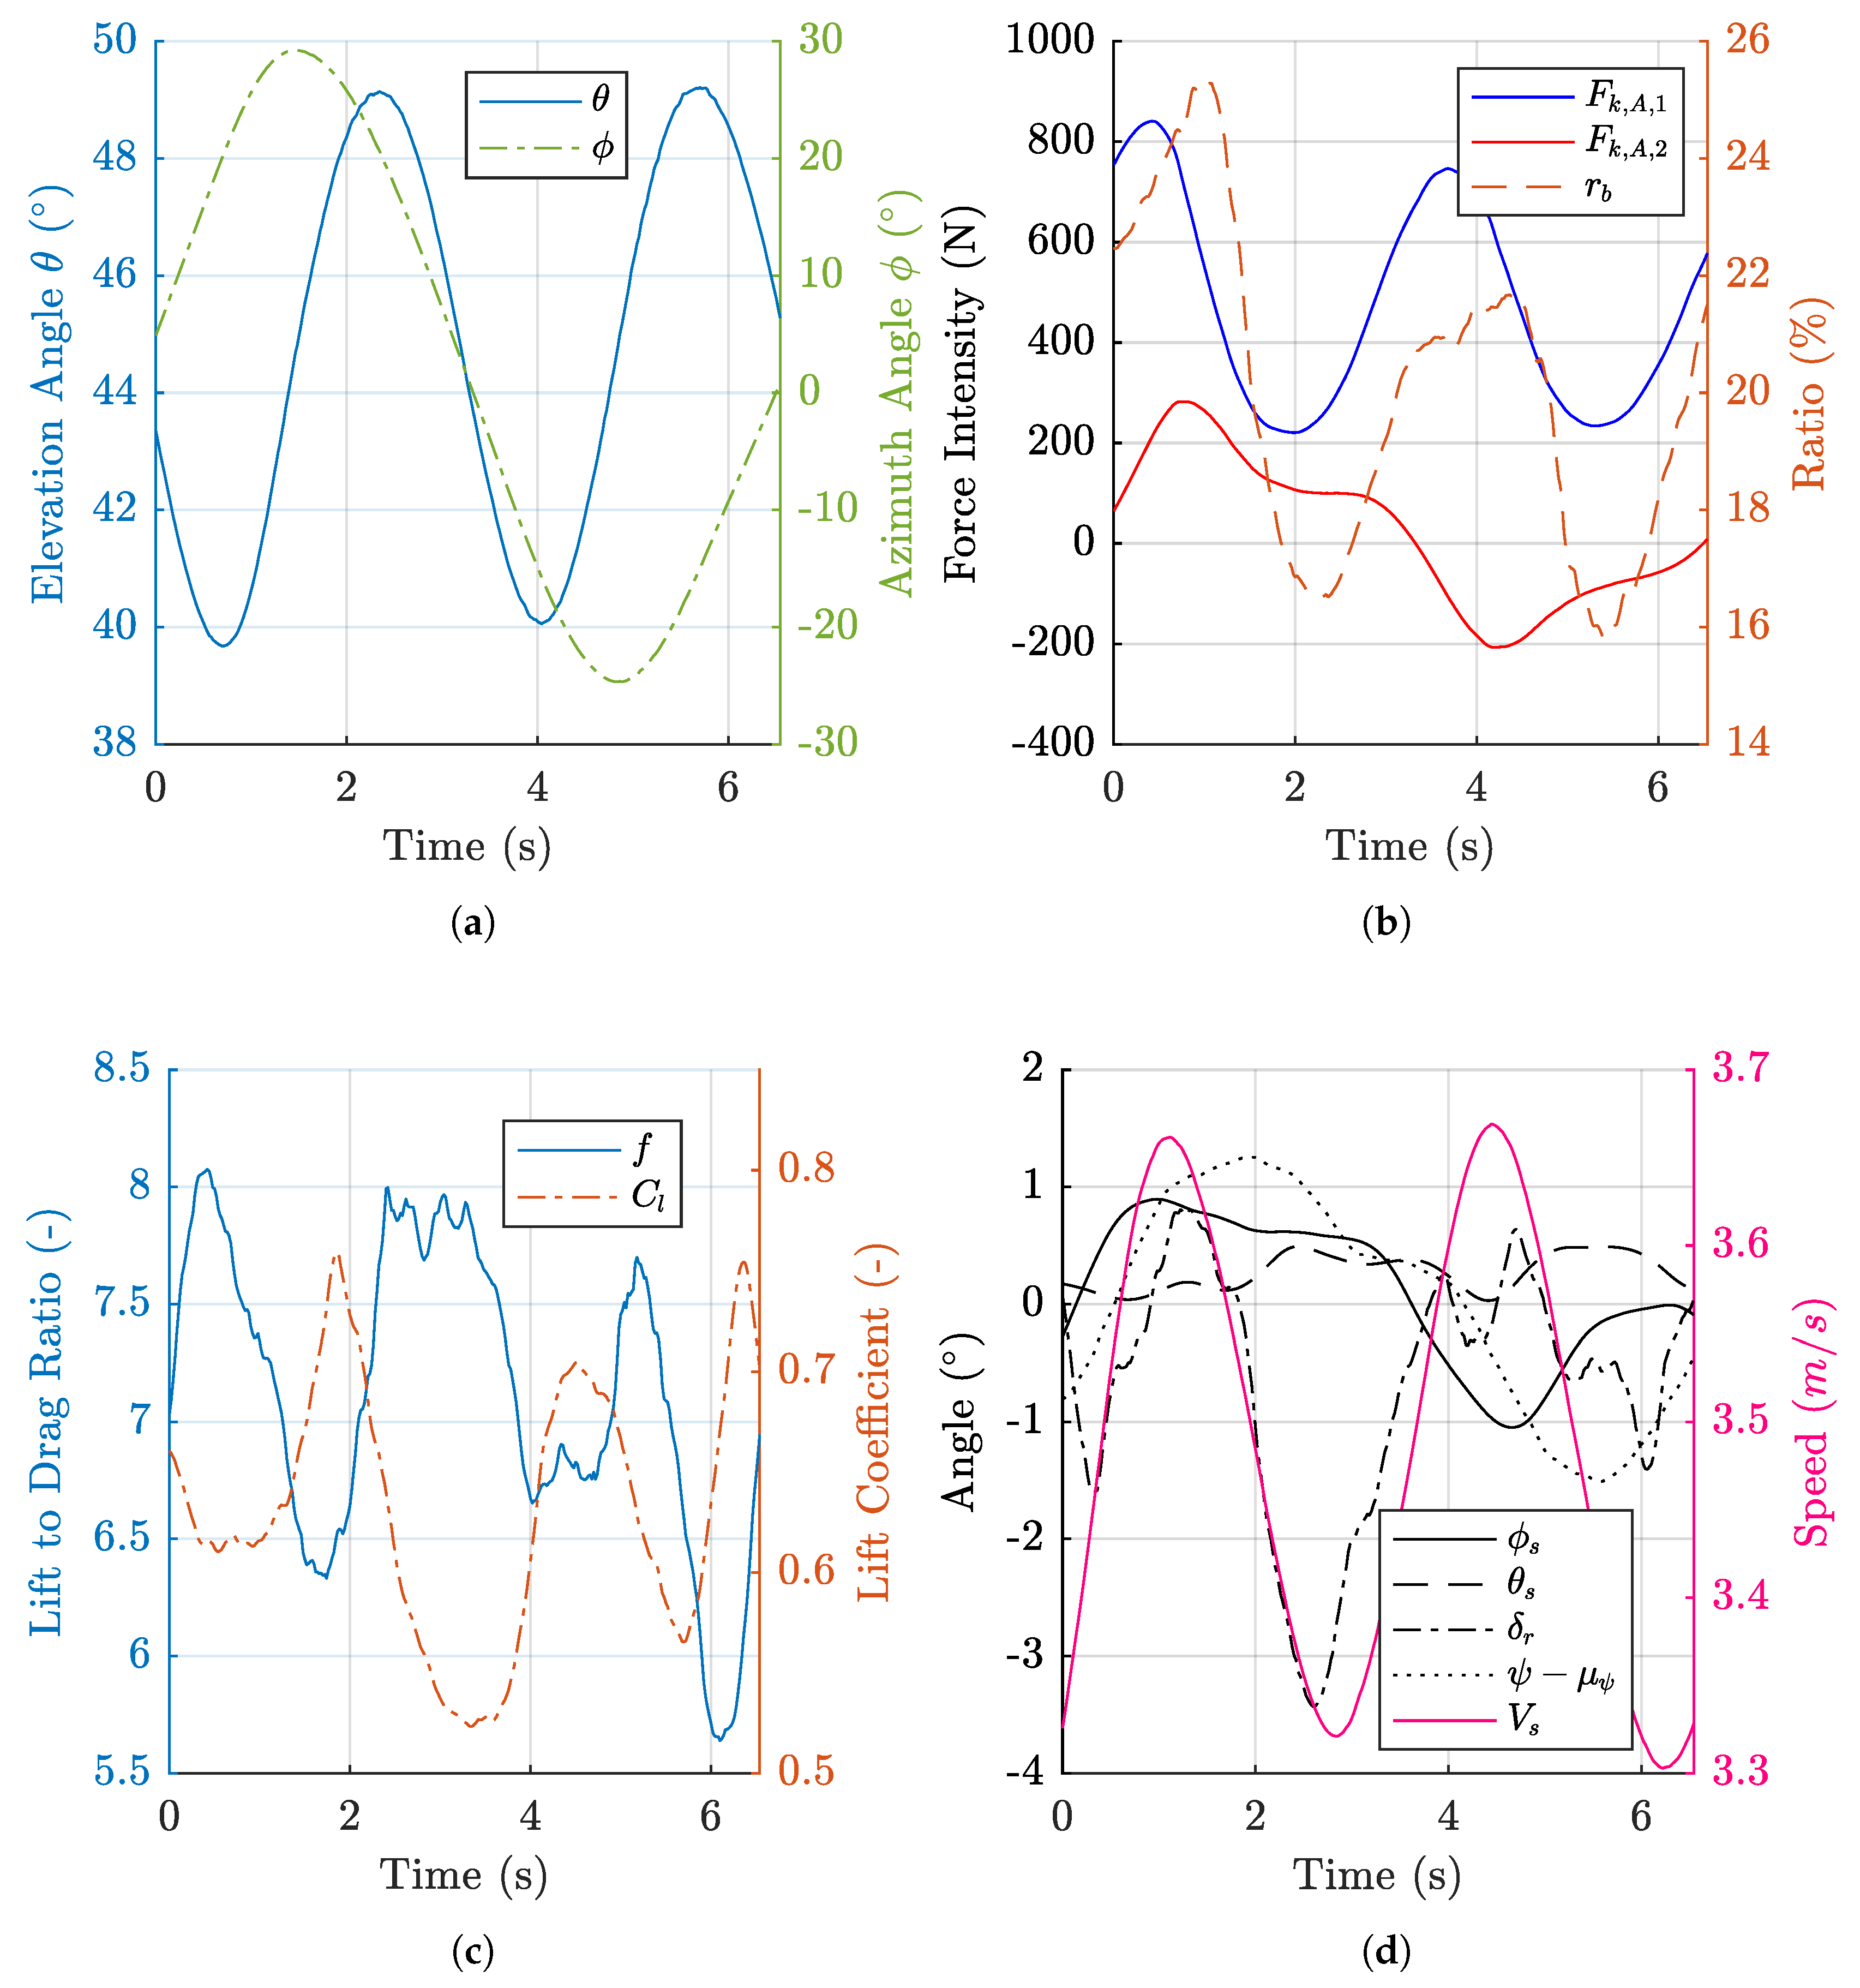
As an example, one case was selected (Case d05f4 in Table 3). Results for this case are shown in Figure 11, Figure 18. The variations of the lift to drag ratio and the lift coefficient along the trajectories are still not easy to interpret, with no generic scheme. The speed of the boat correlates with the propulsive force with a slight phase shift (inertia). The variations of the roll angle are clearly in line with the side force intensity. The stronger the side force is, the larger the amplitude of the roll angle. Such large side forces occur in reaching sailing conditions leading to roll angle over 10° (case d07f18 in Table 3).

6. Discussion

The objective of this experimental study carried out on a boat was to acquire relevant data to analyse the behaviour of a boat towed by a kite, and more generally for benchmarking numerical modelling adapted to this type of analysis. In this context a large amount of data was obtained. The first analyses showed sensible data regarding the expected behaviour of a ship towed by a kite. However, the entire set of data acquired during this work is not fully processed. The estimation of the wind at a given point of the sailing area could be improved by using more data coming from the various sensors and modelling deployed during the trials. Otherwise, in addition to manoeuvrability tests that were achieved but not considered in this study, other tests or numerical simulations will be probably necessary to get an enhanced modelling of the kiteboat.
Variations of kite characteristics according to the position of the kite along an eight trajectory are still not easy to identify. Indeed, no repeatable trend was highlighted, but these variations seem all the time linked to the position along the trajectory. An improvement of the weather modelling, by integrating wind data measurements carried out over the sailing area could enhance the estimation of the true wind speed on the kite, but this will probably not resolve the whole problem. Such analyses are far more complex to achieve on a moving platform, and it seems more relevant to carry out this type of study with an onshore fieldwork. Indeed the analysis of the data had shown that the boat motions seems to impact the tether tension. However, there is, for the moment, no clue allowing us to conclude whether this increase of the tether tension impacts also the kite position, or if this variation is absorbed by a deformation of the tethers. This work on the lift to drag ratios and the lift coefficients allows nevertheless to corroborate the amplitudes of the variations that are pointed out in Reference [21].
On the performance side, as expected, they were excellent downwind with a top force coefficient of 20 (i.e., Equivalent to a drag coefficient in that particular case). In these conditions, the boat is faster than the wind at the measurement point (5.5 m in altitude). It simply means that the crew had the feeling of going faster than the wind by tailwind. For the upwind conditions, the performances were not so spectacular but remained fairly good taking into account the sizes of kite used compared to the displacement of the boat. The results are comparable to those of Leloup et al. [14], given that the boat tested at the time was 27% longer, twice heavier and had a sail area three times larger. However, performance was clearly not the aim of the present study. The objective was to obtain the most reliable data. Therefore, repeatability of measurements, long measurement times and stable conditions were sought. Kite take-off from water is not that easy than onshore. In order to increase the measurement time and avoid crashing in the water, high elevation angles were preferred. A comparison between two similar cases made in Section 5.3 showed that the propulsive power can be multiply by a factor of 2 when the elevation angle target is reduced from 60 to 45°. The propulsion power should be doubled once again by targeting the optimal elevation angle, which is between 15 and 20° according to the literature [12,14,15]. This gave an overview of the exceptional performance achievable by a kite. However, the autopilot needs to be improved to reach such low angles reliably. Given that roll angles, during the trials, remained below 2.4° for true wind angles lower than 70°, upwind performances could be largely improved, increasing the kite area. Theoretically, it is possible to imagine an area of 75 m 2 in order to reach a typical roll angle of 15°. Nevertheless, several obstacles were observed during these tests. First, at low speed some manoeuvrability issues were encountered. Second, in the case of structure or kite steering failures, it is important to keep in mind that the kite can go at any moment to dynamic mode. Therefore, kite typically develops forces up to 24 times higher than in static modes with the models tested. This occurred only once during the tests, resulting in damage to the boat and an injury, fortunately slight, for one of the crew members. No clear explanation was found. It happened with a 5 m 2 kite. With larger sizes, more damage is to be expected, even a capsize is possible.

7. Conclusions

Ten full days of measurements were achieved, leading to a hundred recorded runs, one run being a five-minute record, keeping all parameters as fixed as possible. Various configurations of sailing were tested, using different kites, different lengths of tethers, different daggerboards, different points of sail and so various true wind angles.
First, all these data were analysed using only average values for each run. This led to an overview of the kiteboat performance. It allowed us to study the impact of some elements of the boat, as for example the daggerboards, or to study the impact of true wind angles on boat motions. The electrical power required to control the kite was also checked with respect to the propulsive power provided by the kite. Results showed that in some configurations the power provided by the kite was not really greater than the power used for control purpose.
Second, the conditional phase averaging method, developed for the post processing of the previous experimental campaign, was adapted to the data coming from the kite-boat. Ten cases were found as suitable for such a method, with a sufficient reproducibility of the eight pattern trajectories. The analysis of the results of the phase averaging method allowed to observe accurately the influence of the kite on the boat. For instance, the influence of the kite on the boat motion was highlighted. Especially when it flies in dynamic mode and therefore generates a periodic load on the boat.
However, the entire set of data acquired in the scope of this campaign could not be fully post processed, and a lot of work is still achievable. Nevertheless, this first analysis of the results showed that the data acquired are sensible. They provide a good database for benchmarking of numerical modelling.

Author Contributions

Conceptualization, K.R. methodology, K.R., P.I., M.B., J.-B.L.; software, M.B.; formal analysis, J.-B.L.; validation, J.-B.L., K.R. and M.B.; writing—original draft preparation, K.R., M.B.; writing—review and editing, K.R.; supervision, K.R.; project administration, Y.P.; funding acquisition, Y.P. All authors have read and agreed to the published version of the manuscript.

Funding

This research was funded by the French Environment and Energy Management Agency. GRANT NUMBER: 1482C0090.

Conflicts of Interest

The authors declare no conflict of interest. The funders had no role in the design of the study; in the collection, analyses, or interpretation of data; in the writing of the manuscript, or in the decision to publish the results.

Appendix A. Kiteboat Averaged Results

This appendix includes the average results of the 101 tests carried out in the navigation area and two others on the return to port, all summarized in the following figures:Applsci 10 06148 i001Applsci 10 06148 i002

References

  1. Loyd, M.L. Crosswind kite power (for large-scale wind power production). J. Energy 1980, 4, 106–111. [Google Scholar] [CrossRef]
  2. Argatov, I.; Rautakorpi, P.; Silvennoinen, R. Estimation of the mechanical energy output of the kite wind generator. Renew. Energy 2009, 34, 1525–1532. [Google Scholar] [CrossRef]
  3. Fagiano, L. Control of Tethered Airfoils for High-Altitude Wind Energy Generation. Ph.D. Thesis, Politecnico di Torino, Torino, Italy, 2009. [Google Scholar]
  4. Schmehl, R. Kiting for wind power. Wind Syst. 2012, 27, 36–43. [Google Scholar]
  5. van der Vlugt, R.; Peschel, J.; Schmehl, R. Design and experimental characterization of a pumping kite power system. In Airborne Wind Energy; Springer: Berlin/Heidelberg, Germany, 2013; pp. 403–425. [Google Scholar]
  6. Erhard, M.; Strauch, H. Flight control of tethered kites in autonomous pumping cycles for airborne wind energy. Control Eng. Pract. 2015, 40, 13–26. [Google Scholar] [CrossRef] [Green Version]
  7. Erhard, M.; Strauch, H. Automatic Control of Pumping Cycles for the SkySails Prototype in Airborne Wind Energy. In Airborne Wind Energy; Springer: Singapore, 2018; pp. 189–213. [Google Scholar]
  8. Oehler, J.; Schmehl, R. Aerodynamic characterization of a soft kite by in situ flow measurement. Wind Energy Sci. 2019, 4, 1–21. [Google Scholar] [CrossRef] [Green Version]
  9. Wellicome, J.F.; Wilkinson, S. Ship Propulsive Kites: An Initial Study; Technical Report; Department of Ship Science, University of Southampton: Southampton, UK, 1984. [Google Scholar]
  10. Wellicome, J. Some comments on the relative merits of various wind propulsion devices. J. Wind Eng. Ind. Aerodyn. 1985, 20, 111–142. [Google Scholar] [CrossRef]
  11. Naaijen, P.; Koster, V.; Dallinga, R.P. On the power savings by an auxiliary kite propulsion system. Int. Shipbuild. Prog. 2006, 53, 255–279. [Google Scholar] [CrossRef]
  12. Dadd, G.M. Kite Dynamics for Ship Propulsion. Ph.D. Thesis, University of Southampton, Southampton, UK, 2013. [Google Scholar]
  13. Erhard, M.; Strauch, H. Control of towing kites for seagoing vessels. IEEE Trans. Control Syst. Technol. 2013, 21, 1629–1640. [Google Scholar] [CrossRef] [Green Version]
  14. Leloup, R.; Roncin, K.; Bles, G.; Leroux, J.B.; Jochum, C.; Parlier, Y. Kite and classical rig sailing performance comparison on a one design keel boat. Ocean Eng. 2014, 90, 39–48. [Google Scholar] [CrossRef]
  15. Leloup, R.; Roncin, K.; Behrel, M.; Bles, G.; Leroux, J.B.; Jochum, C.; Parlier, Y. A continuous and analytical modelling for kites as auxiliary propulsion devoted to merchant ships, including fuel saving estimation. Renew. Energy 2016, 86, 483–496. [Google Scholar] [CrossRef]
  16. Dadd, G.M.; Hudson, D.A.; Shenoi, R. Comparison of two kite force models with experiment. J. Aircr. 2010, 47, 212–224. [Google Scholar] [CrossRef]
  17. van der Vlugt, R.; Bley, A.; Noom, M.; Schmehl, R. Quasi-steady model of a pumping kite power system. Renew. Energy 2019, 131, 83–99. [Google Scholar] [CrossRef]
  18. Schnackenburg, T.; Brabeck, S. Vessel propulsion using kites. In Proceedings of the 20th International HISWA Symposium on Yacht Design and Yacht Construction, Amsterdam, The Netherlands, 17–18 November 2008; Rai Amsterdam: Amsterdam, The Netherlands, 2008. [Google Scholar]
  19. Fritz, F. Application of an automated kite system for ship propulsion and power generation. In Airborne Wind Energy; Springer: Berlin/Heidelberg, Germany, 2013; pp. 359–372. [Google Scholar]
  20. Paulig, X.; Bungart, M.; Specht, B. Conceptual design of textile kites considering overall system performance. In Airborne Wind Energy; Springer: Berlin/Heidelberg, Germany, 2013; pp. 547–562. [Google Scholar]
  21. Behrel, M.; Roncin, K.; Leroux, J.B.; Montel, F.; Hascoet, R.; Neme, A.; Jochum, C. Application of phase averaging method for measuring kite performance: Onshore results. J. Sail. Technol. 2018, 1–29. [Google Scholar] [CrossRef]
  22. Canale, M.; Fagiano, L.; Milanese, M.; Razza, V. Control of tethered airfoils for sustainable marine transportation. In Proceedings of the IEEE International Conference on Control Applications, Yokohama, Japan, 8–10 September 2010; IEEE: Piscataway, NJ, USA, 2010; pp. 1904–1909. [Google Scholar]
  23. Fagiano, L.; Milanese, M.; Razza, V.; Gerlero, I. Control of power kites for naval propulsion. In Proceedings of the 2010 American Control Conference, Baltimore, MD, USA, 30 June–2 July 2010; IEEE: Piscataway, NJ, USA, 2010; pp. 4325–4330. [Google Scholar]
  24. Fagiano, L.; Milanese, M.; Razza, V. Optimization and control of a hybrid kite boat1. IFAC Proc. Vol. 2011, 44, 14748–14753. [Google Scholar] [CrossRef]
  25. Fagiano, L.; Milanese, M.; Razza, V.; Bonansone, M. High-altitude wind energy for sustainable marine transportation. IEEE Trans. Intell. Transp. Syst. 2012, 13, 781–791. [Google Scholar] [CrossRef]
  26. Bigi, N.; Behrel, M.; Roncin, K.; Leroux, J.B.; Neme, A.; Jochum, C.; Parlier, Y. Dynamic modeling of ships towed by kite. La Houille Blanche 2018. [Google Scholar] [CrossRef]
  27. Bigi, N.; Roncin, K.; Leroux, J.B.; Parlier, Y. Ship towed by kite: Investigation of the dynamic coupling. J. Mar. Sci. Eng. 2020, 8, 486. [Google Scholar] [CrossRef]
  28. Pérez, T.; Fossen, T.I. Time-vs. frequency-domain Identification of parametric radiation force models for marine structures at zero speed. Model. Identif. Control 2008, 29, 1–19. [Google Scholar] [CrossRef] [Green Version]
  29. Salvesen, N.; Tuck, E.; Faltinsen, O. Ship motions and sea loads. Trans. SNAME 1970, 78, 250–287. [Google Scholar]
  30. Irvine, M.; Longo, J.; Stern, F. Pitch and Heave Tests and Uncertainty Assessment for a Surface Combatant in Regular Head Waves. J. Ship Res. 2008, 52, 146–163. [Google Scholar]
  31. The University of Iowa. EFD Data; The University of Iowa: Iowa City, IA, USA, 2013. [Google Scholar]
  32. Behrel, M.; Bigi, N.; Roncin, K.; Grelon, D.; Montel, F.; Nême, A.; Leroux, J.B.; Jochum, C.; Parlier, Y. Measured Performance of a 50-m2 Kite on a Trawler. In Proceedings of the 10th Symposium on High-Performance Marine Vehicles (Hiper), Technische Universitat Hamburg Harburg, Cortona, Italy, 17–19 October 2016; pp. 443–457. [Google Scholar]
  33. Group, I.Q.S. ITTC Symbols and Terminology List. Technical Report; International Towing Tank Conference, Copenhagen, Denmark. 2014. Available online: https://ittc.info/media/4004/structured-list2014.pdf (accessed on 2 September 2020).
  34. ISO 1151-1-4. Flight Dynamics—Concepts, Quantities and Symbols—Part 1: Aircraft Motion Relative to the Air; Technical Report; ISO: Geneve, Switzerland, 1988. [Google Scholar]
  35. Roncin, K.; Kobus, J.M.; Iackine, P.; Barré, S. Méthodologie pour la validation du simulateur de voilier par des essais en mer, une première tentative. In Proceedings of the Workshop Science-Voile, Ecole Navale, Lanveoc-Poulmic, France, 3–4 May 2005; pp. 1–10. [Google Scholar]
  36. Mestayer, P.G.; Calmet, I.; Herlédant, O.; Barré, S.; Piquet, T.; Rosant, J. A Coastal Bay Summer Breeze Study, Part 1: Results of the Quiberon 2006 Experimental Campaign. Bound.-Layer Meteorol. 2018, 167, 1–26. [Google Scholar] [CrossRef]
  37. Fagiano, L.; Zgraggen, A.U.; Morari, M.; Khammash, M. Automatic crosswind flight of tethered wings for airborne wind energy: Modeling, control design and experimental results. IEEE Trans. Control Syst. Technol. 2014, 22, 1433–1447. [Google Scholar]
  38. Messager, C. Rapport-2017-ENSTA-01; Technical Report; EXWEXs: Brest, France, 2017. [Google Scholar]
  39. Skamarock, W.; Klemp, J.; Dudhi, J.; Gill, D.; Barker, D.; Duda, M.; Huang, X.Y.; Wang, W.; Powers, J. A Description of the Advanced Research WRF Version 3; Technical Report; National Center for Atmospheric Research: Boulder, CO, USA, 2008. [Google Scholar] [CrossRef]
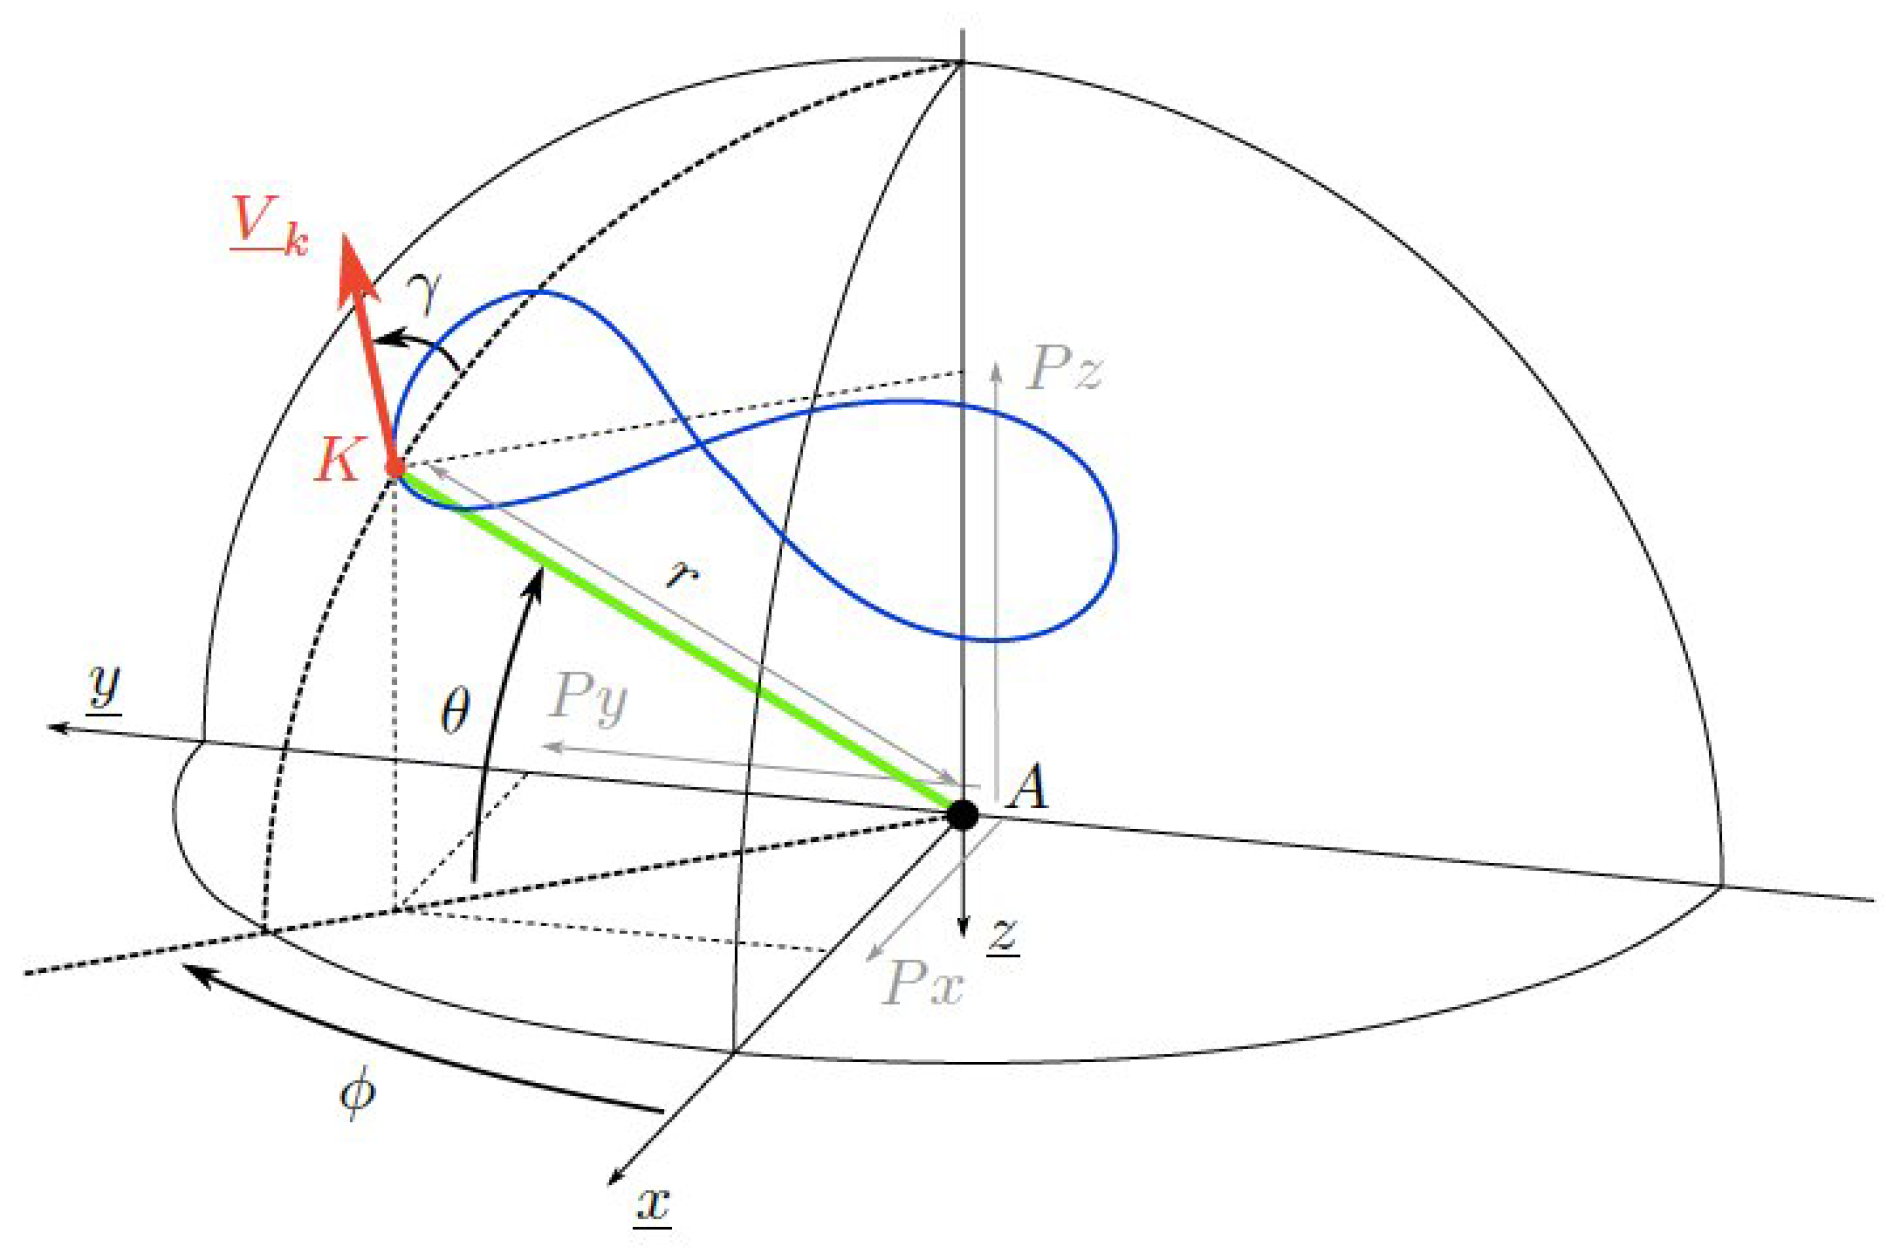
Figure 1. Drawing of the two kite positioning systems: cartesian or spherical. The axis system used for positioning the kite can vary depending on application.
Applsci 10 06148 g001
Figure 2. (a) Kiteboat wind measurement experimental set-up based on three sonic anemometers located at different altitude above sea level. (b) Overview of the plywood structure of the kiteboat.
Applsci 10 06148 g002
Figure 3. Drawing of the North East Down R n e d reference frame.
Applsci 10 06148 g003
Figure 4. Fixed wind measurement points deployed. Picture (a) shows the 4 measurement platforms. Picture (b) shows position of the 4 measurement points during trials (white circle); the central one is always occupied by the platform fitted with the 3-anemometer mast (on the right in picture (a)); the external locations are occupied by the others fitted with single-anemometer masts. The red circle shows the limit of the area of measurement (0.7 NM radius).
Applsci 10 06148 g004
Figure 5. Drawing of the relative wind reference frame R w r . The y w r -axis and z w r -axis are the result of a double rotation of angles ( χ w r , ζ w r ) , according to the Euler convention, applied to the heading reference frame R ψ .
Applsci 10 06148 g005
Figure 6. Drawing of the aerodynamic reference frame R a . Kite tethers and kite attachment point are not necessarily contained in the plane of the figure.
Applsci 10 06148 g006
Figure 7. Overview of the experimental set-up when deployed on the kiteboat.
Applsci 10 06148 g007
Figure 8. (a) Beyond the sea ® Switch blade (2016 model) kite, (b) Cabrinha ® Switch blade (2016 model).
Applsci 10 06148 g008
Figure 9. Spatial domains of the modelling used to predict the wind above the sailing area, from the wider (a) to the closer (e) (Source: EXWEXs [38]).
Applsci 10 06148 g009
Figure 10. Example of wind speed profile (a), wind direction profile (b) and vertical wind speed profile (c), calculated by the weather modelling during the 29th of March, and outputted at the location of the center measurement platform (time (UTC) of each profile depends on color, and is denoted by the colorbar). The magenta line on plot (a) denotes the International Towing Tank Conference (ITTC) profile, calculated from the average wind of all profile at 20 m during the period.
Applsci 10 06148 g010
Figure 11. Kite trajectory during a downwind run in black. The yellow triangle denotes the kiteboat position, and the magenta arrows give the orientation of the true wind. The trajectory processed by the phase-averaging method is colored in order to show the kite force with respect to its position.
Applsci 10 06148 g011
Figure 12. Comparison between the wind measurements of the three on-board sensors (a). The average value of the true wind speed during the run is plotted for each one (b), and compared to the power law calculated from the WindMaster measurement at 5.5 m.
Applsci 10 06148 g012
Figure 13. Evolution of the roll (a) and pitch (b) angles for all the runs achieved with the kite only.
Applsci 10 06148 g013
Figure 14. Polar of the kiteboat in the most used configuration (Kite Cabrinha ® 12 m 2 , Tether length 50 m, Black daggerboard, Kite attachment point at 2.68 m, No motor). Port side and starboard runs were set together, but marker type (square or triangle) allows the identification.
Applsci 10 06148 g014
Figure 15. (a) Impact of the daggerboard choice on speed performances of the kiteboat according to the true wind angle (true wind speed from 4.5 to 6 m/s). (b) Overview of the running resistance curve of the kiteboat built from all runs completed during the trials. The colors are based on the kite used during each race. The black line denotes the best quadratic fitting applied on the entire cloud of points.
Applsci 10 06148 g015
Figure 16. Effects of the daggerboard choice on roll (a) and pitch (b) angles of the kiteboat, according to the true wind angle.
Applsci 10 06148 g016
Figure 17. (a) Back tether ratio for the three kites. (b) Power ratio according to the true wind angle, for two different kites.
Applsci 10 06148 g017
Figure 18. Results of the phase-averaging process applied to a downwind run (case d05f4). (a) elevation and azimuth of the kite. (b) tension on back tethers and back tether ratio. (c) lift coefficient and lift to drag ratio of the kite. (d) attitude and speed of the boat.
Applsci 10 06148 g018
Table 1. Major variables recorded during runs.
Information Related to the BoatInformation Related to kIte Data
Symb.DetailsSymb.Details
(COG)Course Over Ground F ̲ m Front tether force vector
V s Speed of the boat F b l Left back tether force
ψ Heading of the boat (HDG) F b r Right back tether force
θ s Pitch angle of the boat λ 1 Position of actuator 1 (left)
ϕ s Roll angle of the boat λ 2 Position of actuator 2 (right)
δ r Rudder angle
Table 2. Domains, Resolutions and Scales implemented in the WRF 3.8.1 modelling applied to the France zone up to the zoom on Quiberon.
DomainsD01D02D03D04D05
Horizontal resolution8910 m2970 m990 m330 m110 m
Vertical resolution (0–300 m altitude)20 m20 m20 m20 m20 m
Modelling scaleMesoSubmesoSubmesoLESLES
Table 3. Relevant quantities taken out from the ten runs suitable with the phase-averaging method. Angles are given in degrees, and the steering amplitude is given in meter. The blue line denote the case which is plotted in Figure 11 and Figure 18. Additional data is available in Appendix A.
CaseKite β WT r prop r a r b r s δ R ψ ϕ s θ s δ C k ϕ θ
d01f7Cab. 51370.761.280.200.1312.12.44.71.30.754.349.322.7
d02f5Cab. 121820.470.900.190.118.23.11.50.80.874.869.610.1
d02f6Cab. 121820.670.960.200.102.94.22.01.00.8512.957.910.1
d04f1Cab. 121830.620.950.220.094.13.91.60.60.664.050.97.0
d05f4Cab. 121790.691.120.200.114.22.81.90.50.9212.753.99.5
d07f12Cab. 121210.602.000.210.347.84.73.81.40.915.241.423.7
d07f18Cab. 122630.311.800.230.y3112.018.610.70.80.973.647.213.5
d08f1Cab. 121800.801.340.220.164.71.41.50.71.078.152.99.5
d10f8BTS2200.721.180.380.157.24.03.31.10.704.054.425.9
d11f4BTS1060.491.220.400.1412.96.24.01.90.733.251.121.7