Article

Experimental Study on Lining Cracking of Shallow Buried Loess Tunnel under the Simulation of Effect of Slide Surface Immersion

1
School of Civil Engineering, Chang’an University, Xi’an 710064, China
2
School of Highway, Chang’an University, Xi’an 710064, China
*
Author to whom correspondence should be addressed.
Appl. Sci. 2020, 10(17), 6080; https://doi.org/10.3390/app10176080
Submission received: 26 July 2020 / Revised: 15 August 2020 / Accepted: 19 August 2020 / Published: 2 September 2020
(This article belongs to the Section Civil Engineering)

Abstract

:

Featured Application

The findings of this study can provide a useful reference for the reinforcement design of cracked lining of the operating tunnel, and help to evaluate the long-term safety of tunnel structures.

Abstract

The water immersion of surrounding rock slide surface causes lining cracking of the shallow buried loess tunnel, and different types of slide surface and different immersion degrees have different effects on secondary lining. In this paper, four types of slide surfaces for shallow buried loess tunnel are proposed. In order to find out the characteristics and laws of lining cracking under the effect of slide surface immersion, a loading model test with a large geometric similarity ratio of 1:10 was carried out. The test results show that the immersion of the slide surface has the most significant influence on the deformation of the lining vault and the arch waist, and the value and speed of the vault deformation are always the largest. When the unilateral slide surface is immersed in water, the lining cracking is concentrated on the flooded side of the slide surface, and the appearance of compressive cracks can be regarded as a precursor of lining instability. In the direction of lining thickness, the cracks always begin to develop from I-type, then gradually develop into L-type, and finally develop to Y-type, among which the number of L-type cracks is the most. Furthermore, the residual bearing capacity of cracked lining is also discussed.

1. Introduction

The excavation of a shallow buried loess tunnel causes changes and adjustments of the stress state of the overlying stratum in varying degrees. The construction deformation forms longitudinal cracks on the ground surface on both sides of the tunnel centerline in a short time. The cracks incline to the centerline line of the tunnel in the form of a curved surface in the depth direction and form a settlement grooves within a specific range of the stratum [1,2]. The soil in the groove is wedge-shaped and tends to slide toward the excavation free surface. When the tensile or shear stress of the slide trend surface is greater than the soil strength, the actual surrounding rock slide surface of the shallow loess tunnel forms [3]. The slide surface is the most critical feature of the shallow buried loess tunnel, which provides a fast channel for the surface water infiltration [4], and the deepest slip surface can reach near the tunnel lining. The water immersion softens the loess around the slide surface, resulting in the mechanical property decays rapidly with the increase of the sinking tendency of sliding wedge, which may cause the loads on the support structure and the deformation to increase. In severe cases, the secondary lining may crack and fall off [5]. The flooding of the slide surface is bound to have a significant impact on the appearance and development of cracks.
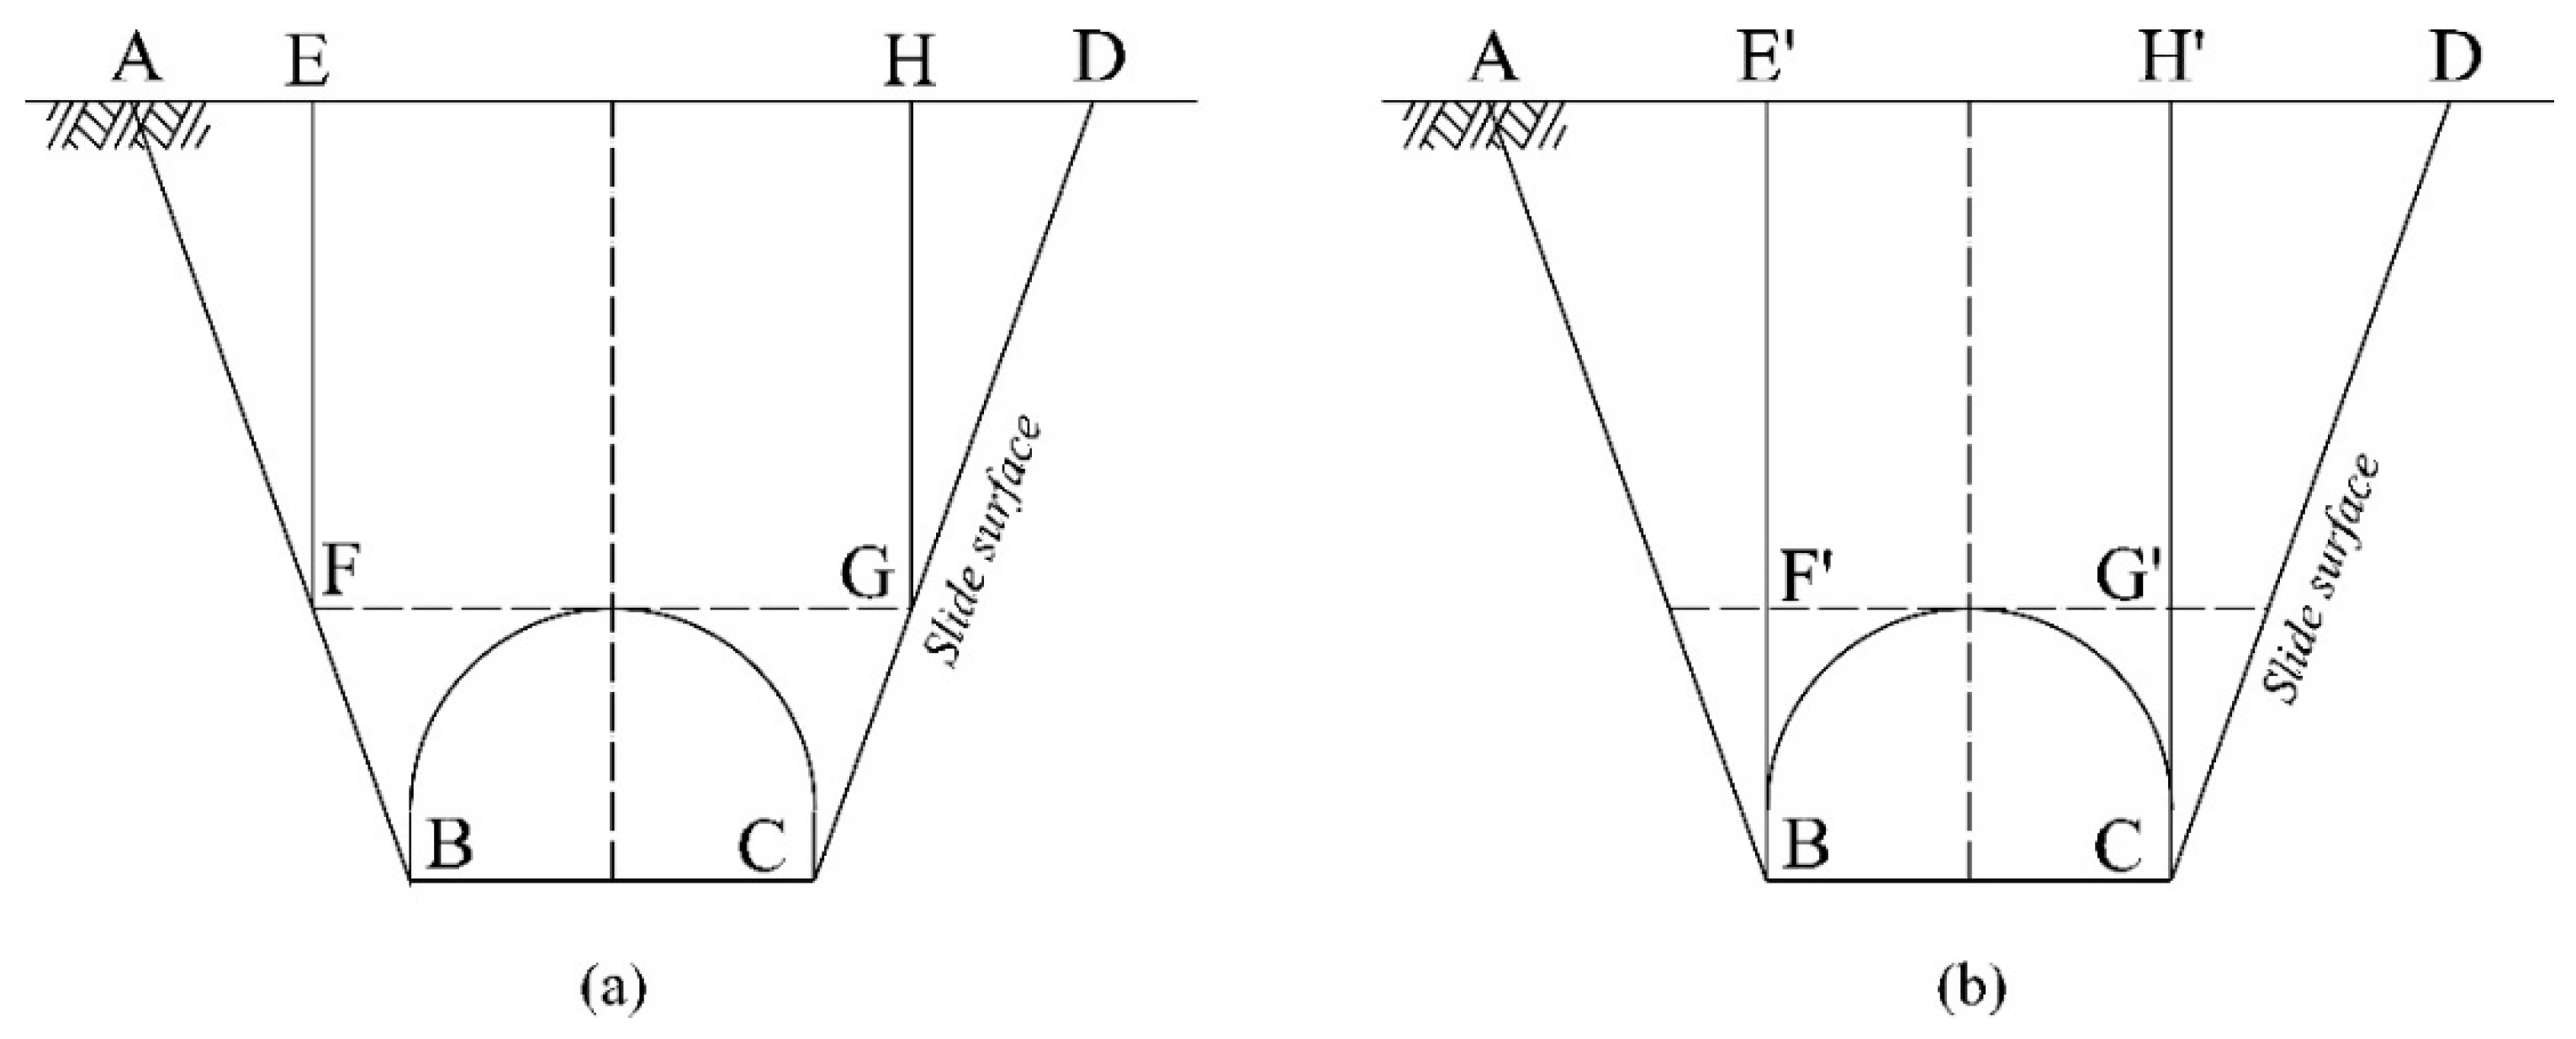
The slide surface is significant in the calculation of the surrounding rock pressure of a shallow buried tunnel. It is generally believed that the weight of the subsidence soil inside the slide surface is the primary source of the surrounding rock pressure. K. Terzaghi believes that the combined force of the self-weight of the largest block EFGH inside the slide surfaces AB and CD, and the friction force on the EF and HG are the vertical surrounding rock pressure [6], as shown in Figure 1a. A. Bierbaumer believes that the vertical surrounding rock pressure is the combined force of the self-weight of the overlying block E’F’G’H’ and the friction in the E’F’ and G’H’ [7], as shown in Figure 1b. The weight and resistance of the subsidence soil determine the pressure of the surrounding rock. The shape and position of the slide surface determine the size of the subsidence soil and the resistance.
The uneven settlement of the overlying stratum of the tunnel is the root cause of the slide surface. Different engineering properties of loess, construction methods, and topographical features will lead to different deformation characteristics and laws [8]. The corresponding slide surface will be different. The type of slide surfaces in previous studies did not consider the influence of the construction methods and the topographical features. The first purpose of this paper is to propose new types of slide surfaces that are suitable for shallow buried loess tunnels, considering the influence of the construction methods and topographic features.
The strength of the flooded loess decreases significantly, and the water is the most common cause of the large deformation and the cracking of the lining. The field monitoring results show that when the water content of Q2 loess stratum increases from 16.6% to 20.5%, the settlement rate of tunnel arch increases by 9.6 times [9], and the surrounding rock pressure as well as the secondary lining pressure of the arch increase sharply. The lining cracks are mainly distributed in the arch and the sidewall. The arch cracking is the most serious, which precedes the sidewall [10].
Research has been carried out on the influence of water immersion of surrounding rock on the lining structure of loess tunnels. For the collapsible loess tunnels, the vertical settlement of the lining caused by the rise of the groundwater level is higher than what caused by surface water infiltration without considering the slide surface [11]. When the deformation of the loess tunnel foundation increases after immersion, the tensile stress of the vault in the flooded section decreases, and the pressure stress of the sidewall increases significantly near the flooded section [12]. During the surface water infiltration process, the base pressure of the arch foot increases, whose settlement develops. The arch shoulder and the arch waist of the secondary lining are under compression, and the vault is under tension [13]. The previous research about loess tunnel immersion mainly focused on immersion of surface and foundation without considering the slide surface as a transport channel and storage place for surface water. No research has been conducted on the effect of slide surface infiltration on shallow buried loess tunnels.
Cracking of tunnel lining is a common phenomenon, of which 80% are caused by deformation, the rest are caused by loads [14]. The existing research about lining crack mainly involves two methods. One method is filed investigation with mathematical statistics to analyze the lining cracks, which reveals the distribution characteristics and laws of cracks as well as analyze the cracking grade and lining damage degree [15,16]. However, the test elements of the internal tunnel lining are prone to failure and cannot be monitored for a long time [17]. The field investigation of cracks is only a result analysis of the lining cracking, which is usually regarded as evaluation means of work performance. The other method is the numerical simulation, with which most research about causes of lining cracking is obtained [18]. Due to the limitation of the material constitution and other factors, it is difficult to research the entire process from lining cracking to lining instability with numerical methods. In contrast, the physical model test method can realize the whole process simulation of lining cracking and can provide the internal force and deformation of the lining at different cracking stages in detail. The second purpose of this paper is to study the cracking process and characteristics of the secondary lining with a physical model test, considering the immersion effect of the slide surface.
The paper proposes four types of slide surface of shallow buried loess tunnel, considering the influence of construction methods and stratum bias pressure. The immersion effect of the slide surface was simulated by applying the existing lining load to the lining model, and the value of the existing load on secondary lining caused by slide surface immersion was acquired by published studies [19]. Finally, a secondary lining loading model test with a geometric similarity ratio of 1:10 was carried out to analyze the development of lining cracks and the corresponding changes in the internal force. What is more, the morphology of the lining crack in the thickness direction and the bearing capacity of the cracked lining were also analyzed.

2. The Types of Slide Surface and the Influence of Immersion

2.1. Slide Surface in Shallow Buried Loess Tunnel

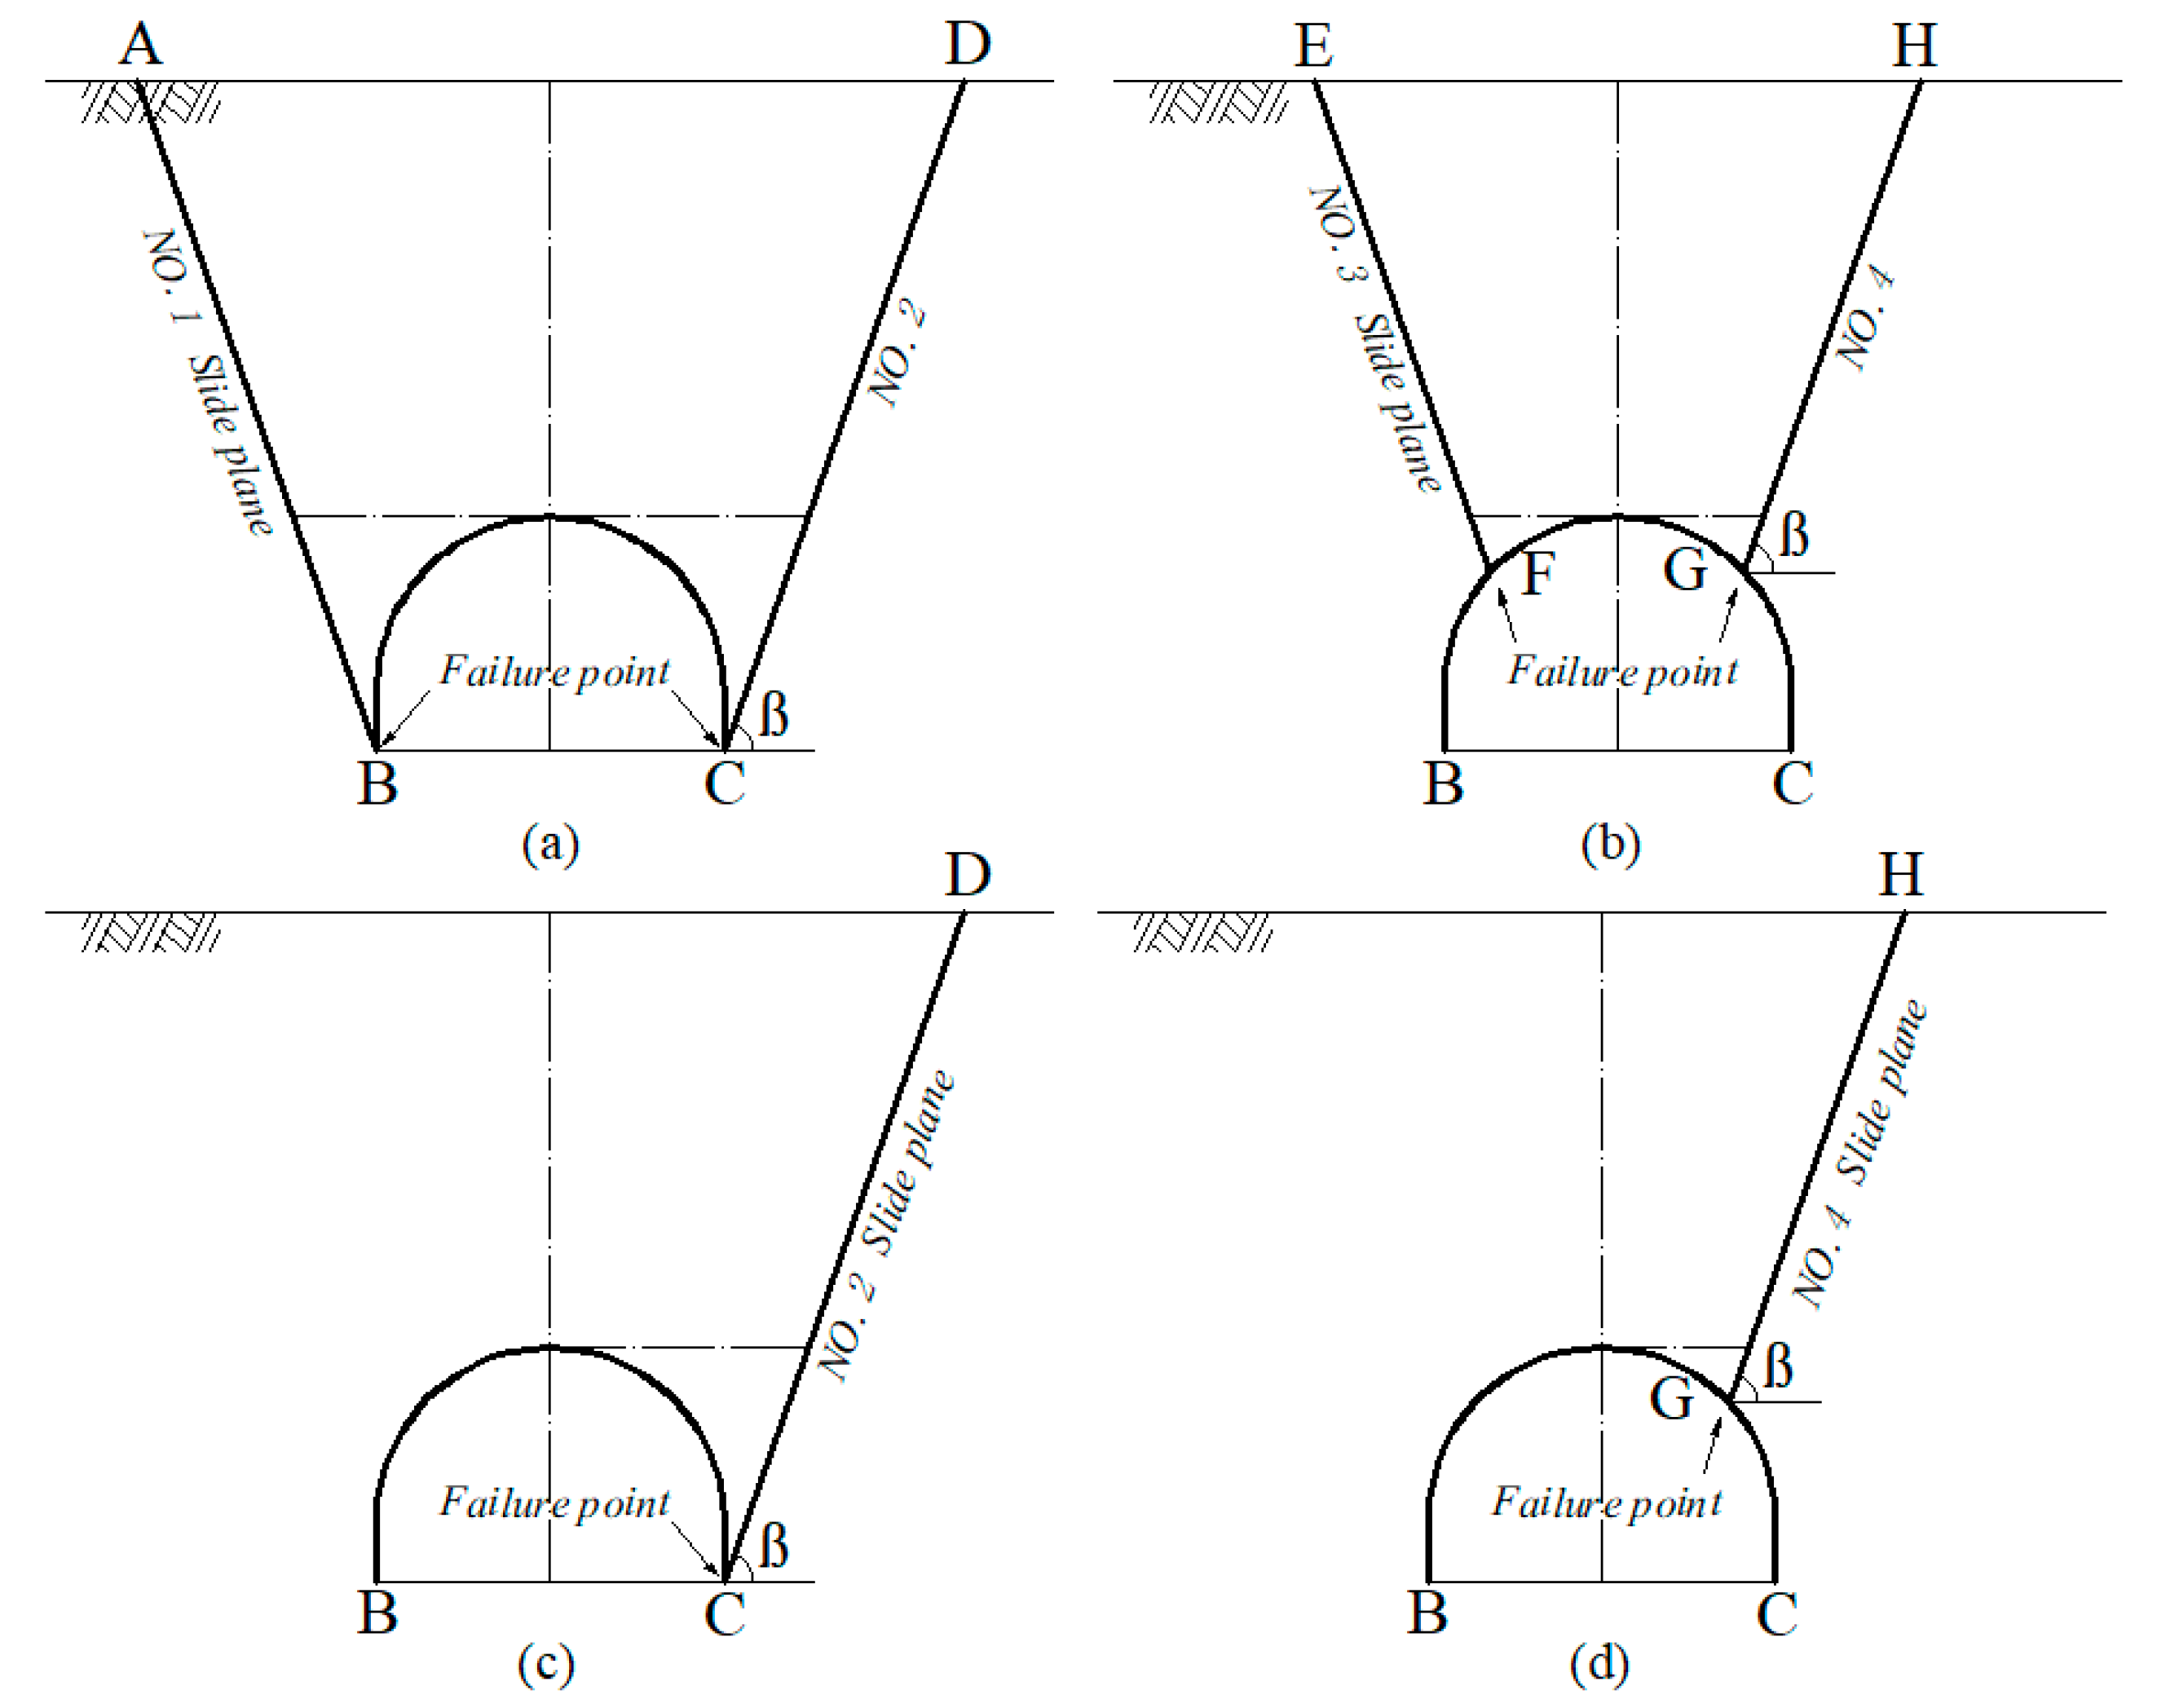
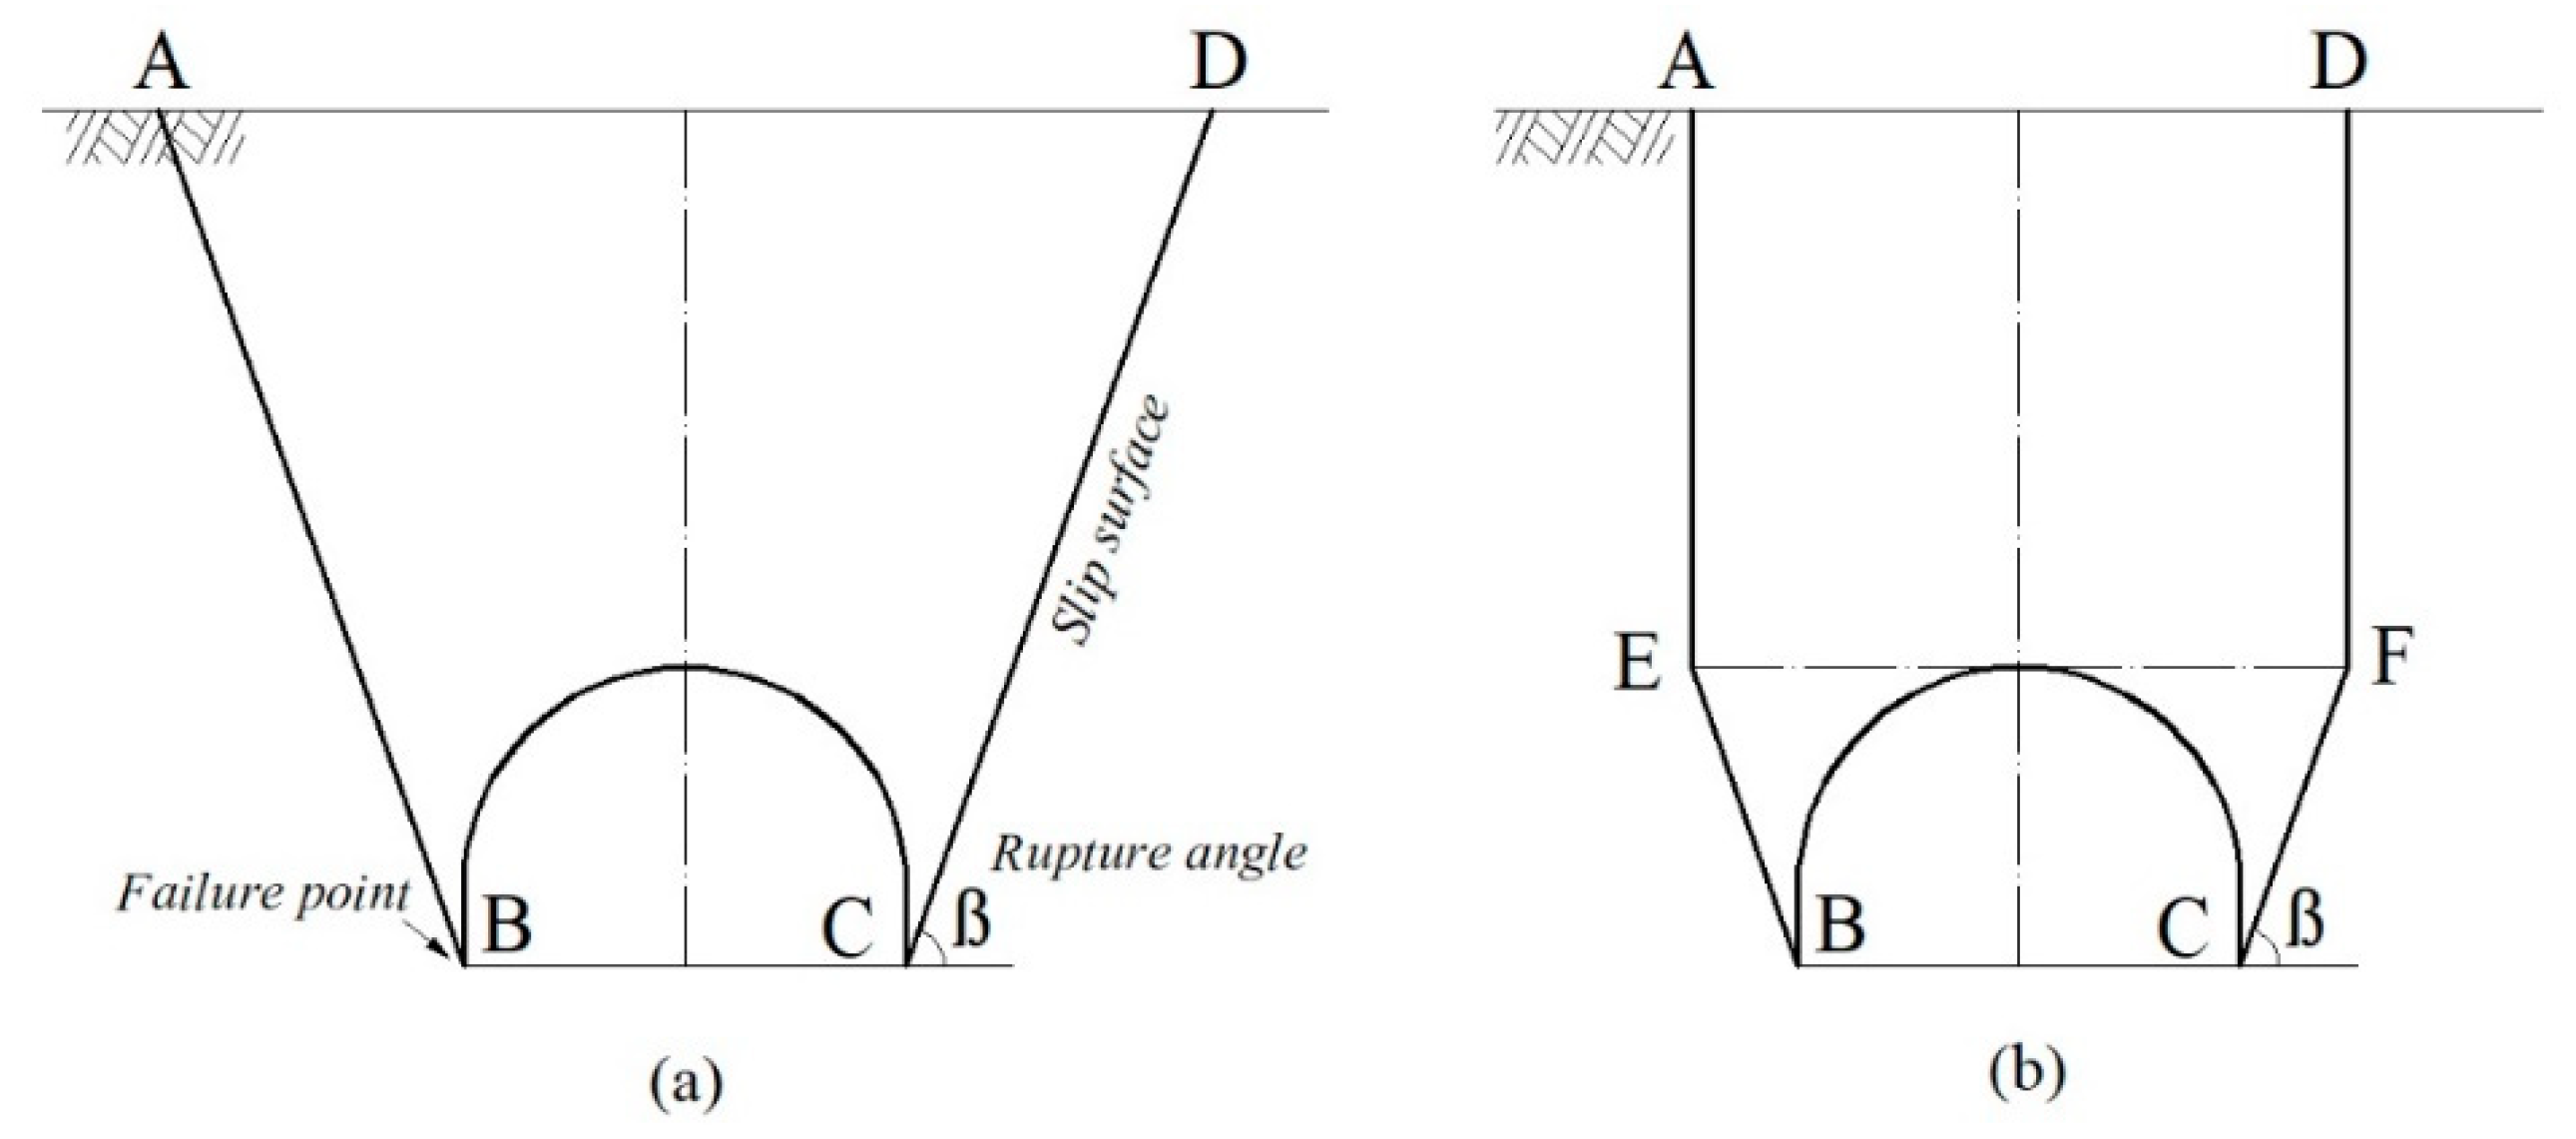
The characteristics of the surrounding rock slide surface of a shallow buried tunnel can be described with three factors of surrounding rock, namely, failure point, fracture angle β, and slide surface shape, as shown in Figure 2a. Table 1 illustrates the characteristics of three typical slide surfaces. As shown in Figure 2a, the first is the slide surface proposed by A. Bierbaumer and K. Terzaghi, whose failure point of the surrounding rock is located at the arch foot. The fracture angle β is 45° + φ/2, and the slide surface is an oblique line [7]. This slide surface is widely applied in the calculation of surrounding rock pressure [6]. The second is the slide surface proposed by Xie Jiaxiao, whose failure point of the surrounding rock is also located at the arch foot, and the shape of this slide surface is the same as the first slide surface. However, the failure angle needs calculating from the friction angle φc of surrounding rock and the friction angle θ of slide surface [20]. Considering the universal vertical joints in the loess, Yu Li et al. have put forward a different shape of slide surface [21], as shown in Figure 2b. The slide surface above the horizontal depth of the tunnel vault is vertical, the failure point of surrounding rock is still arch foot, and the slide surface is the broken line AEB and CFD. The fracture angle β can be calculated from the thickness H of the overlying loess, the tunnel excavation width B, and the friction angle φ of the loess.
The generation of the slide surface is closely related to the displacement of the overlying strata layer of the tunnel, and the magnitude and law of the overlying strata layer displacement are considerably different due to different tunnel construction methods [8]. Therefore, the influence of construction methods should be considered in the generation of the slide surface. To control the surrounding rock settlement effectively and avoid collapse, the loess tunnel generally adopts the partial excavation methods, such as the two-steps method, three-steps method, the center diagram method (CD), and the center cross diagram method (CRD), as shown in Figure 3; the number in the figure is the excavation sequence. The collapse boundary inside the tunnel can represent the location of the failure points of the slide surface. Table 2 shows the statistics relationship of construction methods and failure points of sixteen shallow buried loess tunnels, the relevant data are obtained from the literatures [22]. It can be seen that the collapse of surrounding rock is most common during the excavation of upper and lower steps. When the collapse occurs during the excavation of the upper or middle steps, the failure point is generally located near the arch waist, and the failure point caused by the lower step excavation is at the arch foot of the tunnel, as shown in Figure 3. Therefore, there are two possible locations for slide surface failure points in the shallow buried loess tunnel, which are the arch waist and the arch foot.
In addition, the difference in the buried depth at both sides of the tunnel is referred to as stratum bias, which is closely related to the location of the slide surface. Table 3 shows the statistics of the stratum bias and the location of the slide surface of the shallow buried section of twelve loess tunnels [22]. It can be seen from Table 3 that the slide surface under the stratum bias appears on one side of the tunnel, while the slide surface under the unbiased stratum is distributed on both sides of the tunnel. Therefore, there are two possibilities for the location of the slide surface, which are unilateral distribution and bilateral distribution.
The vertical joints of loess are usually well developed. The vertical crack of the Gaoqiao tunnel was surveyed with the pit exploration method, which was found to be at a value of 1.2 m [23]. The length of the vertical slide surface is much less than the tunnel buried depth, so the surface vertical slide surface can be ignored. The shape of the slide surface should still be represented by the oblique line.
In conclusion, considering the influence of construction methods and stratum bias, the new types of slide surface of shallow buried loess tunnel were proposed, which were summarized into the following four categories, as shown in Figure 4. The failure points of the slide surface may occur at the arch foot and the arch waist. Therefore, the first type of slide surface is the bilateral arch foot slide surface, including slide surfaces 1 and 2 (Figure 4a). The second type of slide surface is the bilateral arch waist slide surface, including slide surfaces 3 and 4 (Figure 4b). There are two possibilities of unilateral distribution and bilateral distribution of the slide surface location under the effect of stratum bias. The third type of slide surface is the unilateral arch foot slide surface, including the No. 2 slide surface (Figure 4c). The fourth type is the unilateral arch waist slide surface, including the No. 4 slide surface (Figure 4d).

2.2. Effect of Water Immersion of Slide Surface on Lining Load

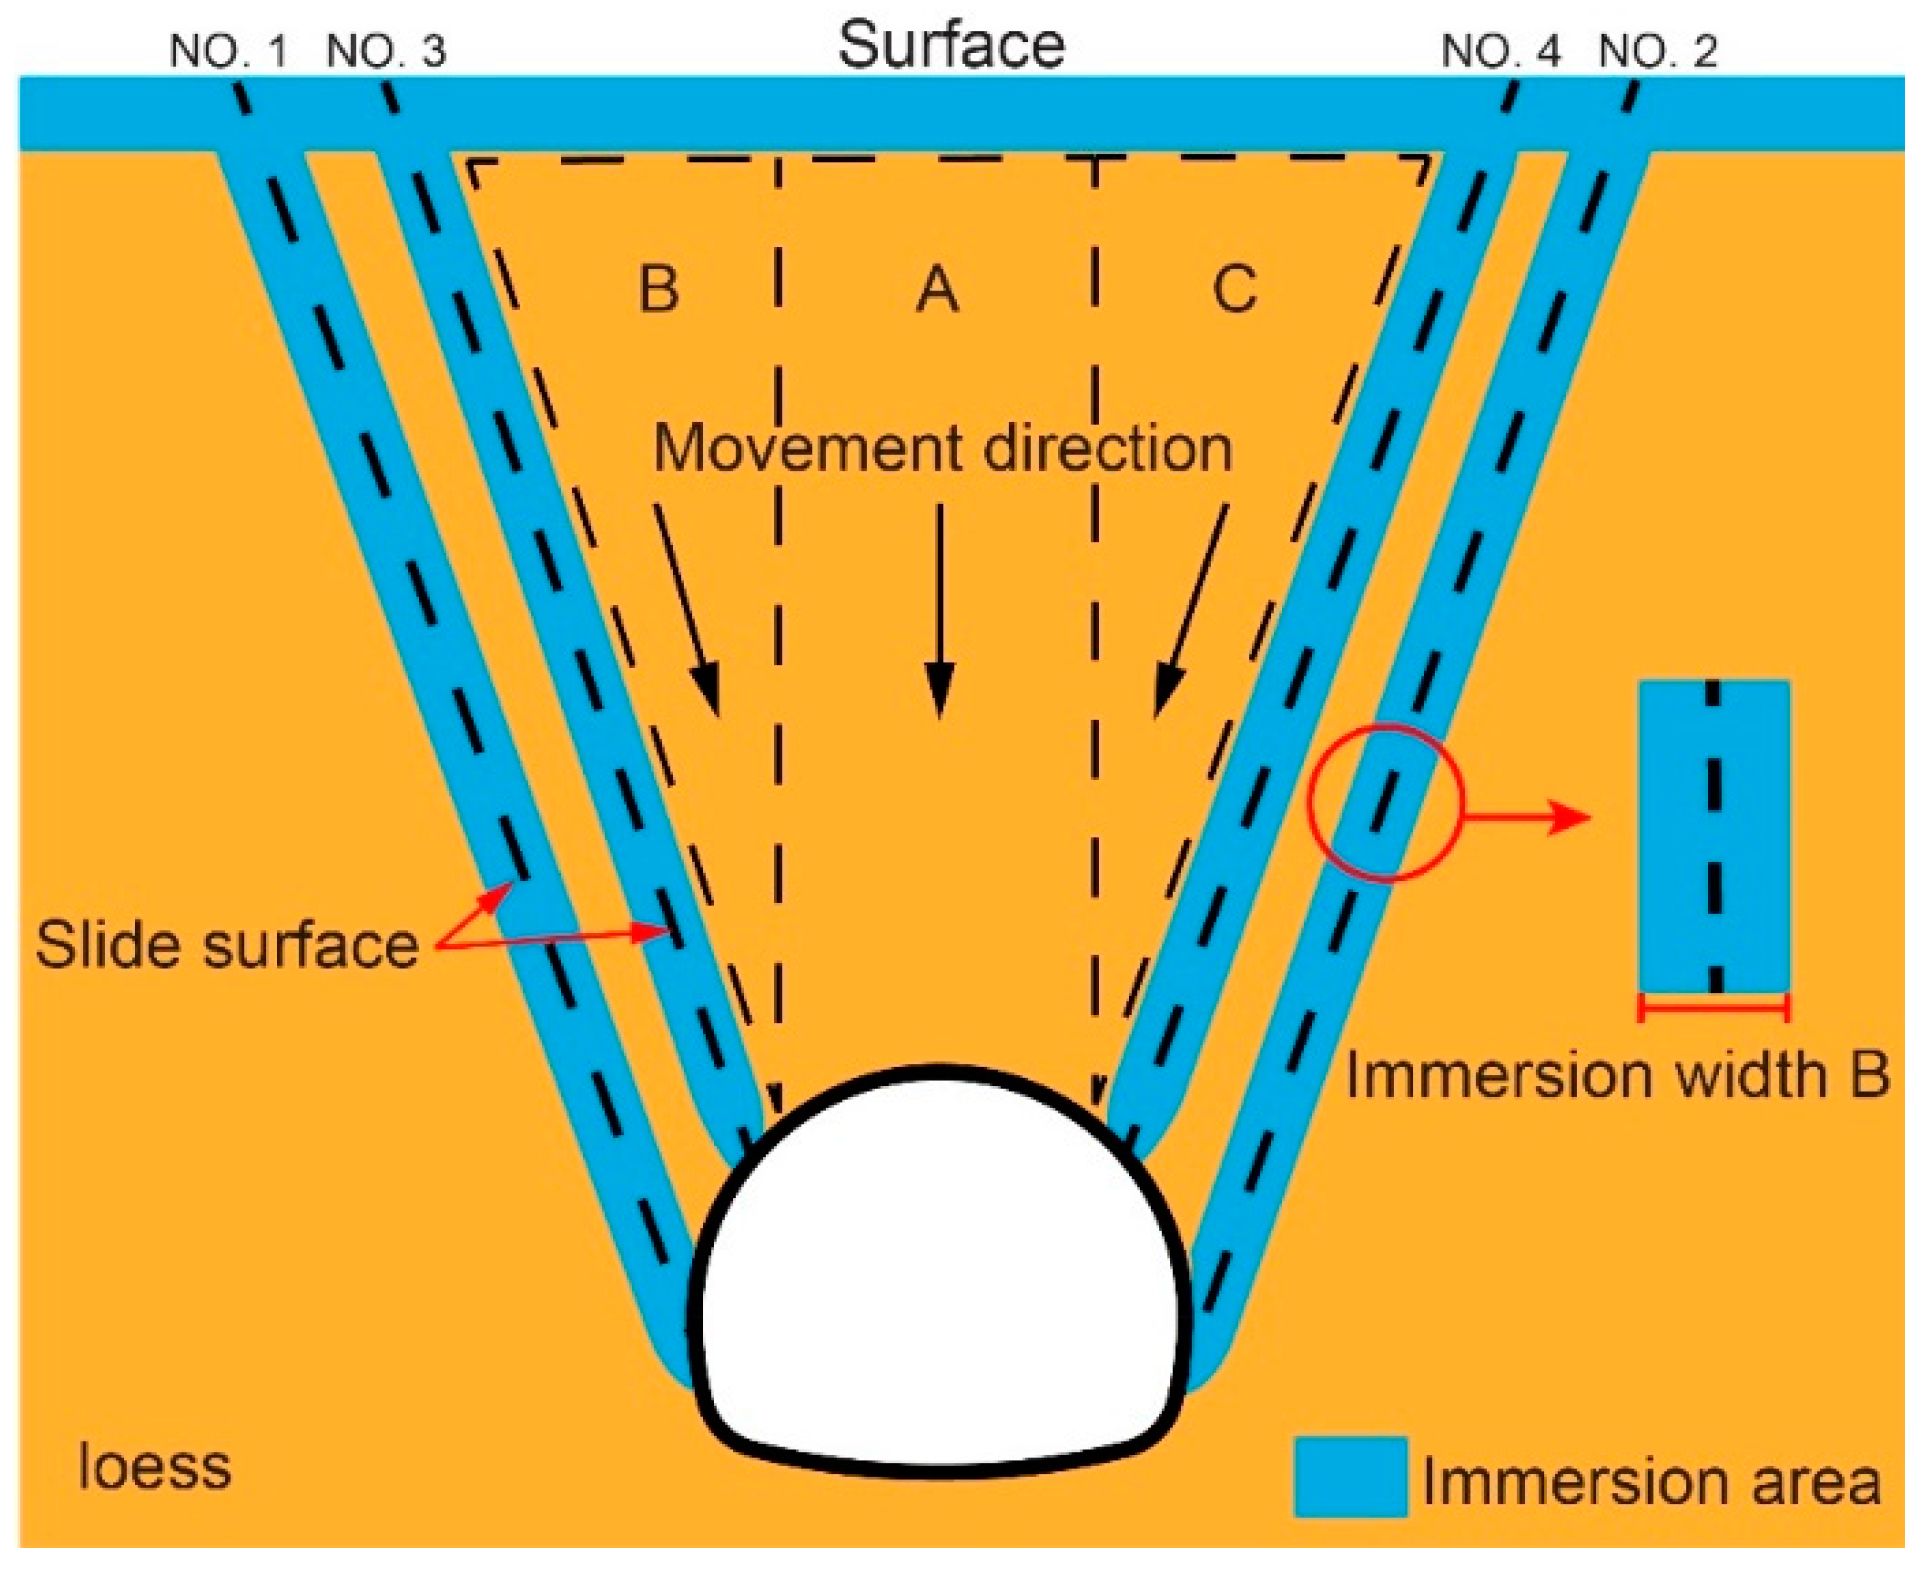
When the buried depth of the loess tunnel is shallow, the irrigation water and seasonal rainfall can infiltrate quickly along the slide surface to the vicinity of the lining structure, as shown in Figure 5. For illustrative purposes, four slide surfaces are all shown. The immersion range of the slide surface is characterized by the immersion width B. When the flood softens loess around the slide surface, and strength of the slide surface reduces. The vertical settlement of the tunnel overburden of regions A, B, and C causes an increased load and more significant deformation on the lining, leading to lining cracking in varying degrees [24]. From a qualitative perspective, there is a close relationship between the water infiltration of slide surface and the appearance of lining cracks, and the immersion width of the loess around the slide surface determines the value of the lining load.
According to previous reports, when the arch foot slide surface is flooded, the arch foot lining load surges. With the increase of the immersion width, the maximum load on the lining arch moves up from the lower end of the arch to the arch waist. When the arch waist slide surface is immersed, and the surrounding rock around the arch waist is softened by water, the load of the arch waist lining dissipated slightly. The immersion expansion of the slide surface causes the settlement of overlying loess, which leads to a rapid increase in the load of the vault and the arch shoulder, under the combined effect of arch load and stratum resistance of arch foot, the arch foot lining load increases. The author has published the load value of the secondary lining during the immersion expansion of the slide surface [19]. Slide surface immersion causes changes in the lining load. Therefore, applying this changing lining load on the lining model in the physical model test could indirectly simulate the effect of slide surface immersion. It should be noted that the theoretical calculation on the fracture angle of the slide surface is complicated, and the calculation results of the existing literature are quite different from the actual investigation results [25]. Therefore, the fracture angle of the slide surface involved in this paper is taken as 70°, which is the field measurement [11].

2.3. Engineering Overviews and Tunnel Cracks Distribution

The tunnel locates in a loess ridge in Gansu Province, China. The buried depth varies from 15 m to 96 m. According to the geological report, the stratum near the tunnel is composed of new loess of upper Pleistocene from the upper layer and old loess of middle Pleistocene from the lower layer. The stake number of the tunnel is K1841 + 075~K1842 + 530 and the longitudinal slope is + 1.8%. The primary support is shotcrete structure with a thickness of 20 cm, and the secondary lining is a molded concrete structure with a thickness of 40 cm.
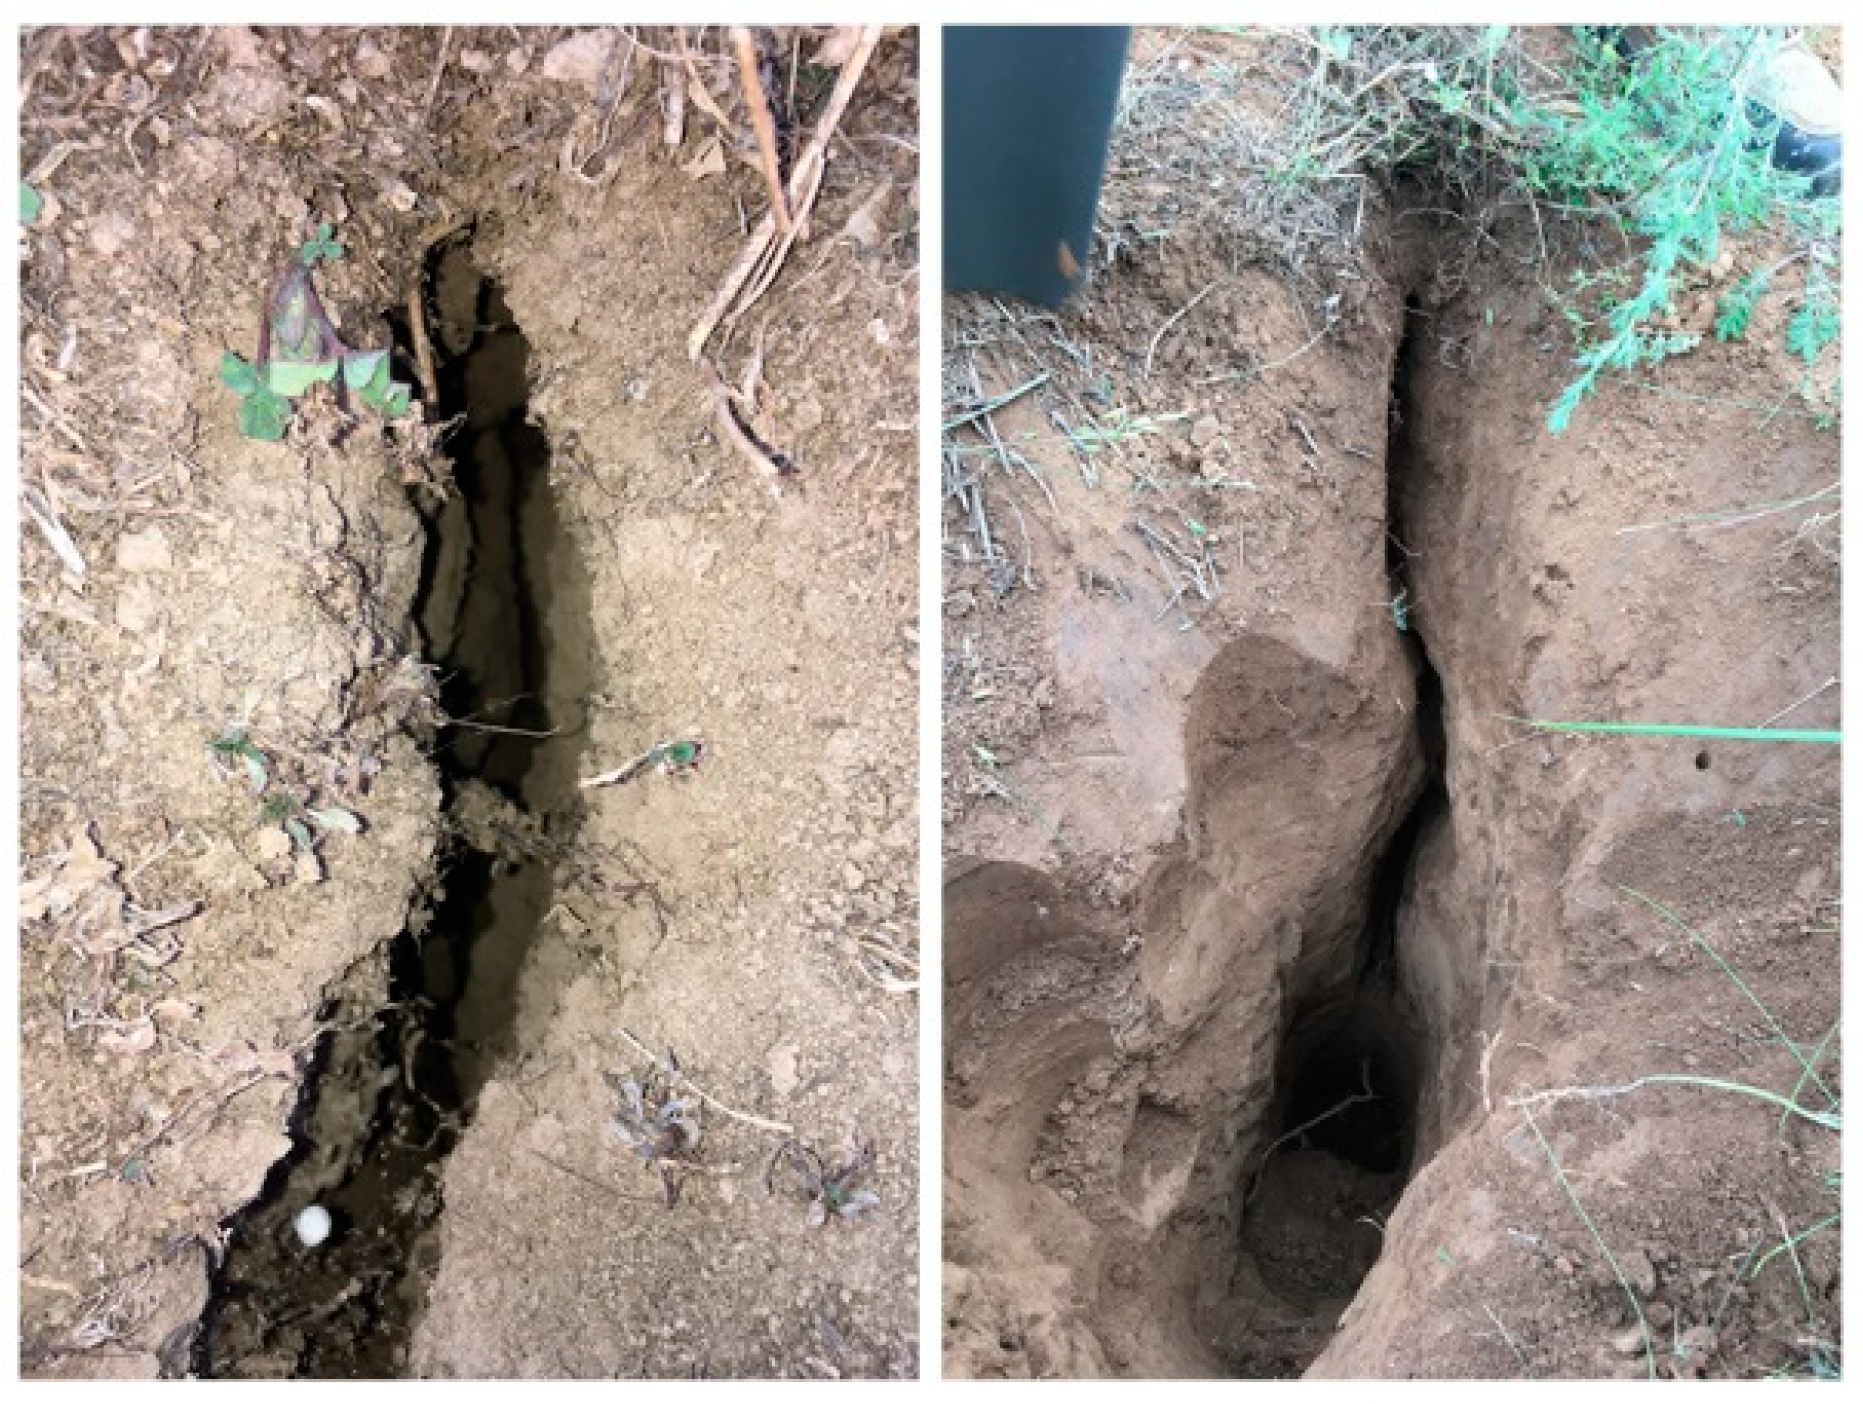
The field investigation shows that two ground cracks appears at the mountain surface (Figure 6), which is basically parallel to longitudinal direction of tunnel. The buried depth in the sections K1841 + 475~K1841 + 495 is 30 m, according to the field measurements, the slide surface of these sections are shown in Figure 7. The failure point is basically in arch waist, and the failure angles on both sides are 70° and 69°, respectively. The left ground crack is 16.16 m from the center line of the tunnel, and the right ground crack is 16.35 m from the center line of the tunnel. Due to improper treatment of surface cracks, the surface water infiltrated through the slide surface, leading to a saturation of loess around the slide surface. Unfortunately, the original design of tunnel support structure did not consider the influence of water immersion around the slide surface, which caused tunnel lining cracking.
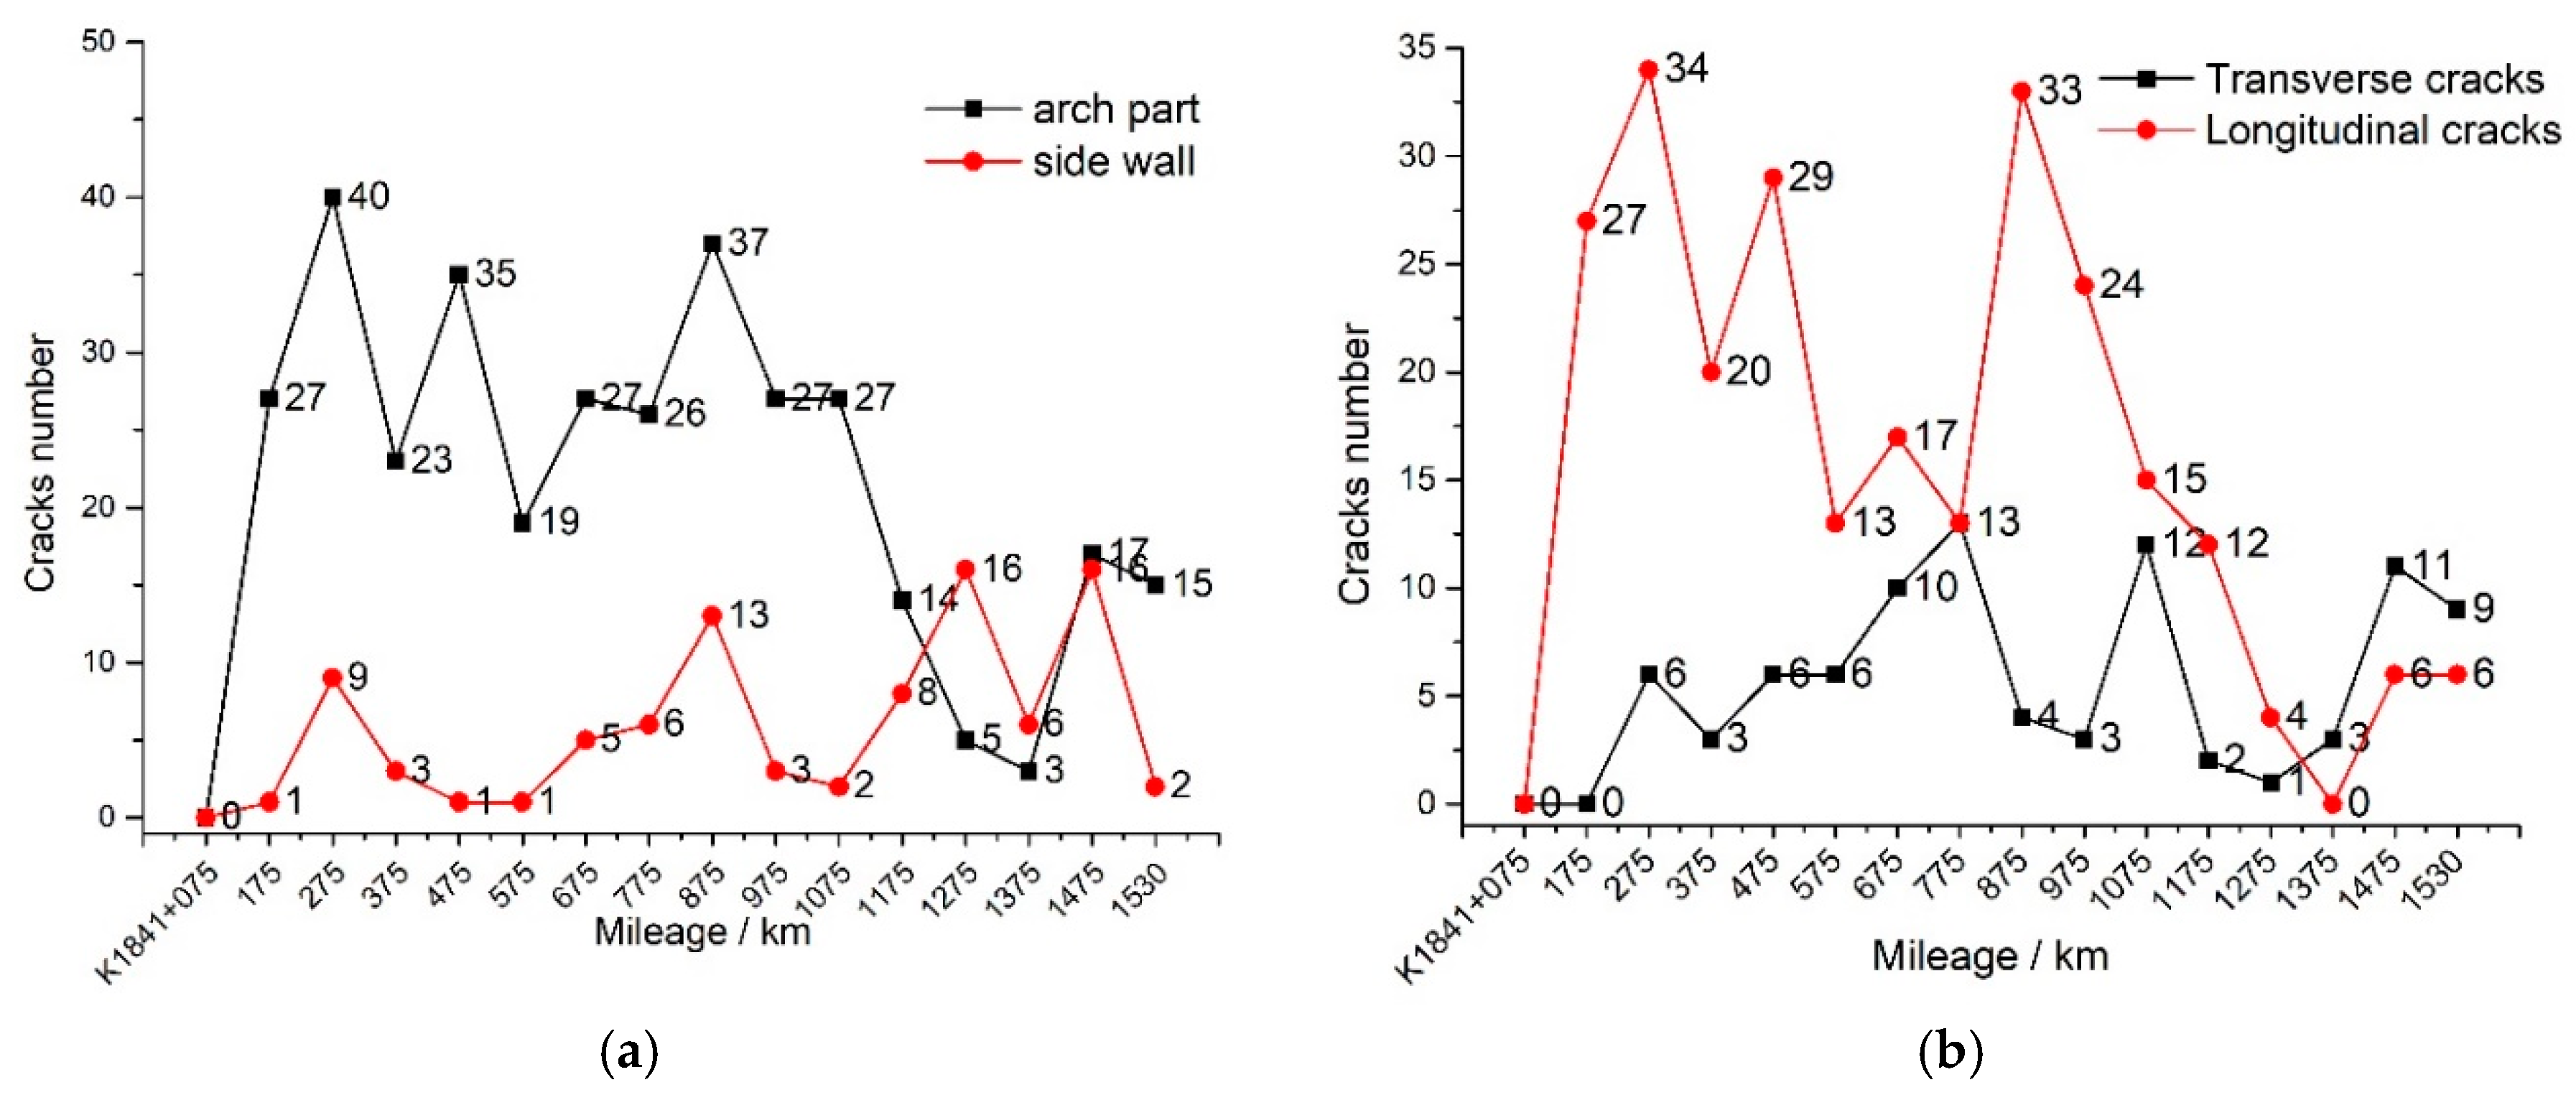
Figure 8 represents the number statistical of lining cracks along the longitudinal direction of tunnel. The Figure 8a shows that the cracks number in the arch part are significantly larger than that in the side wall, indicating that the lining arch is damaged more serious than the side wall. Through field investigation, the ground surface in the sections K1841 + 075~K1842 + 075 was almost farmland, and the ground surfaces in shallow buried section, like K1841 + 405~K1841 + 505, were observed (Figure 9). It should be noted that the buried depth in the section K1841 + 475~K1841 + 495 is 30 m, and the cracks distribution in these sections were compared with the test results to verify the reliability of the outcomes of the test. The Figure 8b shows that the number statistical of transverse and longitudinal lining cracks along the longitudinal direction of tunnel, indicating that the lining cracks are mainly longitudinal cracks. According to the Figure 8a, there are more longitudinal cracks in the arch part.

3. Test Equipment and Test Design

3.1. Test Equipment

The experiment adopted the multi-point independent loading test system for tunnel lining designed and developed by Chang’an University. The test system has fifteen sets of independent loading forces, which can simulate the load on fifteen tunnel lining locations. The test system can accurately load the tunnel lining at a low speed, which can realistically simulate the cracking behavior and deformation of the lining.
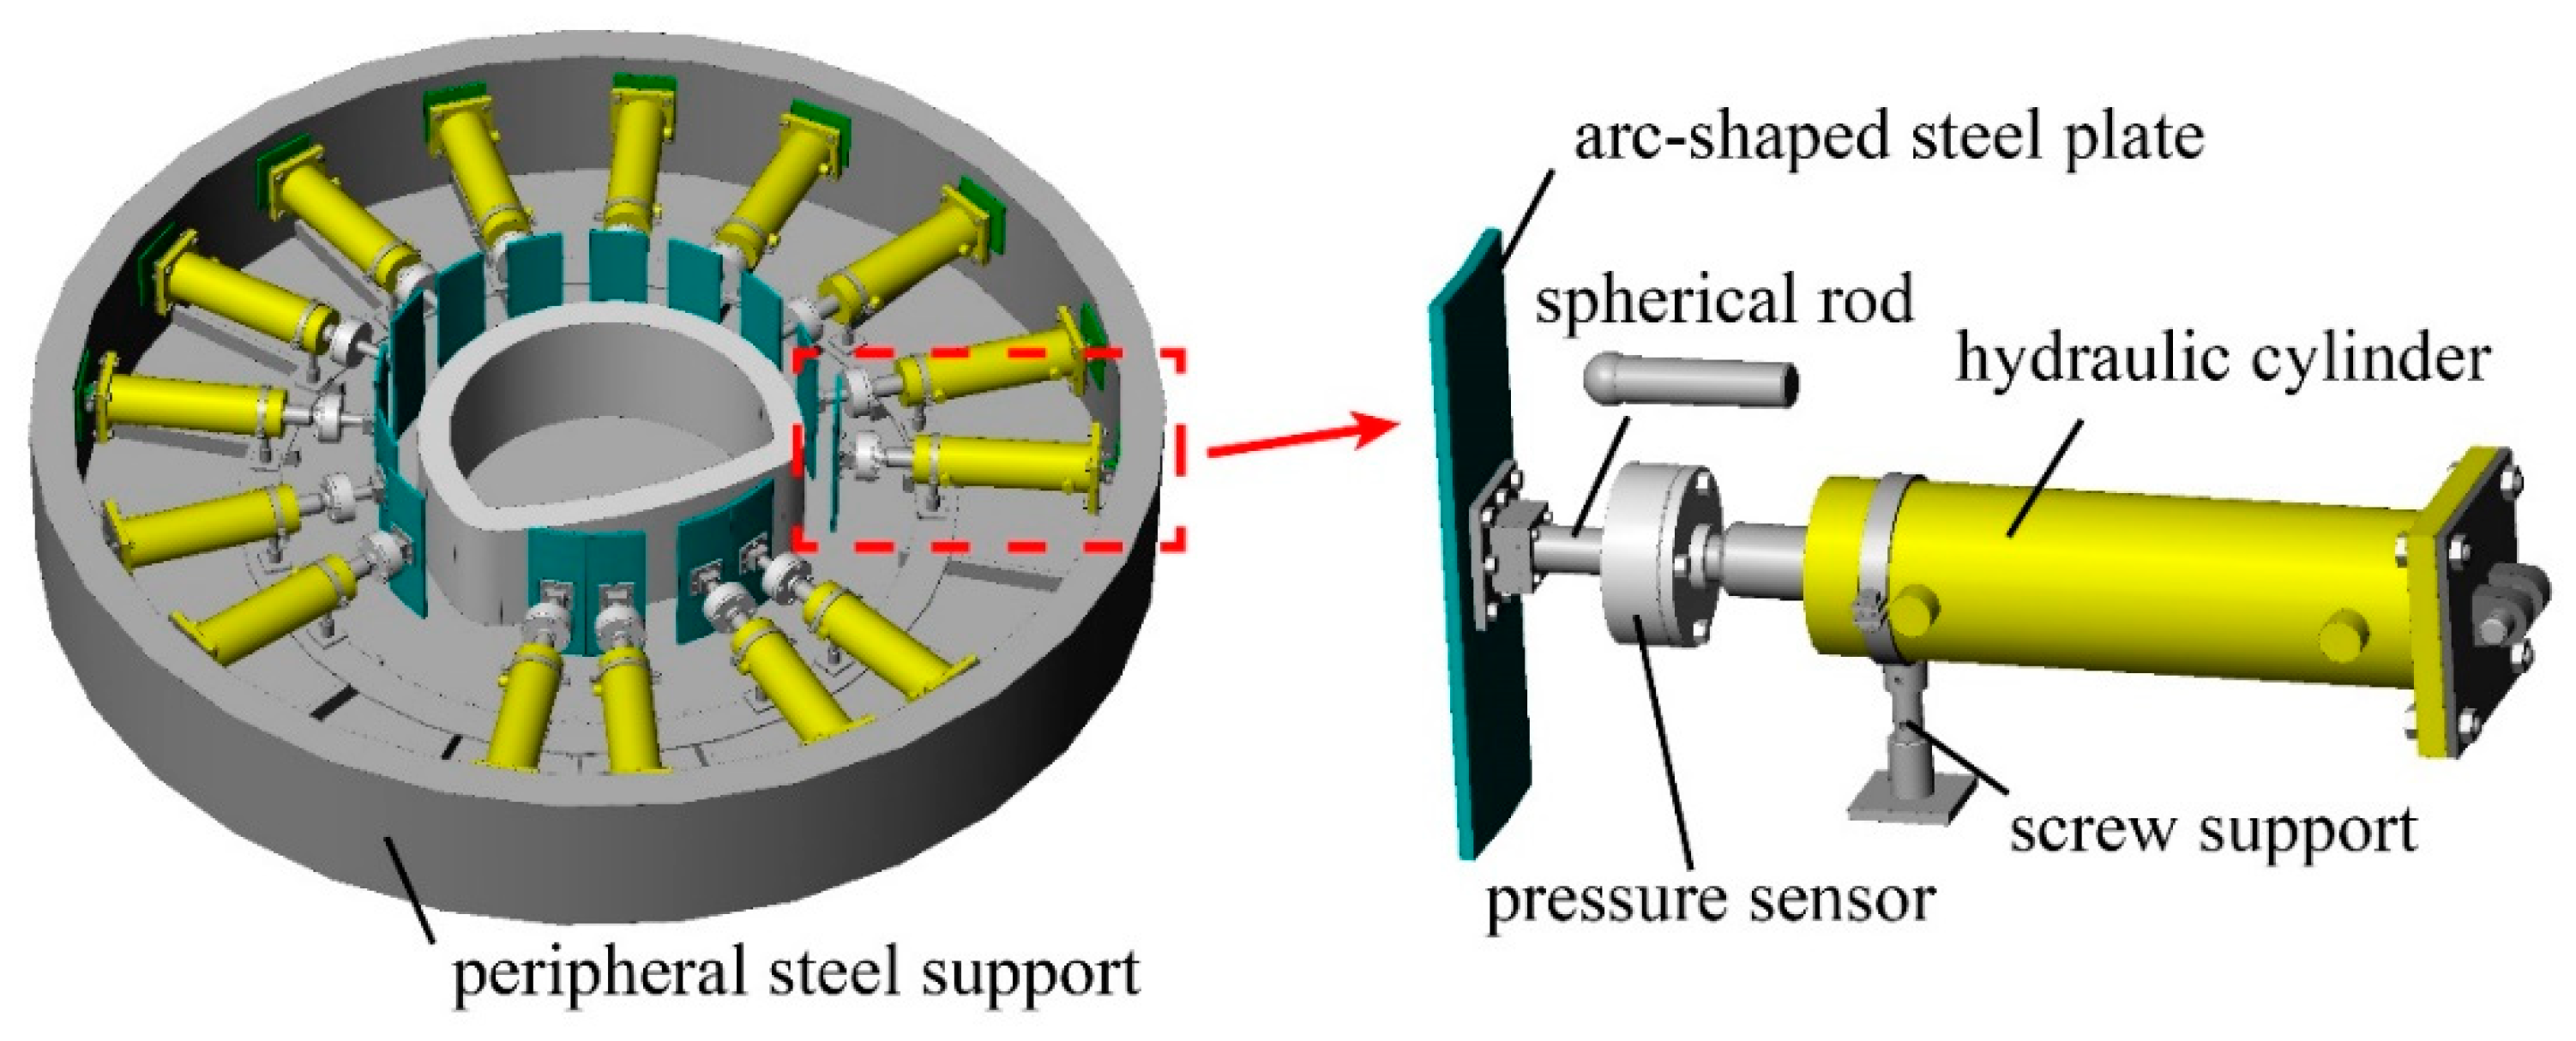
The test system is composed of three parts, namely, the drive system, the loading system, and the control system, as shown in Figure 10. The drive system receives the instructions from the control system, provides the required power for the loading system, and controls the loading speed to 0.5 mm/min. The loading system completes the loading action and transmits the actual load value to the control system in real-time. The control system compares the actual load value provided by the loading system with the load value target at a frequency of five times per second and gives the action command to the driving system. The test platform adopts the horizontal loading mode, ignoring the influence of the self-weight of the model on the test results. It is generally believed that the influence of lining self-weight can often be ignored compared with the influence of lining load on the stress and deformation of lining [26,27].
Figure 11 illustrates the overall design of the loading system, which is the core system. As can be seen, the loading system is mainly composed of fifteen sets of hydraulic cylinders, pressure sensors, spherical push rods, arc-shaped steel plates, and peripheral steel supports. Fifteen sets of hydraulic cylinders are symmetrically distributed on both sides of the lining model. The function and the performance parameters of each component are as follows. The stroke of the loading cylinder is 230 mm, and the maximum loading is 17.80 MPa. There is a deviation between the pressure inside the cylinder and the loading force. A pressure sensor with monitoring accuracy of 10 Pa is installed in the front section of the cylinder to monitor the load on the lining model accurately. The spherical push rod connects the pressure sensor and the arc-shaped steel plate to ensure that the lining load is always in the normal direction of the outer surface of the model lining. The height of the arc-shaped steel plate is 40 cm, and the arc length is 14 cm. The arc of the steel push plate is consistent with the arc of the outer surface of the lining, which is closely attached to the lining to avoid stress concentration. During the test, a 1 cm thick elastic rubber pad is added between the push plate and the lining model. The petroleum jelly is applied to the rubber pad to reduce friction and ensure that the load is evenly applied. The peripheral steel supports are welded with an 8 mm steel plate with internal ribs inside, whose rigidity is strong enough to ensure that the cylinder pressure will not be unloaded due to the deformation of the steel support.

3.2. Similarity Relationship and Similar Materials

The prototype secondary lining of the shallow buried loess tunnel was set to C25 concrete structure. The mechanical parameters of lining are based on actual engineering. The elastic modulus of 28.5 GPa, the ultimate compressive strength of 19 MPa, and the ultimate tensile strength of 2 MPa. The prototype tunnel is two-lane, of which cross-section is a three-centered circle, with a lining thickness of 0.40 m, a span of 11.80 m, and a height of 9.69 m.
In a scaled model test, the results reliability firstly depends on the similarity of geometric dimensions, and then on the similarity of similar materials. For the physical model test of tunnel lining, strict control of the geometric similarity is a necessary condition to reasonably and accurately reflect the characteristics of the lining prototype. The greater the geometric similarity ratio of the lining model, the smaller the difference in the bearing capacity between the lining model and the lining prototype [28,29]. Additionally, the width of the cracks changes with the size of the model, and the number of cracks also reduces as the size decreases. Existing experiments have pointed out that if the material properties meet the similar relationship, the influence of the model size on the model cracks can be ignored [30]. In this paper, the geometric similarity ratio CL = 10 is determined according to the model making ability and test system. Based on the geometric similarity ratio CL = 10, and the unit weight similarity ratio Cγ = 1, the elastic modulus and strength of the material are controlled to be similar. The other similarity is derived from the dimensional analysis method, as shown in Table 4.
In scaled model test of tunnel lining, it is very difficult for the similar material of lining to simultaneously satisfy the similarity relationships of elastic modulus, strength, and unit weight. In this paper, the similarity of the lining model materials only considers the similarity of elastic modulus and strength and does not consider the similarity of the unit weight. The gypsum and concrete are both brittle materials with relatively close properties. Their tensile strength is much less than the compressive strength, and their Poisson’s ratio is about 0.2. In addition, the Gypsum is easy to form model, and often recognized as a kind of good concrete-model material and widely used to conduct some laboratory experiments, as reported in previous studies [31,32,33]. By conducting a series of lab mixing proportion tests, it was found that when the mass ratio of gypsum to water is 1:1, the elastic modulus of the gypsum specimen is 2.73 GPa, the compressive strength is 2.02 MPa, and the tensile strength is 0.22 MPa. Therefore, the similarity ratio of elastic modulus is CE = 28.5/2.73 = 10.4 ≈ 10, and the similarity ratio of strength is CR = (19.0/2.02)/(2.0/0.22) = 9.4/9.1 ≈ 1, meeting the requirements of similar accuracy and scaling laws.

4. Experiment Procedure

4.1. Model Making and Monitoring

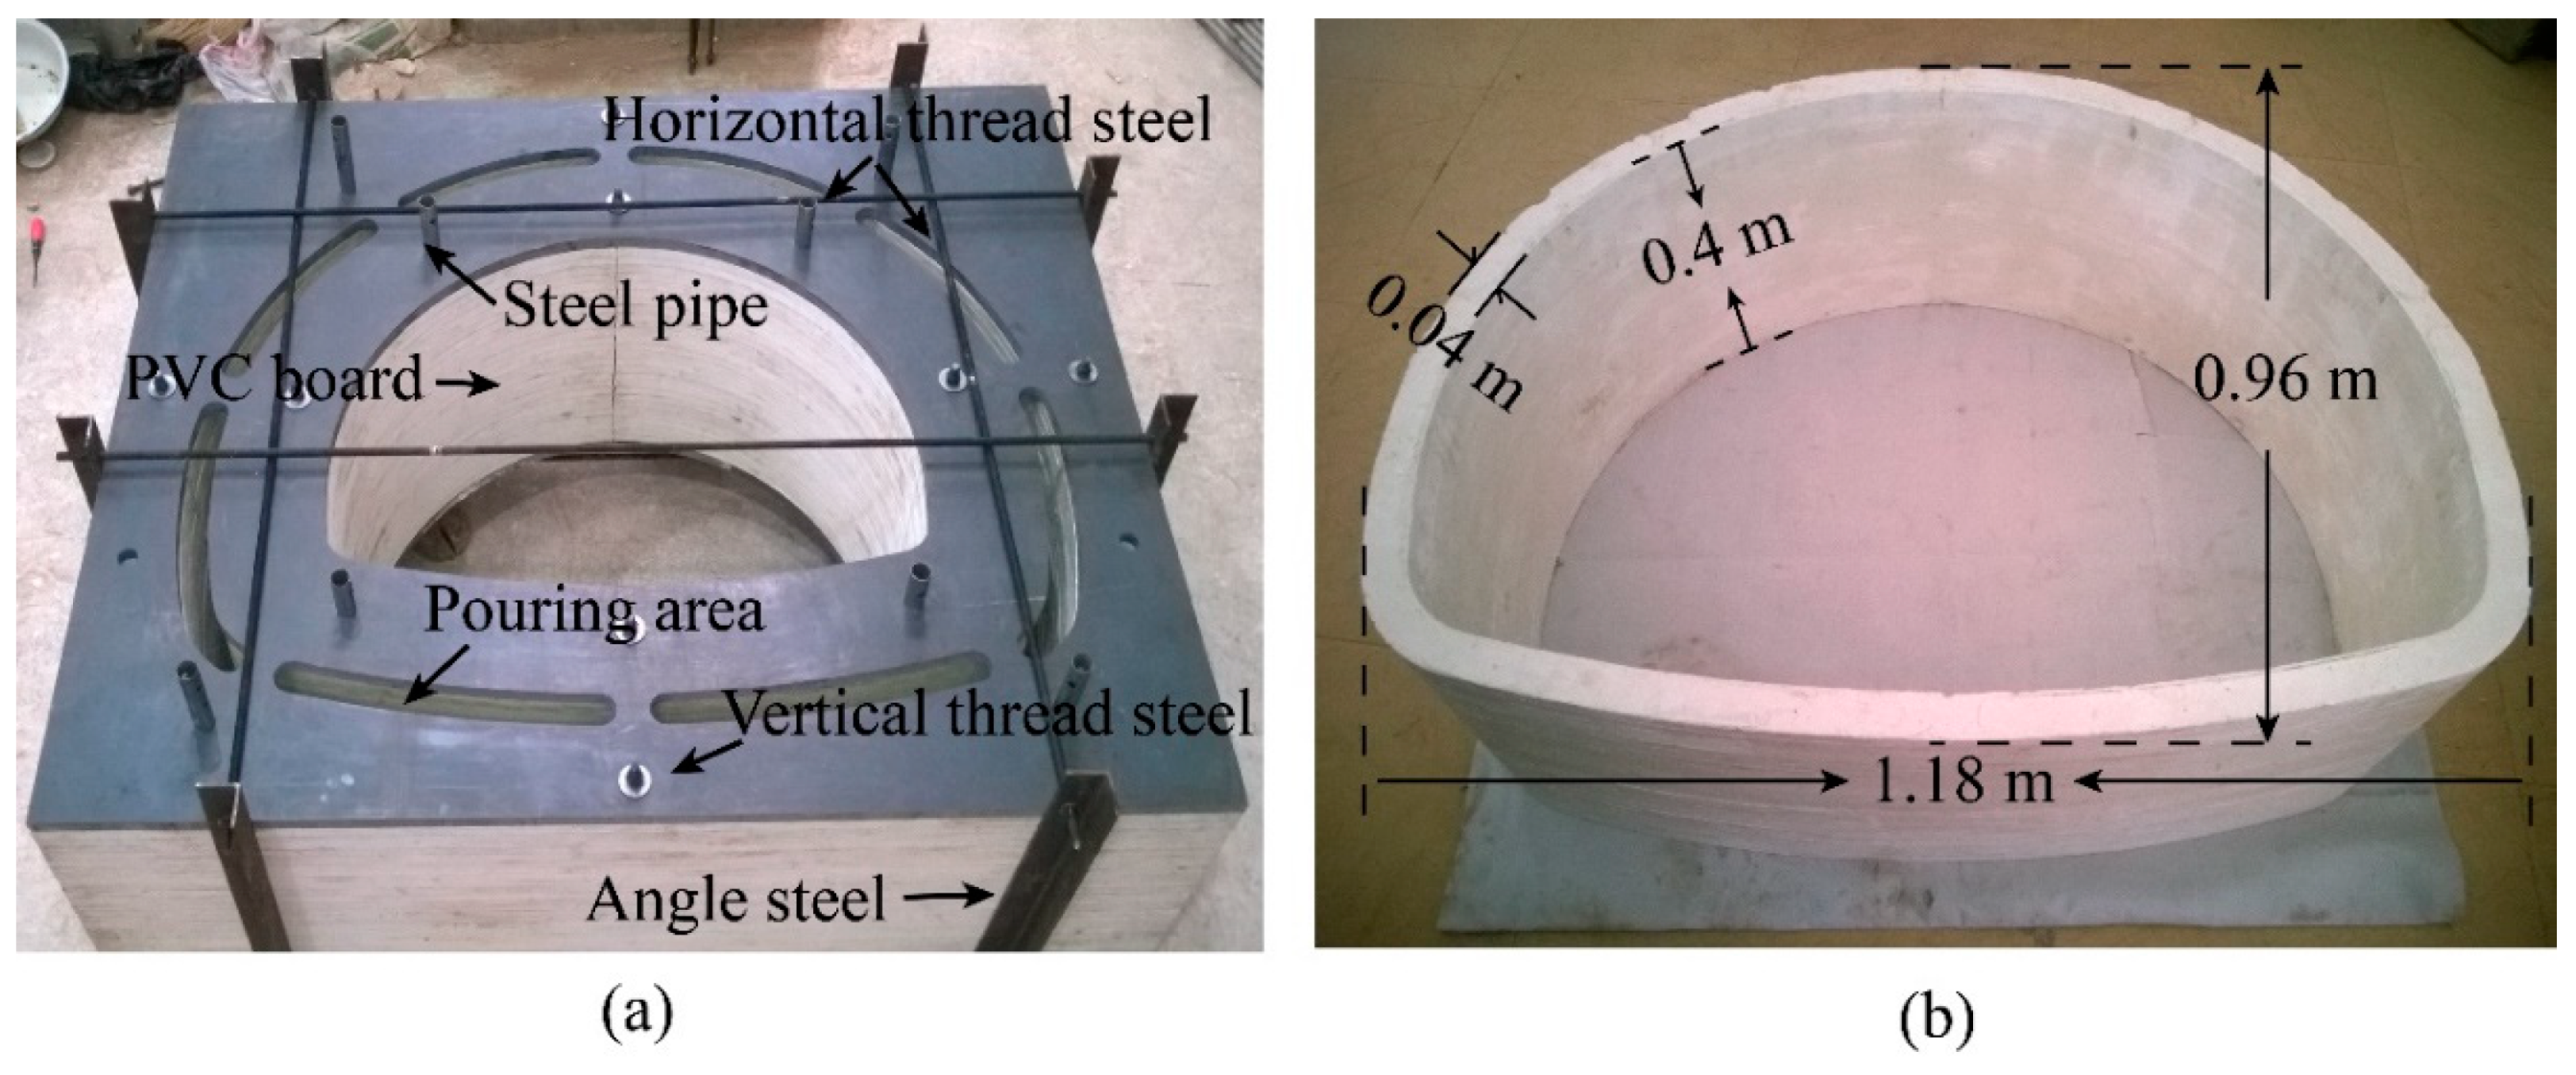
The casting of the model uses a self-made mold made of polyvinyl chloride (PVC) board, as shown in Figure 12a. The mold is 40 cm high and composed of twenty-six layers of PVC boards, which are divided into an inner mold and an outer mold, and the space between these two is used for pouring similar materials. The PVC sheet adopts eight steel tubes for vertical positioning. Twelve groups of horizontal and vertical screw steel zippers are forced to squeeze on six sides to ensure the tightness and stability of the mold. The model was fully vibrated during the casting process. After the pouring was complete, the mold was removed one day later, and then maintained until the lining model was completely dry. Figure 12b shows the completed tunnel model. The geometric dimension of the model is 1/10 of the prototype, the thickness of the lining model is 4.0 cm, the span is 1.18 m, the height is 0.96 m, and the axial length is 40 cm.
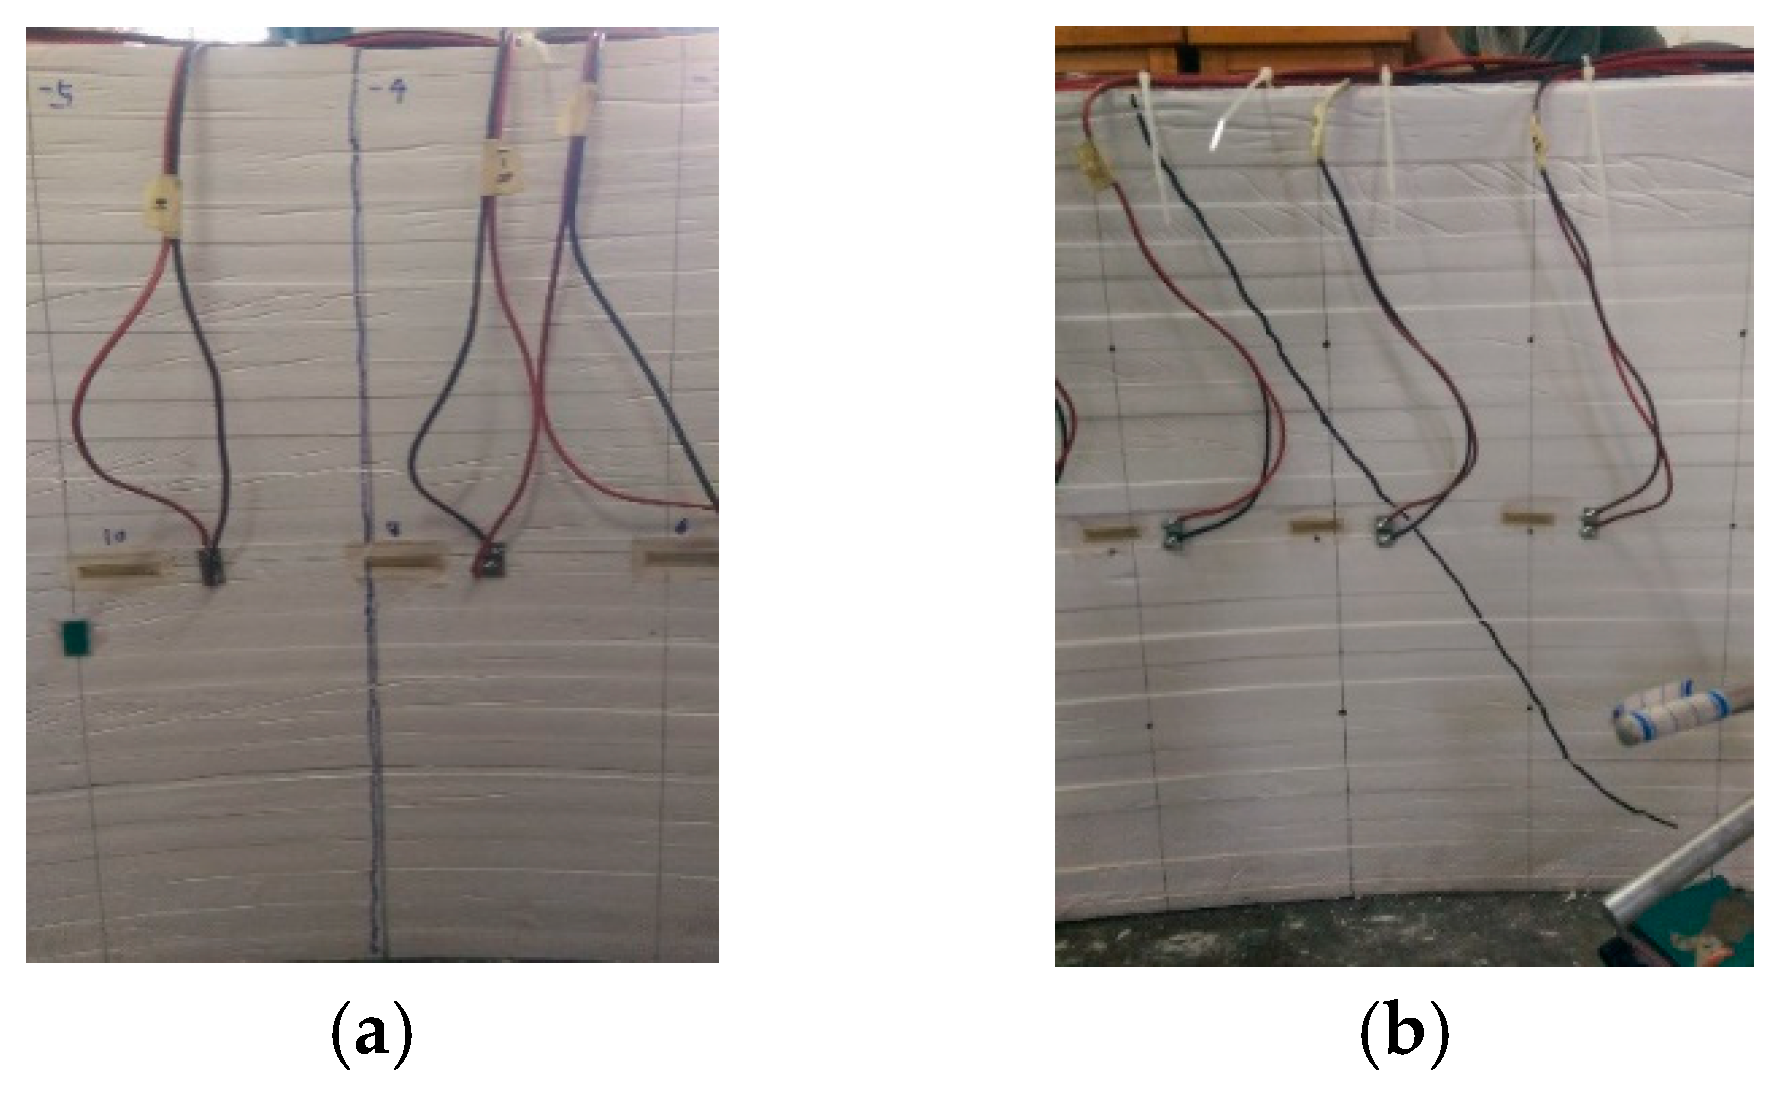
During the test, the internal force, deformation, and cracks of the lining were monitored. The monitoring sections of the internal force and deformation are shown in Figure 9, there are fifteen monitoring sections, from 1 to 15, in the tunnel model. As can be seen from Figure 13a, the BX120-20AA resistance strain gauges were installed, the strain gauge was 2 cm long, the resistance value was 120 ohms, and the sensitivity coefficient was 2%. The internal forces of the arch sections 1–6, the sidewall sections 7–10, and the arch foot and inverted arch sections 11–15, can be calculated with the formula of the relationship between the inner and outer strain of the lining. The radial deformation of the lining was monitored with the WBD-50 A high-precision electronic dial indicators. The measurement points of the radial deformation were arranged at the center of the lining vault, arch waist, arch foot, and inverted arch. The recording of cracking time and shape drawing was done manually. The cracking times were recorded at any time during the test. The shape drawing of lining crack was completed during the five minutes of pressure maintenance period after the application of each level of load. The monitoring element layout is shown in Figure 13b.

4.2. Test Cases and Lining Loads

Because the lining cracking of shallow buried loess tunnel is closely related to the slide surface and immersion, the design of the test cases considered the slide surface types and the flooded range of loess around the slide surface. As shown in Table 5, the test cases were divided into four cases according to the types of slide surfaces. The slide surfaces in case 1 and 3 were distributed on both sides of the tunnel. The failure points were at the arch foot and arch waist, respectively. The slide surfaces in case 1 were No. 1 and No. 2, and the slide surfaces in case 3 were No. 3 and No. 4. It should be noted that the slide surfaces in case 3 were the same as the slide surfaces in the sections K1841 + 475~K1841 + 495 of the above tunnel engineering (Figure 7). In cases 2 and 4, the slide surface was distributed on one side of the tunnel. The slide surface in case 2 was No. 1, and the failure point was at the arch foot. The slide surface in case 4 was No. 3, and the failure point was at the arch waist. According to the loess field immersion test [34], the total width of the immersion on both sides of the loess crack can reach 4.54 m after immersion for three days. Based on this result, the immersion width B around the crack in each case was set to 0 m, 1 m, 2 m, 3 m, 4 m, and 5 m.
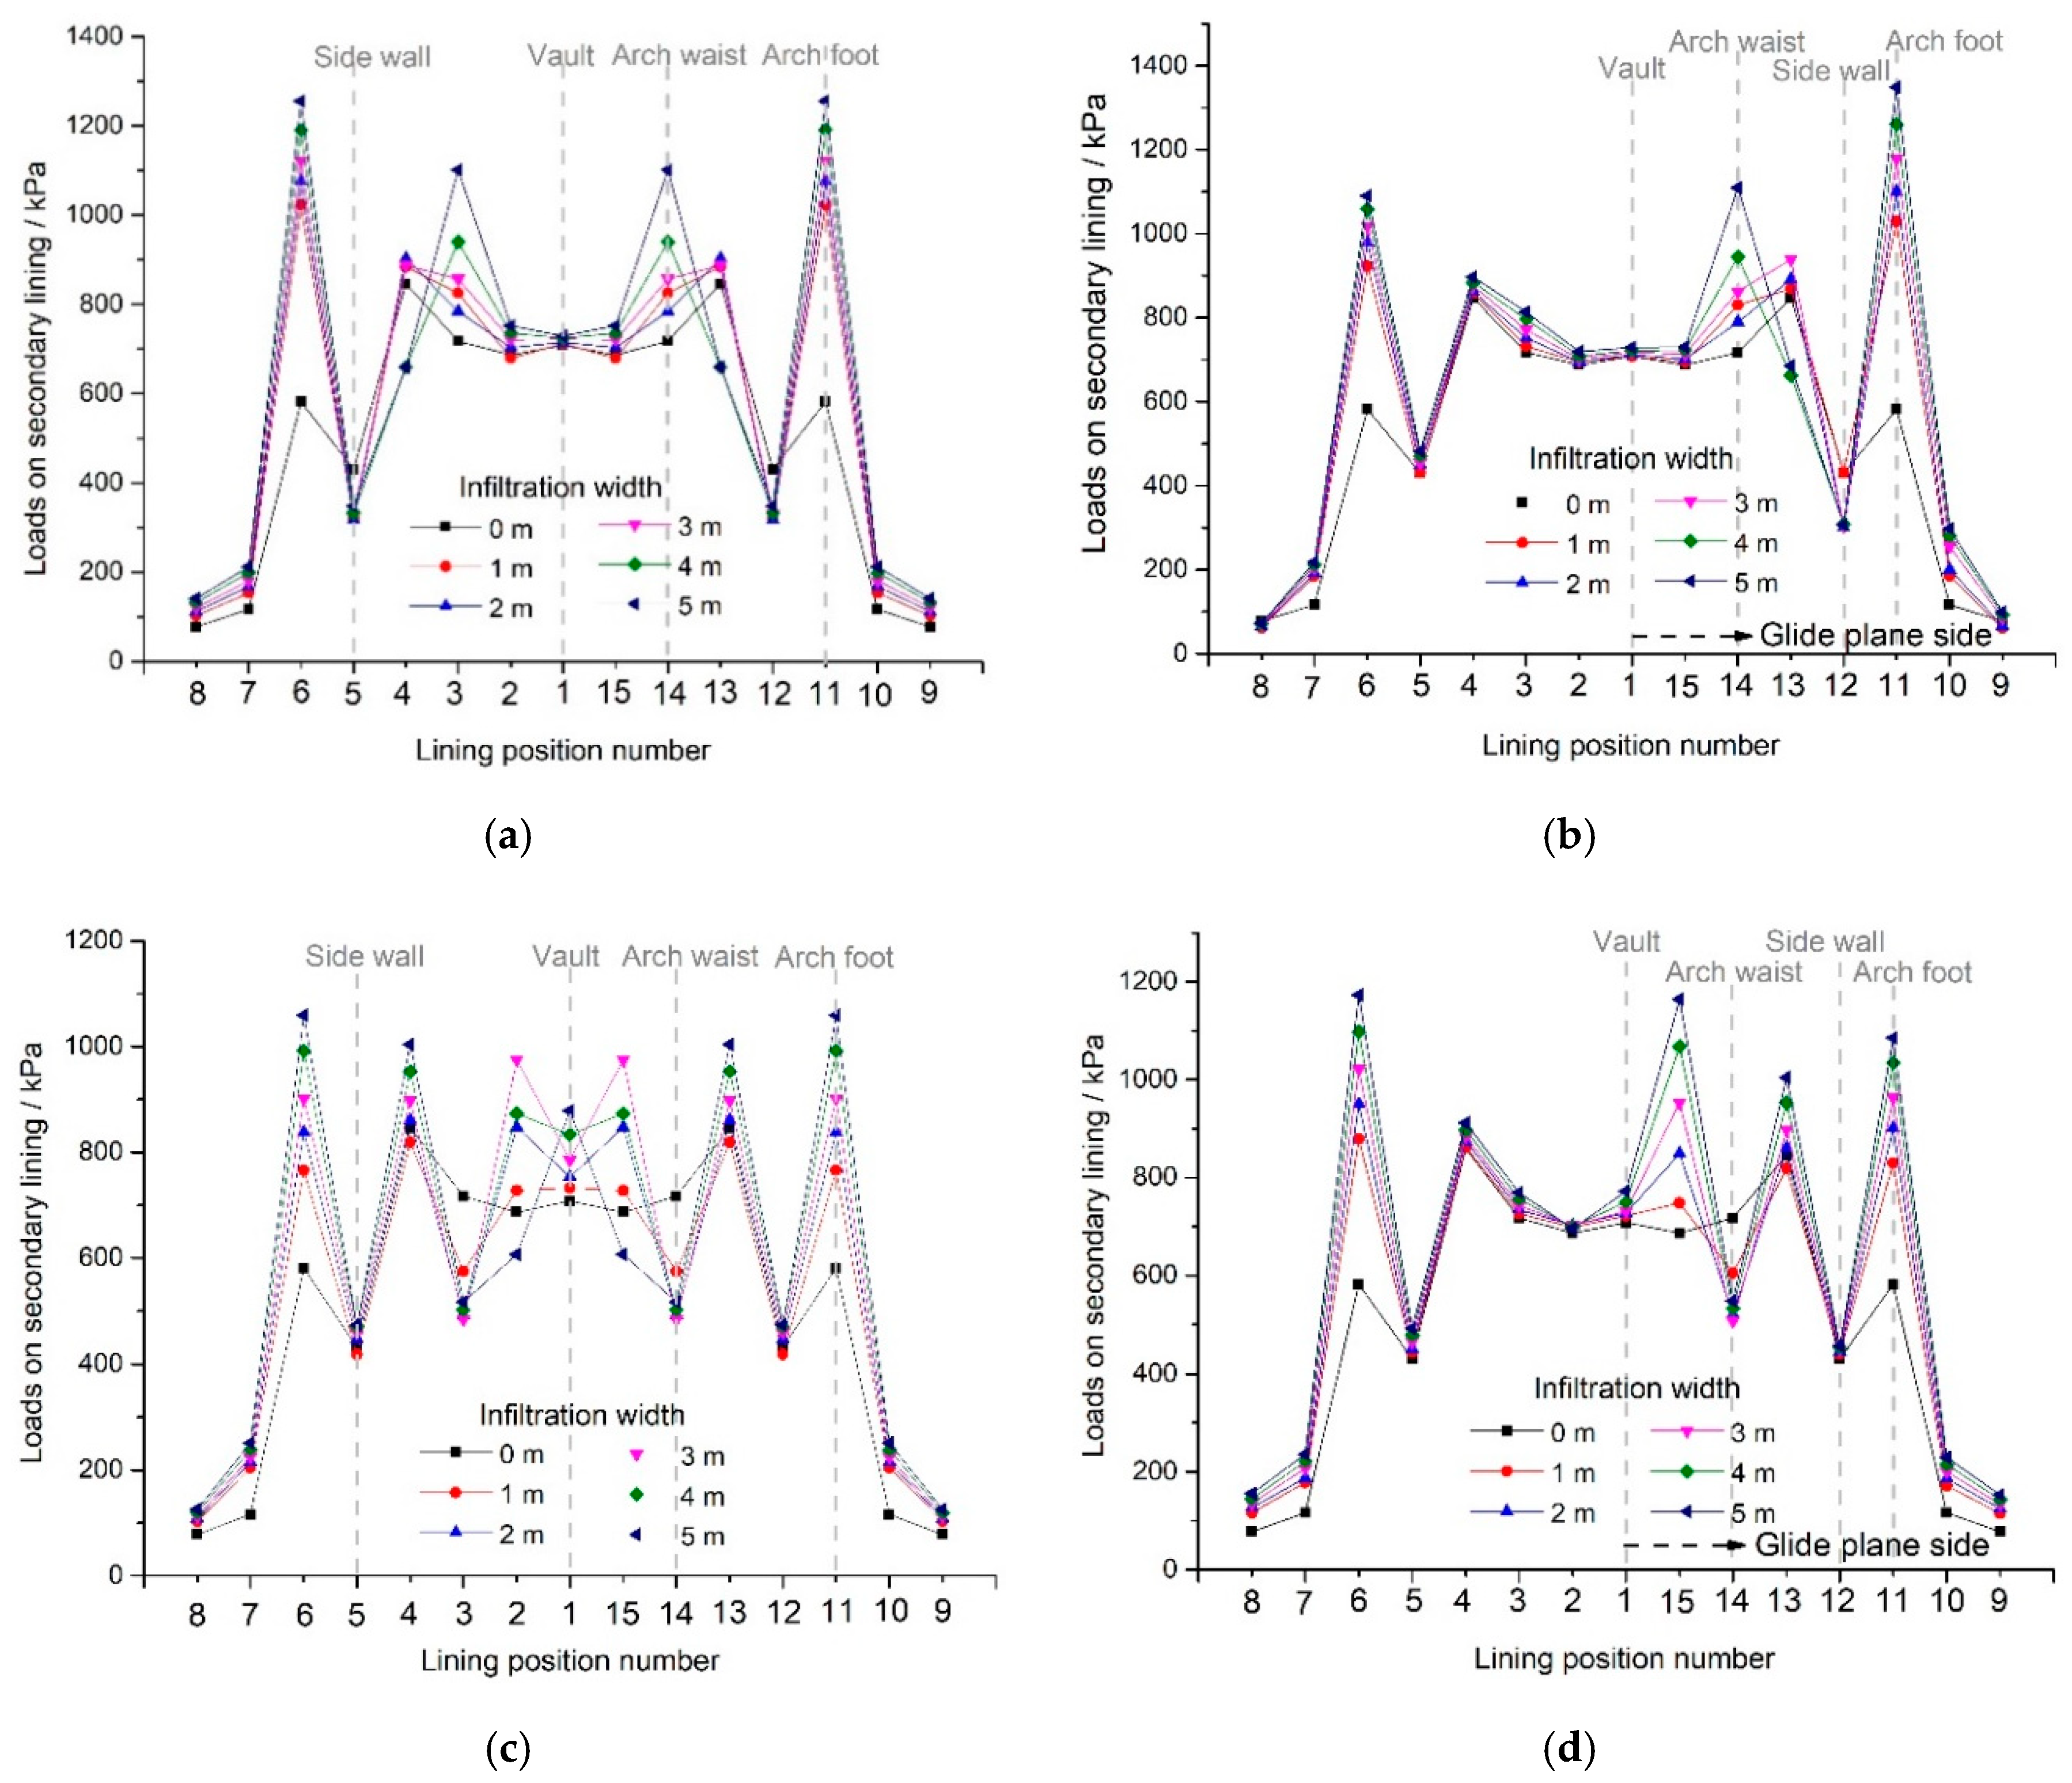
The combined effect of different slide surfaces and different immersion width around the crack has a strong influence on a load of tunnel secondary lining. The authors of this paper have calculated the secondary lining load value of the immersion slide surface with a numerical simulation method that is verified with on-site monitoring results [19]. This paper is a follow-up research of the reference [19]. The two studies have the same research background, which is the immersion of the slide surface in shallow buried loess tunnel, but different research focuses. Reference [19] focus on the loads on the secondary lining caused by the immersion of the slide surface, and the loads on the lining was calculated by numerical simulation. This paper focus on the characteristics and laws of lining cracking under the effect of slide surface immersion, and a loading model test was carried out. In the model test, the loading value of lining model refers to the calculation results of the reference [19], so the Figure 14 of this paper is the same as the Figure 10, Figure 11, Figure 12, Figure 13 and Figure 14 in reference [19]. The calculation cases are the same as the Table 5, and the degree of loess flooding is set as the saturated state. The buried depth and support parameters in the numerical simulation take from the sections K1841 + 475~K1841 + 495 of tunnel engineering in Section 2.3, so the buried depth is 30 m, and the thickness of secondary lining and primary support are 40 cm and 20 cm, respectively.
The load values on the secondary lining of the shallow buried loess tunnel under the four cases are shown in Figure 14a–d. Figure 14e shows the load monitoring points corresponding to the abscissa of Figure 14a–d. The positions of load monitoring points are the loading positions of the hydraulic cylinders in the loading system of test equipment, and in the center of two adjacent monitoring sections. For better understanding, the monitoring sections in Figure 13a are marked in Figure 14e. It can be seen that the slide surface immersion caused the load on arch foot (Nos. 6 and 11) to increase. Comparing the load at the positions 6 and 11 in case 1 (Figure 14a), case 2 (Figure 14b), case 3 (Figure 14c), and case 4 (Figure 14d), it can be seen that the increased value caused by the immersion of the arch foot slide surface was higher than what caused by the immersion of the arch waist slide surface. For the arch of the tunnel, the lining load at the arch waist (Nos. 3 and 14) increased when the arch foot slide surface was flooded. The effect of the arch waist slide surface immersion mainly caused the load increase at the arch shoulder (Nos. 2 and 15), and the position of the increased load is closer to the vault. In addition, it can be seen from the load distribution form that the immersion of the slide surface on one side caused the bias pressure. The loading force of the fifteen sets of loading devices in the model test was converted according to the area load similarity ratio Cq = 10.

4.3. Loading Scheme

The test loading process was divided into three stages, as shown in Table 6. The first loading stage was from 0 kPa to the non-immersed load, corresponding to 0 m immersion case, where the non-immersed load divided into ten equal parts to load step by step and the corresponding loading steps were 1–10. The second stage simulates the process of expanding the immersion range from 1 m width to 5 m width. The load value under the 1–5 m immersion width was loaded five times, and the corresponding loading steps were 11–15. The third stage was from the end of immersion simulation to model instability. The load difference between the immersion widths of 4–5 m was set as the loading amount under each loading step, and the corresponding loading step was from 16 to model instability.
Before the test, the loading system was adjusted to make the loading speed of the hydraulic cylinder be 0.5 mm/min without loading, and the loading speed was checked by dial indicators. Then, a rubber pad was put on the inside of the arc-shaped steel plate. Petroleum jelly was applied and the arc-shaped steel plate was stuck close to the outer surface of the model. Finally, loading with a rate of 1 kPa/min was carried out. After one loading step was completed, the test system maintained the load for 5 min. During the maintenance time, the lining model adjusted the deformation and stress state, and the cracks drawing were completed.

5. Test Results

5.1. Deformation and Cracking of Secondary Lining

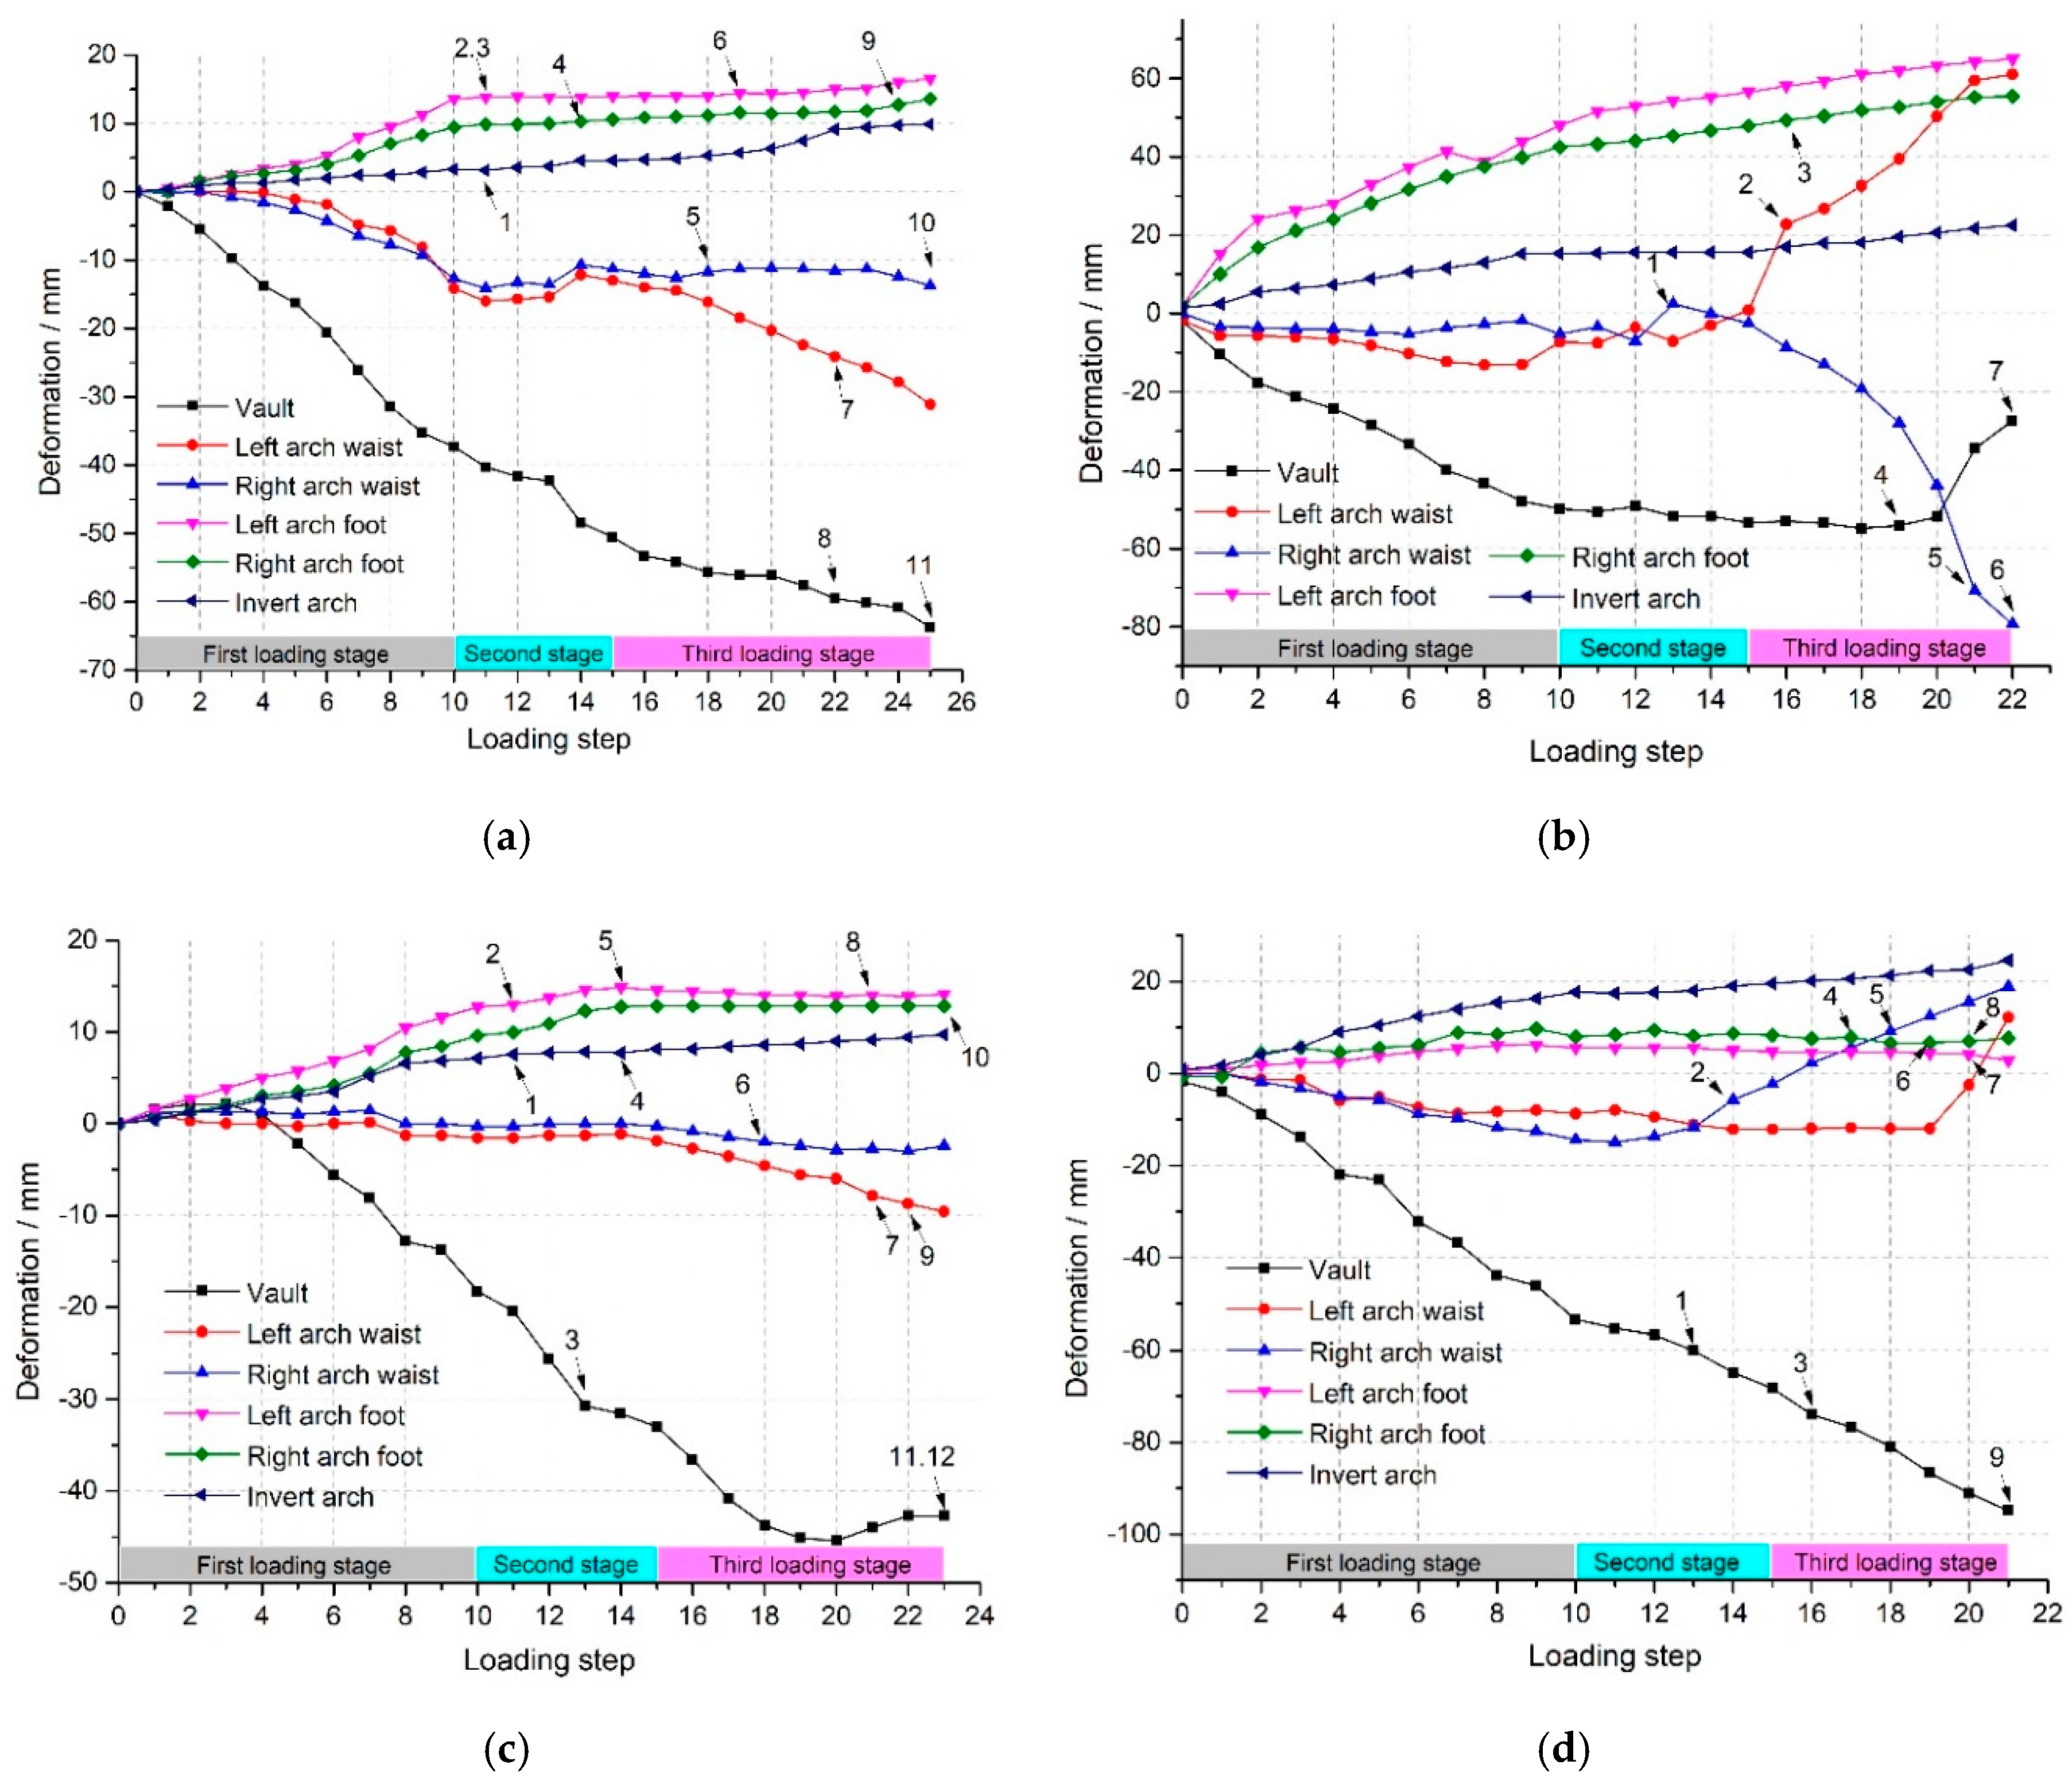
Figure 15 shows the deformation development curve of the secondary lining under four test cases, and the values have been converted to the prototype lining result. It can be seen that in different test cases, the sequence of the deformation values of the six monitoring positions is the same. The order from the largest to the smallest are the vault, the arch waist, and the arch foot, and the inverted arch. The deformation amount of the arch foot and the inverted arch is not that different, while the deformation of the lining vault is always the maximum, whose increasing rate is enormous. The sequence of the deformation of the vault from large to small is case 4, case 2, case 3, and case 1. The vaults deformation under the unilateral slide surface immersion cases (cases 2 and 4) is higher than that of the bilateral slide surface immersion cases (cases 1 and 3).
The loading step from 10 to 15 is the loading stage of slide surface immersion simulation, where no matter on what side the slide surface is immersed, the deformation of the vault always increased at the maximum speed, and the deformation of the arch foot and inverted arch changed little. In bilateral slide surface immersion cases (cases 1 and 3), the deformation of the arch waist on both sides of the lining had little difference. In contrast, in unilateral slide surface immersion cases (cases 2 and 4), the deformation of the arch waist on both sides of the lining showed a difference, which increased rapidly in the next loading stage (after loading step 15). Generally speaking, the immersion of the slide surface had the most significant effect on the deformation of the lining vault and arch waist.
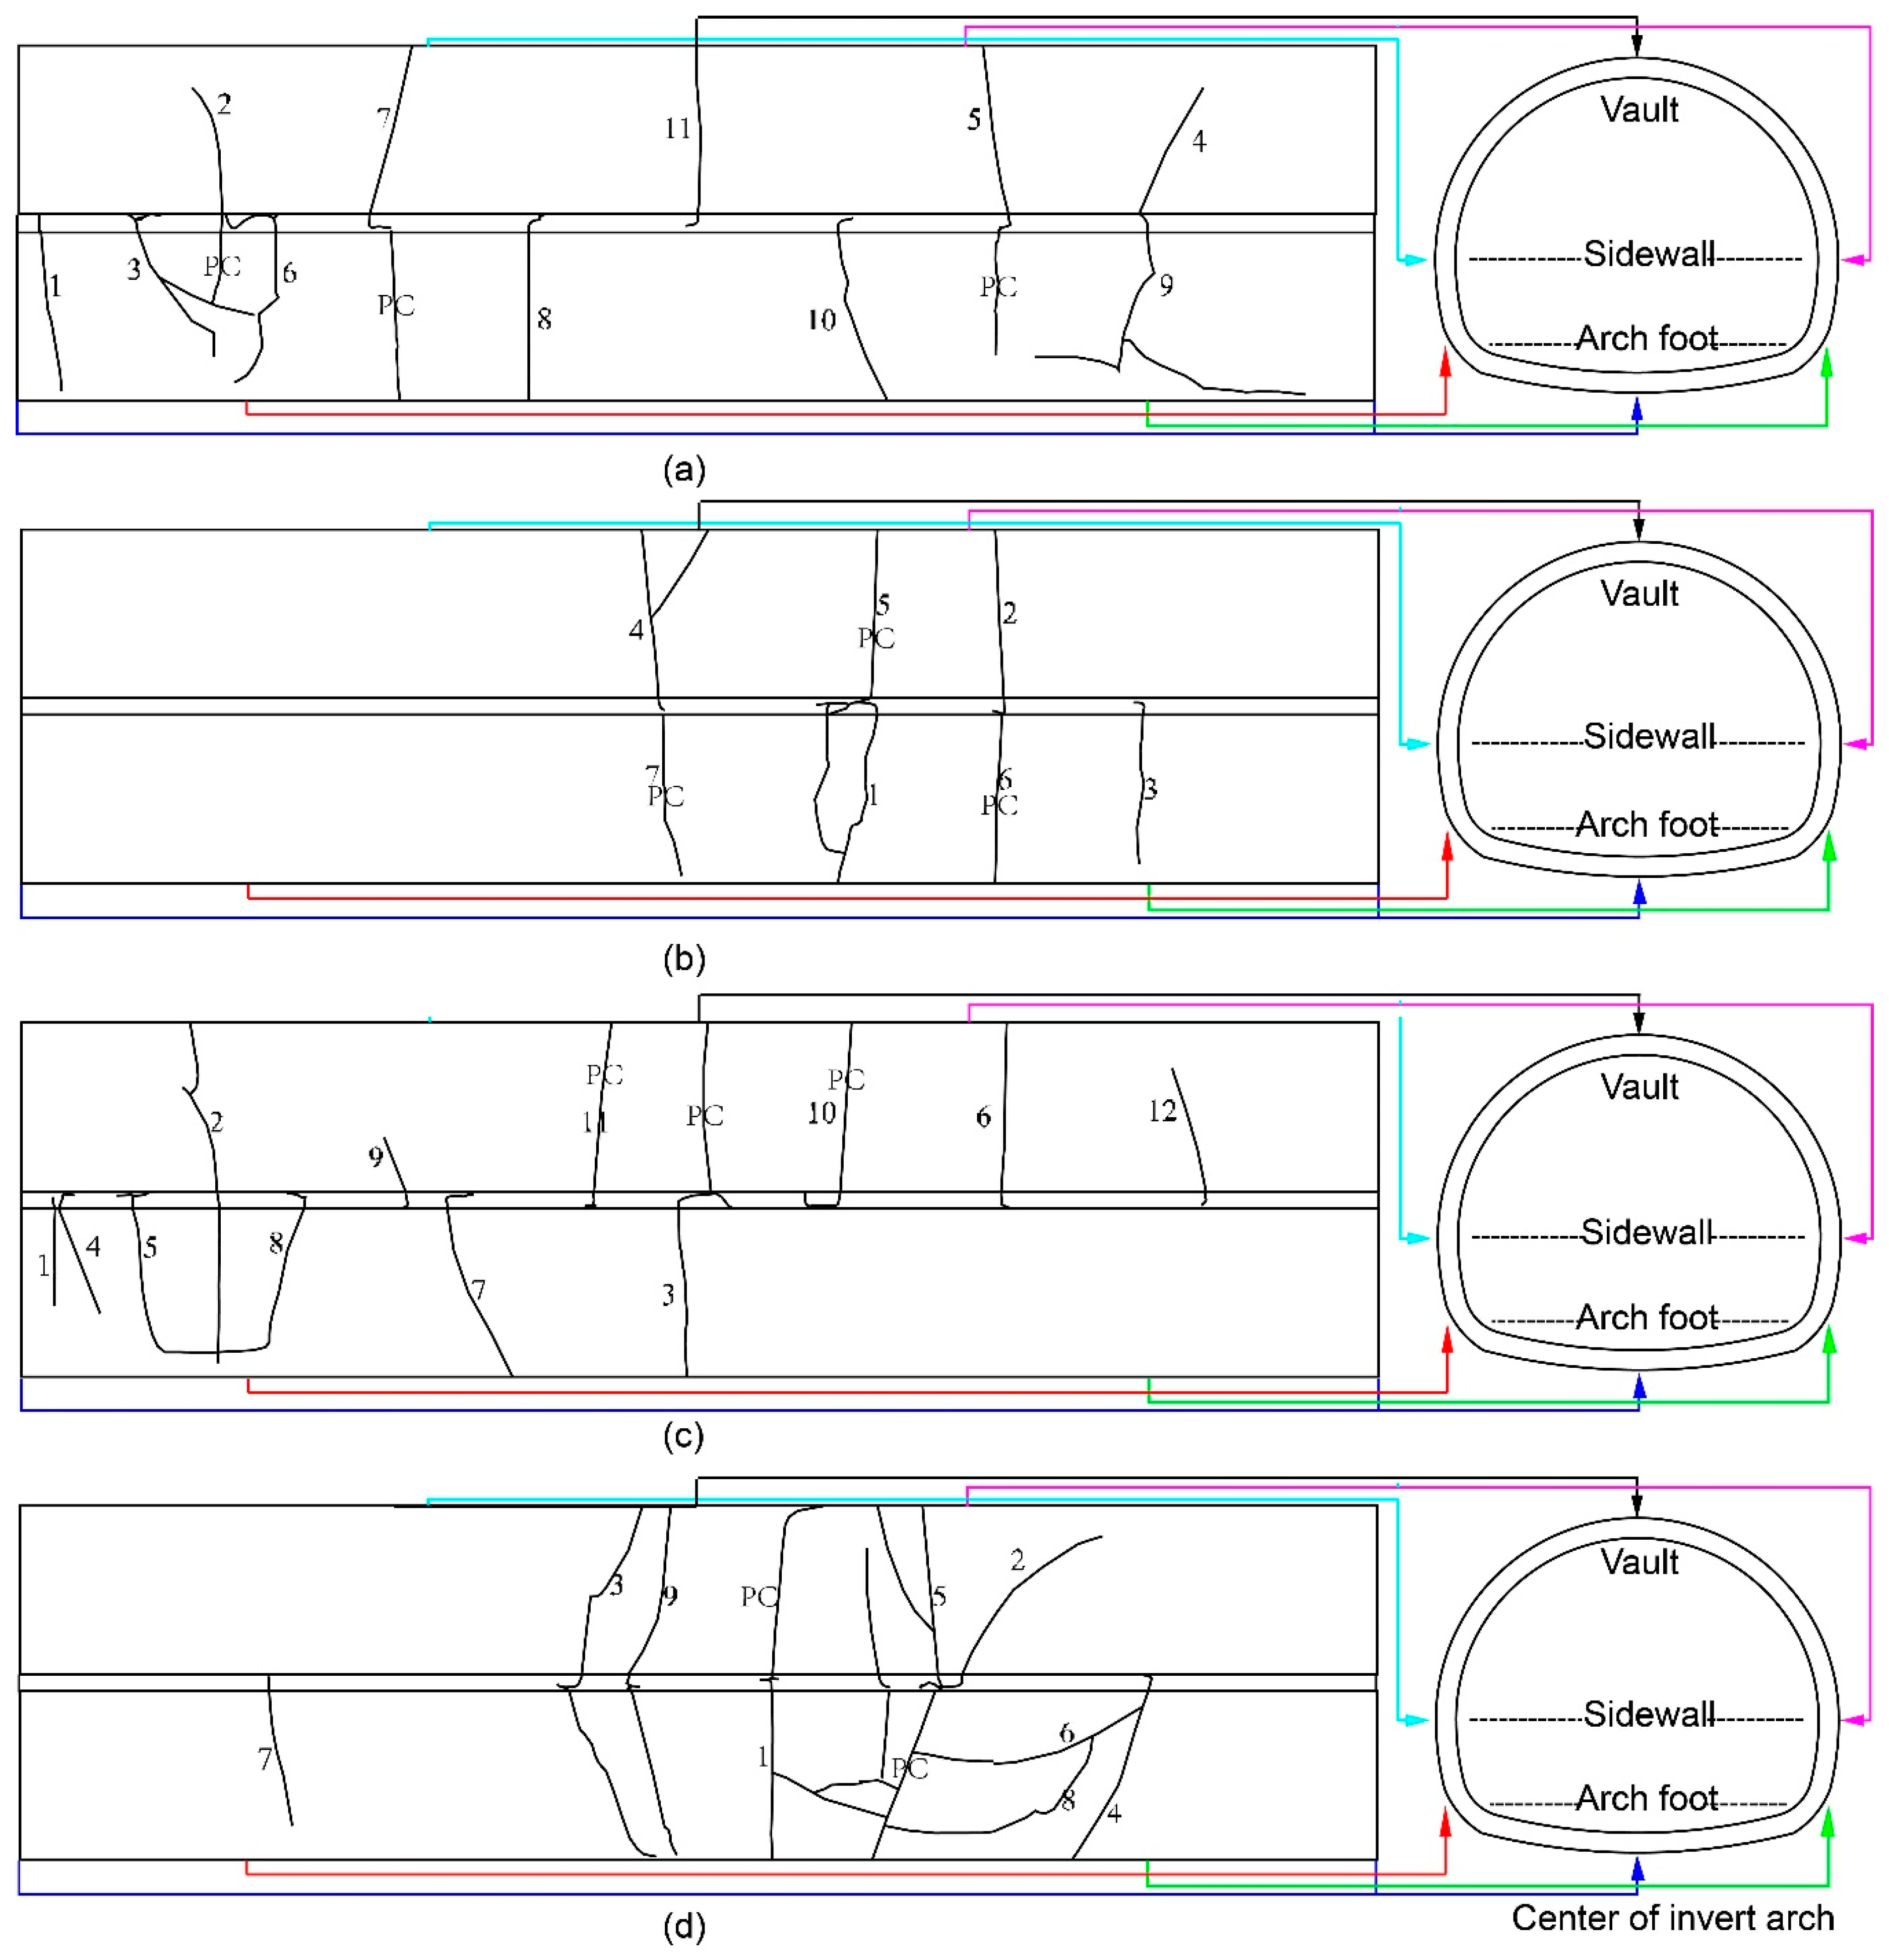
The numbers in Figure 15 are the lining cracks numbers, and the points indicated by the arrows are the deformation monitoring points closer to the crack, whose corresponding load step is the cracking time. The occurrence of the cracks can be considered as the result of the large deformation of the lining. From the perspective of the effect of the cracks on the deformation, after No. 1 cracks in the inverted arch, Nos. 2, 3, and 4 cracks in the arch foot in Figure 15a; Nos. 1 and 4 cracks in the inverted arch, and Nos. 2 and 5 cracks in the arch foot in Figure 15c appears, where the trend of the deformation curve of the arch foot and the inverted arch was unchanged. Therefore, the lining cracking at the arch foot and the inverted arch is less relevant to the deformation. However, in the lining vault and the arch waist, there is an individual relationship between the lining cracking and the sudden increase of deformation. Some cracks appeared at the inflection point of the curve trend, such as the No. 5 crack in the right arch waist in case 1, the No. 3 crack in the vault in case 3, the No. 2 crack in the left arch waist in case 2, and the No. 2 crack in the right arch waist in case 4.
Figure 16 shows the distribution of the secondary lining cracks under the four test cases as well as the cracking sequence with the number in the figure. It can be seen that the lining cracks are symmetrically distributed in the bilateral slide surface immersion cases (cases 1 and 3) except for the inner surface of lining under case 3 (Figure 16a,c). In the cases of unilateral side sliding surface immersion (cases 2 and 4), the cracks are concentrated on the immersion side of the slide surface (Figure 16b,d). The compression cracks (marked with CC) always occur before or during the instability of lining, so the appearance of compression cracks can be regarded as the precursor of the lining instability.
The tension and compression cracks at the location of the lining instability with symmetrical distribution inside and outside the lining, penetrate the entire lining in the thickness direction. For example, the instability of lining under cases 1 and 3 is caused by the development of No. 2 cracks at the left arch foot (Figure 16a,c), and the development of the No. 1 crack causes the instability of lining in cases 3 and 4, penetrating lining at arch waist and arch shoulder, respectively (Figure 16b,d). Under the unilateral immersion of the arch waist side surface, the instability position of lining is closest to the lining vault.
Table 7 shows the occurrence of the cracks at different lining locations and each loading step during the second and third loading stage. It can be seen that under the bilateral slide surface immersion cases (cases 1 and 3), the distribution of lining cracking time was relatively even, and the cracking of the arch foot and the inverted arch mainly occurred in the second loading stage (loading steps 10–15). In the third loading stage, the sidewall cracked first, and the arch part cracked later. The lining cracking time of the single slide surface immersion cases (cases 2 and 4) was relatively concentrated and generally later than that of the bilateral slide surface immersion cases (cases 1 and 3). The first cracking in cases 1 and 3 occurred at loading step 11, and the first cracking in cases 2 and 4 occurred at loading step 13. Different from cases 1 and 3, the cracking time of the arch foot and the inverted arch was later than that of the lining arch in cases 2 and 4.

5.2. Internal Force of Secondary Lining

According to the above test results, the analysis of the internal force is only concerned where the maximum deformation, or many cracks, appeared since the maximum deformation position and failure were localized. This local analysis can highlight some most problematic areas. In the internal force analysis of the lining, the arch sections from 1 to 6, which had the most extensive deformation, were selected from the bilateral slide surface immersion cases (cases 1 and 3). The sidewall sections from 7 to 10, where crack occurred severely, were selected from the single slide surface immersion cases (cases 2 and 4). The test results have been converted into lining prototype results according to a similar relationship.

5.2.1. Arch Sections 1–6 in Cases 1 and 2

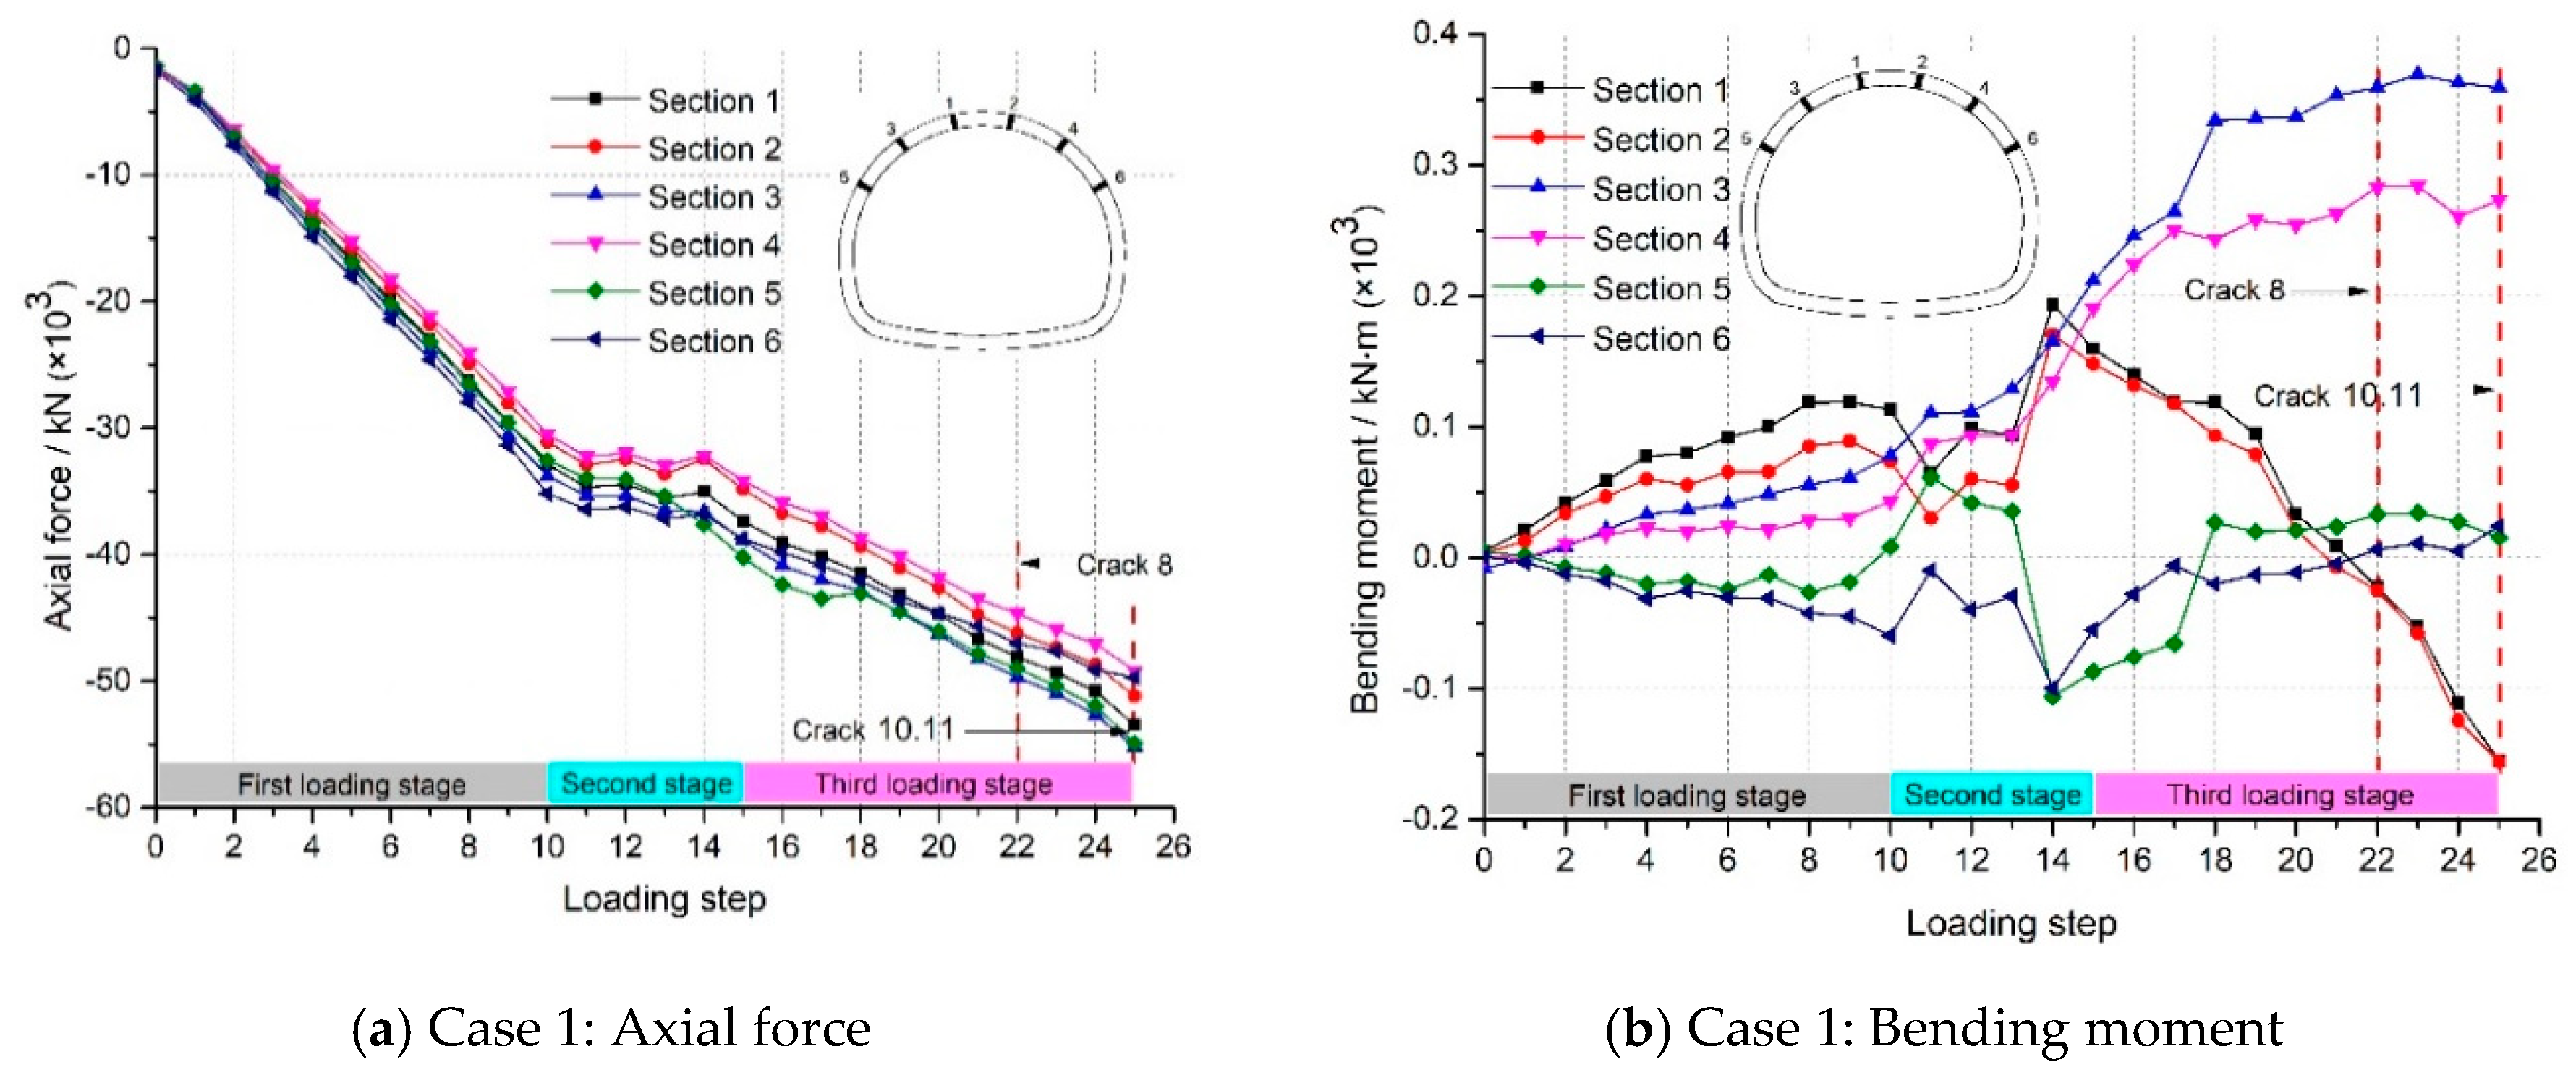
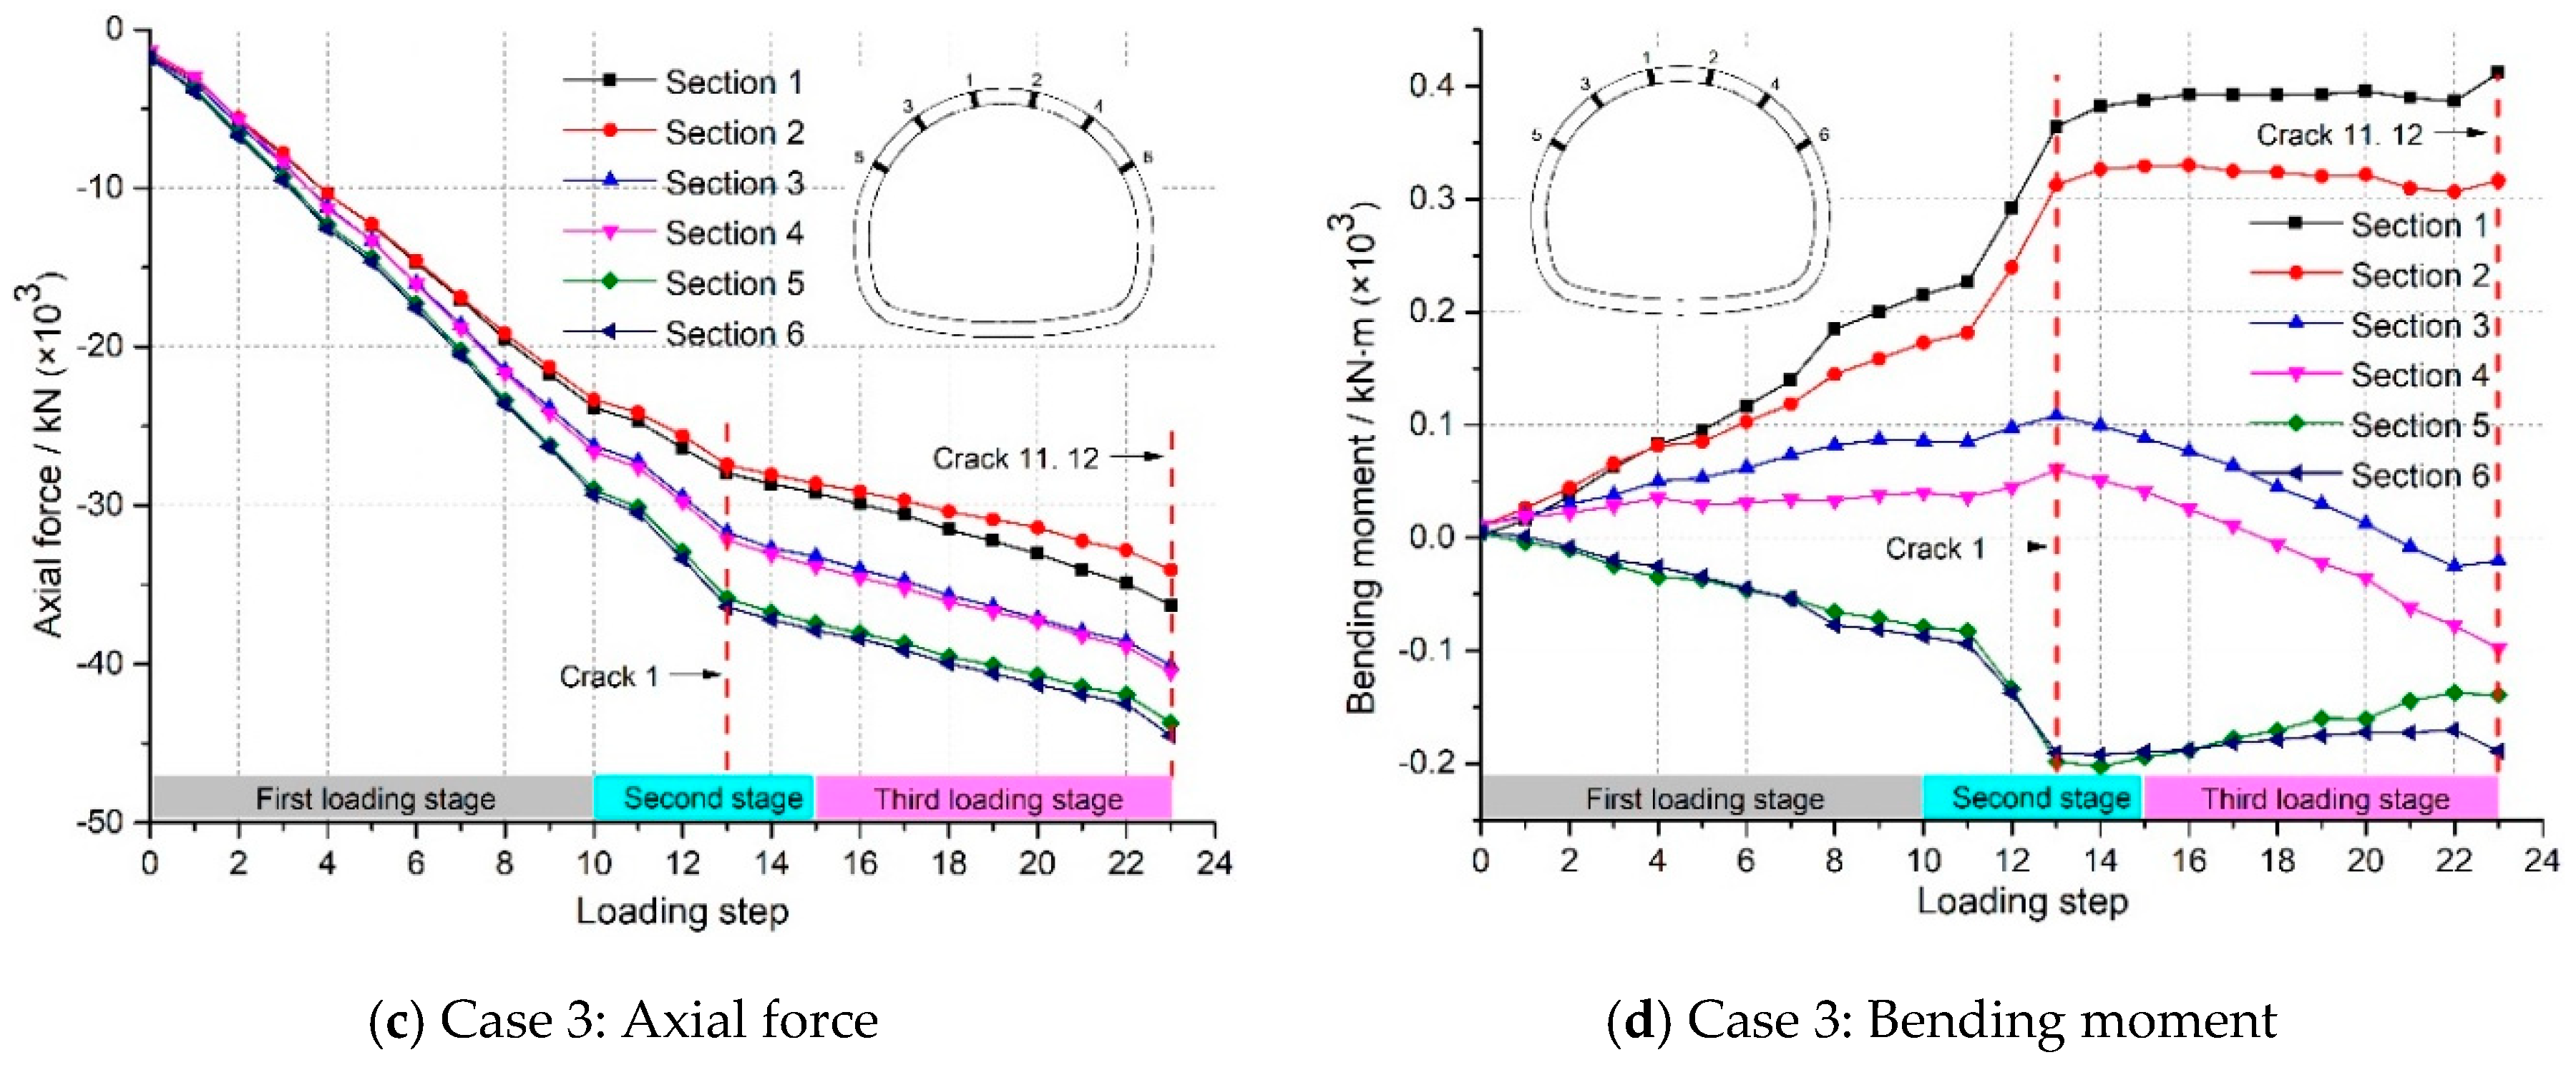
Figure 17 shows the internal force curves of Sections 1–6 in the bilateral slide surface immersion cases (cases 1 and 3). Figure 17a,b illustrates the axial force and bending moment curve of arch six sections under the bilateral arch foot slide surface immersion case (case 1), respectively. It can be seen from Figure 17a that the entire lining arch was compressed during the test. The axial force increased linearly, the same as their change trend. During the second loading stage (loading step 10–15), the axial force of the lining arch changed little.
It can be seen from Figure 17b that the bending moment trend at the symmetrical position of lining is the same, and the magnitudes are not much different. In the second loading stage (loading step 10–15), the bending moment of the vault and the arch waist decreased first and then increased, and finally bent in the opposite direction, while the bending moment of the arch shoulder always increased. The bending moments of the Sections 1 and 2 of the vault, and the Sections 5 and 6 of the arch waist, began to decrease and develop in the opposite direction due to the loading step 14 (immersion width 4 m). No cracks appear in the arch during this stage.
Figure 17c,d shows the axial force and bending moment curve of arch six sections under the bilateral waist slide surface immersion case (case 3), respectively. It can be seen from Figure 17c that all the six sections of the arch are under compression during the test, and the changing trend of axial force is similar. The axial force of Sections 5 and 6 at the lower end of the arch is greater than other positions. During the second loading stage (loading step 10–15), the axial force of the arch always increased. When the loading step was 13 (immersion width 3 m), No. 1 crack on the inner surface of the vault appeared, and the increased rate of the axial arch force decreased. It can be seen from Figure 17d that Sections 1 and 2 of the vault were always bent outwards, the Sections 5 and 6 of the arch waist always bent inwards, and Sections 3 and 4 of the arch shoulder bent from inwards to outwards in the third loading stage. It is worth noting that when the loading step was 13 (immersion width 3 m), the bending moment of Section 6 suddenly increased, while No. 1 crack on the inner surface of the vault appeared. Afterward, the increasing rate of the bending moment of the vault and the arch waist slowed down, and the bending moment of the arch shoulder began to decrease.

5.2.2. Sidewall Sections 7–10 in Cases 2 and 4

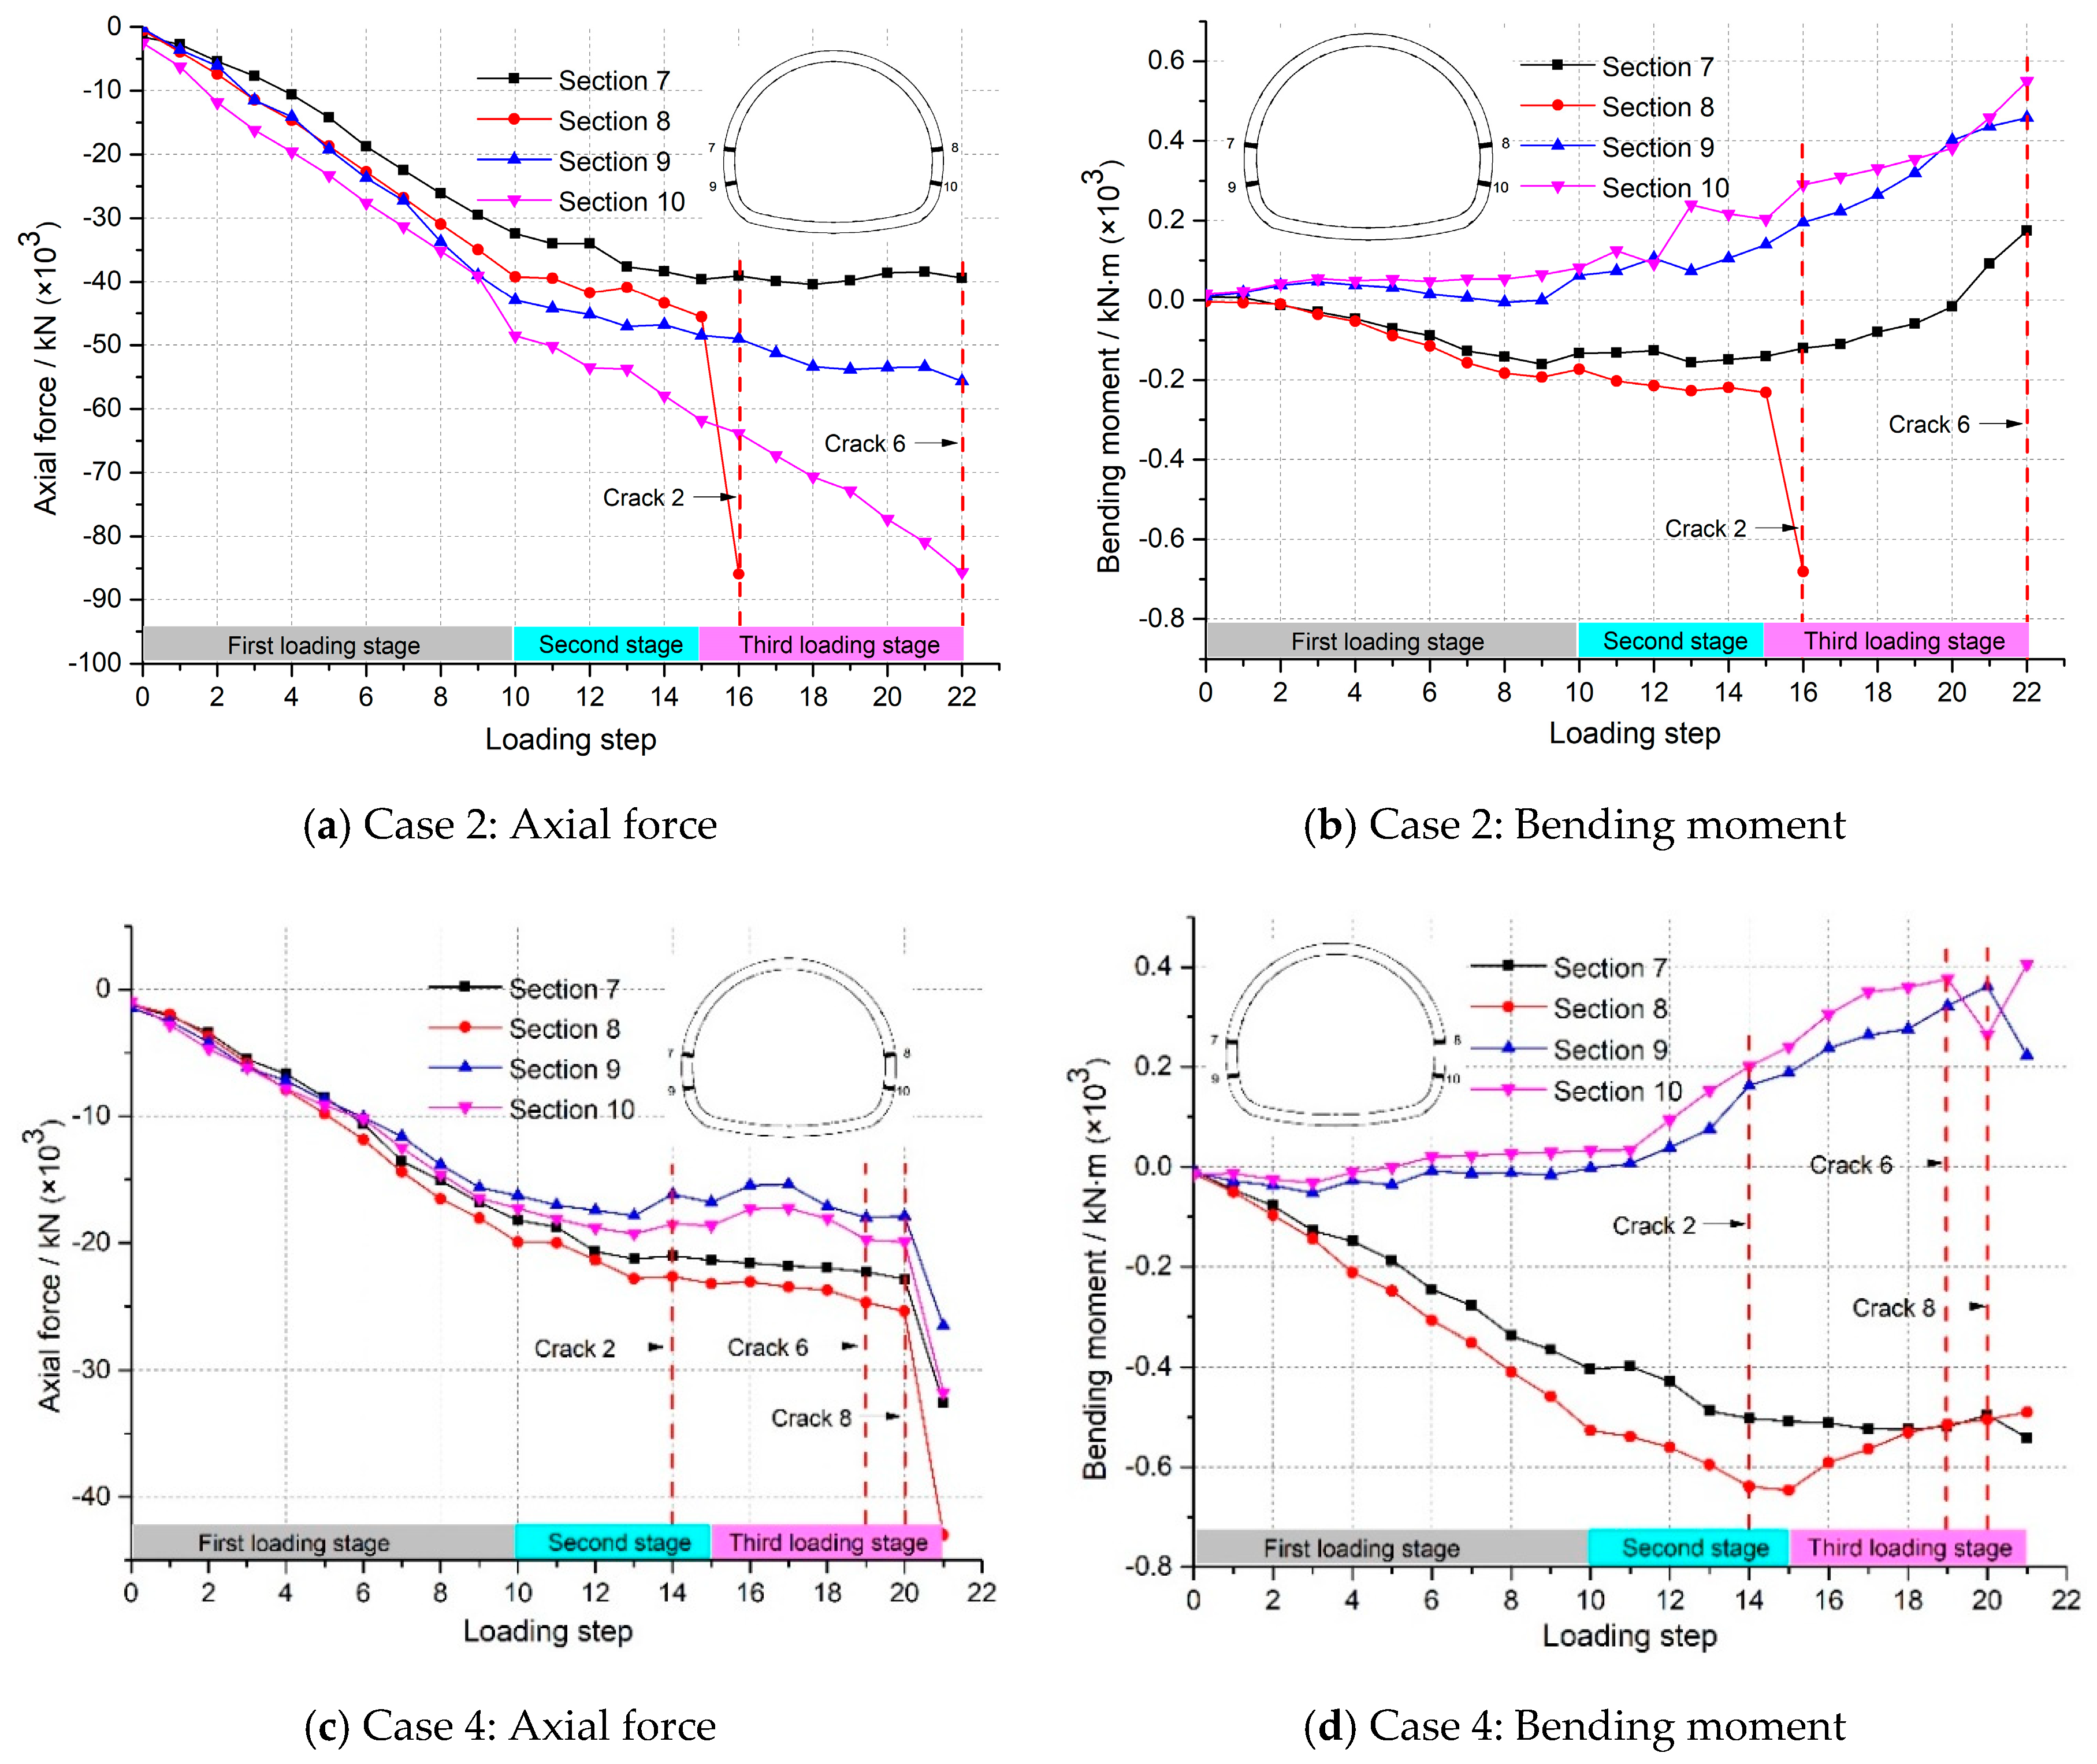
Figure 18 shows the internal force curve of Sections 7–10 of the sidewall in the unilateral slide surface immersion cases (cases 2 and 4). The sections 7–10 are the monitor sections in tunnel sidewall, as shown in Figure 13a. Figure 18a,b illustrates the axial force and bending moment curve of the four sections of sidewall under the unilateral arch foot slide surface immersion case (case 2), respectively. It can be seen in Figure 18a that the lining sidewall was compressed during the test. The axial force of Sections 8 and 10 on the side of the immersion slide surface was more significant than that of Sections 7 and 9 on the other side. The axial force of Sections 9 and 10 near the arch foot was greater than that of the Sections 7 and 8 on the upper side. The bending moment variation curve also showed the same law. At the loading step 16, the crack 2 passed through the strain gauge at Section 8. The strain gauge failed, and the strain data overflowed. The external surface of the sidewall cracked, and the axial force of Section 8 increased suddenly. The axial force trends at other locations did not change. It can be seen from Figure 18b that Sections 9 and 10 always bent inward, and Sections 7 and 8 always bent outward, before the lining lost stability. At the loading step 16, the bending moment of Section 7 began to decrease and finally changed from bending outward to bending inward.
Figure 18c,d show the axial force and bending moment curve of the four sections of sidewall under the unilateral arch waist slide surface immersion case (case 4) respectively. It can be seen from Figure 18c that the lining sidewall was compressed during the test. The axial force of Sections 8 and 10 on the side of the immersion slide surface was greater than that of Sections 7 and 9 on the other side, respectively. The axial force of Sections 9 and 10 near the arch foot was smaller than that of the Sections 7 and 8 on the upper side. The bending moment variation curve showed the same law. During the second loading stage (loading step 10–15), the axial force of Sections 7 and 8 in the upper side increased slowly, while that of Sections 9 and 10 in the lower side did not change much. When the immersion width reached 4 m (loading step 14), the No. 2 crack appeared on the sidewall of the immersion sliding surface side, but the changing trend of the axial force of the sidewall did not changed. Compared with Figure 18a,b, the axial force of sidewall under case 4 was generally smaller than that of sidewall under case 2. It can be seen from Figure 18d that Sections 7 and 8 at the upper side of the sidewall always bent to the outside, and Sections 9 and 10 at the lower side of the sidewall always bent to the inside. After the No. 2 crack of the sidewall in the immersion slide surface side appeared, the bending moment of Sections 7 and 8 stopped increasing and became stable, while the bending moment of Sections 9 and 10 continued to increase.
Comparing the values of internal force under the four cases, the lining bending moment under the unilateral slide surface immersion cases was significantly higher than that under the bilateral slide surface immersion cases, while the axial force of most sections unilateral slide surface immersion cases was less than that under the bilateral slide surface immersion cases. The immersion of bilateral or unilateral slide surface determined the magnitude of the bending moment of the lining. The influence of lining cracking on the lining bending moment was more significant than that on the axial force.

6. Discussion

6.1. Comparison of Test Results with Field Observations

As mentioned above, the slide surfaces and buried depth in case 2 of model test are the same as these in the sections K1841 + 475~K1841 + 495 of the tunnel engineering in Section 2.3. Additionally, the buried depth and support parameters in the numerical simulation of lining loads also take from the same sections K1841 + 475~K1841 + 495. The lining cracks inspection results in sections K1841 + 475~K1841 + 495 could verify the reliability of the method and the model tests results. The difference between the four test cases is that the type of slide surface is different. By verifying the reliability of case 3, the reliability of other cases can be indirectly explained.
The Figure 19 shows the comparison of inner surface cracks between test results of case 3 and lining inspection results in sections K1841 + 475~K1841 + 495. Because the field inspection of inner surface of secondary lining concerns the locations from right side wall to the left, so the corresponding inner surface cracks in model test are parts of cracks in case 3. The inspection results show that the cracks appeared in the vault and both side of side wall, and all cracks were longitudinal. The average length and width are 9.4 m and 0.9 mm for vault cracks, respectively, and 5.55 m and 0.6 mm for left sidewall cracks, respectively. The crack in right side wall is only 0.3 mm width and 2.3 m length, which is much narrower and shorter than the other cracks. It indicates that the vault cracks are more serious than on the left side wall, and that the cracking of left side wall is more serious than that of right side wall. The cracks distribution in case 2 of model test shows that the vault cracks much earlier than the left side wall. Because the vault of lining has the largest deformation (Figure 15c), the vault crack is wider than the crack in left side wall. The vault lining cracks also more serious than the left side wall. The right side wall has no cracks. Thus, the field inspection results of the tested section are basically consistent with the model test results, verifying the reliability of outcomes of the model test.

6.2. Cracks Characteristics of Secondary Lining

There are three lining crack types of longitudinal cracks, circumferential cracks, and diagonal cracks in the operating tunnels. The occurrence of circumferential cracks is mainly due to the uneven distribution of the longitudinal surrounding rock pressure. In this model test, the lining model is 40 cm high, and the longitudinal stress conditions are precisely the same. Therefore, there are no circumferential cracks in this test. During the test, the types of cracks are longitudinal cracks and circumferential cracks, as shown in Figure 20. In the four test cases, thirty-nine cracks were produced, including twenty-nine diagonal cracks and ten longitudinal cracks. Diagonal cracks are the main crack form of the tunnel lining structure under the effect of slide surface immersion.
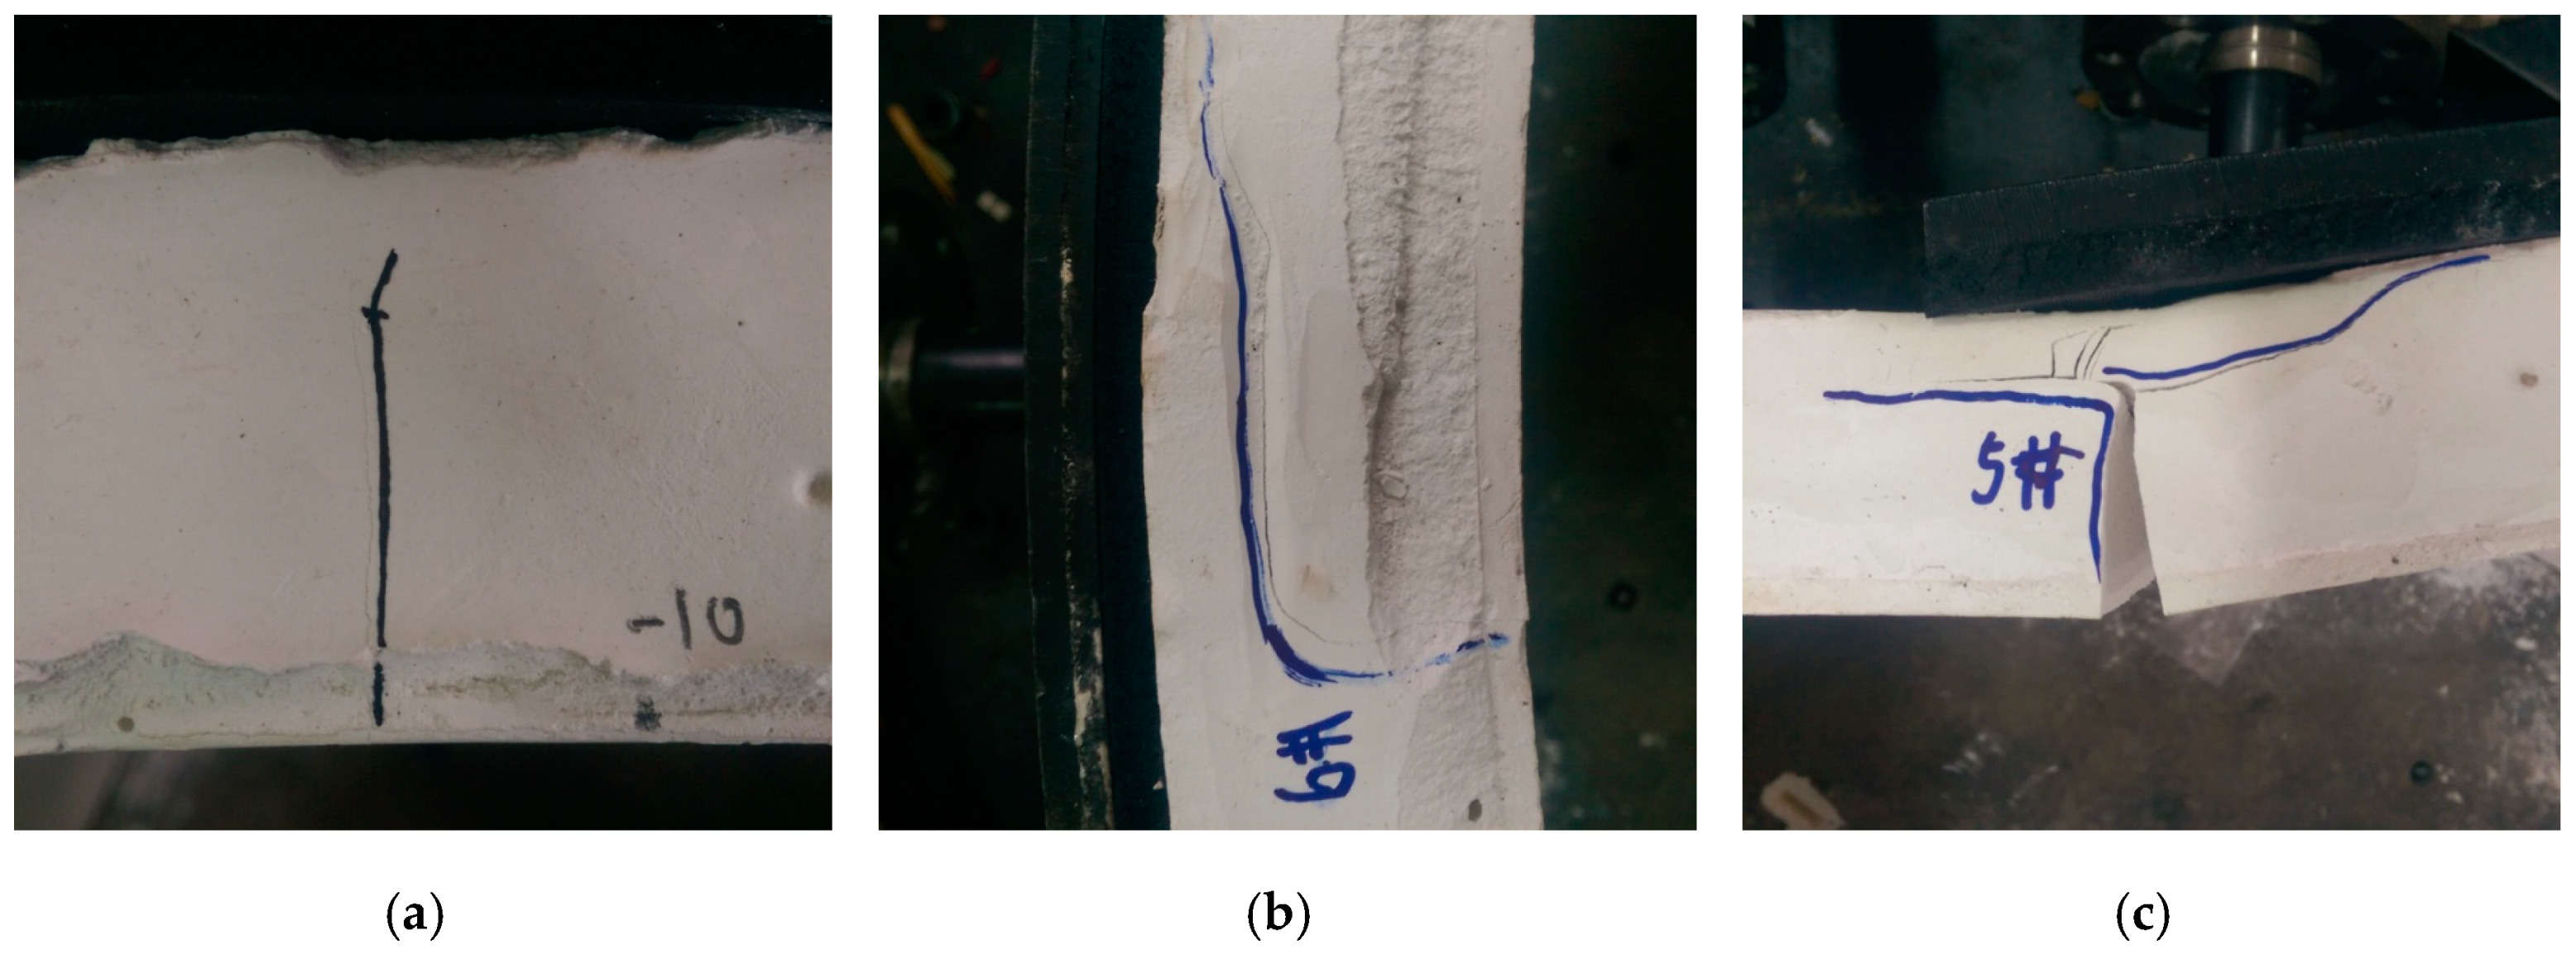
It is difficult to identify the development of cracks in the direction of the thickness of the lining in the operating tunnel. Therefore, there is a lack of data about the development of the cracks in the thickness direction. Figure 21 shows three types of cracks in the thickness direction of the lining model, which are I-type, L-type, and Y-type. During the test, it was found that the cracks have distinct development rules in the thickness direction. The cracks will always start with I-type, then develop into L-type, and finally develop into Y-type. The Y-type can lead to the instability of the lining. Therefore, I-type, L-type, and Y-type cracks can be defined as the initial crack, the medium-term crack, and the late-term crack, respectively. Among the thirty-nine cracks, six cracks are I-type and accounted for 15.4% of the total number of cracks; twenty-seven cracks are L-type, accounting for 69.2%; and six cracks are Y-type, accounting for 15.4%. The number of initial cracks is equal to that of late-term cracks, while the medium-term cracks occupy the absolute advantage of the total number of cracks.

6.3. Allowable Load Ratio of Cracked Lining

Lining with cracks is very common in operating loess tunnels. Although the lining cracking weakens the bearing capacity of the lining structure, the cracked lining can continue to bear a certain load, which changes as the lining cracks develop. The sum of loads of fifteen loading points can be considered as the total bearing capacity of the lining. The sum when the lining loses stability can be defined as the ultimate bearing capacity, which is ∑P u, and the sum when the lining cracks is ∑Pi. The difference between those two ∑Pu − ∑Pi is defined as the residual bearing capacity that the lining can continue to bear. The ratio of the residual bearing capacity to the ultimate bearing capacity (∑Pu − ∑Pi)/∑Pu is the allowable load ratio of the cracked lining. The calculation formula of the allowable load ratio is as follows:
ALR = ( n = 1 15 p u n = 1 15 P i ) / n = 1 15 P u
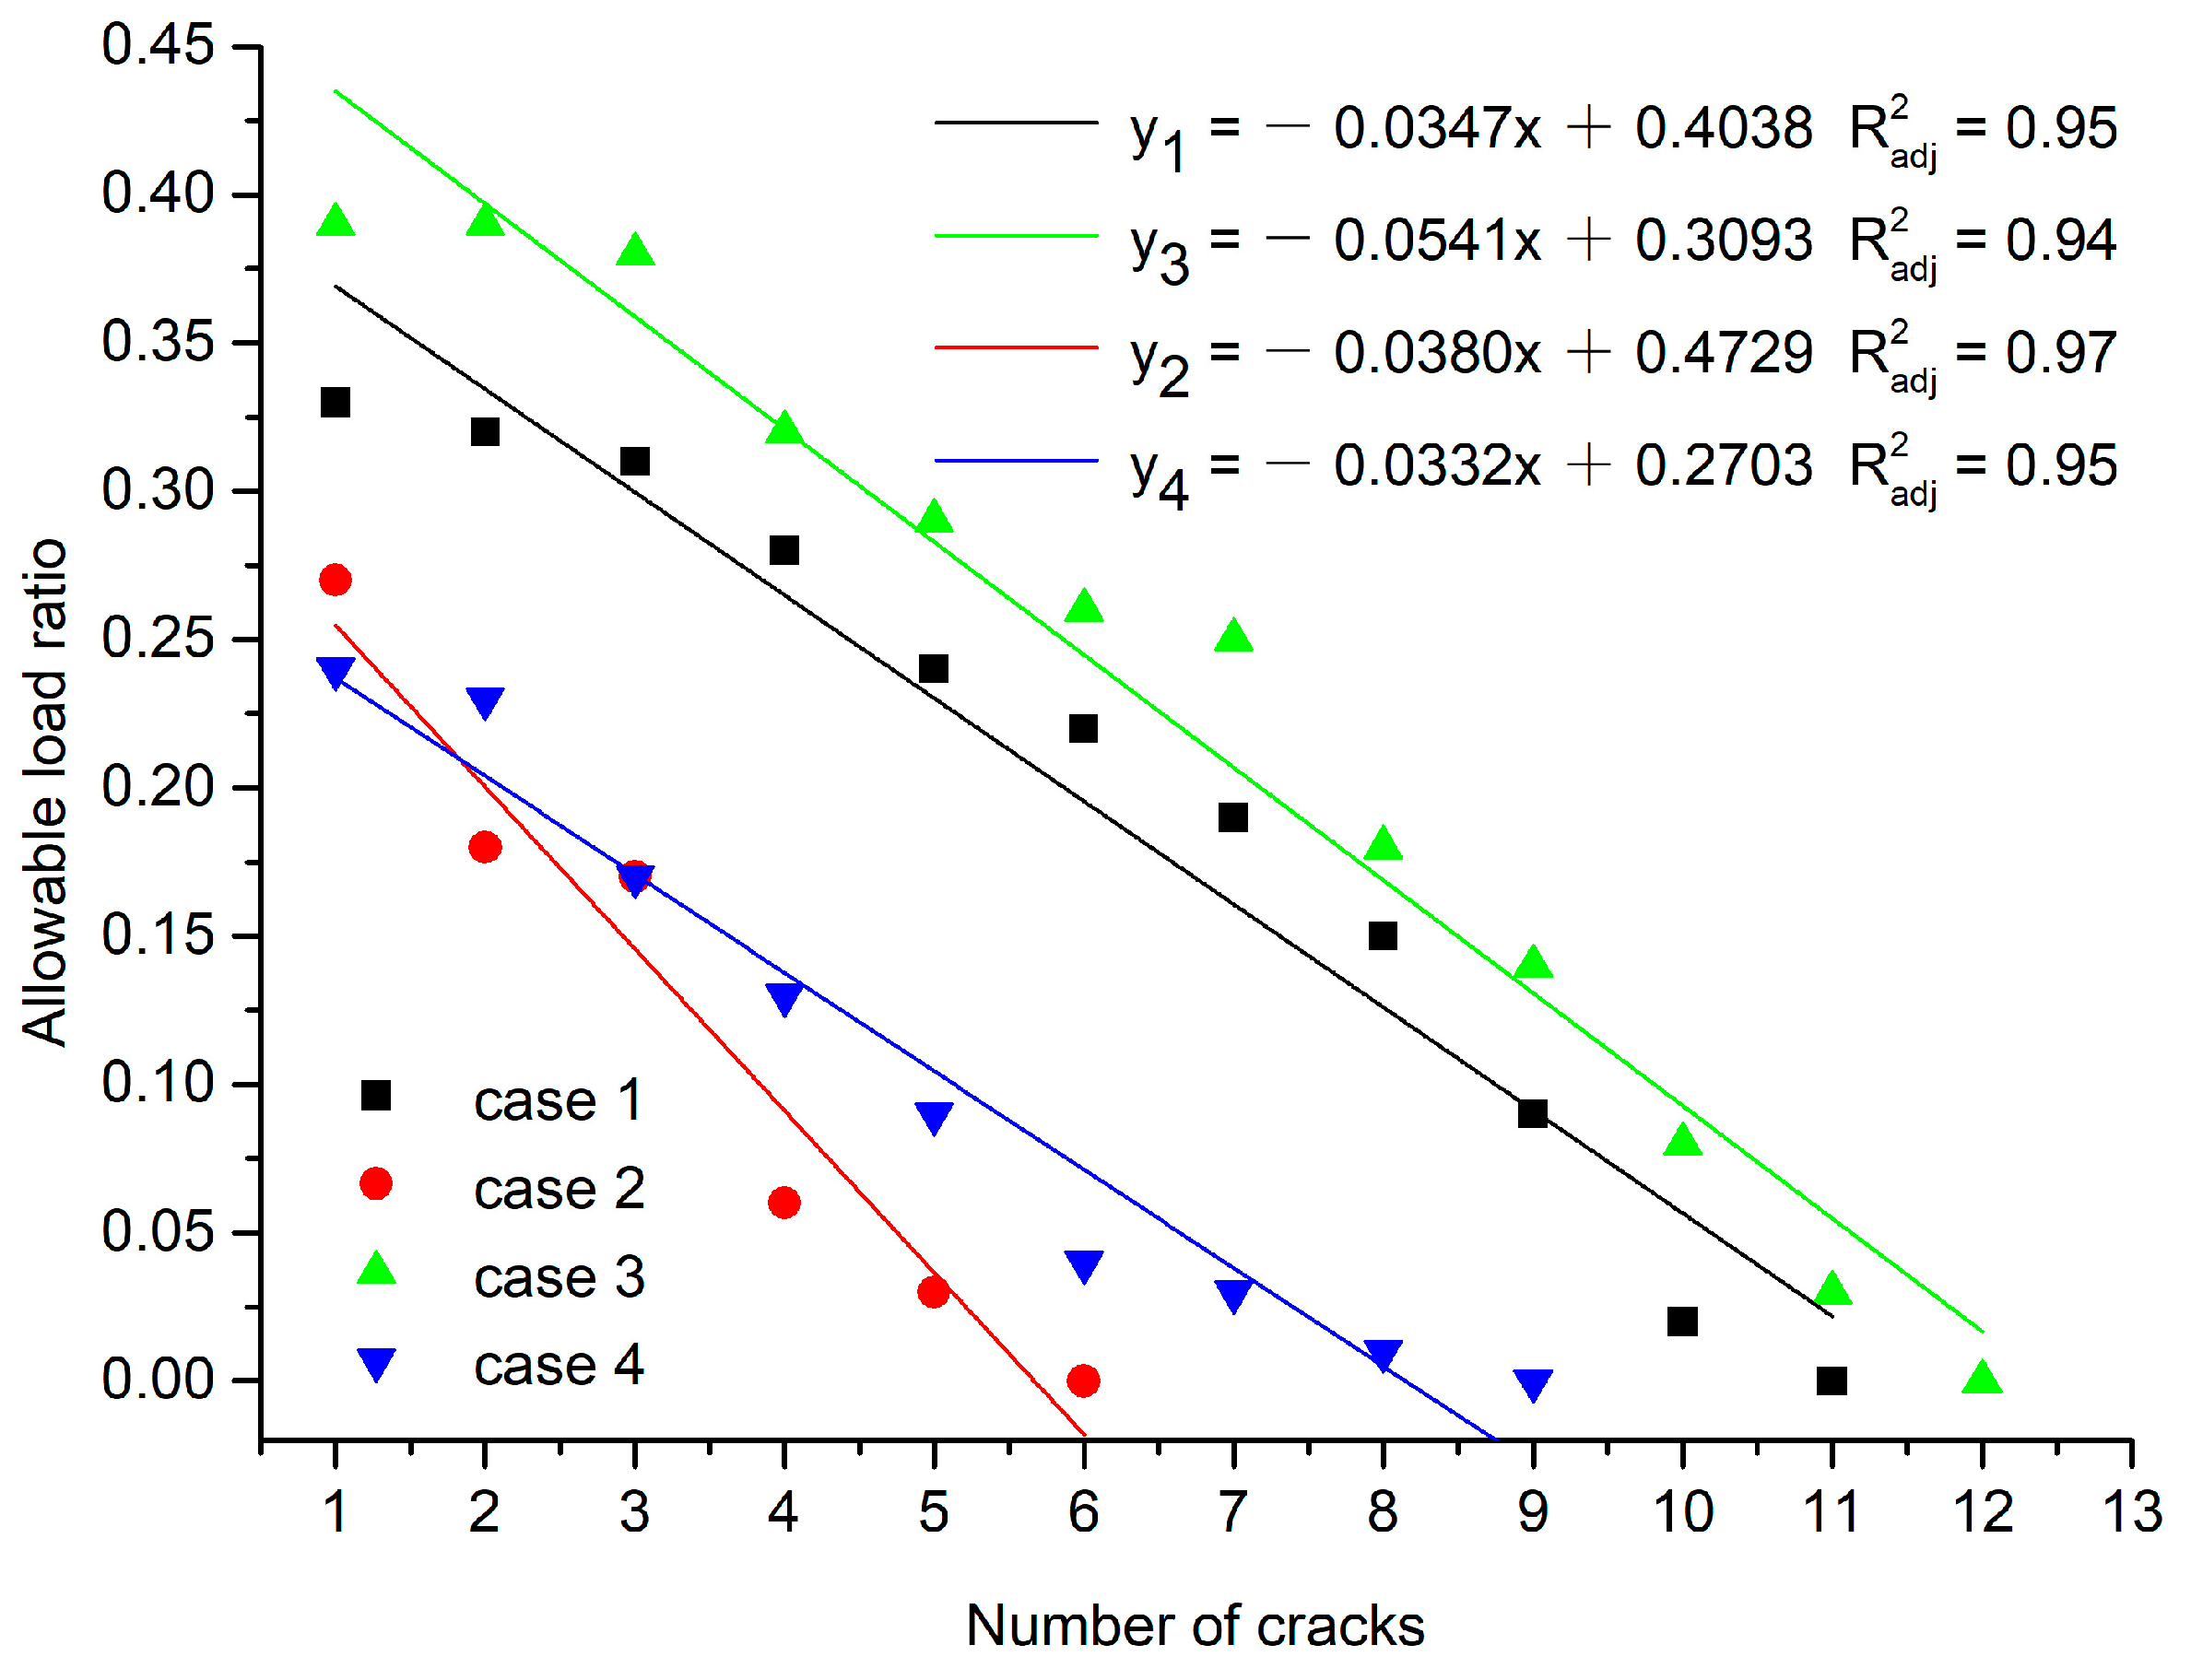
Figure 22 shows the curve of the allowable load ratio of cracked lining with the number of cracks. It can be seen that after the first cracking of the lining, the allowable load ratios of the four cases are all less than 40%, where the lining under the bilateral arch waist slide surface immersion case (case 3) has the most significant allowable load ratio of 39%. The allowable load ratios of the bilateral arch foot slide surface immersion case (case 1), the unilateral arch foot slide surface immersion case (case 2), and the unilateral arch waist slide surface immersion case (case 4) are 33%, 27%, and 24%, respectively. As the number of cracks increases, the allowable load ratio of the four cases decreases linearly with the linear fitting similarity coefficients of 0.95, 0.94, 0.97, and 0.95, respectively. The allowable load ratio of case 2 decayed fastest, and the slope of the fitted straight line is −0.0541. The decay rate of the allowable load ratio in the other three cases was the same. The slopes of the fitted straight lines were −0.0347, −0.0380, and −0.0332, respectively.

7. Conclusions

The slide surface of the shallow buried loess tunnel may diagonally develop from the surrounding rock near the arch foot or the arch waist to the ground surface. Under the bias of stratum, the slide surface only exists on one side of the tunnel. The slide surface is a channel for water infiltration. Surface water can quickly infiltrate to the lining periphery through the slide surface, resulting in the deterioration of the mechanical property of loess as well as the deformation and cracking of the lining structure in varying degrees. Based on the above background, the effect of water immersion of different slide surfaces is simulated with the change of lining load. The cracking characteristics and internal force of secondary lining are studied in detail with a multi-point independent loading test system for tunnel lining. The main conclusions are as follows.
(1) The type of slide surface of the shallow buried loess tunnel is closely related to tunnel excavation methods and stratum bias. The failure point of surrounding rock around the tunnel may be located at the arch foot or arch waist, the shape of the slide surface is an oblique straight line, and the sliding surface only exists on one side of the tunnel under the biased stratum. Four types of slide surfaces of shallow buried loess tunnel are proposed.
(2) The immersion of the slide surface has the most significant effect on the deformation of the lining vault and arch waist. The cracking of the arch foot and the inverted arch has no apparent effect on the lining deformation, while the cracking of the vault and arch waist may change the lining deformation rate. The lining cracks are symmetrically distributed under the immersion of the bilateral slide surface, and the cracks are concentrated on the immersion side of the unilateral slide surface. The appearance of compressive cracks can be regarded as a precursor of lining instability.
(3) In the bilateral slide surface immersion cases, the axial force of the lining arch always increases with fluctuating bending moment, whose cracking affects the change rate of the internal force. In unilateral slide surface immersion cases, when the failure point is the arch foot, the axial force of the lower section of the sidewall is higher than that of the upper section. When the failure point is the arch waist, the axial force of the lower section of the sidewall is smaller than that of the upper section. The lining bending moment of the unilateral slide surface immersion is significantly higher than that of the bilateral slide surface immersion.
(4) In the thickness direction, lining cracks will always begin to develop with I-type initial cracks, then develop into L-type medium-term cracks, and finally develop into Y-type late-term cracks. The proportion of cracks in the medium-term is relatively large, and the initial and late-term cracks account for a relatively small proportion.
(5) After the lining has cracked for the first time, the cracked linings under different slide surface immersion cases that can continue to bear the load ratio are all less than 40%. With the increase of cracks, the allowable load ratio of cracked lining decreases linearly. Among them, the allowable load ratio under unilateral arch waist slide surface immersion cases decayed fastest, and the decay rate of allowable load ratio under the other three slide surface immersion cases was basically the same.
Author Contributions

Conceptualization, H.L.; formal analysis, Y.L.; project administration, H.L.; validation, Y.L.; writing—original draft, Y.L.; and writing—review & editing, H.L. All authors have read and agreed to the published version of the manuscript.

Funding

This work was supported by the National Natural Science Foundation of China (Grant Nos. 51978064, 51908051), the Open Fund of State Key Laboratory of Structural Mechanics Behavior and System Safety of Traffic Engineering (Grant No. KF020-23), and the Fundamental Research Funds for the Central Universities, CHD (Grant No. 300102289101).

Conflicts of Interest

The authors declared no potential conflict of interest with respect to the research, authorship, and/or publication of this article.

References

  1. Peck, R.B. Deep excavation and tunneling in soft ground. State of the Art Report. In Proceedings of the 7th International Conference on Soil Mechanics and Foundation Engineering, Mexico City, Mexico, May 1969; pp. 5–19. [Google Scholar]
  2. Pierre, C.; Jean-François, C. Shallow tunnels in cohesionless soil: Stability of tunnel face. J. Geotech. Eng. 1994, 120, 1148–1165. [Google Scholar]
  3. Zhang, C.P.; Han, K.H.; Zhang, D.L.; Li, H.; Cai, Y. Test study of collapse characteristics of tunnels in soft ground in urban areas. China J. Rock Mech. Eng. 2014, 33, 2433–2442. [Google Scholar]
  4. Lu, Q.Z.; Peng, J.B.; Chen, Z.X.; Li, X.A. Research on the characteristics of cracks and fissures of loess and their distribution in loess plateau of china. J. Soil Water Cons. 2005, 5, 193–196. [Google Scholar]
  5. Lee, C.J.; Wu, B.R.; Chen, H.T.; Chiang, K.H. Tunnel stability and arching effects during tunneling in soft clayey soil. Tunn. Undergr. Space Technol. 2006, 21, 119–132. [Google Scholar] [CrossRef]
  6. Terzaghi, K. Earth Pressure on Temporary Supports in Cuts, Tunnels, and Shafts. In Theoretical Soil Mechanics; John Wiley & Sons: New York, NY, USA, 1943; pp. 235–264. [Google Scholar]
  7. Bierbaumer, A. Die Dimensionerung Des Tunnelmauerwerks; Engelmanm: Leipzig, Germany, 1913; pp. 152–165. [Google Scholar]
  8. Lai, J.X.; Fan, H.B.; Lai, H.P.; Xie, Y.L.; Hu, Z.; Qiu, J.L.; Cao, N.Q. In-situ monitoring and analysis of tunnel deformation law in weak loess. Rock Soil Mech. 2015, 36, 2003–2020. [Google Scholar]
  9. Luo, Y.B.; Chen, J.X.; Gao, S.T.; Deng, X.H.; Diao, P.S. Stability analysis of super-large-section tunnel in loess ground considering water infltration caused by irrigation. Environ. Earth Sci. 2017, 76, 763.1–763.17. [Google Scholar] [CrossRef]
  10. Houston, S.L.; Houston, W.N.; Spadola, D.J. Prediction of field collapse of soils due to wetting. J. Geotech. Eng. 1988, 114, 40–58. [Google Scholar] [CrossRef]
  11. Lai, H.P.; Song, W.L.; Liu, Y.Y.; Yang, W.H. Influence of flooded loessial overburden on the tunnel lining: Case study. J. Perform. Constr. Fac. 2017, 31, 04017108. [Google Scholar] [CrossRef]
  12. Shao, S.J.; Li, J.; Li, G.L.; Wang, X.D.; Jin, B.C.; Shao, S. Field immersion tests on tunnel in large-thickness collapsible loess. Chin. J. Roc. Mech. Eng. 2018, 40, 1395–1404. [Google Scholar]
  13. Li, J.; Shao, S.J.; Shao, S. Collapsible characteristics of loess tunnel site and their effects on tunnel structure. Tunn. Undergr. Space Technol. 2019, 83, 509–519. [Google Scholar] [CrossRef]
  14. Akira, I.; Shigero, I. Road tunnels in Japan: Deterioration and countermeasures. Tunn. Undergr. Space Technol. 1996, 11, 305–309. [Google Scholar]
  15. Asakura, T.; Kojima, Y. Tunnel maintenance in Japan. Tunn. Undergr. Space Technol. 2003, 18, 161–169. [Google Scholar] [CrossRef]
  16. Gblvez, J.C.; Cervenka, J.; Cendon, D.A.; Saouma, V.A. Discrete crack approach to normal shear cracking of concrete. Cement Concrete Res. 2002, 32, 1567–1585. [Google Scholar] [CrossRef]
  17. Chen, J.S.; Mo, H.H. Numerical study on crack problems in segments of shield tunnel using finite element method. Tunn. Undergr. Space Technol. 2009, 24, 91–102. [Google Scholar] [CrossRef]
  18. Xiao, J.Z.; Dai, F.C.; Wei, Y.Q. Cracking mechanism of secondary lining for a shallow and asymmetrically-loaded tunnel in loose deposits. Tunn. Undergr. Space Technol. 2014, 43, 232–240. [Google Scholar] [CrossRef]
  19. Liu, Y.Y.; Lai, H.P. Load characteristics of tunnel lining in flooded loess strata considering loess structure. Adv. Civ. Eng. 2019, 3731965. [Google Scholar] [CrossRef] [Green Version]
  20. Xie, J.X. Stratum pressure of shallow tunnel. J. Civ. Eng. 1964, 6, 58–70. [Google Scholar]
  21. Yang, F.; Yang, J.S. Limit analysis method for determination of earth pressure on shallow tunnel. Eng. Mech. 2008, 25, 179–184. [Google Scholar]
  22. Ye, C.L. Study on the Formation Mechanism of Ground Fissure during Loess Tunnel Construction and Its Control Technology. Ph.D. Thesis, Southwest Jiaotong University, Chengdu, China, 2012. [Google Scholar]
  23. Gao, X.Q.; Zhu, Y.Q.; Ye, C.L. Survey and analysis of the regularity of the surface crack in the loess tunnel of the special passenger line. Appl. Mech. Mat. 2011, 90–93, 2258–2264. [Google Scholar] [CrossRef]
  24. Liu, Y.Y.; Lai, H.P.; Xie, Y.L.; Song, W.L. Cracks analysis of highway tunnel lining in flooded loess. Proc. Inst. Civ. Eng.-Geotech. Eng. 2017, 170, 62–72. [Google Scholar] [CrossRef]
  25. Song, W.L.; Lai, H.P.; Liu, Y.Y.; Yang, W.H.; Zhu, Z.D. Field and laboratory study of cracking and safety of secondary lining for an existing highway tunnel in loess ground. Tunn. Undergr. Space Technol. 2019, 88, 35–46. [Google Scholar] [CrossRef]
  26. Zhang, Z.X.; Zhu, Y.T.; Zhu, Y.F.; Huang, X.; Zhuang, Q.W. Development and application of a 1∶1 mechanical test system for special-shaped shield lining with a large cross-section. Chin. J. Rock. Mech. Eng. 2017, 36, 2895–2905. [Google Scholar]
  27. He, C.; Feng, K.; Su, Z.X. Development and application of loading test system of prototype structure for underwater shield tunnel with large cross-section. Chin. J. Rock. Mech. Eng. 2011, 30, 254–266. [Google Scholar]
  28. Jiang, H.; Li, R.J.; Rui, X.; Liu, J.D.; Zhang, Y. Impact of geometry scale similarity levels on tunnel model test and its deductive computational difference. Rock Soil Mech. 2015, 36, 270–276. [Google Scholar]
  29. Zhou, X.W.; Pu, J.L. Centrifuge model test study of the earth pressure and deformation of tunnel lining. J. Tsinghua Univ. (Sci. Tech.) 2001, 41, 110–112, 116. [Google Scholar]
  30. Li, R.J.; Yan, R.; Liu, J.D.; Peng, G.H.; Shao, S.J.; Fan, W. A comparison of dynamic response and failure simulations in geotechnical dynamic centrifugal model tests and the key issues. Chin. Earthq. Eng. J. 2014, 36, 718–726. [Google Scholar]
  31. Lei, M.F.; Peng, L.M.; Shi, C.H. Model test to investigate the failure mechanisms and lining stress characteristics of shallow buried tunnels under unsymmetrical loading. Tunn. Undergr. Space Technol. 2015, 46, 64–75. [Google Scholar] [CrossRef]
  32. Wang, Z.Z.; Jiang, Y.J.; Zhu, C.A.; Sun, T.C. Shaking table tests of tunnel linings in progressive states of damage. Tunn. Undergr. Space Technol. 2015, 50, 109–117. [Google Scholar] [CrossRef]
  33. Fang, Y.; Xu, C.; Cui, G.; Bernadette, K. Scale model test of highway tunnel construction underlying mined-out thin coal seam. Tunn. Undergr. Space Technol. 2016, 56, 105–116. [Google Scholar] [CrossRef]
  34. Liu, B.J.; You, X.L.; Xie, Y.L.; Zhang, W.B. Analysis of problems on loess hydrocompaction in highway engineering. China J. Highway Transp. 2005, 18, 27–31. [Google Scholar]
Figure 1. Slide surface in the calculation of the surrounding rock pressure: (a) Calculation method proposed by K. Terzaghi [6]; (b) Calculation method proposed by A. Bierbaumer [7].
Applsci 10 06080 g001
Figure 2. Schematic diagram of the surrounding rock slide surface: (a) Slide surfaces proposed by A. Bierbaumer and K. Terzaghi [6,7]; (b) Slide surfaces proposed.
Applsci 10 06080 g002
Figure 3. Common construction methods of loess tunnel: (a) The two-steps method; (b) The three-steps method; (c) The center diagram method (CD); (d) The center cross diagram method (CRD).
Applsci 10 06080 g003
Figure 4. Four types of the slide surface: (a) The first type of slide surface; (b) The second type of slide surface; (c) The third type of slide surface; (d) The fourth type of slide surface.
Applsci 10 06080 g004
Figure 5. Schematic diagram of slide surface immersion.
Applsci 10 06080 g005
Figure 6. Surface cracks of the slide surface.
Applsci 10 06080 g006
Figure 7. Slide surfaces in K1841 + 475~K1841 + 495.
Applsci 10 06080 g007
Figure 8. Statistical graphs of lining cracks number (accumulation per 100 m): (a) cracks in arch part and side wall; (b) transverse and longitudinal cracks.
Applsci 10 06080 g008
Figure 9. Planar unfolding view of lining cracks.
Applsci 10 06080 g009
Figure 10. Experimental system.
Applsci 10 06080 g010
Figure 11. Loading system design.
Applsci 10 06080 g011
Figure 12. Model mold and tunnel model: (a) Self-made mold made of polyvinyl chloride (PVC) board; (b) Completed tunnel model.
Applsci 10 06080 g012
Figure 13. Internal force and deformation monitoring location: (a) The monitoring position of the internal force and deformation; (b) The monitoring element layout.
Applsci 10 06080 g013
Figure 14. Load distribution under the effect of slide surface immersion [19]. (a) Case 1, (b) Case 2, (c) Case 3, (d) Case 4, and (e) Load monitoring points.
Applsci 10 06080 g014aApplsci 10 06080 g014b
Figure 15. Deformation development curve of secondary lining. (a) Case 1, (b) Case 2, (c) Case 3, and (d) Case 4.
Applsci 10 06080 g015
Figure 16. Cracks distribution of secondary lining. (a) Case 1, (b) Case 2, (c) Case 3, and (d) Case 4.
Applsci 10 06080 g016
Figure 17. Internal force curves of the arch Sections 1–6: (a) axial force in case 1, (b) bending moment in case 1, (c) axial force in case 3, and (d) bending moment in case 3.
Applsci 10 06080 g017aApplsci 10 06080 g017b
Figure 18. Internal force curves of the sidewall Sections 7–10: (a) axial force in case 2, (b) bending moment in case 2, (c) axial force in case 4, and (d) bending moment in case 4.
Applsci 10 06080 g018
Figure 19. Comparison of inner surface cracks between test results of case 3 and lining inspection results in sections K1841 + 475~K1841 + 495.
Applsci 10 06080 g019
Figure 20. Crack form. (a) Longitudinal cracks; (b) Diagonal cracks.
Applsci 10 06080 g020
Figure 21. Crack types in the direction of the lining thickness. (a) I-type crack (15.4%), (b) L-type crack (69.2%), and (c) Y-type crack (15.4%).
Applsci 10 06080 g021
Figure 22. Curve of the allowable load ratio of cracked lining with the crack number.
Applsci 10 06080 g022
Table 1. Characteristics of the typical surrounding rock slide surface.
ProposerSurrounding Rock Failure PointFailure Angle βShape of the Slide Surface
A. Bierbaumer and K. Terzaghiarch foot45° + φ/2oblique line
Xie Jiaxiaoarch footΒ = f(φc, θ)oblique line
Yu Liarch footΒ = f(H, b, φ)broken line
Table 2. Statistics of construction methods and surrounding rock failure points of shallow buried loess tunnel.
Tunnel NameBuried Depth/mConstruction MethodExcavation Location When CollapseFailure Point
1Fengjiakai TunnelThree-steps methodMiddle steparch waist
2Erzhuangke TunnelTwo-steps methodLower stepsarch foot
3Baojiahe TunnelThree-steps methodMiddle steparch waist
4Shekouao Tunnel15–40Three-steps methodLower stepsarch foot
5Panshicha TunnelTwo-steps methodLower stepsarch foot
6Erlangcha Tunnel12–15Two-steps methodLower stepsarch foot
7Changshanliang Tunnel15–22Two-steps methodLower stepsarch foot
8Sizehe Tunnel60Two-steps methodLower stepsarch foot
9Qindong Tunnel7–26CDUpper step of right guidearch waist
10Nanzhuang TunnelThree-steps methodUpper stepsarch waist
11Zhaojiashan Tunnel34Three-steps methodUpper stepsarch waist
12UnreportedThree-steps methodLower stepsarch foot
13Dingyuan No. 1 Tunnel13.5CRDUpper step of left guidearch waist
14Yangqu No.1 Tunnel19–21CRDUpper step of left guidearch waist
15Yuanyanghui Tunnel33.3Three-steps methodUpper stepsarch waist
16Xinzhuang Tunnel60Three-steps methodLower stepsarch foot
Table 3. Statistics of the stratum bias and the location of the slide surface.
Tunnel NameBuried Depth/mStratum Bias or NotPosition of Slide Surface
1Gongyi tunnel entrance22–41Yesunilateral
2Tongluochuan tunnel entrance15–31Nobilateral
3Fenghuangqiao tunnel entrance13–57Yesunilateral
4Fenghuangqiao tunnel exit14–96Nobilateral
5Gaoqiao tunnel exit36–61Yesunilateral
6Huanglongcun tunnel11–18Nobilateral
7Hanguguan tunnel entrance14–47Nobilateral
8Lujiaya tunnel entranceNobilateral
9Changxiang tunnel entrance30Nobilateral
10Taicun tunnel entrance16–25Yesunilateral
11Panxi Tunnel entrance9.5–19Nobilateral
12Panxi Tunnel exit29–35Nobilateral
Table 4. Similarity Ratios of Key Parameters.
Physical QuantitySimilaritySimilarity Ratio
Area load C q = C L C γ 10
Elastic Modulus C E = C q 10
Stress C σ = C q 10
Strain C ε = 1 1
Linear displacement C u = C L 10
Strength C R = C L C γ 10
Table 5. Test cases.
Slide SurfaceFailure Points of Surrounding RockSlide Surface PositionImmersion Width B
Case 1No. 1 and No. 2arch footbilateral0–5 m
Case 2No. 1arch waistunilateral
Case 3No. 3 and No. 4arch footbilateral
Case 4No. 3arch waistunilateral
Table 6. Loading scheme.
Loading StageLoading SchemeLoad Steps
First: non-immersed simulationNon-immersed load divided into 10 equal parts to load step by step.1–10
Second: immersing simulationLoad value in 1–5 m width immersion is divided into five times to load.11–15
Third: instability simulationLoad difference between the immersion width of 4 m and 5 m is loaded step by step.16 instability
Table 7. Cracks distribution in each loading step.
Second Stage (Loading Steps)Third Stage (Loading Steps)
10111213141516171819202122232425
Case 1 ●●● ◆◆
Case 2
Case 3 ●● ●●
Case 4
Cracks in the arch foot and inverted arch Cracks in sidewall ◆ Cracks in the arch Compression crack.