Abstract
A tsunami is a significant coastal hazard that causes destructive damage to coastal cities in the world. Besides, tsunamis, generated on the west coast of Japan, damaged coastal cities on the east coast of Korea in 1983 and 1993. In recent years, there has been increasing interest in the potential tsunami zone near the west coast of Japan. Therefore, it is important to have tsunami observation instruments in proper locations for tsunami detection and warning aspect. This study proposes the optimal region for offshore tsunami observation instrument deployment under the limited condition that the tsunami source in out of the territorial sea by investigating areas with the highest tsunami detection probability along with maximum evacuation time and bottom slope. Using the Cornell Multi-grid Coupled Tsunami (COMCOT) numerical model and a probabilistic approach, this study suggests the optimal region for offshore tsunami detection instrument deployment to be the northeast area of Ulleung-do Island in the eastern sea of Korea.
1. Introduction
Tsunamis are one of the most destructive coastal hazards in the world [1]. According to the March 2016 Japanese National Police Agency, the 2011 Tohoku earthquake (Mw 9.0) was the fourth largest measured earthquake in history and generated a tsunami resulting in massive casualties and property damage (15,894 deaths, 6152 injuries, 2562 missing). Even areas where no floods were predicted were damaged [2]. To better anticipate tsunamis, several tsunami observation networks are now in operation throughout the world. For instance, the Deep-ocean Assessment and Reporting of Tsunamis (DART) system is a global tsunami observation network (Pacific Ocean = 47 stations, Atlantic Ocean = 7 stations, and Indian Ocean = 6 stations) that has successfully forecasted and warned of transoceanic tsunamis [3]. The DONET system operated by Japan is another tsunami observation network, consisting of 150 offshore ocean bottom-mounted sensors with seismometers and ocean bottom pressure gauges spaced 30–60 km apart along the Japan Trench. They are connected by 5800 km of fiber optic cables [3]. Japan also operates tsunami observation instruments based on Global Positioning System (GPS) buoys along the coast of Japan [4]. All of these networks observe real-time tsunamis and contribute to increased tsunami forecasting accuracy [5,6].
Earthquakes located on the west coast of Japan, where the 1983 Akita and Okushiri tsunami of 1993 earthquakes occurred, generate tsunamis that damage coastal cities on the east coast of Korea [7]. The Korea Meteorological Administration operates a tsunami warning system using a network of coastal surge gauges and tidal gauges. Since these instruments are located in coastal areas, it is difficult to issue advance tsunami warnings for the coastal areas in the Korean peninsula. In addition, the coastal tsunami observation instruments record strongly distorted tsunami waves due to, for example, the effects of resonances in bays and bottom bathymetry. It means that the tsunami wave loses the properties of the source that generated it when it is approaching the coast. Therefore, coastal tsunami observation instruments are not proper for tsunami source inversion, while the tsunami source inversion plays a crucial role in tsunami forecasting [8]. Tsunami source inversion is a method to estimate the tsunami source location based on seismic information and tsunami waveforms recorded by offshore instruments. This method increases the accuracy of tsunami forecasting, including tsunami height at coastal communities [5,6]. Therefore, installing offshore tsunami observation instruments in terms of both tsunamis early warning and forecasting reduce damage by the tsunami.
This study aims to identify optimal offshore regions for tsunami observation instrument deployment that will contribute to the tsunami early warning systems and increase the probability of tsunami detection based on numerical results from a number of potential tsunami scenarios and probability theory. This study also assumes that the offshore tsunami observation instruments will meet minimum specifications similar to the instruments used in the DART, DONET, and GPS buoy systems.
2. Materials and Methods
2.1. Potential Tsunami Scenario
Potential tsunami scenarios are used to design future tsunami observation instruments [3], and both numerical modeling and potential tsunami scenarios are required to determine the optimal tsunami instrument deployment [3]. In this study, we used 39 potential tsunami scenarios in which all sources are near the west coast of Japan [9,10,11]. To figure out the optimal region for tsunami observation instrumentation, this study only focused on the potential tsunami scenarios that can affect the east coast of Korea and used in previous studies. Cases 1–15 in Table A1 were selected and extended from potential tsunami scenarios suggested by the Disaster Control Research Center, Tohoku University, in 1995. Extended parameters in cases 1–15 from potential tsunami scenarios were calculated based on earthquake seismic gap, fault along the Okhotsk plate boundary located on the west coast of Japan. Case 17, 19, 23, and 26, respectively, are the Shakotan-oki earthquake (2 August 1940), Nigata earthquake (16 June 1964), Akita earthquake (26 May 1983), and Okusiri earthquake (12 July 1993) which are caused tsunamis and has different seismic moments. According to Choi and Hong (2001), cases 16–27 were calculated for the purpose of the numerical simulation of tsunami wave propagation to the Korean coast based on these historical earthquakes. Other cases consist of the magnitude eight potential tsunami scenarios suggested by the Korean Peninsula Energy Development Organization (KEDO) in 1999. The 39 potential tsunami sources are displayed in Figure 1, and the fault parameters are listed in Table A1 in Appendix A.
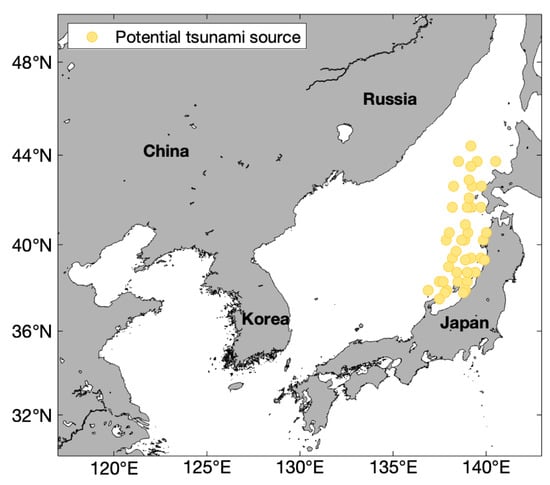
Figure 1.
The location of 39 potential tsunami sources near the west coast of Japan.
2.2. Numerical Model
To calculate 39 potential tsunami propagations into the eastern sea of Korea, we used the Cornell multi-grid coupled tsunami model (COMCOT) [12]. COMCOT is governed by linear/nonlinear shallow water equations that are resolved using leap-frog finite difference methods. It also incorporates the tsunami dispersion effect [13] and the Coriolis effect and uses both cartesian and spherical coordinate system [14]. This model has been used for many tsunami propagation and inundation studies [15,16,17], and the Korea Meteorological Administration uses COMCOT as its standard model for tsunami warning and hazard prediction. We use COMCOT to numerically calculate tsunami propagation in the eastern sea of Korea to predict tsunami occurrence and propagation based on the 39 scenarios. Figure 2 shows the numerical model domain and bathymetry used in this study. The numerical model domain covers an area of 116.9–142.9° E and 29.9–49.9° N. Our numerical modeling uses the linear shallow water equation with real bathymetry data from GEBCO (The General Bathymetric Chart of the Oceans) resampled to 30 arc seconds grid size. We set the simulation time to about 4 h with a one-second time step. The numerical modeling input information is listed in Table 1. This study only considered linear shallow water equations for potential tsunami propagation calculations. We did not set a nested grid because this study is focused only on offshore instrument deployment. Finally, we generated earthquake-induced tsunamis using the elastic fault model for instantaneous seafloor deformation. Based on the 1983 and 1993 tsunamis reaching the Korean coast 2 h after the earthquakes, we set the computation time at 4 h. Results from numerical modeling with tsunami scenario cases 04, 10, and 30 are illustrated in Figure 3.
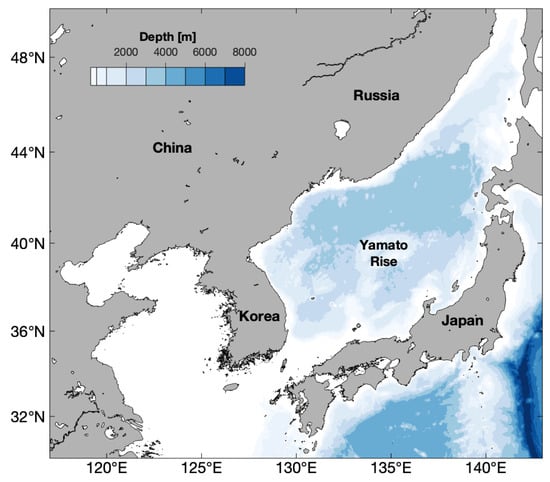
Figure 2.
Numerical model domain and bathymetry used in numerical modeling.

Table 1.
Numerical modeling information.
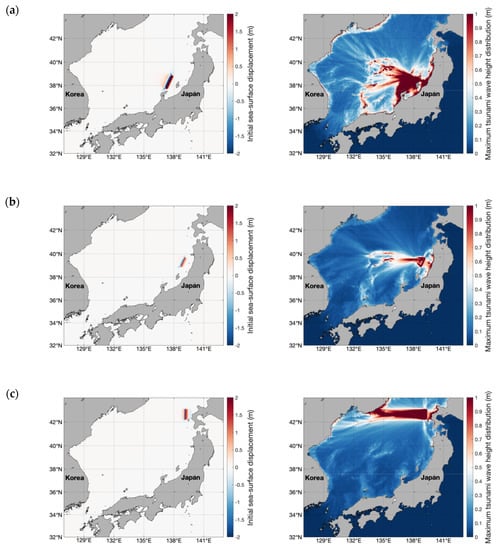
Figure 3.
Representative results of numerical modeling with potential tsunami scenarios in Table A1 (Appendix A): (a) Case 04: left—initial sea surface displacement (m), right—maximum wave height distribution (m); (b) Case 10: left—initial sea surface displacement (m), right—maximum wave height distribution (m); (c) Case 30: left—initial sea surface displacement (m), right—maximum wave height distribution (m) [18].
2.3. The Method to Determine Optimal Offshore Tsunami Observation Instrument Regions
When the observation network is far from the potential tsunami source, the tsunami observation instruments should be deployed along the real tsunami propagation path to accurately predict the damage to the coastal areas [19]. Historically, tsunamis propagated from Japan’s west coast only damaged specific eastern Korean coastal cities [20]. This means that tsunami propagation is affected by refraction (due to bottom topography, e.g., Yamato Rise in Figure 2), which creates a tsunami energy convergence region. Thus, using various fault parameters, we analyzed the main tsunami propagation area in the eastern sea of Korea. It is also essential to maximize the evacuation time (warning time) through offshore tsunami observation and consideration of the tsunami energy convergence region. Therefore, to reduce the loss of lives from a tsunami, warning time must also be considered [21,22].
To achieve this goal of the study, we set the three steps of research based on previous studies; water depth, travel time, and installation point of view [3,19,21,22]. Figure 4 shows the steps and considerations used to determine an optical deployment region for offshore tsunami observation instruments. We started by investigating maximum tsunami wave distribution resulting from our potential tsunami scenarios by numerical modeling. The fault parameters include various conditions (e.g., source location, strike angle, dip angle, and slip distribution), as shown in Table A1, which shows the diverse aspects of tsunami propagation. After narrowing down the probability area, we applied two specific criteria from previous studies, maximization warning time and installation conditions [21,22]. There are other physical, technical, financial, and legal limitations, such as public fishing rights, to consider for installation locations as well [23,24]. Still, this paper only deals with the ocean bottom slope angle as an installation condition.
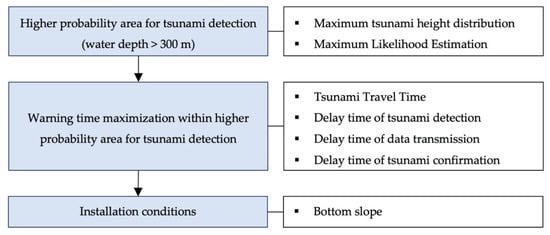
Figure 4.
Flow chart (blue box) and considerations (white box) used for determining an optical deployment region for offshore tsunami observation instruments.
3. Results
3.1. Higher Probability Area for Tsunami Detection
Tsunami observation instruments should be placed in regions where energetic tsunami-related dynamics occur [3]. Previous studies used maximum tsunami wave height distribution to determine tsunami energy location since wave energy is proportional to squared wave height [3,19]. This study also uses maximum tsunami wave height distribution as calculated using the COMCOT numerical model.
The previous studies were conducted using tsunami amplitude Empirical Orthogonal Function (EOF) spatial modes, which helped determine where the tsunami’s energy is mainly distributed [3]. The results showed the areas where the modal activity was highest. These areas match locations where tsunami energy is mainly distributed. These EOF analyses have been used to determine wind observation instrument locations for oceanographic and atmospheric research. These studies, however, including Mulia et al. (2017), have only examined a small number of potential tsunami scenarios.
Tsunamis, generated off the west coast of Japan and propagating to the eastern sea of Korea, mainly damage the eastern coastal cities of Korea due to an underwater mountain ridge called the Yamato Rise [20]. Thus, this study defines a higher tsunami detection probability in areas where tsunami energy is primarily due to topology.
Although we do not consider the accuracy of the tsunami inversion source, distorted tsunami records due to the wave transformation the shallow water region are inadequate for processing tsunami inversion sources and impact our ability to forecast tsunami hazards [25]. Therefore, the minimum water depth limit for higher probability areas was set to 300 m to avoid distorting coastal tsunami records [3] (Figure 5).
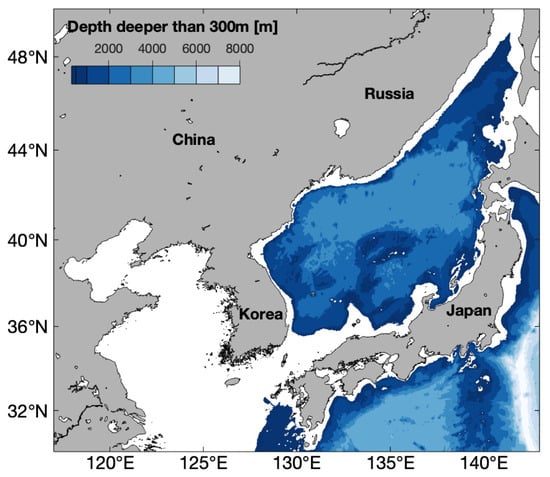
Figure 5.
Colored map of areas where water depth is greater than 300 m in the eastern sear of Korea and Japan.
To confine the higher probability areas, we used the Maximum Likelihood Estimation (MLE hereinafter) instead of EOF spatial analysis because MLE is more cost-effective. MLE is the value that maximizes probability () of the unknown parameter (θ) from observing the given data (x) from a joint probability distribution. It can be estimated by maximizing the likelihood function (L(θ)) following formula (1):
The standard MLE approach is called the frequentist method. This method has been widely used for optimizing parameters that best fit the joint probability of the given data (x) [26]. In this study, MLE was applied using various parameters to determine a location in the eastern sea of Korea with a higher likelihood of tsunami propagation.
The Korea Meteorological Administration issues tsunami warnings when there is an earthquake greater than Mw 7.0 and tsunami height reaches 0.5 m or higher at the Korean coast. Considering the effect of coastal morphology, this study estimates that the probability of a 0.1, 0.2, or 0.3m higher maximum tsunami height passing through each grid with the maximum tsunami height distribution as results of the numerical modeling. It was assumed that the occurrences of 39 tsunami scenarios were all independent. The probabilities of tsunami propagation above each standard wave heights in all grids of numerical modeling were calculated. And then, MLE results of each standard wave heights were obtained by the sum of the log probabilities. The location where has higher MLE matches the higher tsunami detection probability area because tsunamis propagate with different parameters more frequently in this region.
This method helps determine the higher probability in the tsunami detection region where far-field tsunami energy is mainly distributed under the various fault parameters. Figure 6 shows the results from the MLE, which matches tsunami energy distribution probabilities assuming various conditions. In Figure 6, it is clear that tsunami energy is mainly distributed in the eastern sea of Korea, which is indicated by the black line. The upper boundary of the black outlined area is because the South Korean territorial sea restricts the area.
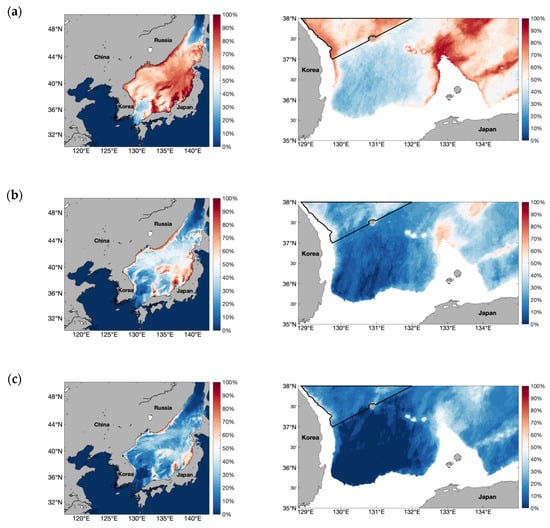
Figure 6.
MLE results for maximum tsunami wave height distribution from COMCOT numerical modeling of 39 potential tsunami scenarios. Probability results for (a) 0.1 m (b) 0.2 m and (c) 0.3 m maximum height tsunami wave. The left side displays the results in the entire numerical model domain, and the right side displays the results in the eastern sea of Korea in water depth greater than 300 m. The black line indicates the higher tsunami detection probability boundary.
To confirm whether tsunamis with the same fault parameters but different source locations have higher propagation probability in the tsunami detection region, the maximum tsunami height distributions with the same fault parameters except source location and strike angle were compared. Figure 7a shows a location map of epicenters. The detailed fault parameters are indicated in Table A1 (case 28, 33, 38). Figure 7b–d show the maximum tsunami height distribution in three different epicenters from Table A1. As shown in Figure 7b–d, before the tsunamis propagate into the eastern territorial sea of Korea, they are refracted by the Yamato Rise located in the eastern sea and mainly propagated to the higher probability tsunami detection region in the eastern territorial sea. Therefore, it was confirmed that tsunamis are mainly propagated to the higher probability tsunami detection region than other regions in the eastern territorial sea.
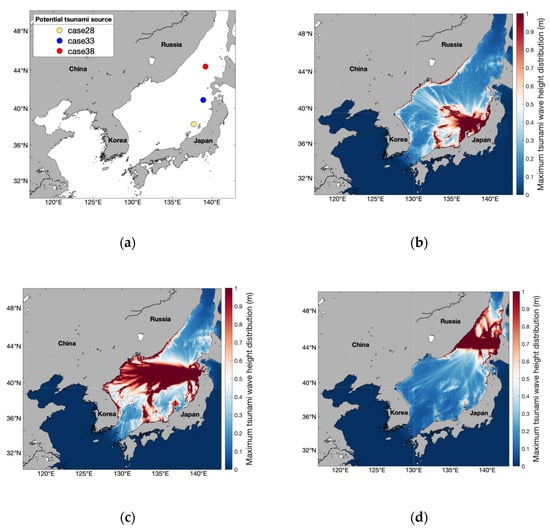
Figure 7.
Comparison of maximum tsunami height distributions with the same fault parameters except source location and strike angle: (a) Location map of potential tsunami sources. Maximum tsunami height distributions are shown for (b) case28, (c) case33, and (d) case38.
3.2. Warning Time Maximization
It is the most effective way that the Tsunami Warning Center (TWC) gets maximized warning time to reduce the damage from the unexpected, devastating tsunamis [27]. Offshore tsunami observation instruments located in high probability detection areas are not necessarily enough to maximize warning time. We investigated how to further optimize instrument deployment regions to include maximized warning time. Warning time estimations were adopted from previous studies [21,22].
The appropriate warning time for a coastal community is at least 15 min [28]. Warning time estimates can be calculated using Equation (2) [21,22]:
where is warning time for a specified coastal line, is tsunami travel time to the coastal line, and , , and are the tsunami instrument detection delay time, data transmission from the instruments to the TWC, and TWC measurement confirmation time, respectively. Previous studies estimated the sum of and to be 10 min [21,22].
This estimation is based on initial tsunami wave periods generated by underwater earthquakes at about 20-min frequencies, with 6 to 8 min to detect the first tsunami wave peak. It takes approximately 2 min to transmit the data () when using the Broadband Global Area Network (Inmarsat satellites). This is the preferred data transmission method since it has a robust, independent link to the local telecommunication system rather than a regular internet connection that could break during even an insignificant earthquake event [22]. is calculated by the TWC once it confirms the tsunami using a designated threshold value. Since there is no tsunami warning system or threshold for tsunami detection in the eastern sea of Korea, we use delay time estimation from previous studies [22]. These estimates are acceptable because offshore tsunami observation instruments are typically deployed far from coastal areas, making communications times comparable.
To determine maximum warning time, we applied the frequency method described in Section 3.1 to the , , and estimates and WT calculation from previous studies [21,22]. The tsunamis, which occurred on the west coast of Japan in 1983 and 1993, took approximately 2 h to reach the east coast of Korea [29]. In this study, we set the TTT to 2 h based on this historical information. Using Equation (2), we calculated WT as 1 h 45 min. However, when considering both the location of the offshore tsunami observation instruments and that WT should be at least 15 min, offshore tsunami observation instruments should detect tsunami components within 1.5 h after the earthquake. To understand tsunami arrival time clearly, Figure 8 shows a time series of randomly chosen points (131.3640° E, 37.9726° N) to indicate tsunami arrival time. All parts of the grid are assumed to be in the higher probability detection area and are in the optimal instrument deployment location. We extracted a time series for tsunami arrival time. Figure 9 shows that the probability of tsunami travel time is less than 1.5 h after the earthquake in each grid of 39 potential tsunami scenarios. Furthermore, by multiplying the probability of Figure 9 and the result of maximum likelihood estimation, the optimal area of the tsunami observation instrumentation in the eastern sea of Korea was identified as shown in Figure 10. Results suggest that the region northeast of Ulleung-do is the optimal offshore region for instrument deployment.
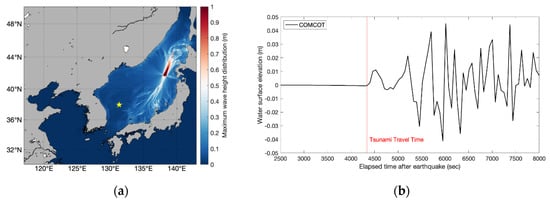
Figure 8.
Tsunami arrival time for scenario 01 in Table A1. (a) Randomly chosen point (yellow star, (131.3640° E, 37.9726° N)) displays the maximum tsunami wave height distribution. (b) Water surface elevation at the same random point. The red line indicates the Tsunami Travel Time of a randomly chosen location.
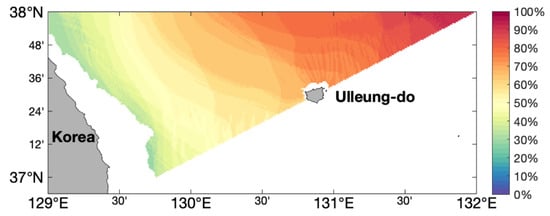
Figure 9.
The probability of tsunami travel time that is less than 1.5 h after the earthquake using 39 potential tsunami scenarios.
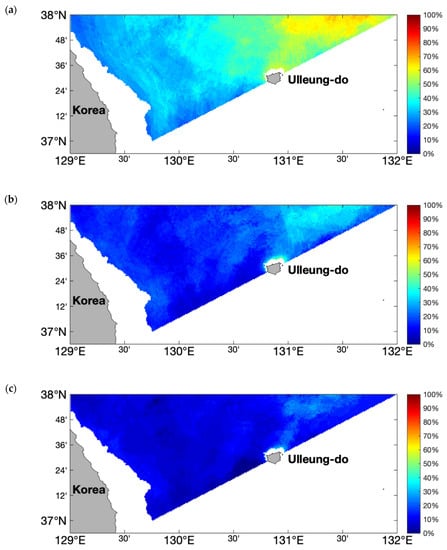
Figure 10.
The product of MLE and the probability of tsunami travel time within 1.5 h after the earthquake. Probability results for (a) 0.1 m, (b) 0.2 m, and (c) 0.3 m maximum tsunami height.
3.3. Installation Conditions: Bottom Slope
An additional consideration is necessary to determine whether the region chosen for deploying the offshore tsunami observation instruments is appropriate for installing the bottom-mounted sensors. Physical installation conditions include the distance from the earthquake source and flat ocean bottom slope [21]. The instruments should be located in a safe area to avoid earthquake destruction. This study only considered potential tsunami scenarios on the west coast of Japan, so we focused only on a flat ocean bottom slope as the installation condition. We calculated ocean bottom slope using the same GEBCO bathymetry data that we used for our numerical model input. The standard allowable ocean bottom slope for instrumentation installation is less than 8° [21]. Considering all of these conditions for all 39 tsunami scenarios, Figure 11 shows the optimal region of tsunami observation instrument deployment. Figure 11a indicates the bottom slope is less than 8° in most areas of our interest except the region near the Ulleung-do island. Figure 11b shows the example result of the colored map for optimal instrument deployment region by considering both Figure 10a and Figure 11a.
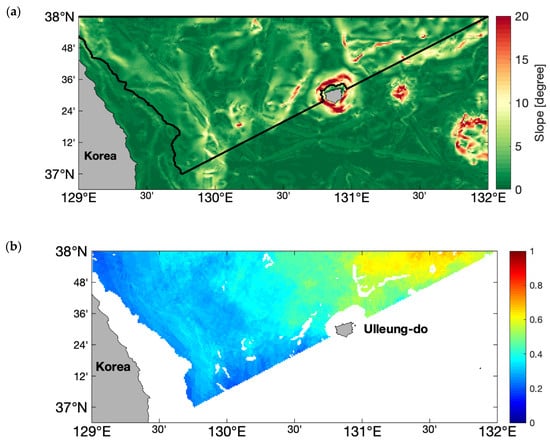
Figure 11.
Optimal area for offshore tsunami observation instrument deployment. (a) Ocean bottom slope for the higher probability area in the eastern sea of Korea (the black line is the boundary area); (b) The product of MLE and probability of tsunami travel time within 1.5 after the earthquake over a flat ocean bottom. The MLE results for 0.1 m maximum tsunami wave height.
4. Discussion
We hypothesized that the optimal region for offshore tsunami detection instrument deployment could be determined using numerical simulation and the results of previous studies concerning water depth, warning time, and bottom slope [3,19,21,22]. This study used the MLE method as opposed to EOF, which had been used in previous studies, and successfully determined an area for optimal instrumentation deployment.
Future work will include: (1) developing a method for tsunami source inversion based on the optimally installed instruments from this study; (2) more extensive coverage of optimal regions by considering additional tsunami scenarios that can affect Korea (e.g., Ryukyu trench) [30]; and (3) consideration of financial and legal limitations.
5. Conclusions
This study investigated the optimal deployment region for offshore tsunami observation instruments in order to reduce coastal hazards for the east coast of Korea in terms of early warning. This study hypothesized that the optimal region of offshore instrument deployment for tsunami detection could be determined for far-field tsunami cases based on numerical simulation (COMCOT) by adopting the approaches of previous studies (water depth, warning time, and bottom slope) for near-field tsunami cases [3,19,21,22]. Plus, various tsunami propagations were calculated by numerical modeling (COMCOT) with 39 potential tsunami scenarios. The results were applied to the approaches of previous studies to identify optimal deployment for offshore tsunami observation instruments [3,9,21,22]. The approach in this study considered the higher probability of tsunami detection, frequentist method, with the minimum instrument and the maximum warning time, and bottom slope according to the current situation in Korea, far-field tsunami occurrences. The frequentist method, i.e., MLE, instead of EOF, which was used in the previous studies, was adopted to determine the cost-effectiveness in a large number of tsunami scenario cases. The bottom slope could be considered when bottom-mounted sensors are installed for tsunami detection. Three major steps for the approach are listed below;
- Define a high probability area for tsunami detection using numerical modeling based on 39 potential tsunami scenarios.
- Define the probability area of maximum warning time by considering tsunami travel time, the delay time of detection, data transmission time, and measurement confirmation time.
- Specify the probability map for the optimal region of offshore tsunami instrument by the product of the probability of tsunami detection and warning time.
- Consider the bottom slope required for tsunami instrument installation.
We conclude that the northeast area around Ulleung-do island is the optimal region for installing offshore tsunami observation instruments. The approach in this study successfully identified the optimal area for instrumentation in the case that the tsunami source is far from the territorial sea. This study provides the framework for the guidance of offshore tsunami observation instrument installation in the Korea tsunami warning system.
Author Contributions
Introduction, E.L.; data curation, E.L.; the result, E.L. and T.J.; analysis of results, E.L. and S.S.; writing—original draft preparation, E.L.; writing—review and editing, S.S. All authors have read and agreed to the published version of the manuscript.
Funding
This research was funded by Korea Meteorological Institute, grant number KMI2018-02510 and was supported by the Brain Korea 21 plus program through the National Research Foundation (NRF) funded by the Ministry of Education of Korea.
Conflicts of Interest
The authors declare no conflict of interest.
Appendix A
Table A1.
Fault parameters for potential tsunami scenarios on the west coast of Japan.
Table A1.
Fault parameters for potential tsunami scenarios on the west coast of Japan.
| Case | Location | H (km) | θ (°) | δ (°) | λ (°) | L (km) | W (km) | D (m) | |
|---|---|---|---|---|---|---|---|---|---|
| Latitude (°N) | Longitude (°E) | ||||||||
| 1 | 41.7 | 138.2 | 3 | 110 | 45 | 100 | 45 | 25 | 2.3 |
| 2 | 41.7 | 139.7 | 3 | 110 | 45 | 100 | 45 | 25 | 2.3 |
| 3 | 38.3 | 137.5 | 1 | 23 | 35 | 90 | 140 | 50 | 5 |
| 4 | 38.3 | 138.5 | 1 | 23 | 35 | 90 | 140 | 50 | 5 |
| 5 | 38.3 | 139 | 1 | 23 | 35 | 90 | 140 | 50 | 5 |
| 6 | 39.4 | 138.2 | 1 | 105 | 45 | 90 | 100 | 50 | 4.1 |
| 7 | 39.4 | 139.2 | 1 | 105 | 45 | 90 | 100 | 50 | 4.1 |
| 8 | 39.4 | 139.7 | 1 | 105 | 45 | 90 | 100 | 50 | 4.1 |
| 9 | 39.3 | 138.9 | 1 | 23 | 45 | 75 | 100 | 50 | 2 |
| 10 | 39.3 | 139.9 | 1 | 23 | 45 | 75 | 100 | 50 | 2 |
| 11 | 37.9 | 136.9 | 1 | 15 | 20 | 90 | 70 | 40 | 3.2 |
| 12 | 37.9 | 137.9 | 1 | 15 | 20 | 90 | 70 | 40 | 3.2 |
| 13 | 37.9 | 138.9 | 1 | 15 | 20 | 90 | 70 | 40 | 3.2 |
| 14 | 37.8 | 137.8 | 1 | 190 | 55 | 90 | 60 | 20 | 1.9 |
| 15 | 37.8 | 138.8 | 1 | 190 | 55 | 90 | 60 | 20 | 1.9 |
| 16 | 43.73 | 138.53 | 1 | 347 | 40 | 90 | 100 | 35 | 5.35 |
| 17 | 43.73 | 139.53 | 1 | 347 | 40 | 90 | 100 | 35 | 5.35 |
| 18 | 43.73 | 140.53 | 1 | 347 | 40 | 90 | 100 | 35 | 5.35 |
| 19 | 38.74 | 138.42 | 1 | 189 | 56 | 90 | 80 | 30 | 7.81 |
| 20 | 38.74 | 139.42 | 1 | 189 | 56 | 90 | 80 | 30 | 7.81 |
| 21 | 38.74 | 139 | 1 | 189 | 56 | 90 | 80 | 30 | 7.81 |
| 22 | 40.21 | 137.84 | 1 | 22 | 40 | 90 | 40 | 30 | 7.6 |
| 23 | 40.21 | 138.84 | 1 | 22 | 40 | 90 | 40 | 30 | 7.6 |
| 24 | 40.21 | 139.84 | 1 | 22 | 40 | 90 | 40 | 30 | 7.6 |
| 25 | 42.63 | 138.24 | 5 | 1 | 24 | 84 | 100 | 50 | 3.7 |
| 26 | 42.63 | 139.24 | 5 | 1 | 24 | 84 | 100 | 50 | 3.7 |
| 27 | 42.63 | 139.74 | 5 | 1 | 24 | 84 | 100 | 50 | 3.7 |
| 28 | 38.3 | 137.7 | 1 | 14.5 | 40 | 90 | 125.89 | 62.95 | 6.31 |
| 29 | 37.5 | 137.5 | 1 | 0 | 40 | 90 | 125.89 | 62.95 | 6.31 |
| 30 | 39 | 138 | 1 | 27.5 | 40 | 90 | 125.89 | 62.95 | 6.31 |
| 31 | 39.7 | 138.4 | 1 | 17 | 40 | 90 | 125.89 | 62.95 | 6.31 |
| 32 | 40.2 | 138.7 | 1 | 10 | 40 | 90 | 125.89 | 62.95 | 6.31 |
| 33 | 40.9 | 138.9 | 1 | 1 | 40 | 90 | 125.89 | 62.95 | 6.31 |
| 34 | 41.7 | 139 | 1 | 1 | 40 | 90 | 125.89 | 62.95 | 6.31 |
| 35 | 42.1 | 139.1 | 1 | 4 | 40 | 90 | 125.89 | 62.95 | 6.31 |
| 36 | 42.9 | 139.1 | 1 | 2 | 40 | 90 | 125.89 | 62.95 | 6.31 |
| 37 | 43.5 | 139.2 | 1 | 2 | 40 | 90 | 125.89 | 62.95 | 6.31 |
| 38 | 44.4 | 139.2 | 1 | 3 | 40 | 90 | 125.89 | 62.95 | 6.31 |
| 39 | 38.3 | 137.7 | 1 | 14.5 | 40 | 90 | 125.9 | 62.9 | 6.3 |
References
- Pugh, D.; Woodworth, P. Sea-Level Science: Understanding Tides, Surges, Tsunamis and Mean Sea-Level Changes; Cambridge University Press: Cambridge, UK, 2014. [Google Scholar] [CrossRef]
- Mori, N.; Goda, K.; Cox, D. Recent Process in Probabilistic Tsunami Hazard Analysis (PTHA) for Mega Thrust Subduction Earthquakes. In The 2011 Japan Earthquake and Tsunami: Reconstruction and Restoration; Springer: Cham, Switzerland, 2018; pp. 469–485. [Google Scholar] [CrossRef]
- Mulia, I.E.; Gusman, A.R.; Satake, K. Optimal Design for Placements of Tsunami Observing Systems to Accurately Characterize the Inducing Earthquake. Geophys. Res. Lett. 2017, 12, 12,106–12,115. [Google Scholar] [CrossRef]
- Kawai, H.; Satoh, M.; Kawaguchi, K.; Seki, K. Characteristics of the 2011 Tohoku Tsunami Waveform Acquired Around Japan by Nowphas Equipment. Coast. Eng. J. 2018, 55, 1350008-1–1350008-27. [Google Scholar] [CrossRef]
- Percival, D.B.; Denbo, D.W.; Eblé, M.C.; Gica, E.; Mofjeld, H.O.; Spillane, M.C.; Tang, L.; Titov, V. V Extraction of tsunami source coefficients via inversion of DART buoy data. Nat. Hazards 2010, 58, 567–590. [Google Scholar] [CrossRef]
- Takagawa, T.; Tomita, T. Effects of Rupture Processes in an Inverse Analysis on the Tsunami Source of the 2011 off the Pacific Coast of Tohoku Earthquake. In Proceedings of the 22th International Society of Offshore and Polar Engineers (ISOPE), Rhodes, Greece, 17–22 June 2012. [Google Scholar]
- Japan Society of Civil Engineers. Available online: http://committees.jsce.or.jp/ceofnp/system/files/NPP_TNMT_2016_main_20170814.pdf (accessed on 15 September 2019).
- Levin, B.W.; Nosov, M. Physics of Tsunamis; Springer International Publishing: Cham, Switzerland, 2009; 237p. [Google Scholar]
- Choi, B.H.; Hong, S.J.; Pelinovsky, E. Simulation of prognostic tsunamis on the Korean Coast. Geophys. Res. Lett. 2001, 28, 2013–2016. [Google Scholar] [CrossRef]
- Kim, B.J.; Cho, Y.-S. Determination of Tsunami Height Distribution with L-moment Method. J. Korean Soc. Hazard Mitig. 2014, 14, 311–317. [Google Scholar] [CrossRef]
- Rehman, K.; Cho, Y.-S. Building Damage Assessment Using Scenario Based Tsunami Numerical Analysis and Fragility Curves. Water 2016, 8, 109. [Google Scholar] [CrossRef]
- Liu, P.L.F.; Cho, Y.S.; Yoon, S.B.; Seo, S.N. Numerical Simulations of the 1960 Chilean Tsunami Propagation and Inundation at Hilo, Hawaii. In Tsunami: Progress in Prediction, Disaster Prevention and Warning. Advances in Natural and Technological Hazards Research.; Tsuchiya, Y., Shuto, N., Eds.; Springer: Dordrecht, Switzerland, 1995; Volume 4, pp. 99–115. [Google Scholar]
- Yoon, S.B. Propagation of distant tsunamis over slowly varying topography. J. Geophys. Res. 2002, 107, 4-1–4-11. [Google Scholar] [CrossRef]
- Wang, X. Numerical Modelling of Surface and Internal Waves over Shallow and Intermediate Water. Ph.D. Dissertation, Cornell University, New York, NY, USA, August 2008. [Google Scholar]
- Wu, T.-R.; Chen, P.-F.; Tsai, W.-T.; Chen, G.-Y. Numerical Study on Tsunamis Excited by 2006 Pingtung Earthquake Doublet. Terr. Atmos. Ocean. Sci. 2008, 19, 705–715. [Google Scholar] [CrossRef]
- Lee, J.-W.; Park, E.H.; Park, S.-C.; Woo, S.-B. Development of the Global Tsunami Prediction System using the Finite Fault Model and the Cyclic Boundary Condition. J. Korean Soc. Coast. Ocean Eng. 2015, 27, 391–405. [Google Scholar] [CrossRef][Green Version]
- Mueller, C.; Power, W.; Fraser, S.; Wang, X. Effects of rupture complexity on local tsunami inundation: Implications for probabilistic tsunami hazard assessment by example. J. Geo Res. Solid Earth 2015, 120, 488–502. [Google Scholar] [CrossRef]
- Lee, E.; Jung, T.; Kim, J.-C.; Shin, S. A Study of the Optimal Deployment of Tsunami Observation Instruments in Korea. J. Ocean Eng. Technol. 2019, 33, 607–614. [Google Scholar] [CrossRef]
- Meza, J.; Catalán, P.A.; Tsushima, H. A Methodology For Optimal Designing Of Monitoring Sensor Networks For Tsunami Inversion. Nat. Hazards Earth Syst. Sci. Discuss. 2018. under review. [Google Scholar]
- Jeon, Y.J.; Lee, S.M.; Lim, C.H.; Yoon, S.B. Propagation Characteristics of 1983 Central East Sea Tsunami. In Proceedings of the Korean Society of Civil Engineers, Daegu, Korea, 11 October 2007. [Google Scholar]
- Omira, R.; Baptista, M.A.; Matias, L.; Miranda, J.M.; Catita, C.; Carrilho, F.; Toto, E. Design of a Sea-level Tsunami Detection Network for the Gulf of Cadiz. Nat. Hazards Earth Syst. Sci. 2009, 9, 1327–1338. [Google Scholar] [CrossRef]
- Schindele, F.; Loevenbruck, A.; Hebert, H. Strategy to design the sea-level monitoring networks for small tsunamigenic oceanic basins: The Western Mediterranean case. Nat. Hazards Earth Syst. Sci. 2008, 8, 1019–1027. [Google Scholar] [CrossRef][Green Version]
- Araki, E.; Kawaguchi, K.; Kaneko, S.; Kaneda, Y. Design of Deep Ocean Submarine Cable Observation Network for Earthquakes and Tsunamis. In Proceedings of the OCEANS 2008-MTS/IEEE Kobe Techno-Ocean, Kobe, Japan, 8–11 April 2008. [Google Scholar]
- Abe, I.; Imamura, F. Problems and effects of a tsunami inundation forecast system during the 2011 Tohoku earthquake. J. Jpn. Soc. Civ. Eng. 2013, 1, 516–520. [Google Scholar] [CrossRef]
- Gusman, A.R.; Murotani, S.; Satake, K.; Heidarzadeh, M.; Gunawan, E.; Watada, S.; Schurr, B. Fault slip distribution of the 2014 Iquique, Chile, earthquake estimated from ocean-wide tsunami waveforms and GPS data. Geophys. Res. Lett. 2015, 42, 1053–1060. [Google Scholar] [CrossRef]
- Miura, K. An Introduction to Maximum Likelihood Estimation and Information Geometry. Interdiscip. Inf. Sci. 2017, 17, 155–174. [Google Scholar] [CrossRef]
- Okal, E.A. The quest for wisdom: Lessons from 17 tsunamis, 2004–2014. Philos Trans. Math. Phys. Eng. Sci. 2015, 373, 20140370. [Google Scholar] [CrossRef] [PubMed]
- IOC-UNESCO. An Intra Americas Sea Tsunami Warning System Project Proposal; UNESCO Intergovernmental Oceanographic Commission: Paris, France, 2005. [Google Scholar]
- Kim, H.S.; Kim, H.S.; Kang, Y.S. The Investigation of Tsunami Occurrence and Warning System. In Proceedings of the Korean Society of Marine Engineering, Gyeongju, Korea, 26–28 June 2008. [Google Scholar]
- Outsourced Setting of Okinawa Tsunami Inundation Assumptions. Available online: https://www.pref.okinawa.jp/site/doboku/kaibo/h27tunami/documents/gaiyoubann4-1.pdf (accessed on 12 August 2019).
© 2020 by the authors. Licensee MDPI, Basel, Switzerland. This article is an open access article distributed under the terms and conditions of the Creative Commons Attribution (CC BY) license (http://creativecommons.org/licenses/by/4.0/).