1. Introduction
Owing to the exacerbated aging of structures as a result of natural disasters or earthquakes, it is essential to monitor damage status in reinforced concrete structures for both safety and economic considerations. Accordingly, the demand has increased for structural health monitoring (SHM) technology in civil engineering [
1,
2]. In recent years, such monitoring has been mainly performed by non-destructive testing (NDT) methods. This method is advantageous because flaws in materials or systems are inspected without causing damage to the objects; therefore, the structures can still be used during the test. Acoustic emission (AE), one of the dynamic technologies used in non-destructive inspections [
3,
4,
5,
6,
7], involves elastic waves produced by the application of external impact that are radiated by sudden changes in the stress state of some regions in the material [
8,
9]. The AE method is a passive technique that identifies defects, flaws, and cracks that develop only during the monitoring [
10,
11]. This is a distinguishing point compared with other NDT methods that need to apply an artificial source such as a hammer or ultrasonic waves to the target material. Thus, the AE testing method can effectively detect the deterioration of materials as soon as the damages occur [
2,
12], whereas other NDT methods are applied before or after the loading of structures [
10]. Furthermore, the AE technique can even detect microcracks in materials and can continuously determine the degree of damage in real time. Owing to the advantageous characteristics of this method, it is considered to be suitable for monitoring systems of concrete structures [
13]. The AE monitoring system consists of an AE sensor, an amplifying and filtering system, and data acquisition equipment. On the basis of the monitored AE signal, the system can detect signs for failure before the critical failure occurs in the materials.
In monitoring systems, AE techniques have been applied to detect the crack location, quantify the degree of damage, and determine the crack classification of concrete structures [
14,
15,
16]. Accordingly, many studies have been conducted on AE characteristics, including propagation distance, source location estimation, and crack classification in the concrete material [
12,
14,
17,
18,
19,
20,
21,
22,
23].
Table 1 summarizes the reports of AE characteristics in studies conducted after 2011 according to main research topics.
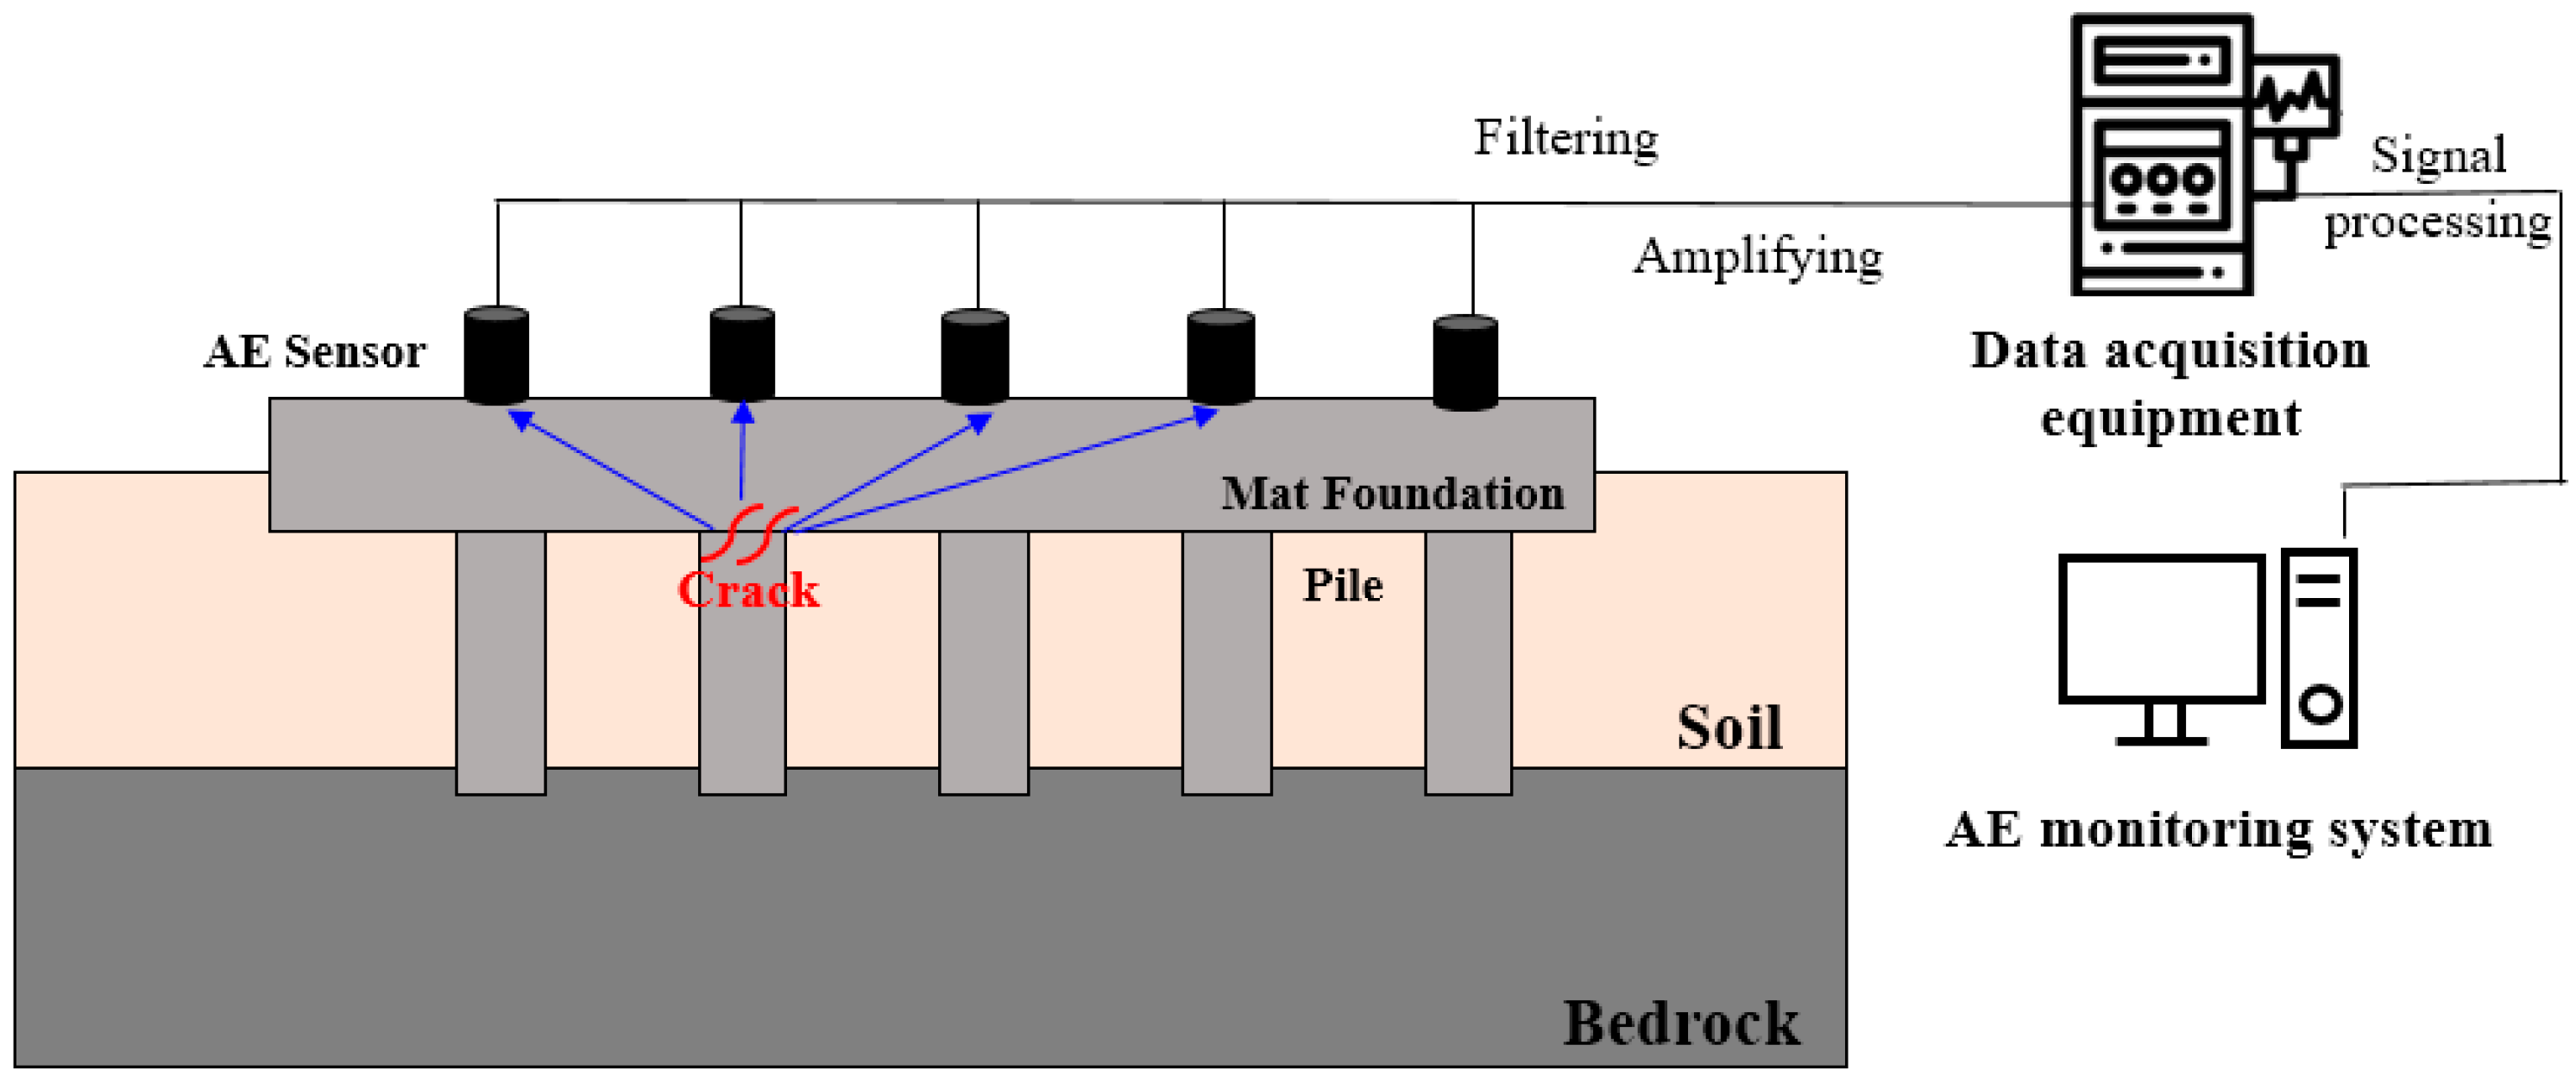
The AE system can be usefully applied to monitor concrete structures in civil engineering. For example, this system can be particularly effective for foundation monitoring because damages in foundations are not visible using a typical monitoring system (
Figure 1). Even though the internal crack of foundations is not visible, it may have a critical effect on the foundation safety, which determines the overall safety of buildings or structures. If the foundation is damaged by external impact, the induced damage can be detected by AE passive techniques in the early failure stage. For practical application of AE techniques in such monitoring systems, the effects of elastic wave energy and wave propagation distance on the AE parameters should be investigated. This is because in monitoring systems, the degree of damage can be estimated using the received AE signals based on the AE energy parameters. In addition, the AE propagation distance determines the sensor arrangement in a monitoring system. These issues are meaningful for increased applicability of AE monitoring to concrete structures.
Once the elastic wave is generated, it then travels throughout the material and can be detected at considerable distances from its point of origin [
24]. Propagating from its source to the point of detection, the wave is subjected to all of the characteristics and variations of its acoustic path. During propagation, the wave energy is attenuated by spreading and scattering by both microscopic and macroscopic variations in the structure media [
24,
25]. Considering the aforementioned attenuation characteristics of the AE, the wave energy has a significant effect on the propagation characteristics of the AE. If the AE characteristics according to the impact energy are analyzed in advance, the impact energy applied to the structure can be reversely estimated by measuring the AE parameters. Nevertheless, previous studies lack investigations of the propagation characteristics of AE according to the energy induced from external impact in concrete structures. Therefore, it is necessary to investigate the effect of acoustic energy on the wave propagation distance.
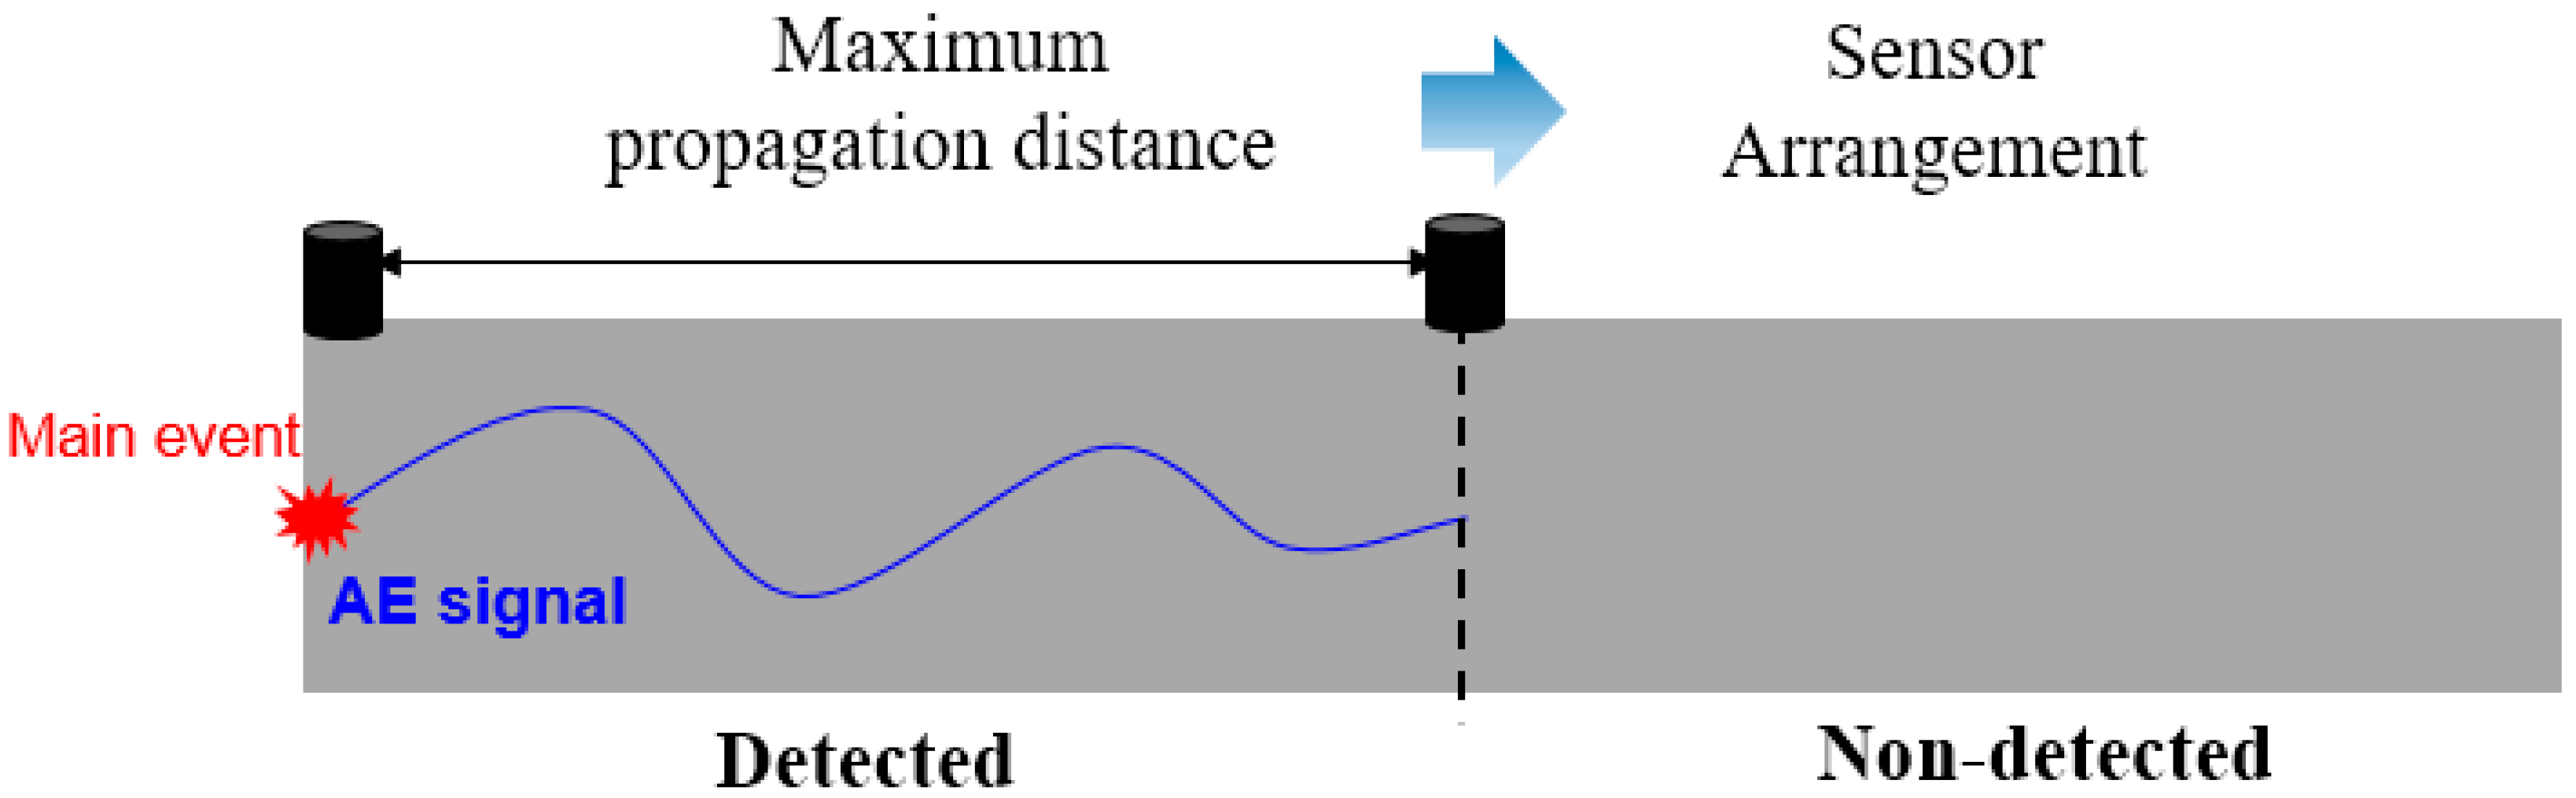
Moreover, AE techniques should be tested in actual-sized structures to overcome limitations caused by scale problems. Because the acoustic waves in laboratory specimens do not spread widely in all directions owing to the small scale, the wave attenuation effect is not properly considered in lab tests. Thus, research on AE techniques in actual-sized structures is needed to evaluate the applicability of AE monitoring systems to the field. In field applications of AE monitoring systems, sensor arrangement is determined on the basis of the wave propagation distance considering the attenuation effects (
Figure 2).
Therefore, this study focuses on an AE monitoring system for concrete structures and investigates the AE characteristics in actual-sized structures to evaluate the field applicability of this system. To achieve this objective, experiments estimating the AE parameters in a concrete structure are conducted with regard to the wave energy and its propagation distance. In addition, the maximum propagation distance of the AE wave is suggested for practical application of the AE monitoring system. The results of this study can serve as guidelines for suitable sensor arrays covering all areas of target structure monitoring and cost-effective AE sensor spacing. Therefore, these results can improve the applicability of AE monitoring systems, contributing to promote the practice of technology and engineering.
2. Experimental Program
2.1. Test Setup
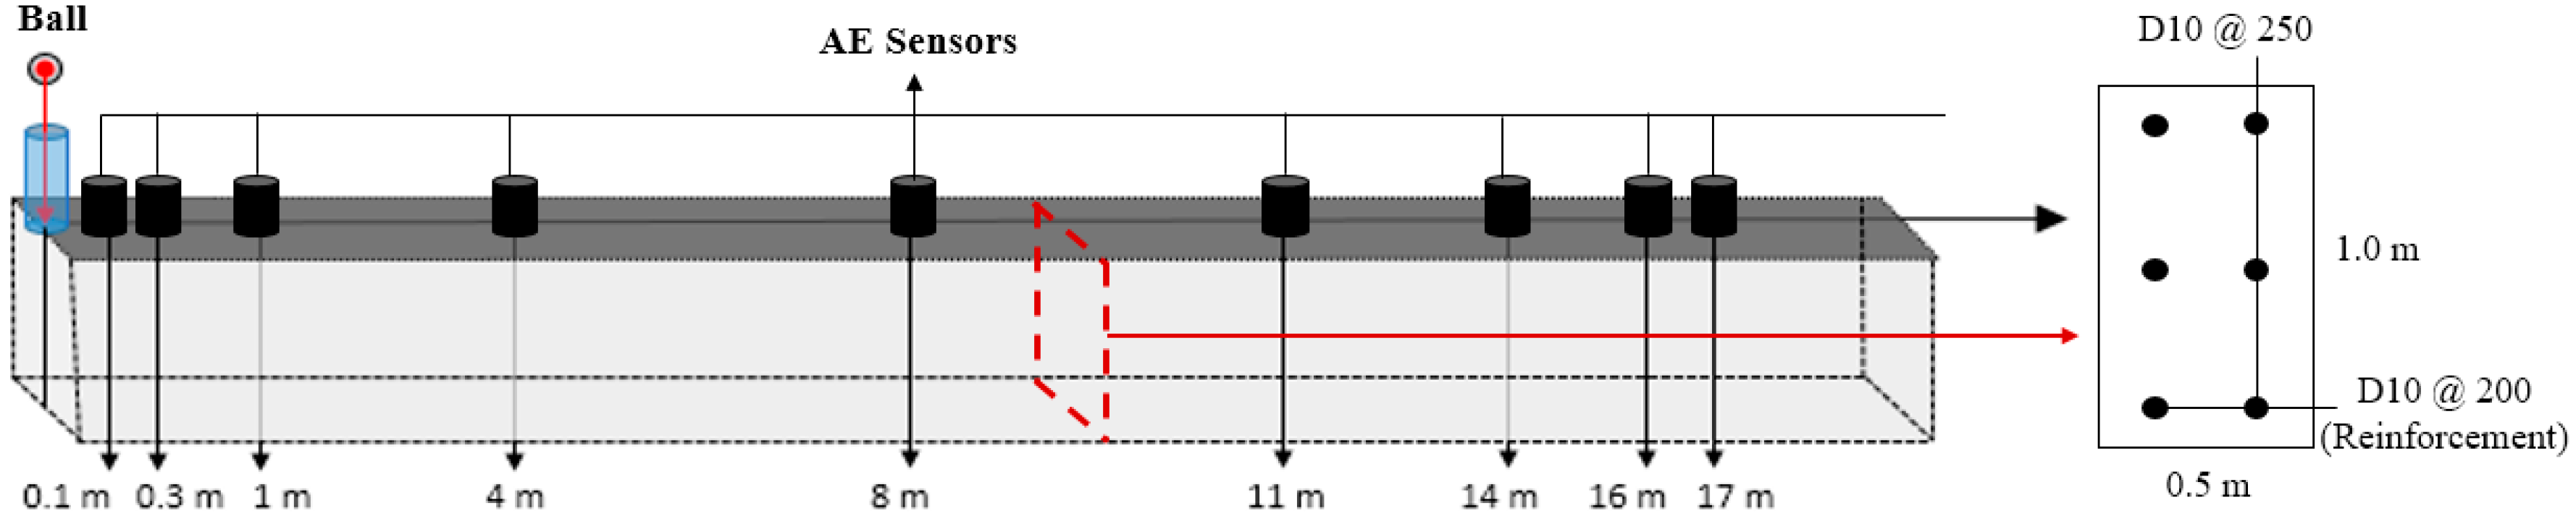
A drop experiment was conducted to investigate the propagation characteristics of AE according to the impact energy. In the experiment, reinforced concrete structures 20 m × 0.2 m × 1.2 m in length, width, and height, respectively, and AE sensors with data acquisition equipment were prepared. In each specimen, steel reinforcements 10 mm in diameter were placed with the direction shown in
Figure 3. The spacing of the steel reinforcement was 200 mm in the transverse direction and 250 mm in the vertical direction. The AE sensor used in the experiment is R.45I (R.45I sensor, MISTRAS Group Inc, Benicia, CA USA), which includes 40 dB preamp, and is internally amplified with a resonance frequency of 20 kHz and an operating frequency of 1–30 kHz with very high sensitivity [
26]. The sensor is equipped with a data transmission line and a standard Bayonet Neill–Concelman (BNC) connector on the side and is connected to the AE system (AEwin Software for Express-8 E5.91, MISTRAS Group Inc, Benicia, CA, USA, 2014.), which contains real-time data acquisition and replay software developed by MISTRAS [
27]. The sampling rate was set as 1 MHz, and the threshold for filtering noise was set to 40 dB in the data acquisition. In addition, even though the AE signal is amplified by the internal amplifier in the sensor, the AE parameters were calculated with the original signal magnitude in the data acquisition. It should be noted that because no filtering process was used (except for the threshold setting), the measured AE signals contained noise that might have occurred during the experiment. Thus, an analog filter was used in the system with settings of 1 kHz and 400 kHz for low- and high-pass filters, respectively. Furthermore, according to the recommendation of AEwin for Express-8, the pre-trigger was 256
, the peak definition time (PDT) was 200
, the hit definition time (HDT) was 800
, and hit lockout time (HLT) was 1000
.
In the experiment, elastic waves were generated by dropping a steel ball vertically from a specific height. The generated waves were recorded by AE sensors installed on the surface of the structure and were transformed into electric waveforms [
28,
29].
Figure 3 shows a schematic diagram of the experiment parameters. The measurement points were 0.1 m, 0.3 m, 1.0 m, 4.0 m, 8.0 m, 11.0 m, 14.0 m, 16.0 m, and 17.0 m from the impact point.
2.2. Test Parameters
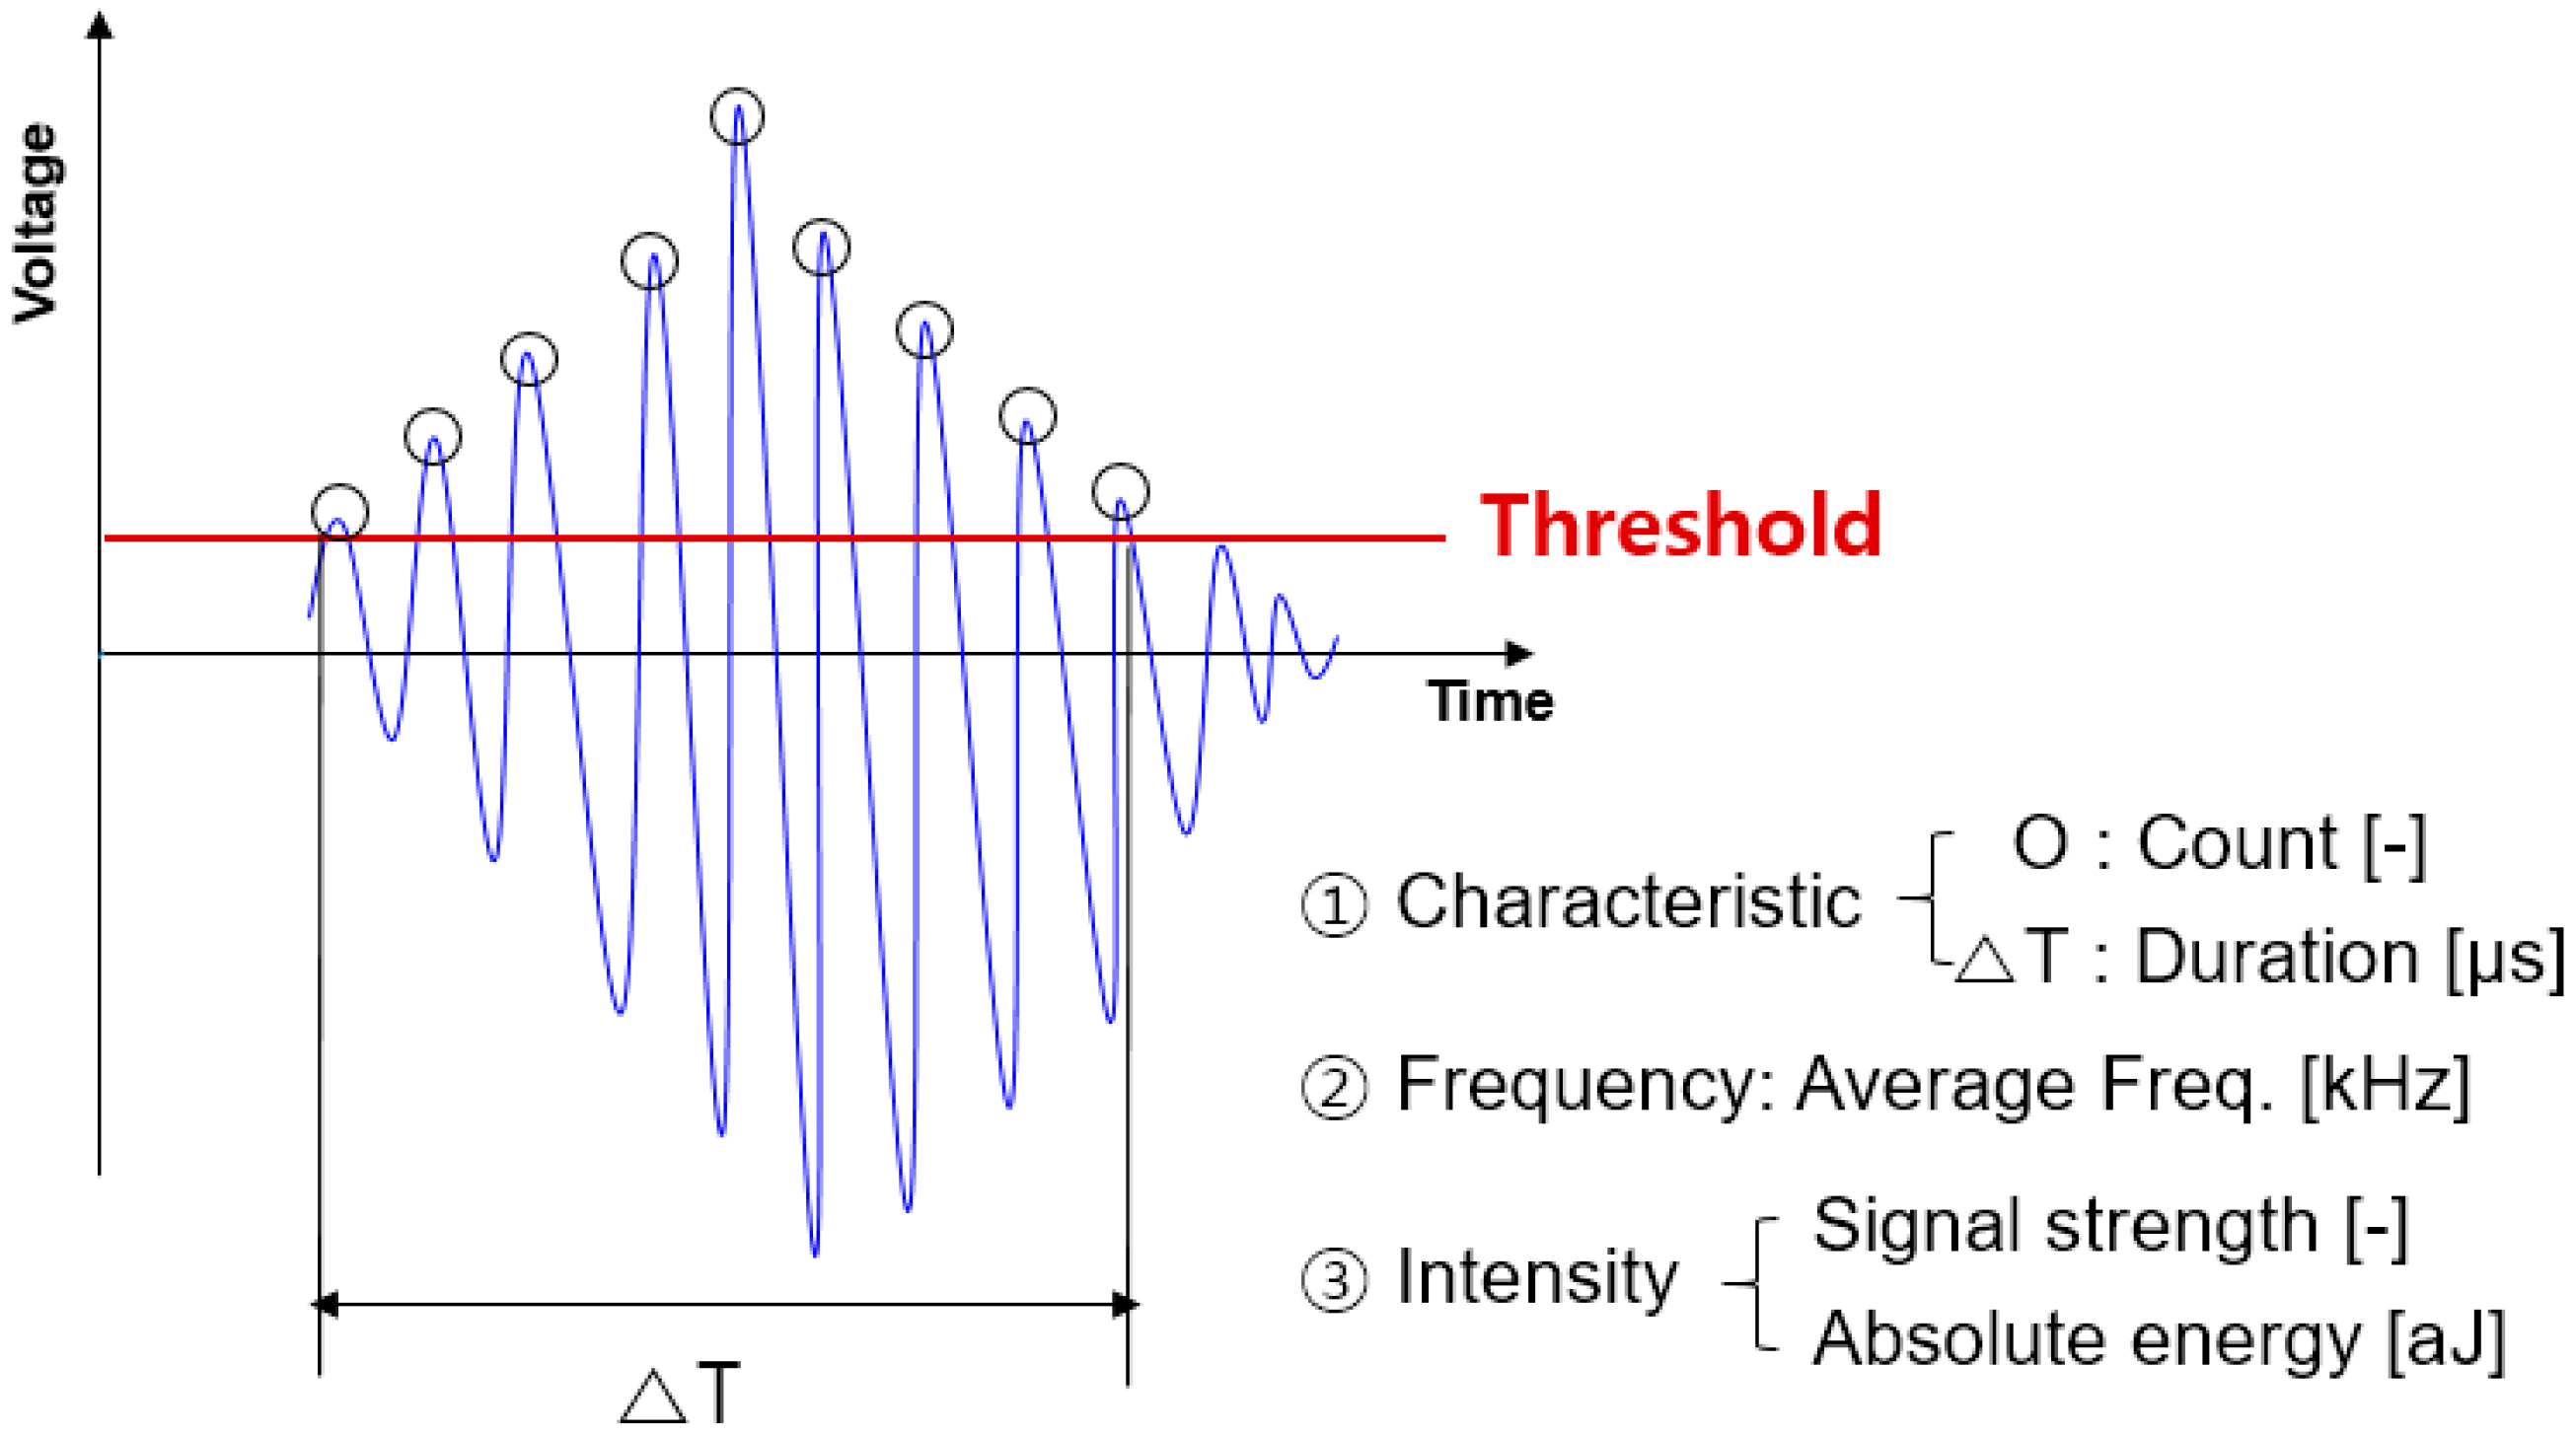
Several parameters indicate the characteristics of AE waves; those considered in this study are count, duration, amplitude, average frequency, signal strength, and absolute energy. Duration is the time interval between the triggering time of one AE signal and the time of its disappearance. Count is the number of times one signal exceeds the threshold within the duration. Amplitude is the peak voltage of the signal waveform, which is closely related to the magnitude of the source event [
30]. These parameters identify the waveform characteristics of the AE signal. In addition, average frequency was calculated from the count divided by the duration obtained over each AE signal; the signal strength was calculated by integrating the absolute value of the voltage signal with respect to time; and the absolute energy is the square of the wave signal with respect to time. These parameters were elected as indicators of the AE signal intensity. All test parameters were determined using AEwin for Express-8 software in data acquisition equipment [
27]. This means that the parameter-based AE evaluation was employed, and not the streaming mode in this study.
Figure 4 illustrates the AE parameters considered in this study.
2.3. Test Procedure
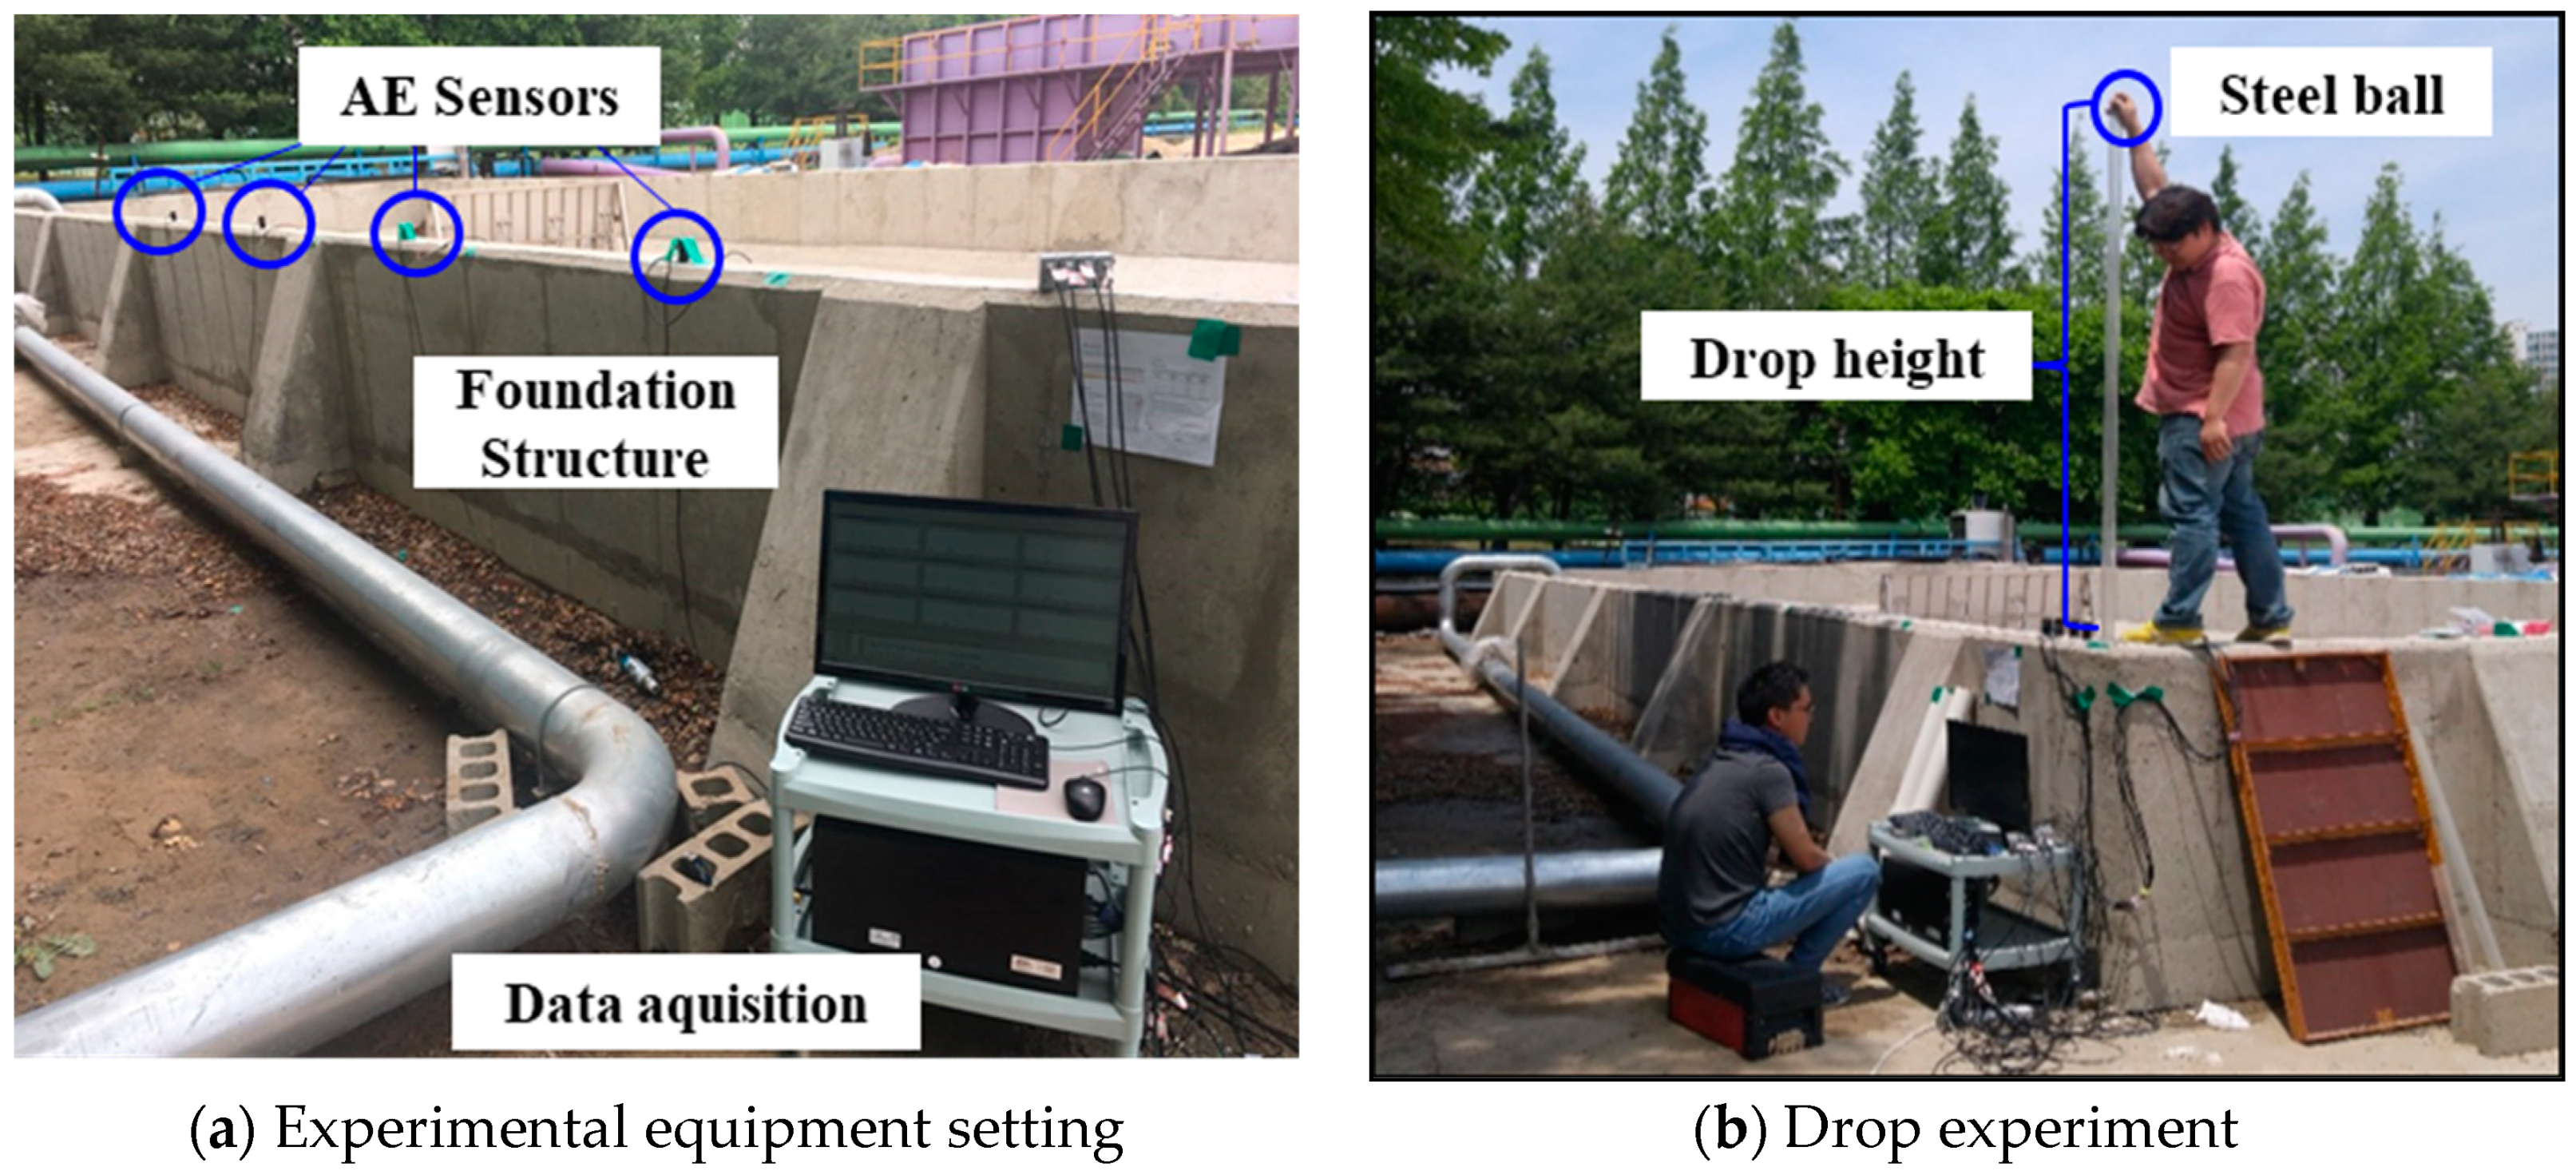
The experimental procedure is shown in
Figure 5. The AE sensors were installed at the points shown in
Figure 5a using high-vacuum grease with adhesive tape to enhance the coupling performance at the interface between the concrete and the sensor. The sensors were connected to the data acquisition equipment and a computer with the AE software installed. The balls were dropped through a hollow cylinder in a direction vertical to the surface (
Figure 5b).
Table 2 shows the experimental cases. To investigate the effect of impact energy on the propagation characteristics, the experimental cases were established according to the four different weights of the ball and drop heights, respectively. Thus, a total of 16 cases were set, and 9 experiments were performed for all measurement points in each experimental case. The impact energy for generating the elastic waves in
Table 2 was calculated as shown in Equation (1).
When the ball hits the structure surface, not all the impact energy is transmitted to the acoustic energy because some energy is lost, such as heat and vibration generated by friction between the surface and the ball. However, the intensity of the elastic wave is proportional to the impact energy of the steel ball. Thus, the impact energy indicated the energy of the elastic wave in the experiment. Moreover, the rebound effect of the ball on the recorded signal was filtered in the experimental results.
3. Experimental Results
3.1. Effect of Impact Energy
Energy from the external impact affects the induced elastic wave characteristics, including energy and propagation distance. That is, damage that occurs in the structure can be reversely estimated based on the recorded AE parameters. Thus, the AE parameters that varied with the impact energy of the steel ball were evaluated. The AE signals representing the voltage time were collected from the AE sensors, and each AE parameter was measured by the data acquisition equipment.
Figure 6,
Figure 7,
Figure 8,
Figure 9,
Figure 10 and
Figure 11 show the variations in the AE parameters with the impact energy for the representative cases of close (D = 0.1 m), medium (D = 4.0 m, 8.0 m), and far (D = 17.0 m) distances from the impact point.
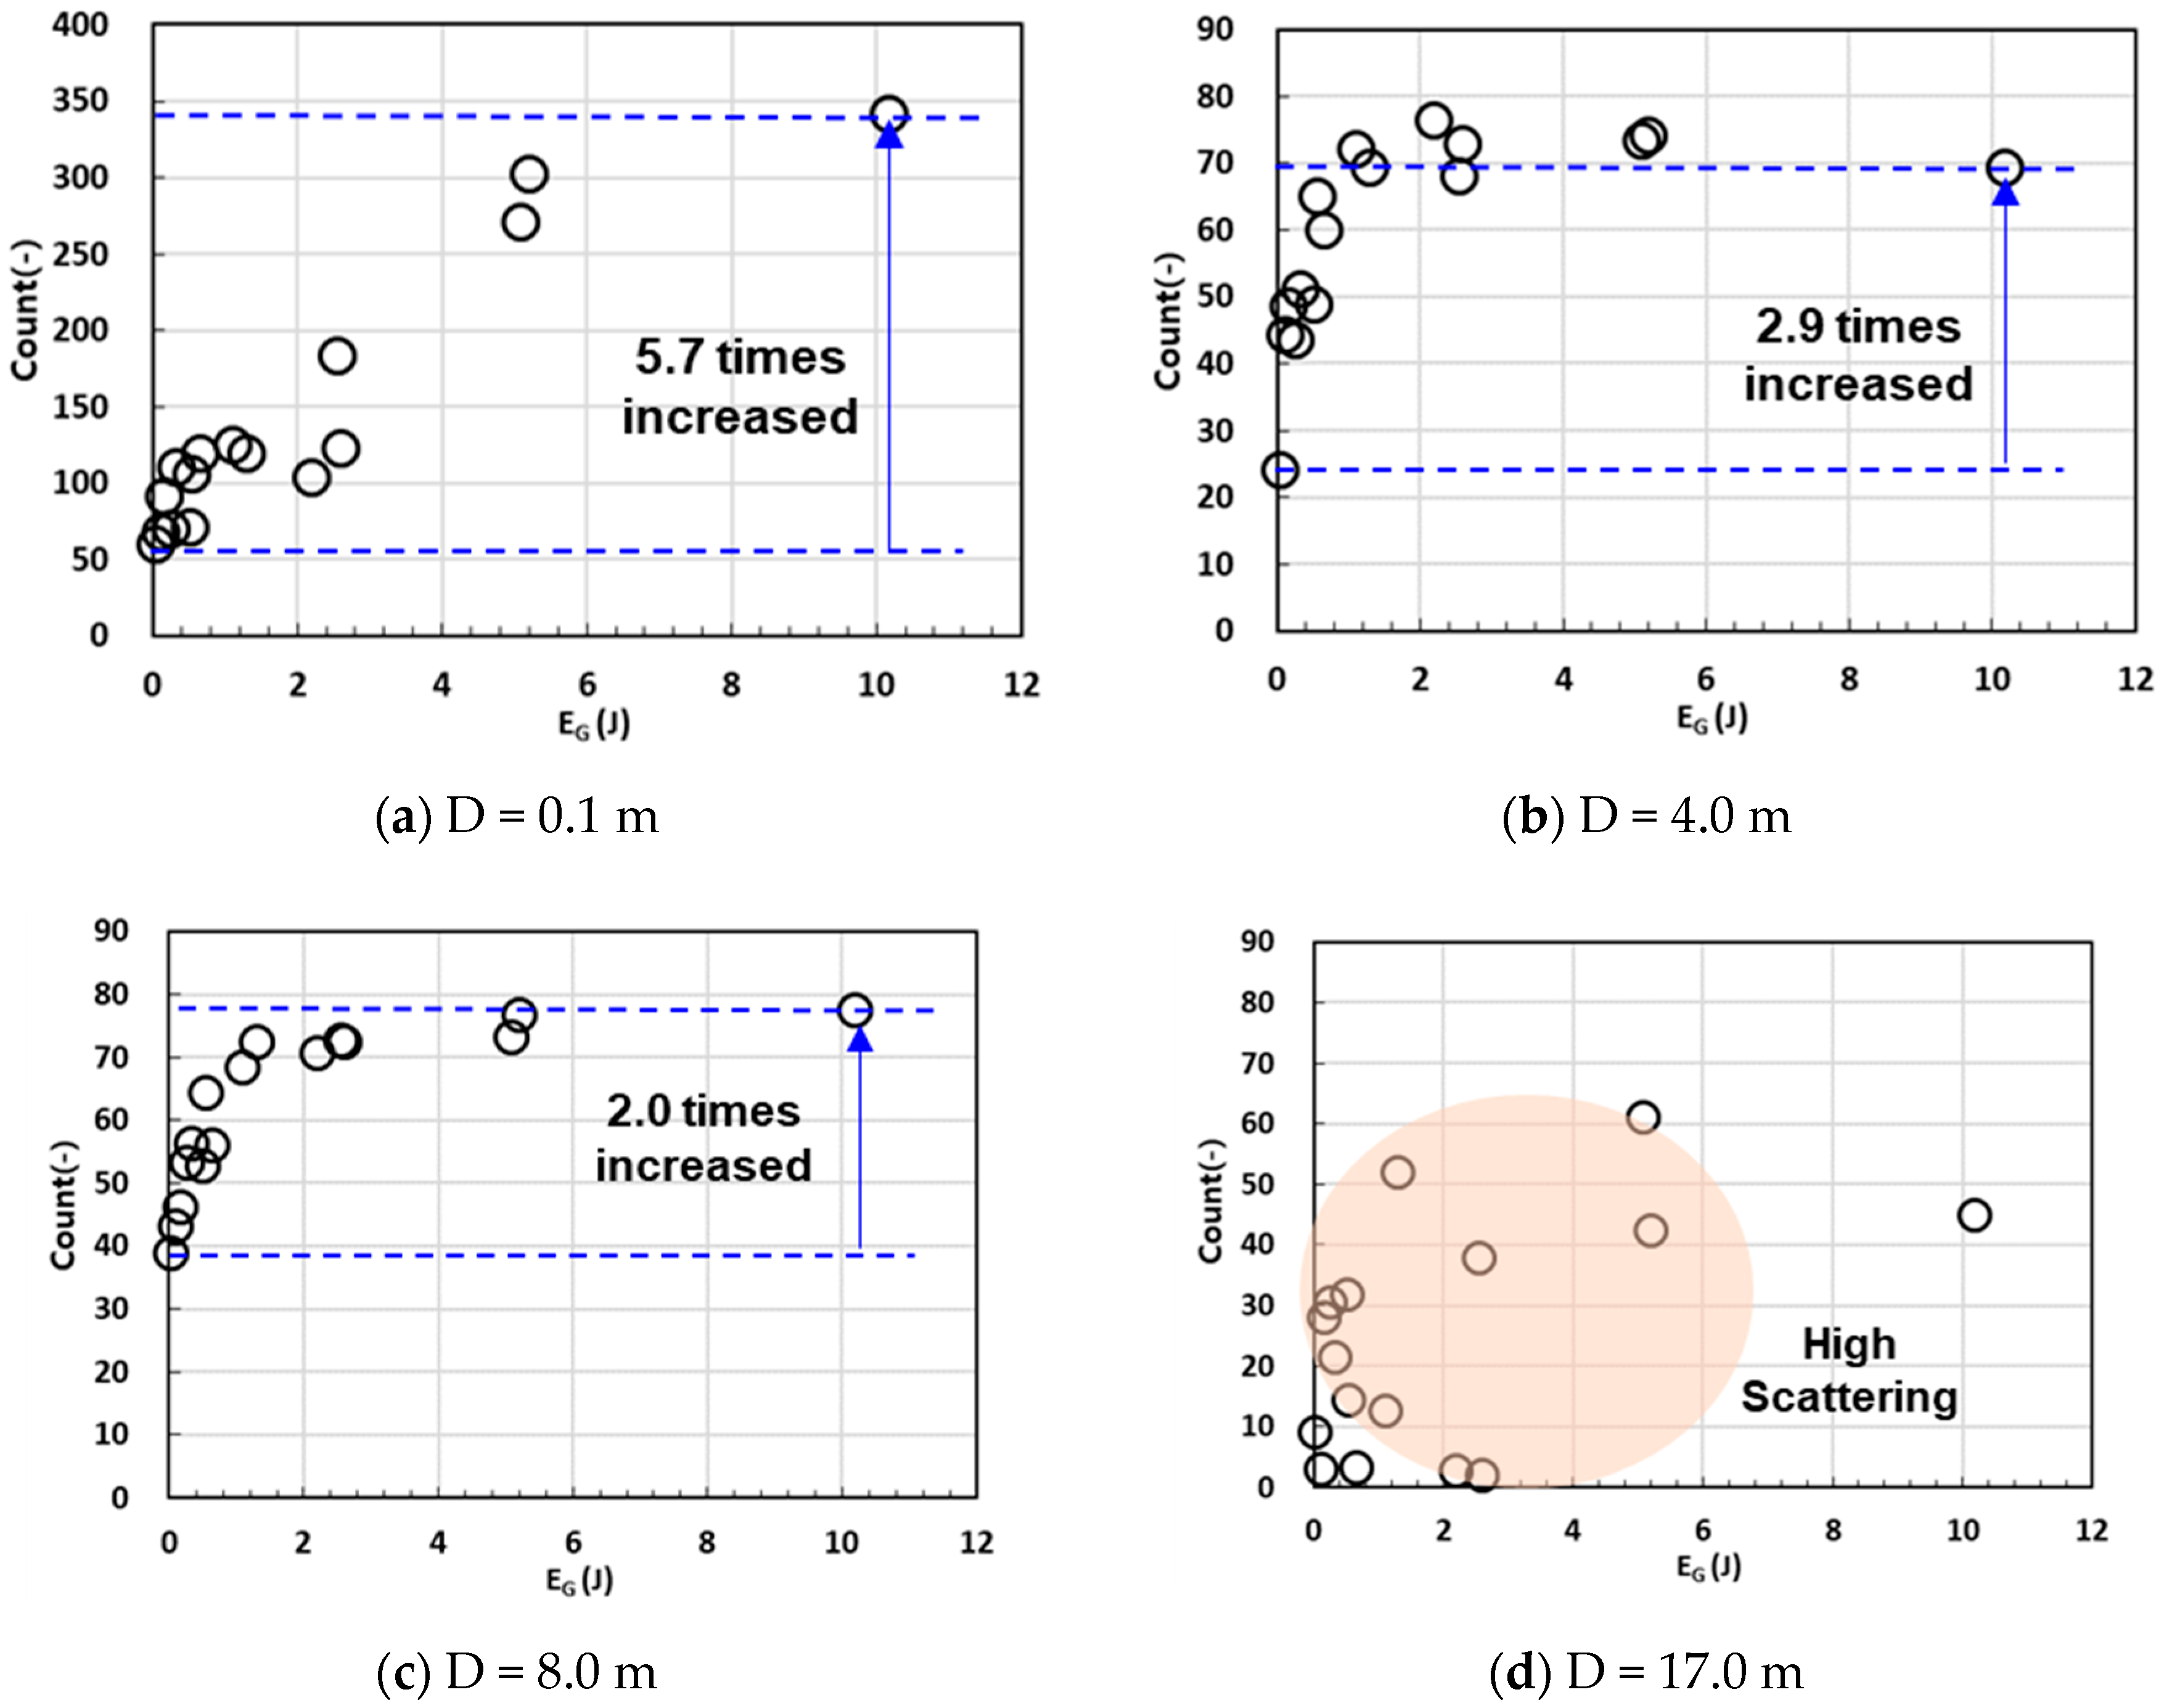
As shown in
Figure 6, the count increased as the impact energy increased. When the distance was closer, as the impact energy increased from 0.03 J to 10.2 J, the count increased 5.7 times. It also increased 2.9 times and 2.0 times at propagation distances of 4.0 m and 8.0 m, respectively. This phenomenon indicates that the strong intensity of the wave increases the number of times the wave exceeds the threshold. However, the increasing tendency of the count according to the impact energy decreased with distance. This indicates that the count at far distances is less sensitive to the impact energy.
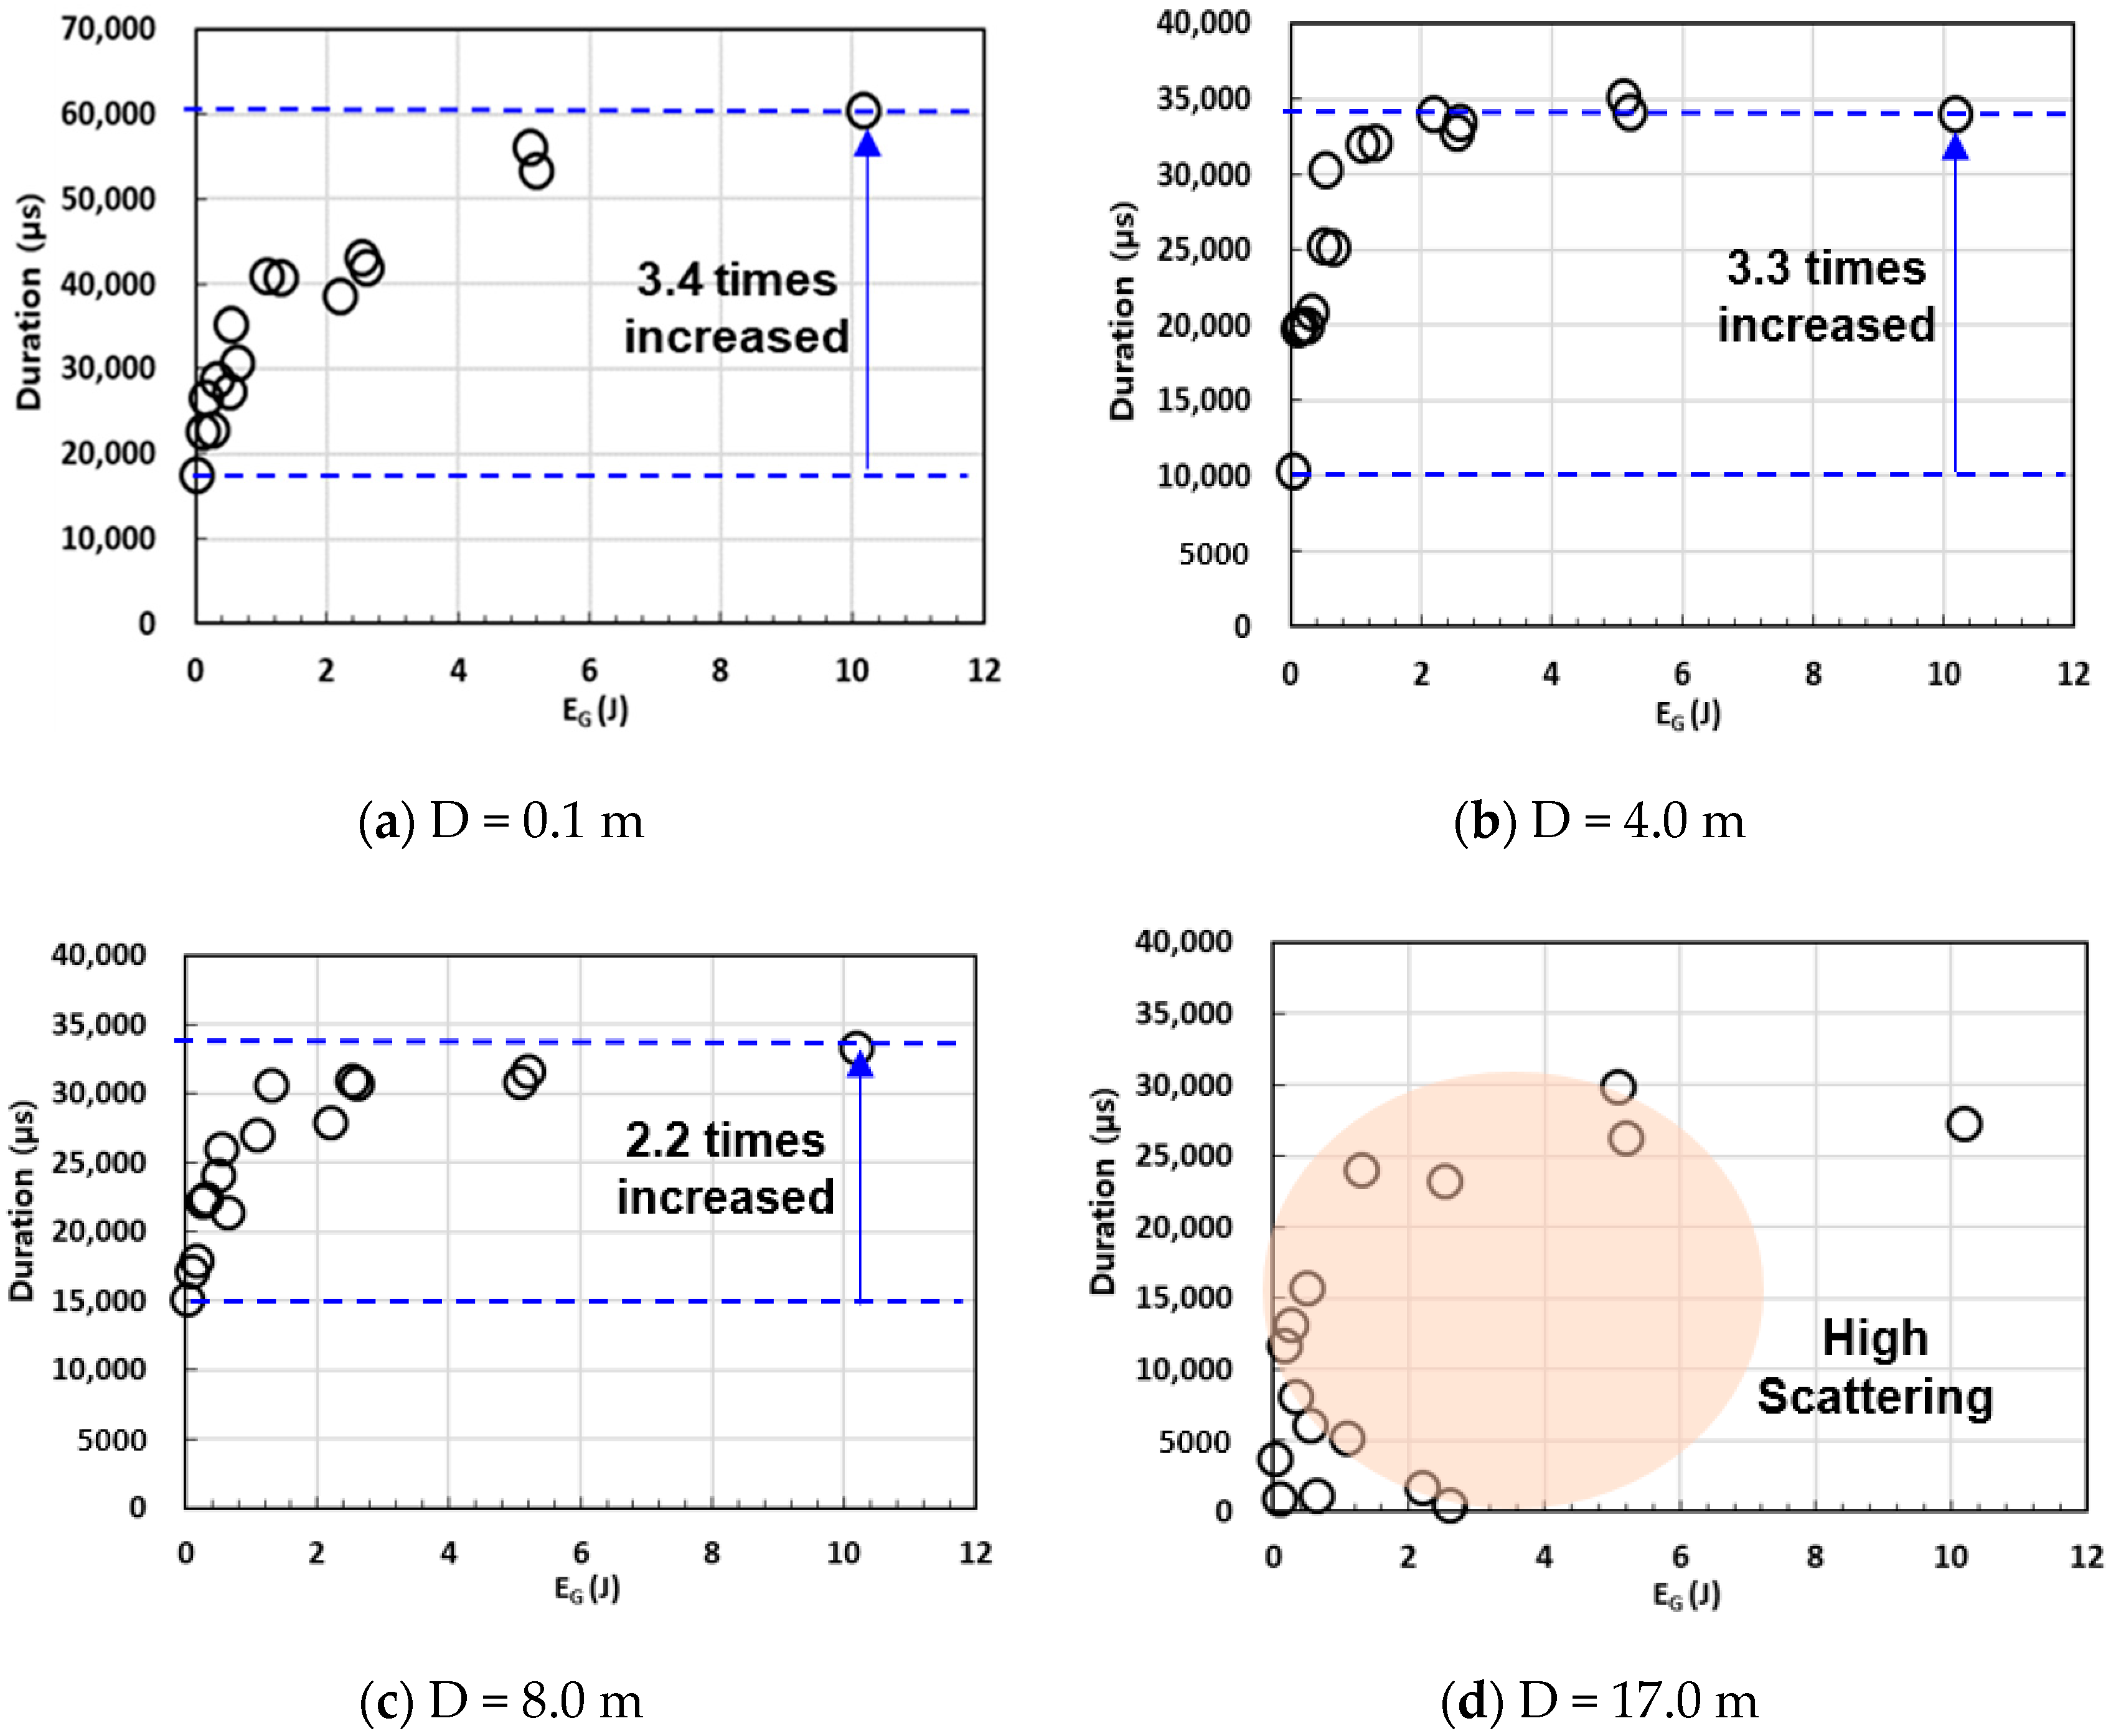
Figure 7 shows that the duration increased according to the impact energy. As the impact energy increased from 0.03 J to 10.2 J, the duration increased 3.4 times when the distance was close. However, it increased 3.3 times and 2.2 times at propagation distances of 4.0 m and 8.0 m, respectively.
Both the count and duration tended to increase sharply at a small impact energy value when the propagation distance was medium. In addition, an increase in the tendency of both parameters with the impact energy was clear when the distance was close. However, this tendency became ambiguous with increasing distance from the source, resulting in highly scattered data (
Figure 6d and
Figure 7d). This is because the wave intensity weakens according to the propagation of the wave. In this case, although the AE signal was detected, it likely provided unreliable information owing to weak intensity of the acoustic wave. This fact implies that AE sensors can reliably measure AE signals only at a particular distance. That is, the proper spacing of AE sensors is needed for application of the AE monitoring system to a field site.
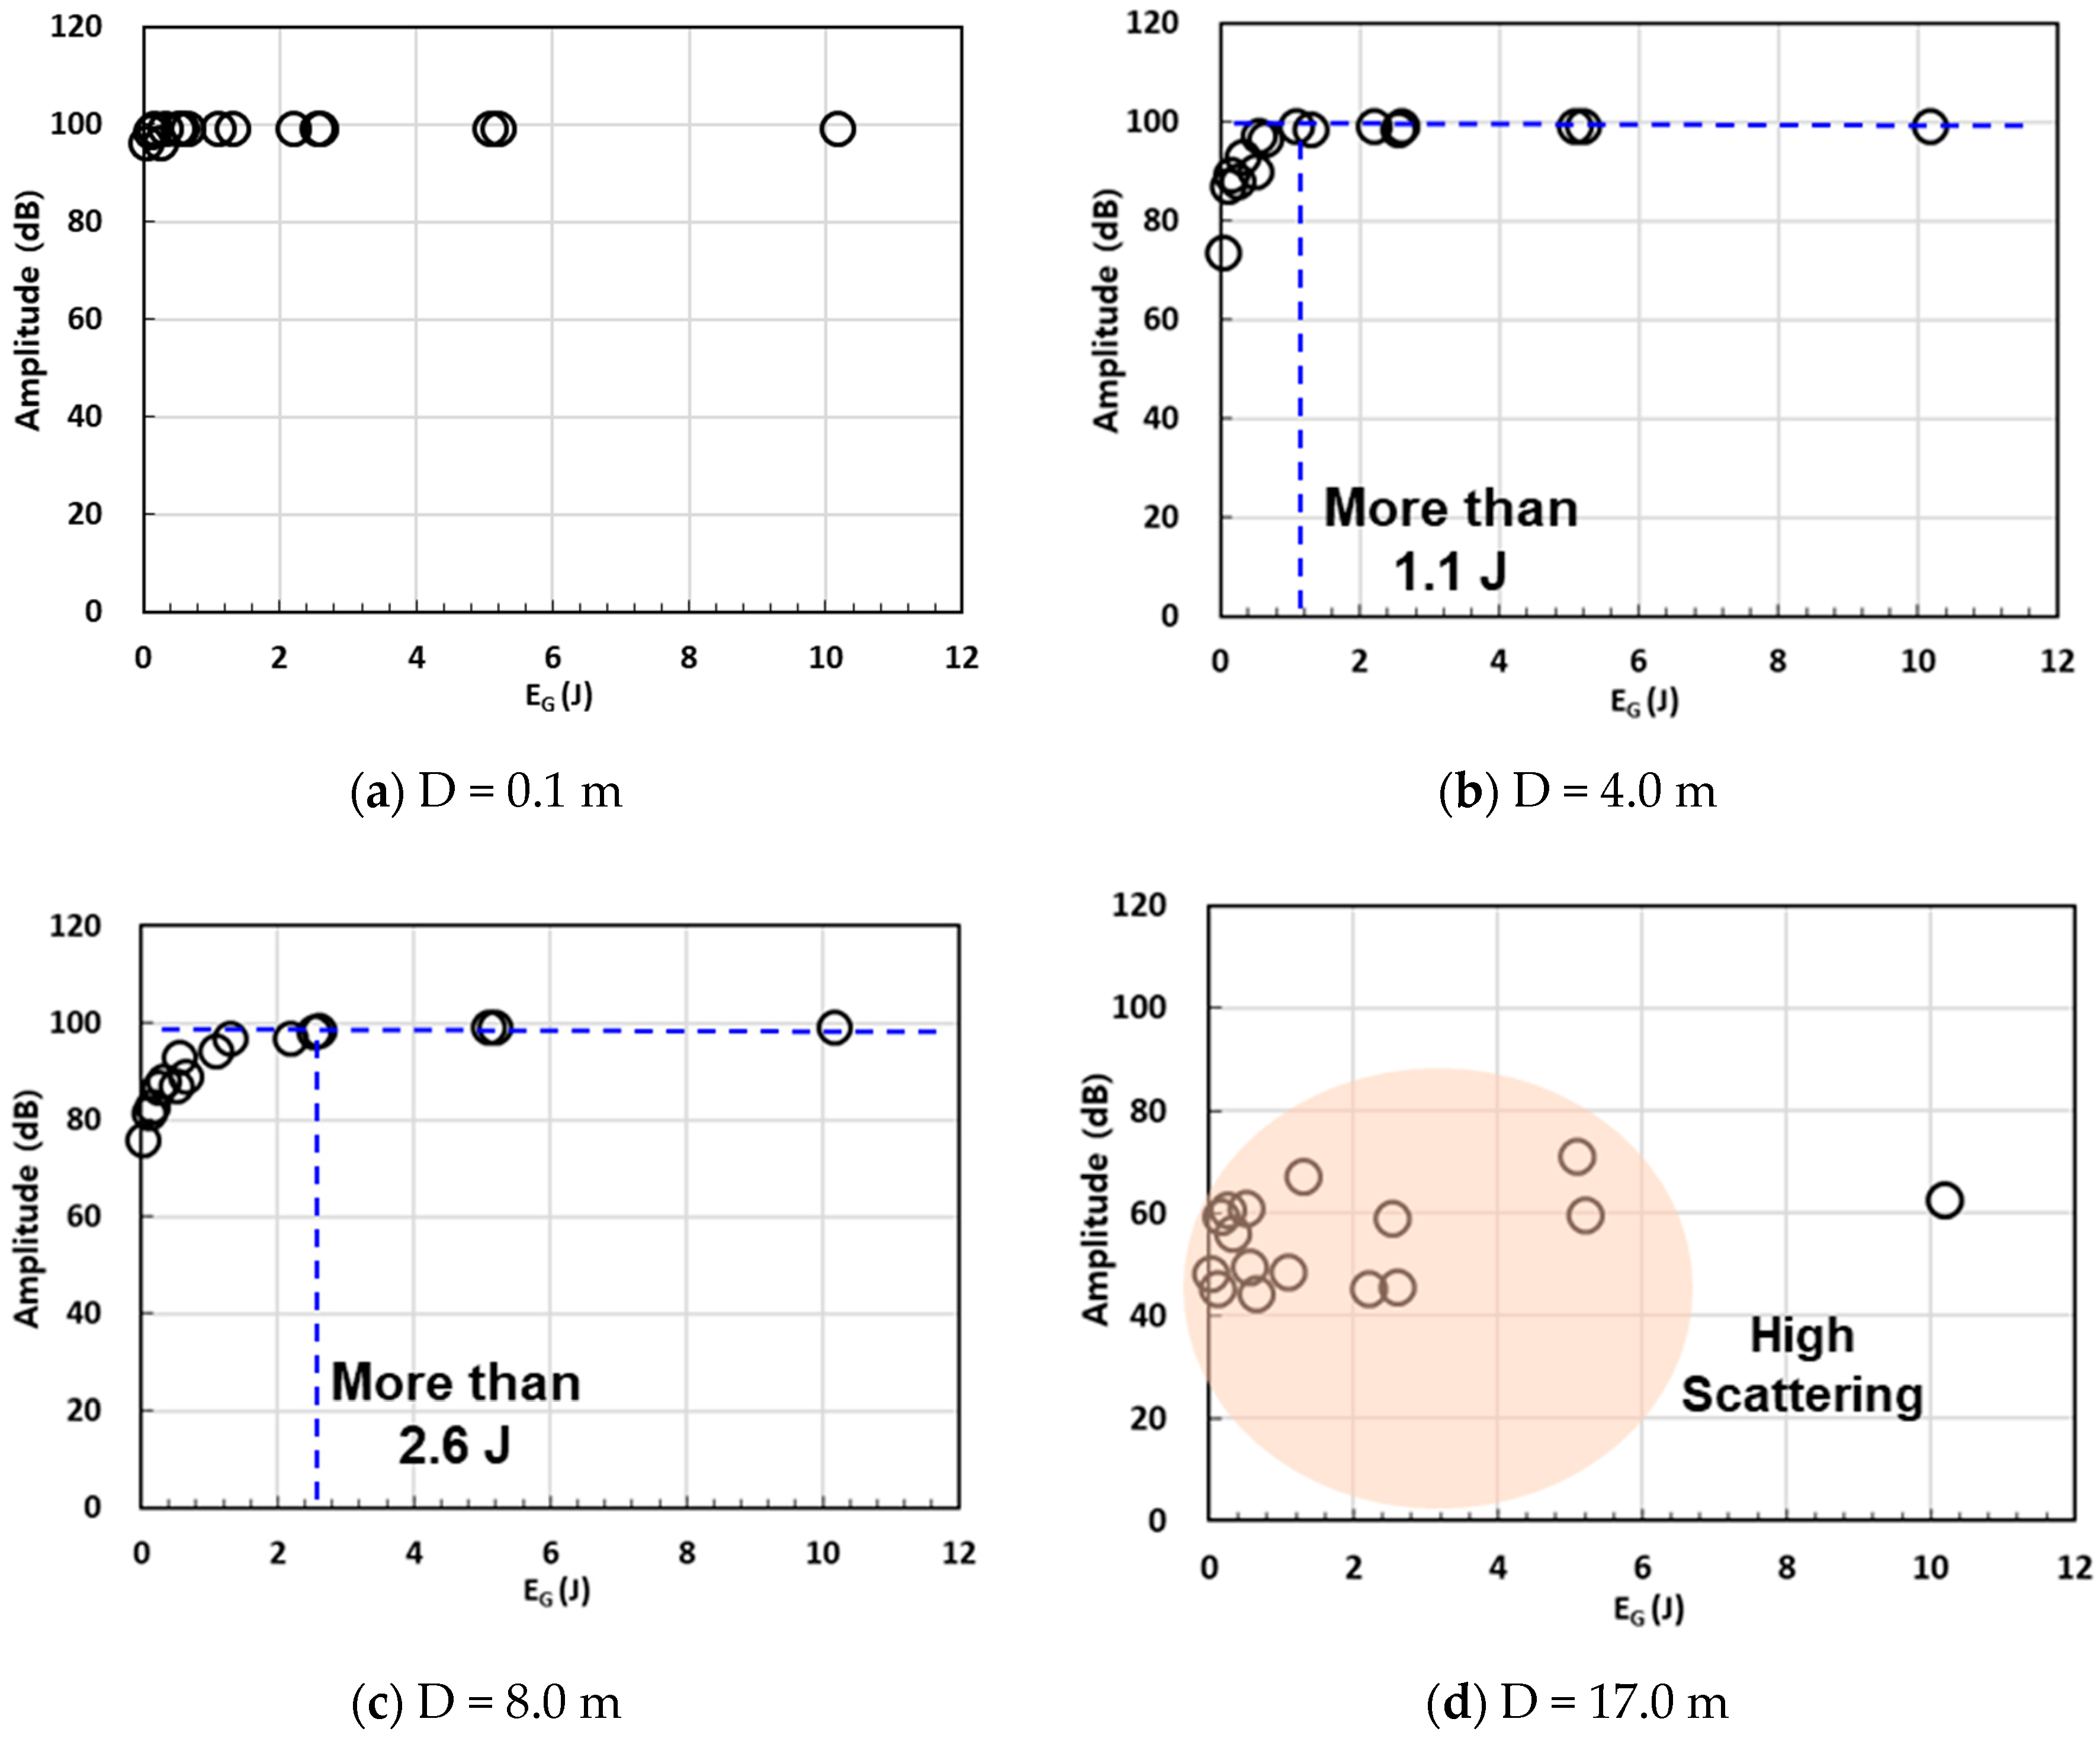
As shown in
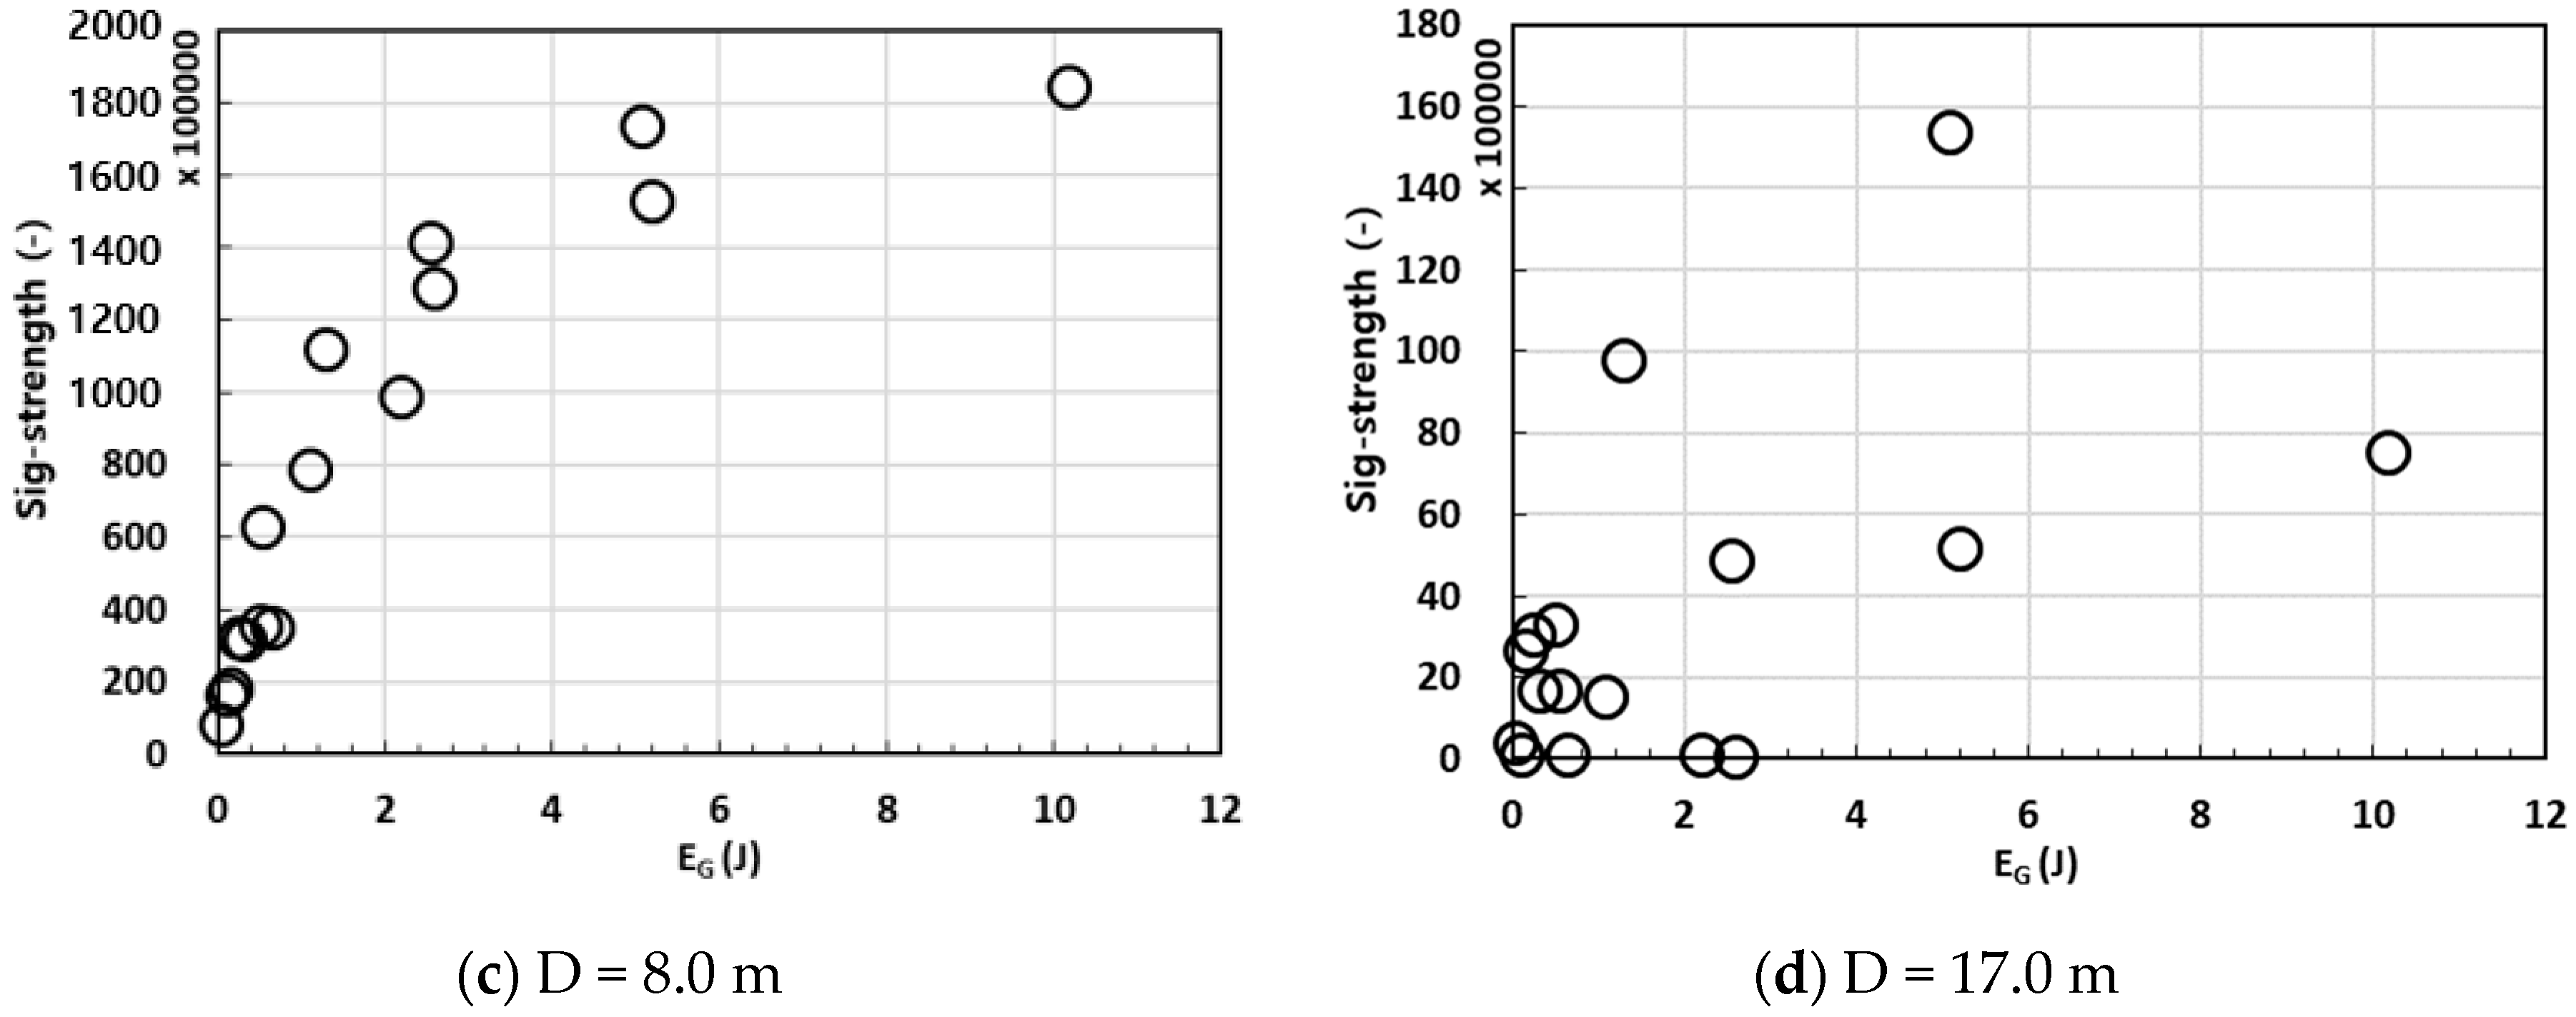
Figure 8, the amplitude was mostly 100 dB at the close distance. The maximum amplitude value was 100 dB even though the intensity of the impact increased, because the maximum measurement limit of the experimental set-up was 100 dB. In addition, in the case of the medium propagation distance (D = 4.0 m), the amplitude gradually increased according to the impact energy, and the amplitude showed a constant value of 100 dB when the impact energy was greater than 1.1 J. When the distance was 8.0 m, the amplitude converged to 100 dB from impact energy greater than 2.6 J. However, the amplitude did not reach 100 dB at the far distance owing to attenuation of the signal. These results support the fact that the amplitude is closely related to the intensity of the AE signal. In addition, the increasing tendency of the amplitude according to the impact energy was unclear at a propagation distance of 17.0 m, at which point the signal intensity was already weak. In this case, the collected AE signal could not provide reliable information because it contained abundant scattering noise according to the wave propagation. This result also indicates that the proper spacing for AE sensors in the monitoring system is essential for avoiding data uncertainty.
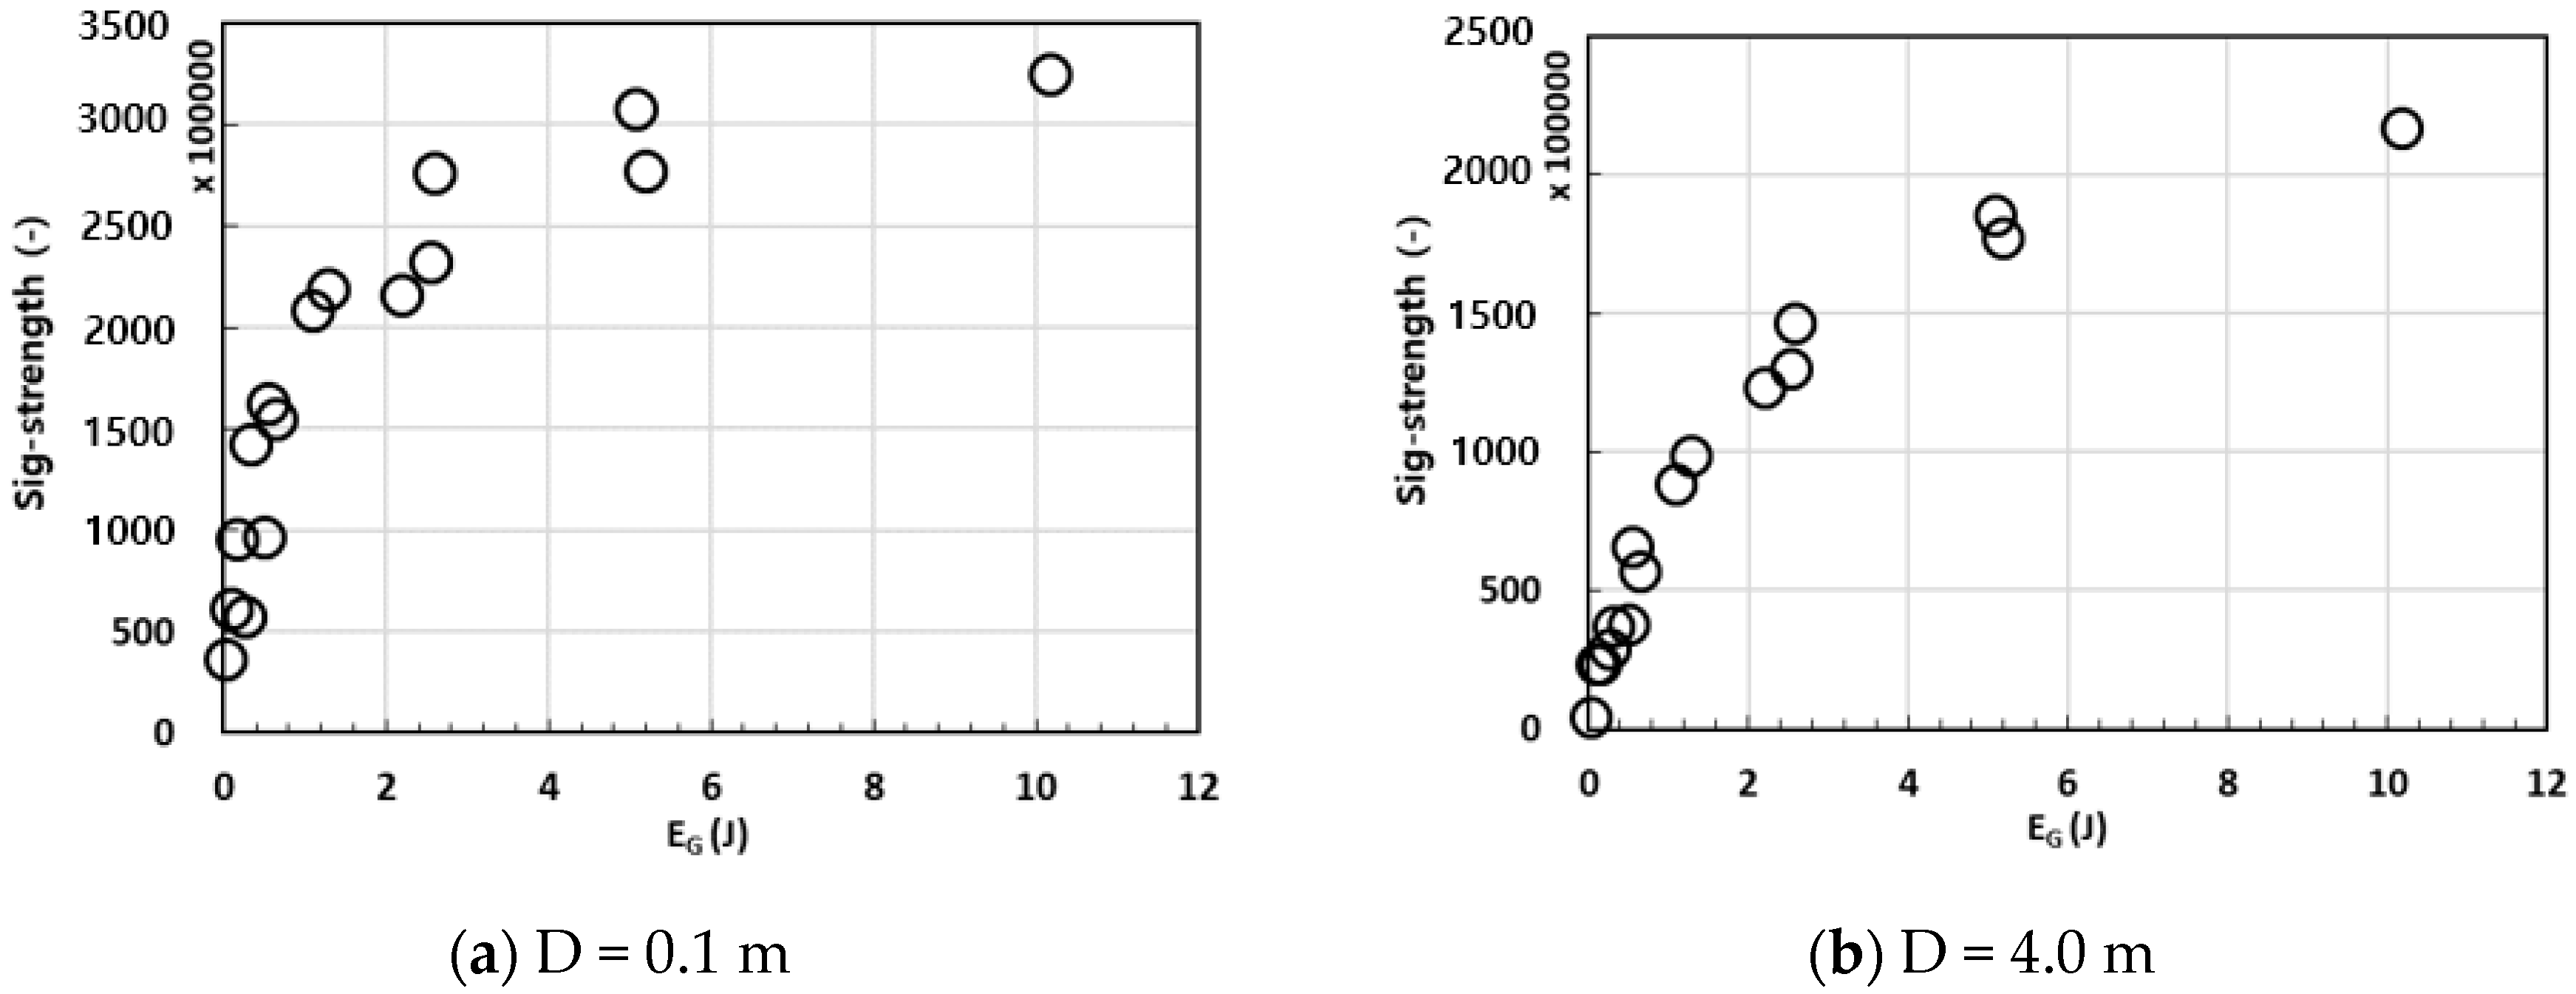
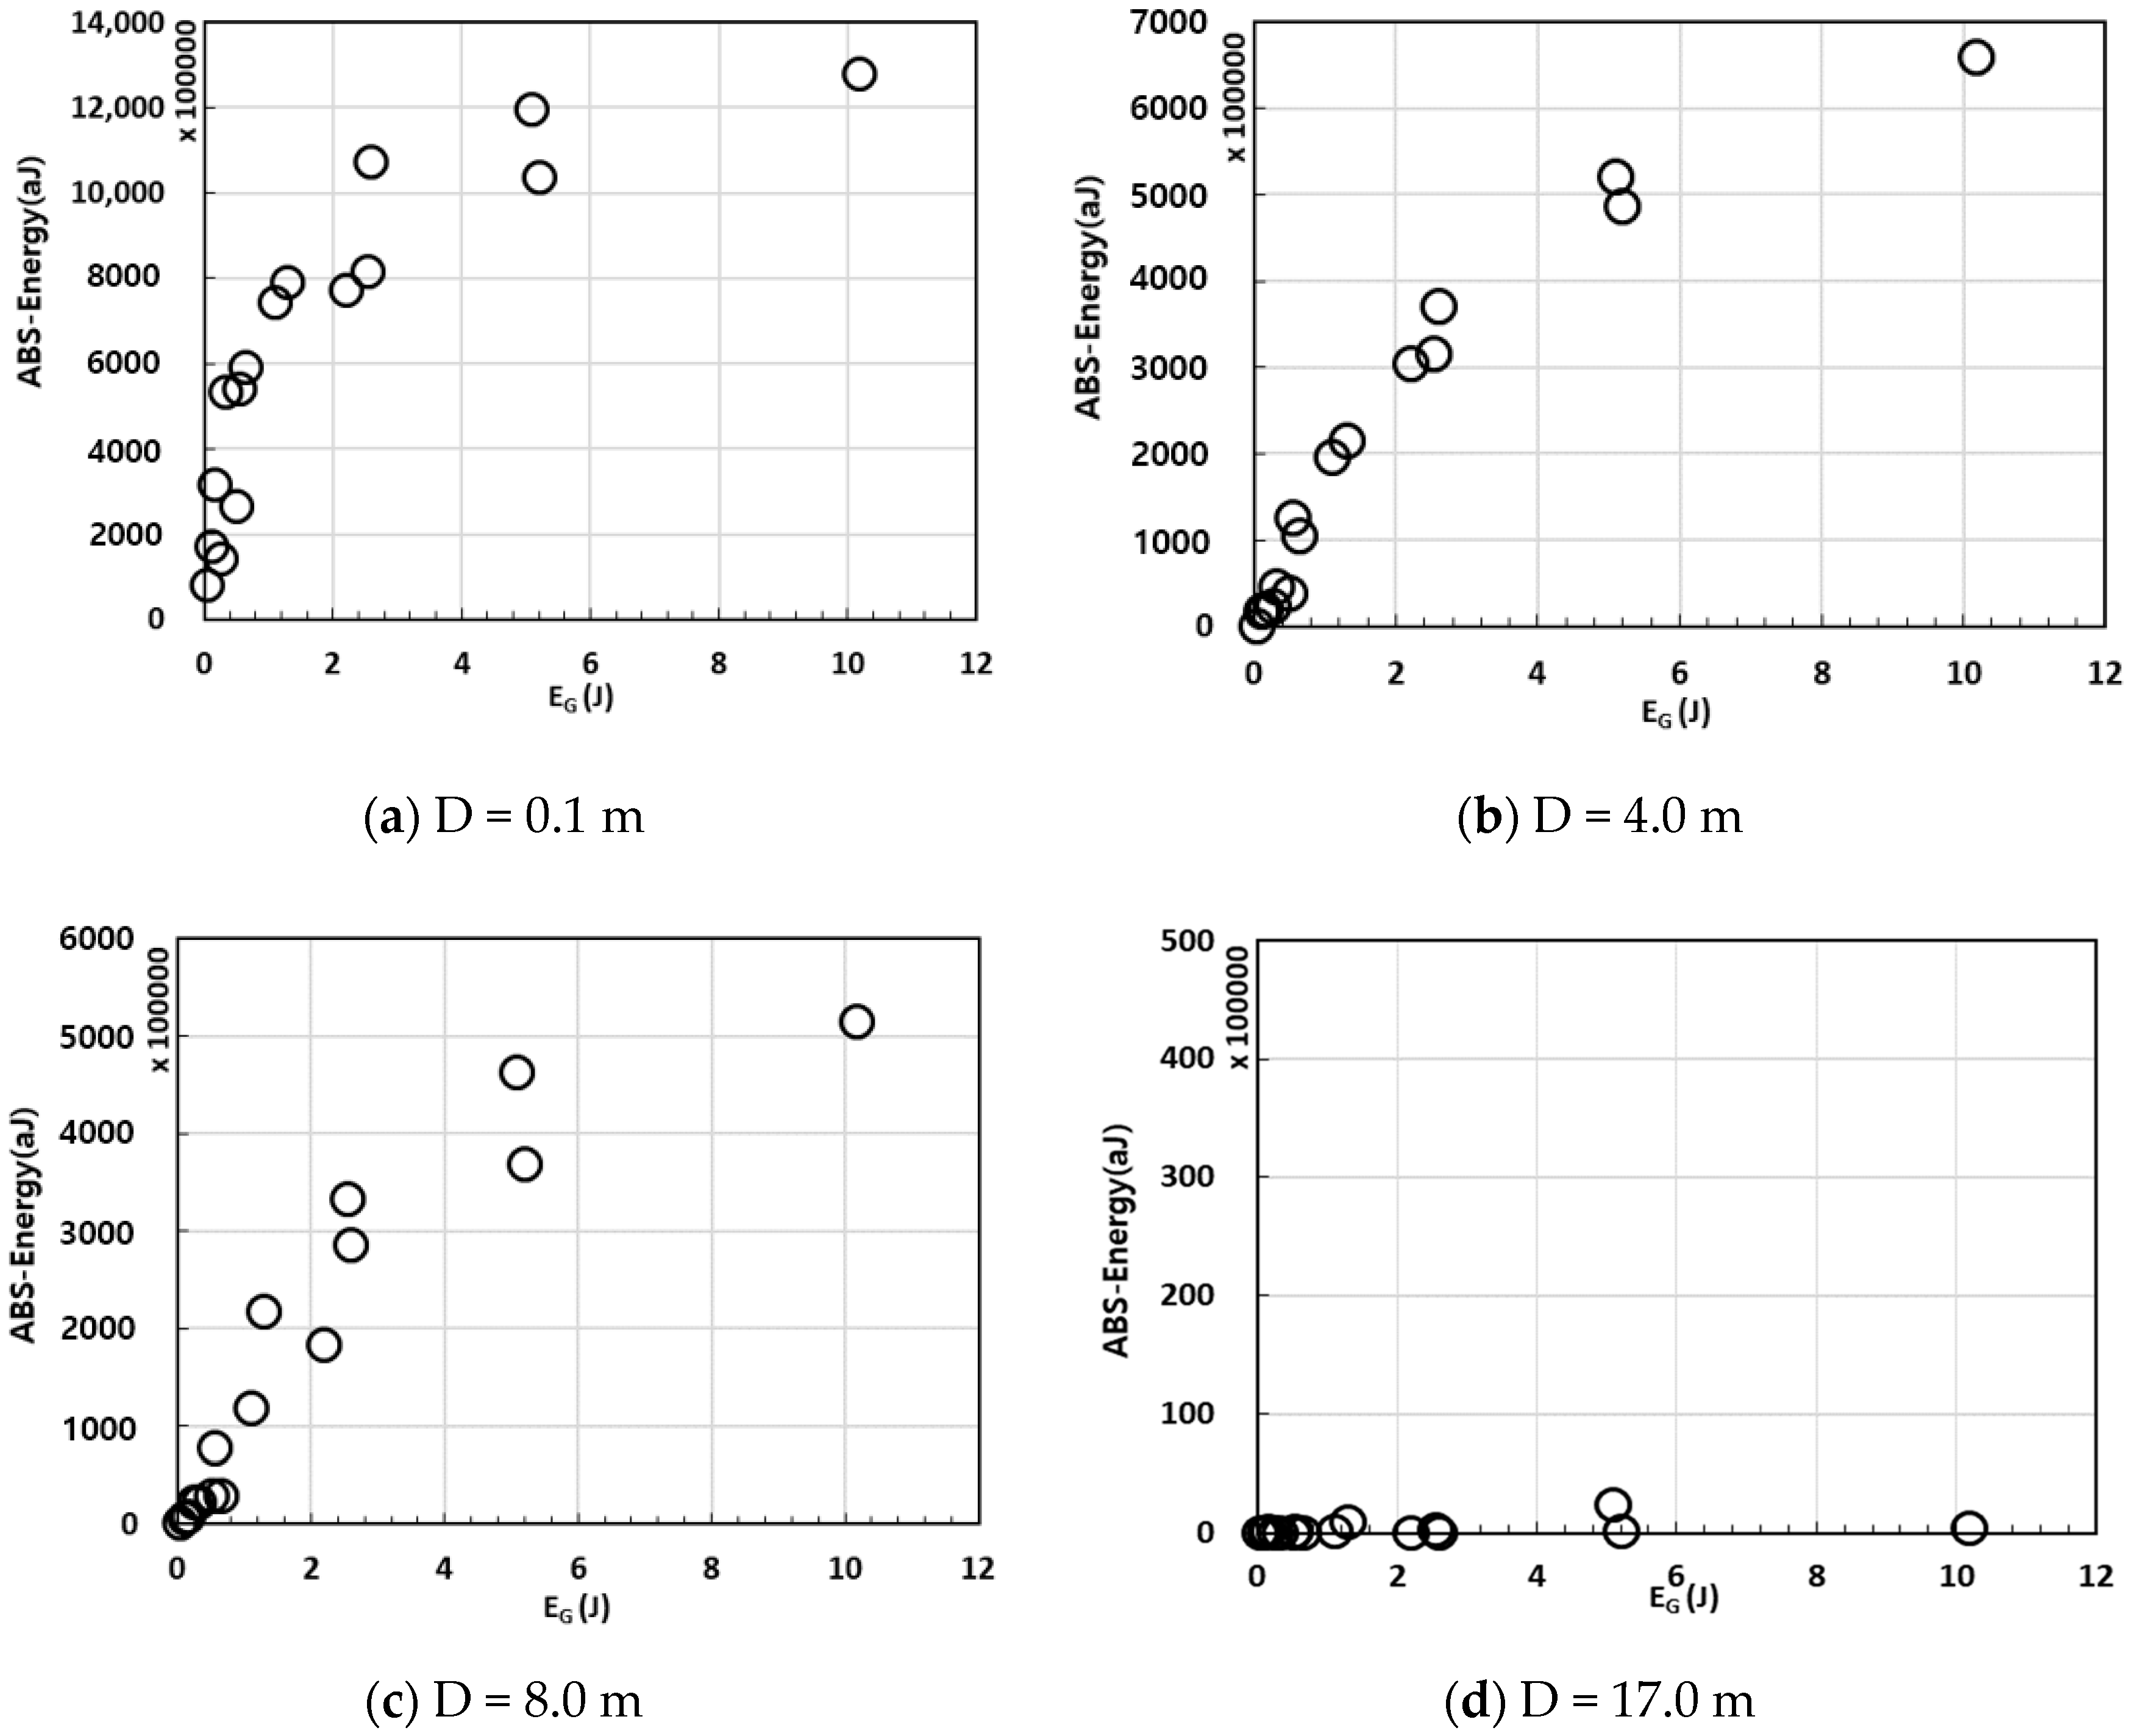
Both the signal strength and absolute energy showed a similar tendency, which is proportional to the impact energy. Considering the fact that both parameters were calculated by integrating the AE signal strength with respect to the duration of the waveform, this tendency can be predicted from variations in the AE count, duration, and amplitude. This increasing tendency with the impact energy was found to be more prominent when the impact point was close to the sensor.
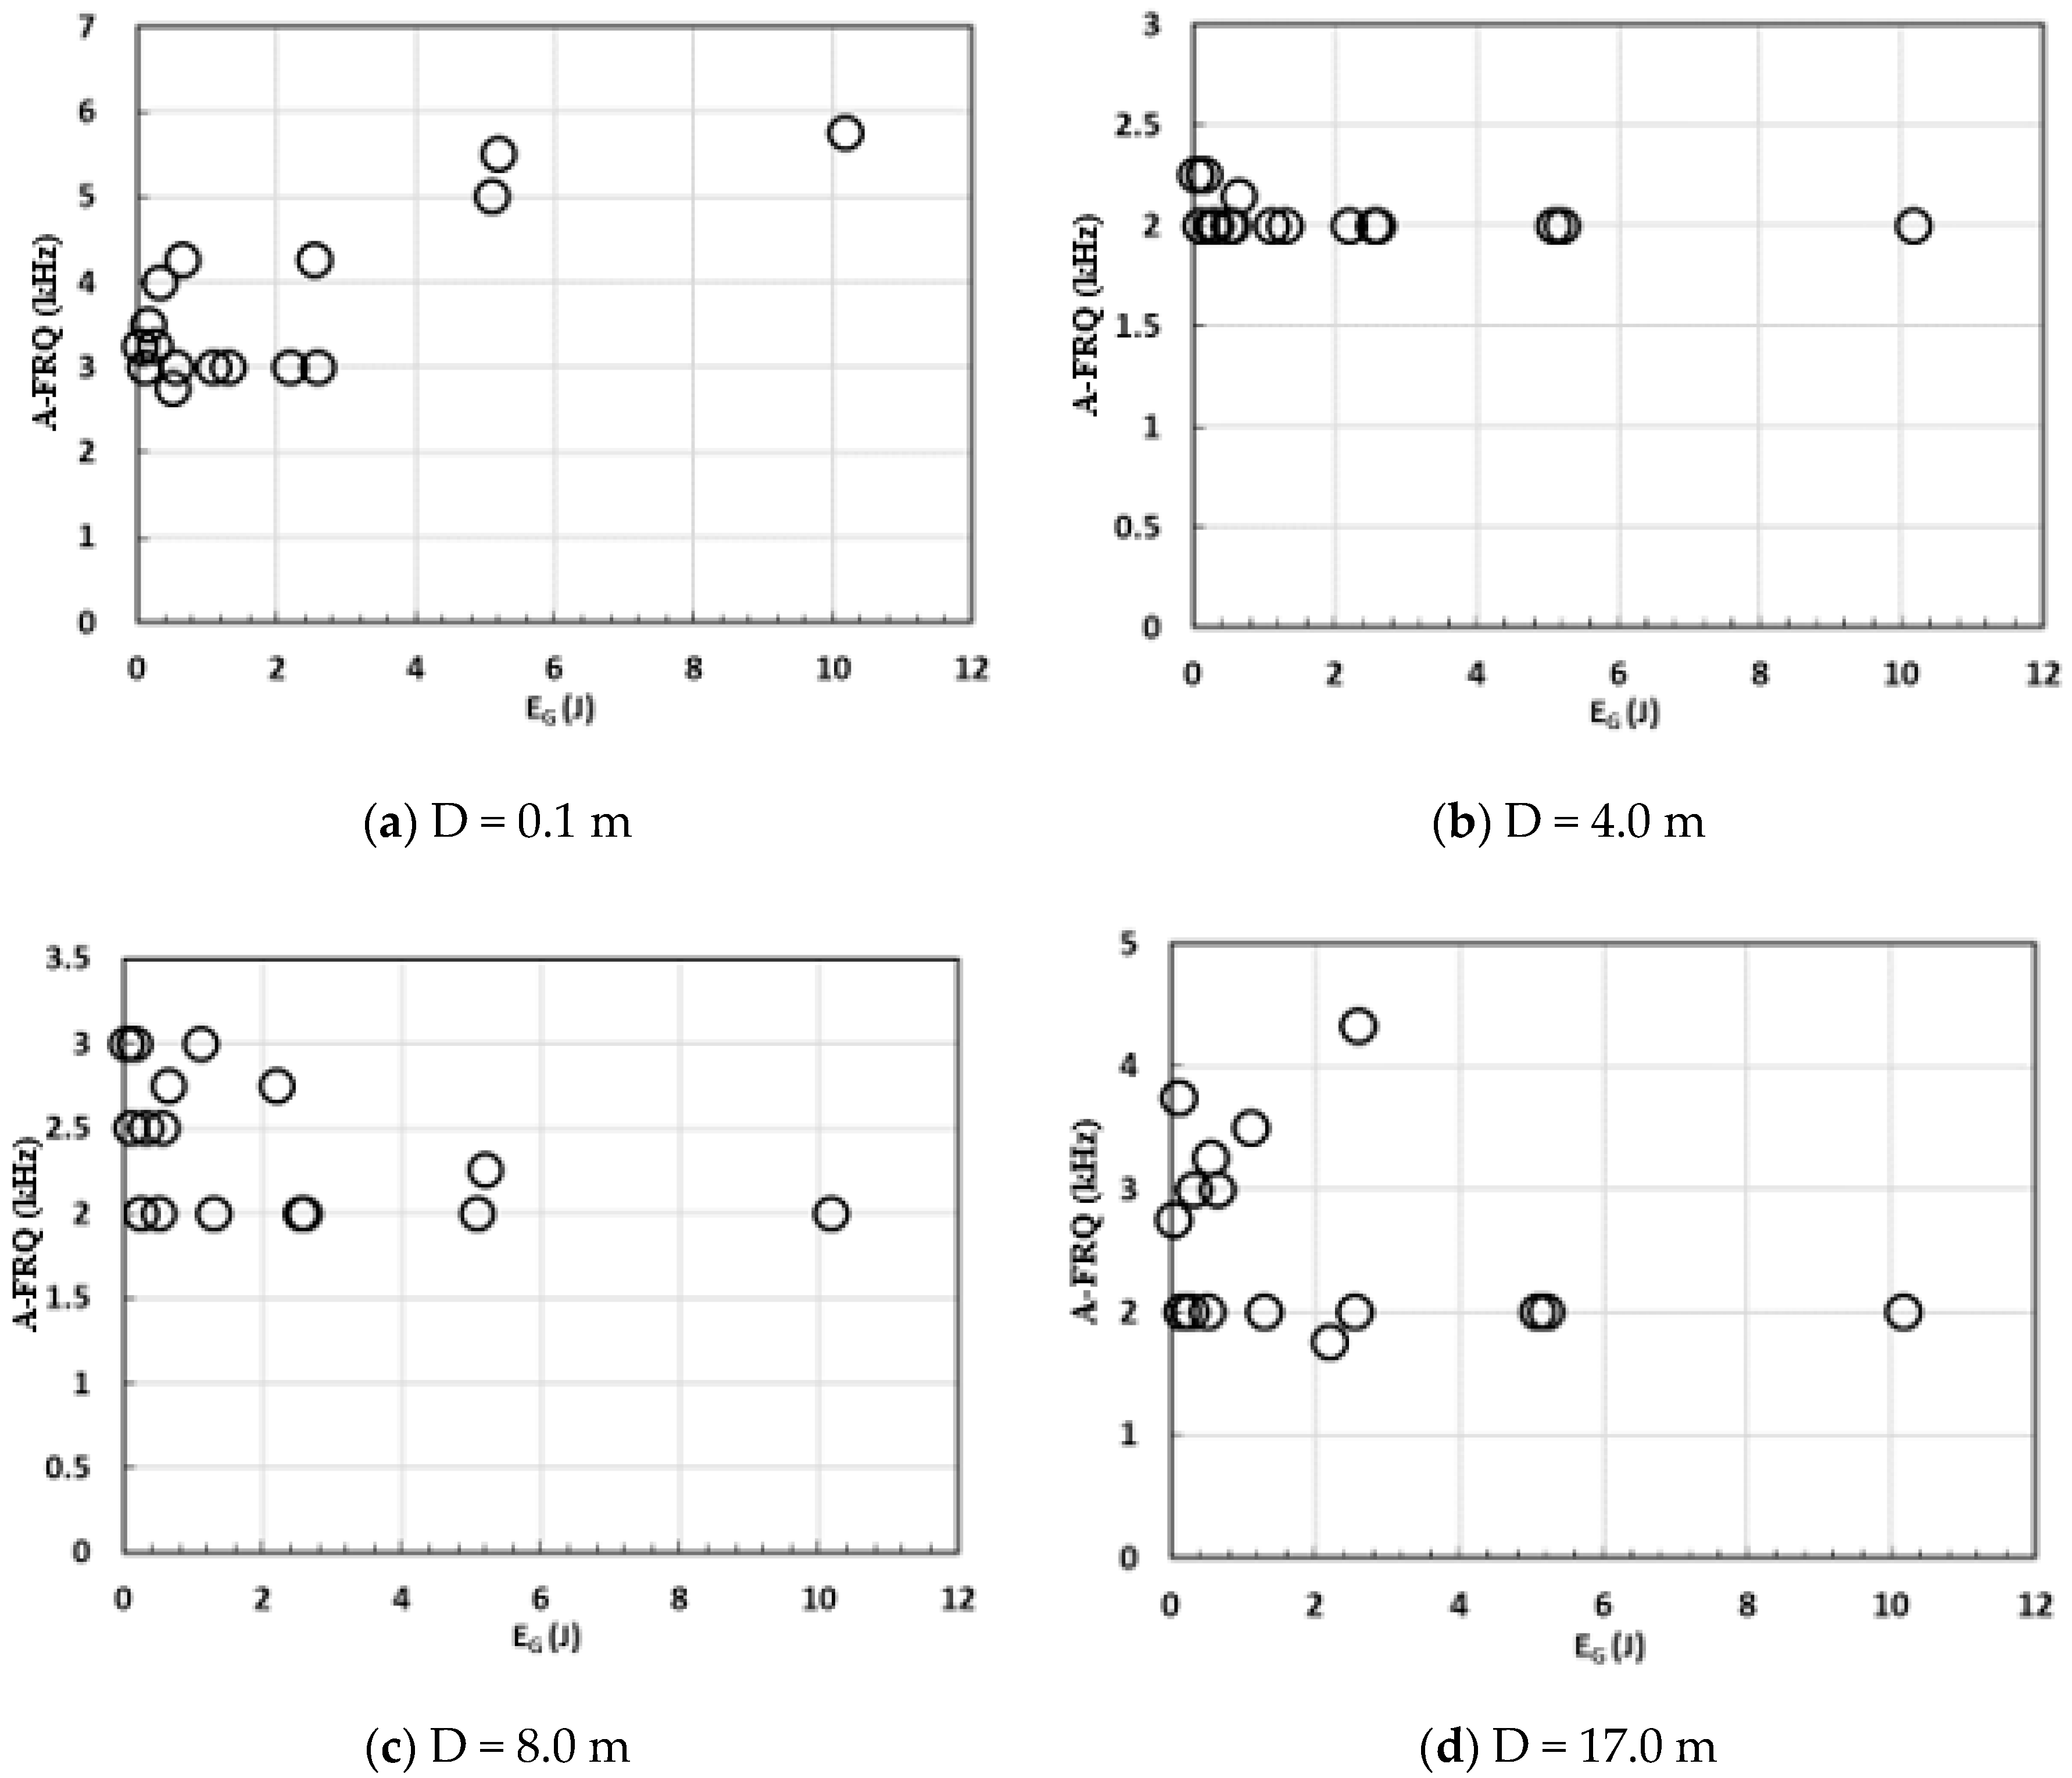
As shown in
Figure 11, a relatively high average frequency was observed when the impact energy was less than 2 J. Then, the average frequency converged to 2 kHz when the impact energy exceeded 3 J at medium and far propagation distances. However, when the propagation distance was close, the average frequency did not converge according to the impact energy. This is because the elapsed time for receiving the AE signal was shorter than the time required to reach the resonant frequency of the sensor. It was also observed that smaller impact energy and propagation distance resulted in higher average frequency.
However, the average frequency did not differ significantly with an increase in impact energy. Considering its definition, this phenomenon occurred because the count and the duration increased according to the increase in impact energy. Similarly, as the wave propagation distance increased, the count and the duration decreased; the average frequency did not appear to decrease with an increase in impact energy. Therefore, average frequency is not considered to be a significant parameter for evaluating the impact energy acting on a concrete structure.
In the experiments, the intensity AE parameters were more sensitive to impact energy than other AE characteristics. Therefore, the absolute energy and signal strength are highly recommended as significant factors for analyzing the external impact of concrete structures in AE monitoring systems.
3.2. Effect of Propagation Distance
As the stress wave from a source propagates outward through the surrounding media, the energy per unit area decreases owing to numerous factors such as geometric spreading, internal friction, scattering, and mode conversion. Here, this loss of signal amplitude is referred to as attenuation. Because high-frequency waves have short wavelengths irrespective of the medium or wave type, their attenuation is greater than that in low frequency waves.
Although the frequencies generated by AE cover a wide spectral range, the typical frequency ranges of 1 to 500 kHz are used according to the material properties. The main frequency of the AE signal is often determined based on the AE sensors used for measurement; nevertheless, most AE signals induced by cracks or damage tend to be of high frequency [
24,
31]. For this reason, AE waves are largely affected by the attenuation effect according to the propagation distance; therefore, it is important to analyze this effect in concrete structures.
Thus, representative AE parameters, including signal strength for the intensity parameter and duration for the waveform characteristics parameter, were quantitatively investigated according to the wave propagation distance.
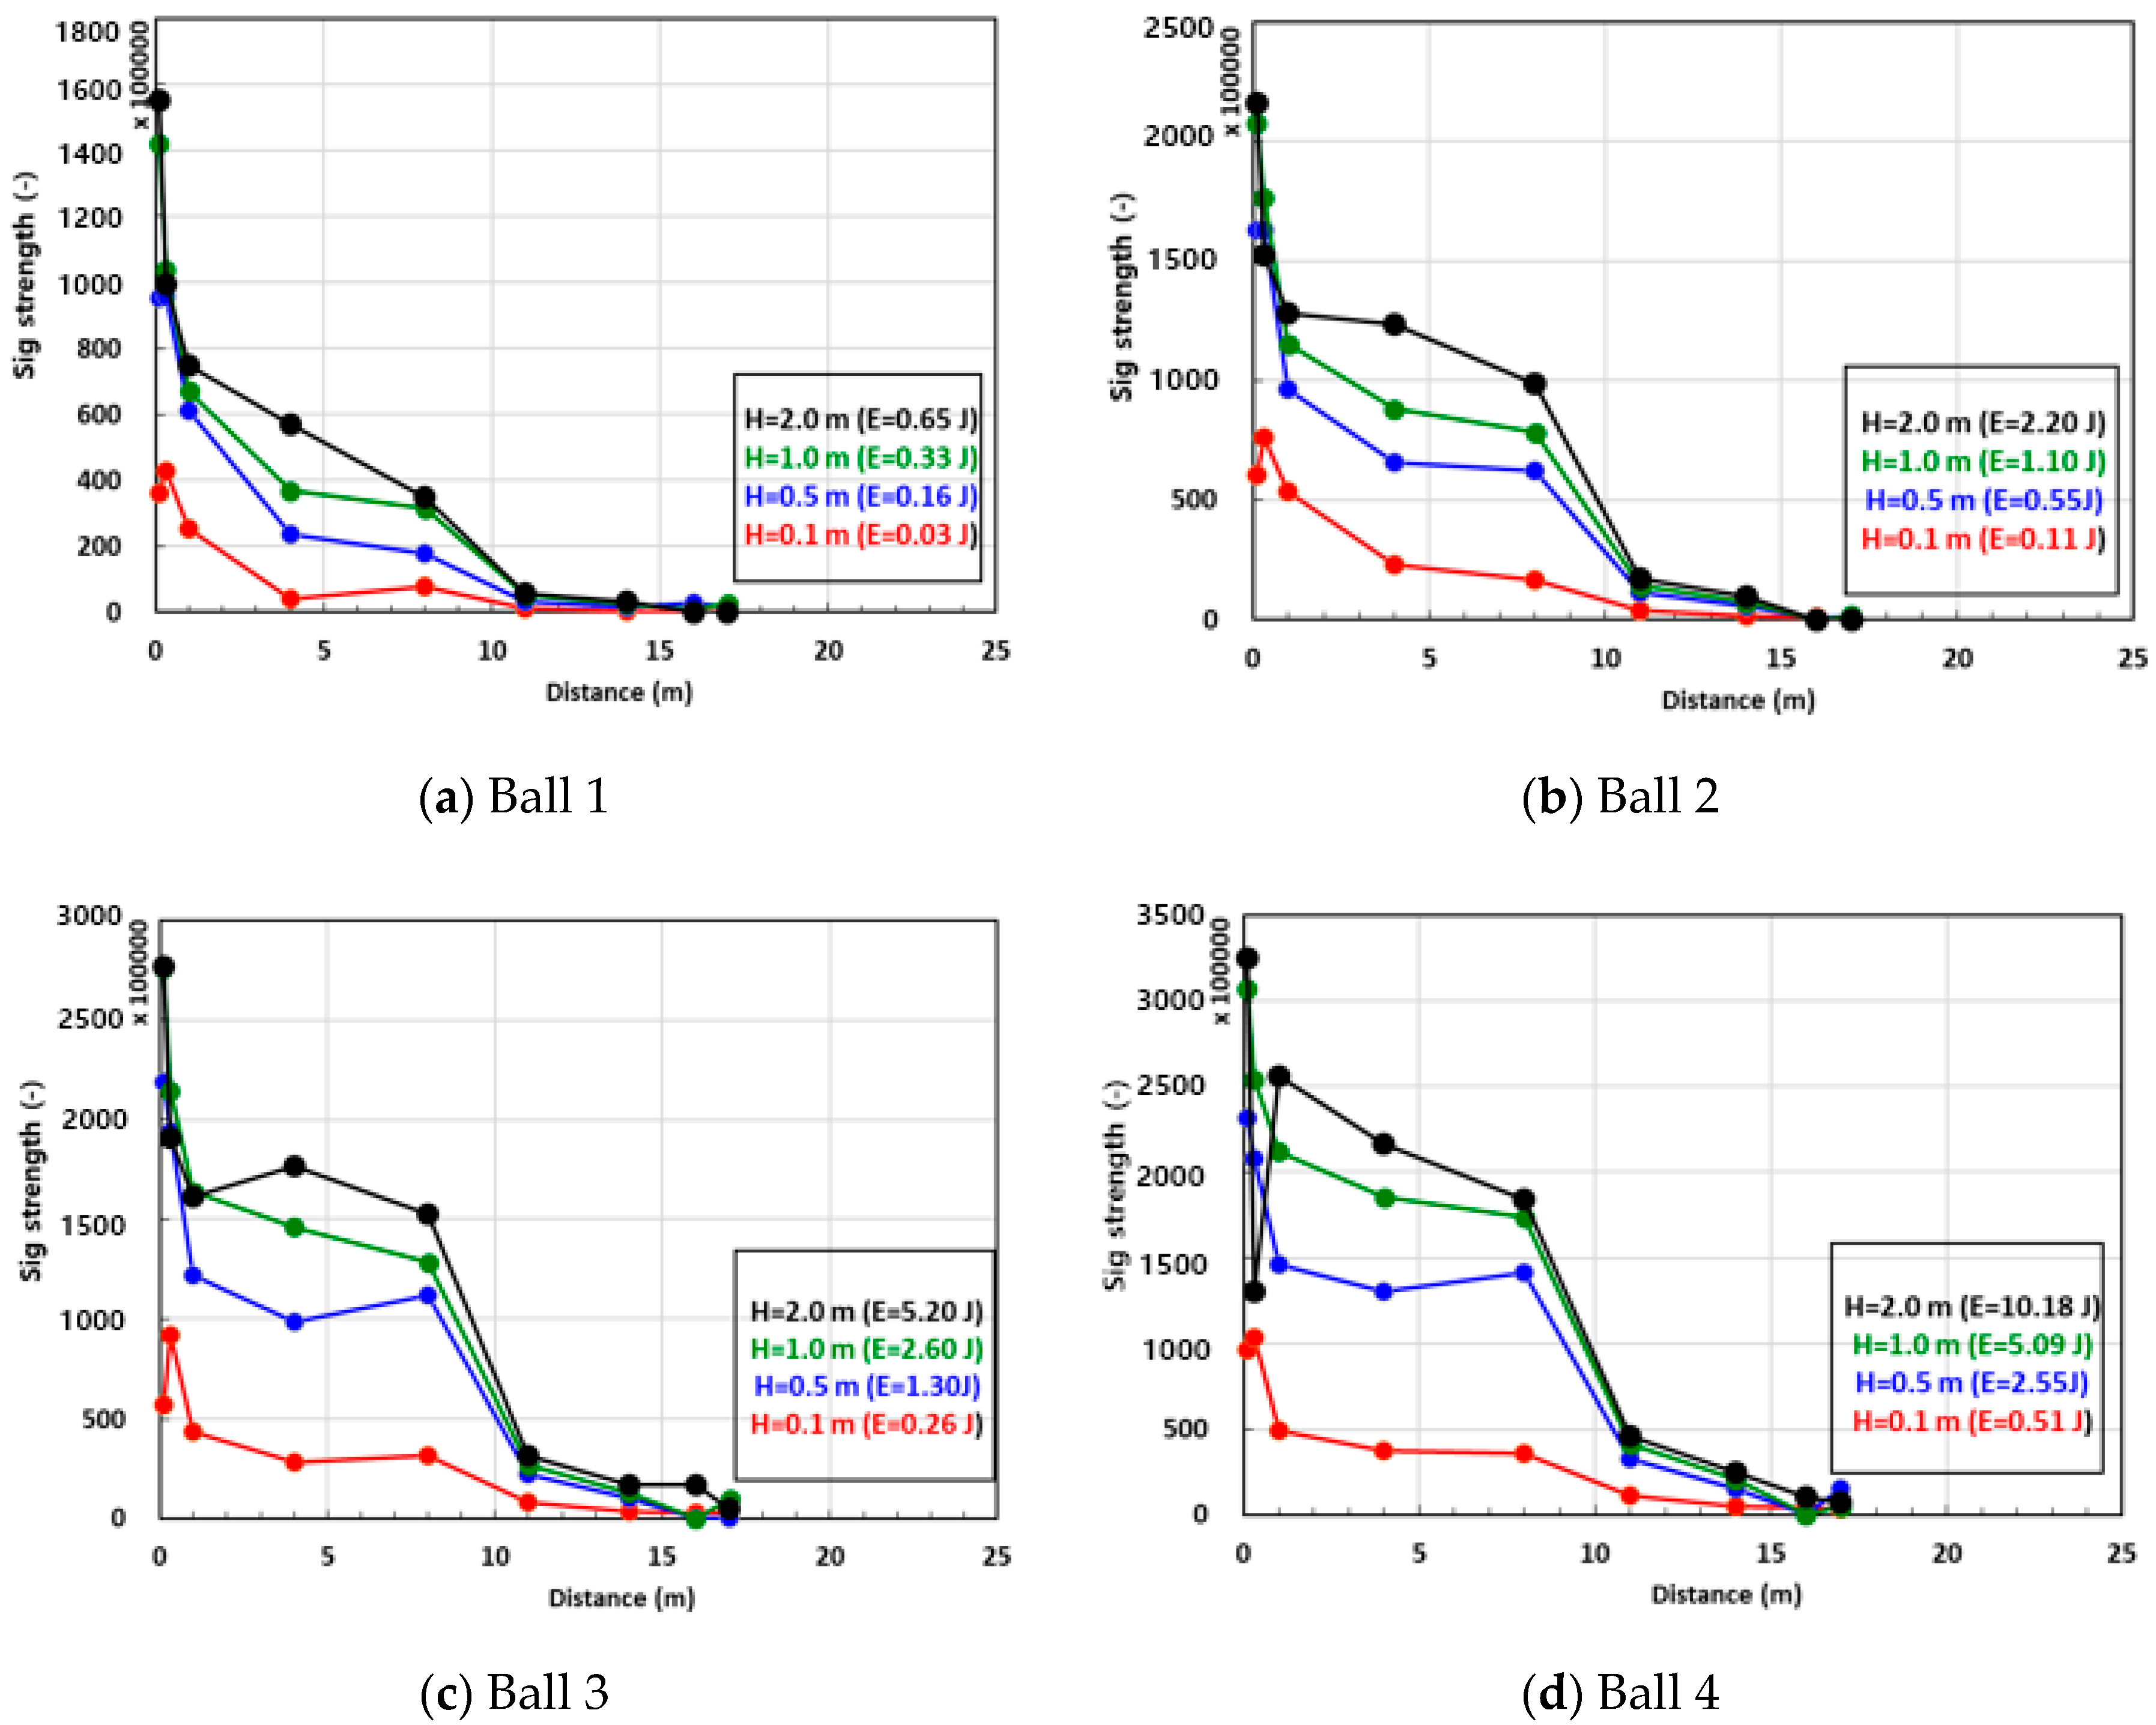
As shown in
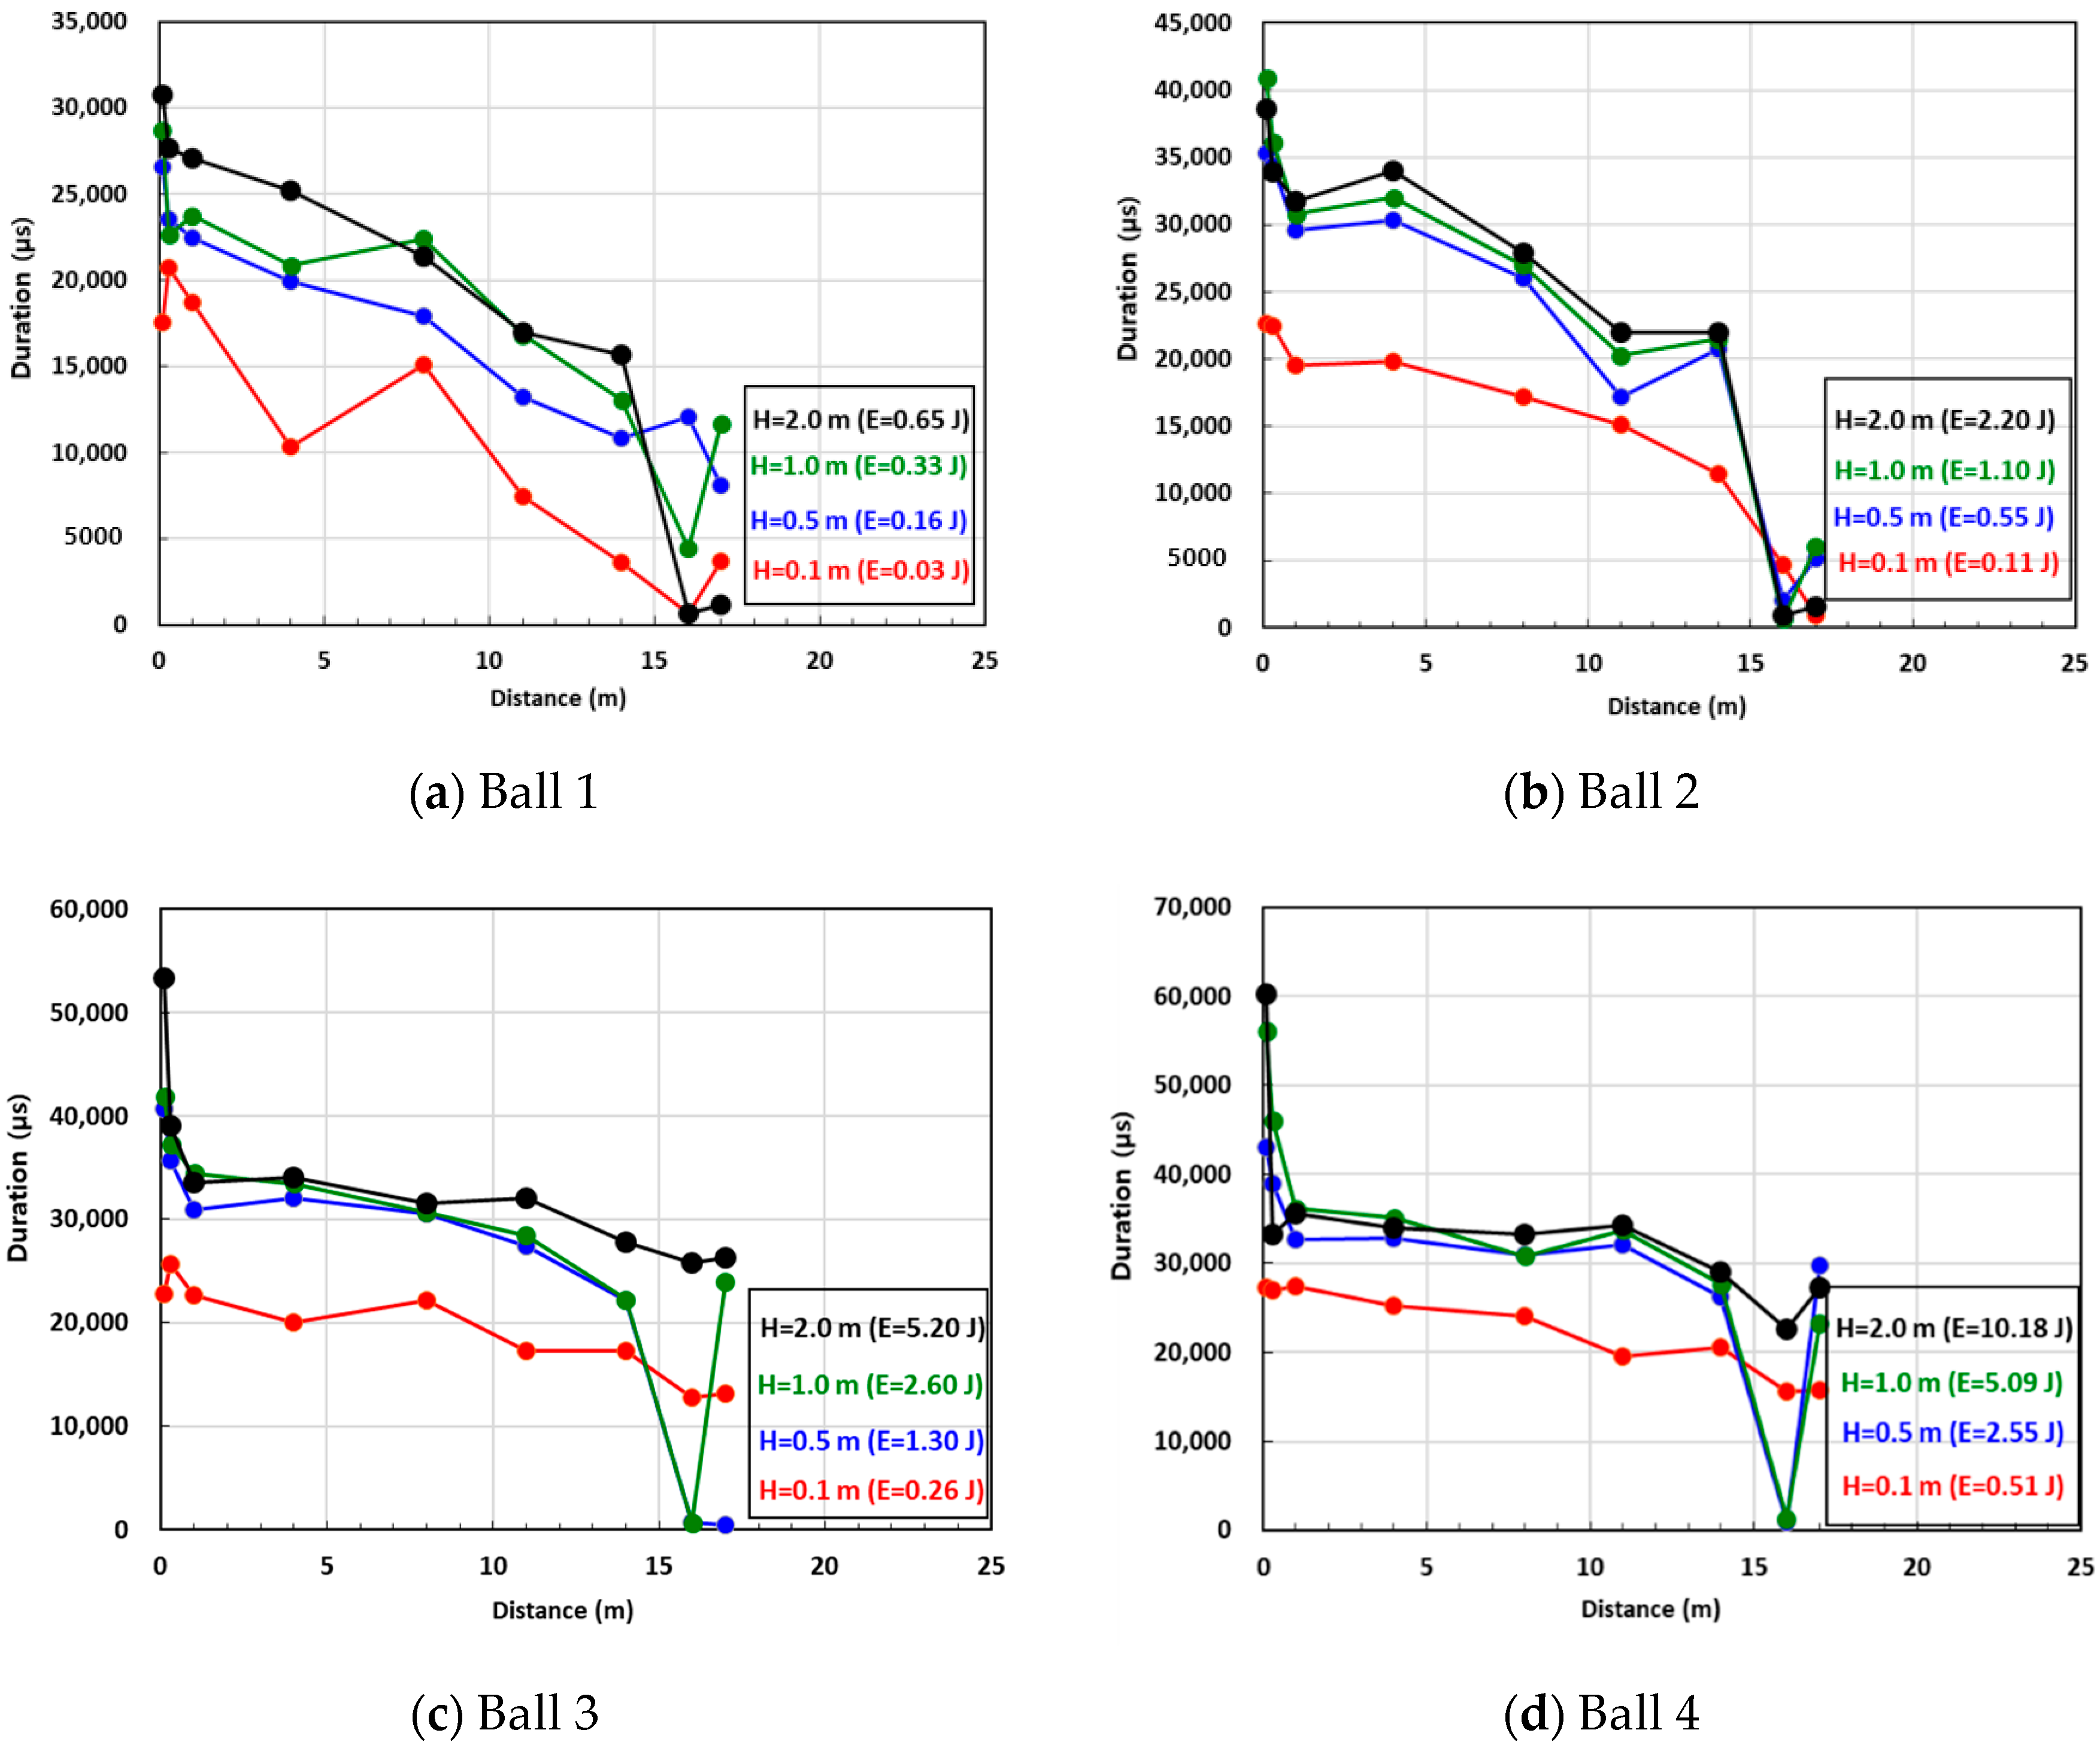
Figure 12, the AE signal strength in all experimental cases decreased according to the propagation distance. The signal strength suddenly decreased at the 10 m point and did not show a significant value after the 16 m propagation distance. This trend was shown regardless of the impact energy. At 4 m, however, the signal strength was less affected by the propagation distance in the case of large impact energy than that of small impact energy. For example, for ball 2, the signal strength decreased by 43% when the impact energy was 2.2 J but decreased by 58% when the impact energy was 1.1 J. The duration also decreased as the propagation distance increased (
Figure 13). The reason for the decreases in both parameters is that the intensity of the AE signal is weakened by the attenuation effect according to the propagation distance. The degree of duration decrease was lower in the case of large impact energy, showing decreases of 44% and 37% when the impact energy was 10.2 J and 5.1 J, respectively, at the propagation distance of 4 m. However, the duration did not decrease abruptly at 10 m and still showed a significant value after the propagation distance of 16 m in all experimental cases. Moreover, unlike the experimental results of the signal strength, the distance ranges included increases with distance, such as that at propagation distances of 4 m and 17 m for ball 2. This phenomenon indicates that the duration parameter is more sensitive to noise such as reflected waves than main AE signals, leading to uncertain experimental results. For this reason, the attenuation effect cannot be accurately estimated by checking only the duration parameter.
According to the experimental results, the attenuation effect is more accurately estimated by the intensity parameter than the waveform characteristics parameter. In addition, the attenuation effect is also affected by the impact energy, as evidenced by the negligible attenuation of the large wave energy according to the propagation distance. Furthermore, this effect was smaller when the propagation distance was long.
4. Discussion
When damage occurs in structures, the main AE signals, as well as other noise such as reflected acoustic waves and vibration, are generated [
32]. Most of acoustic signals induced by cracks or damage appear to be of high frequency, whereas the other noise has relatively low frequency. Attenuation increases with frequency; therefore, at large distances from a source, only the low-frequency components of the event will be observed. It is important to analyze the maximum propagation distance of the main AE signals because the aim of the monitoring system is to detect the damage in the structure by measuring these signals. Considering this fact, we newly defined an effective AE distance for yielding the maximum propagation distance of the main AE signal. That is, if the AE signal is measured at a distance longer than the effective distance, it can be determined as a noise signal.
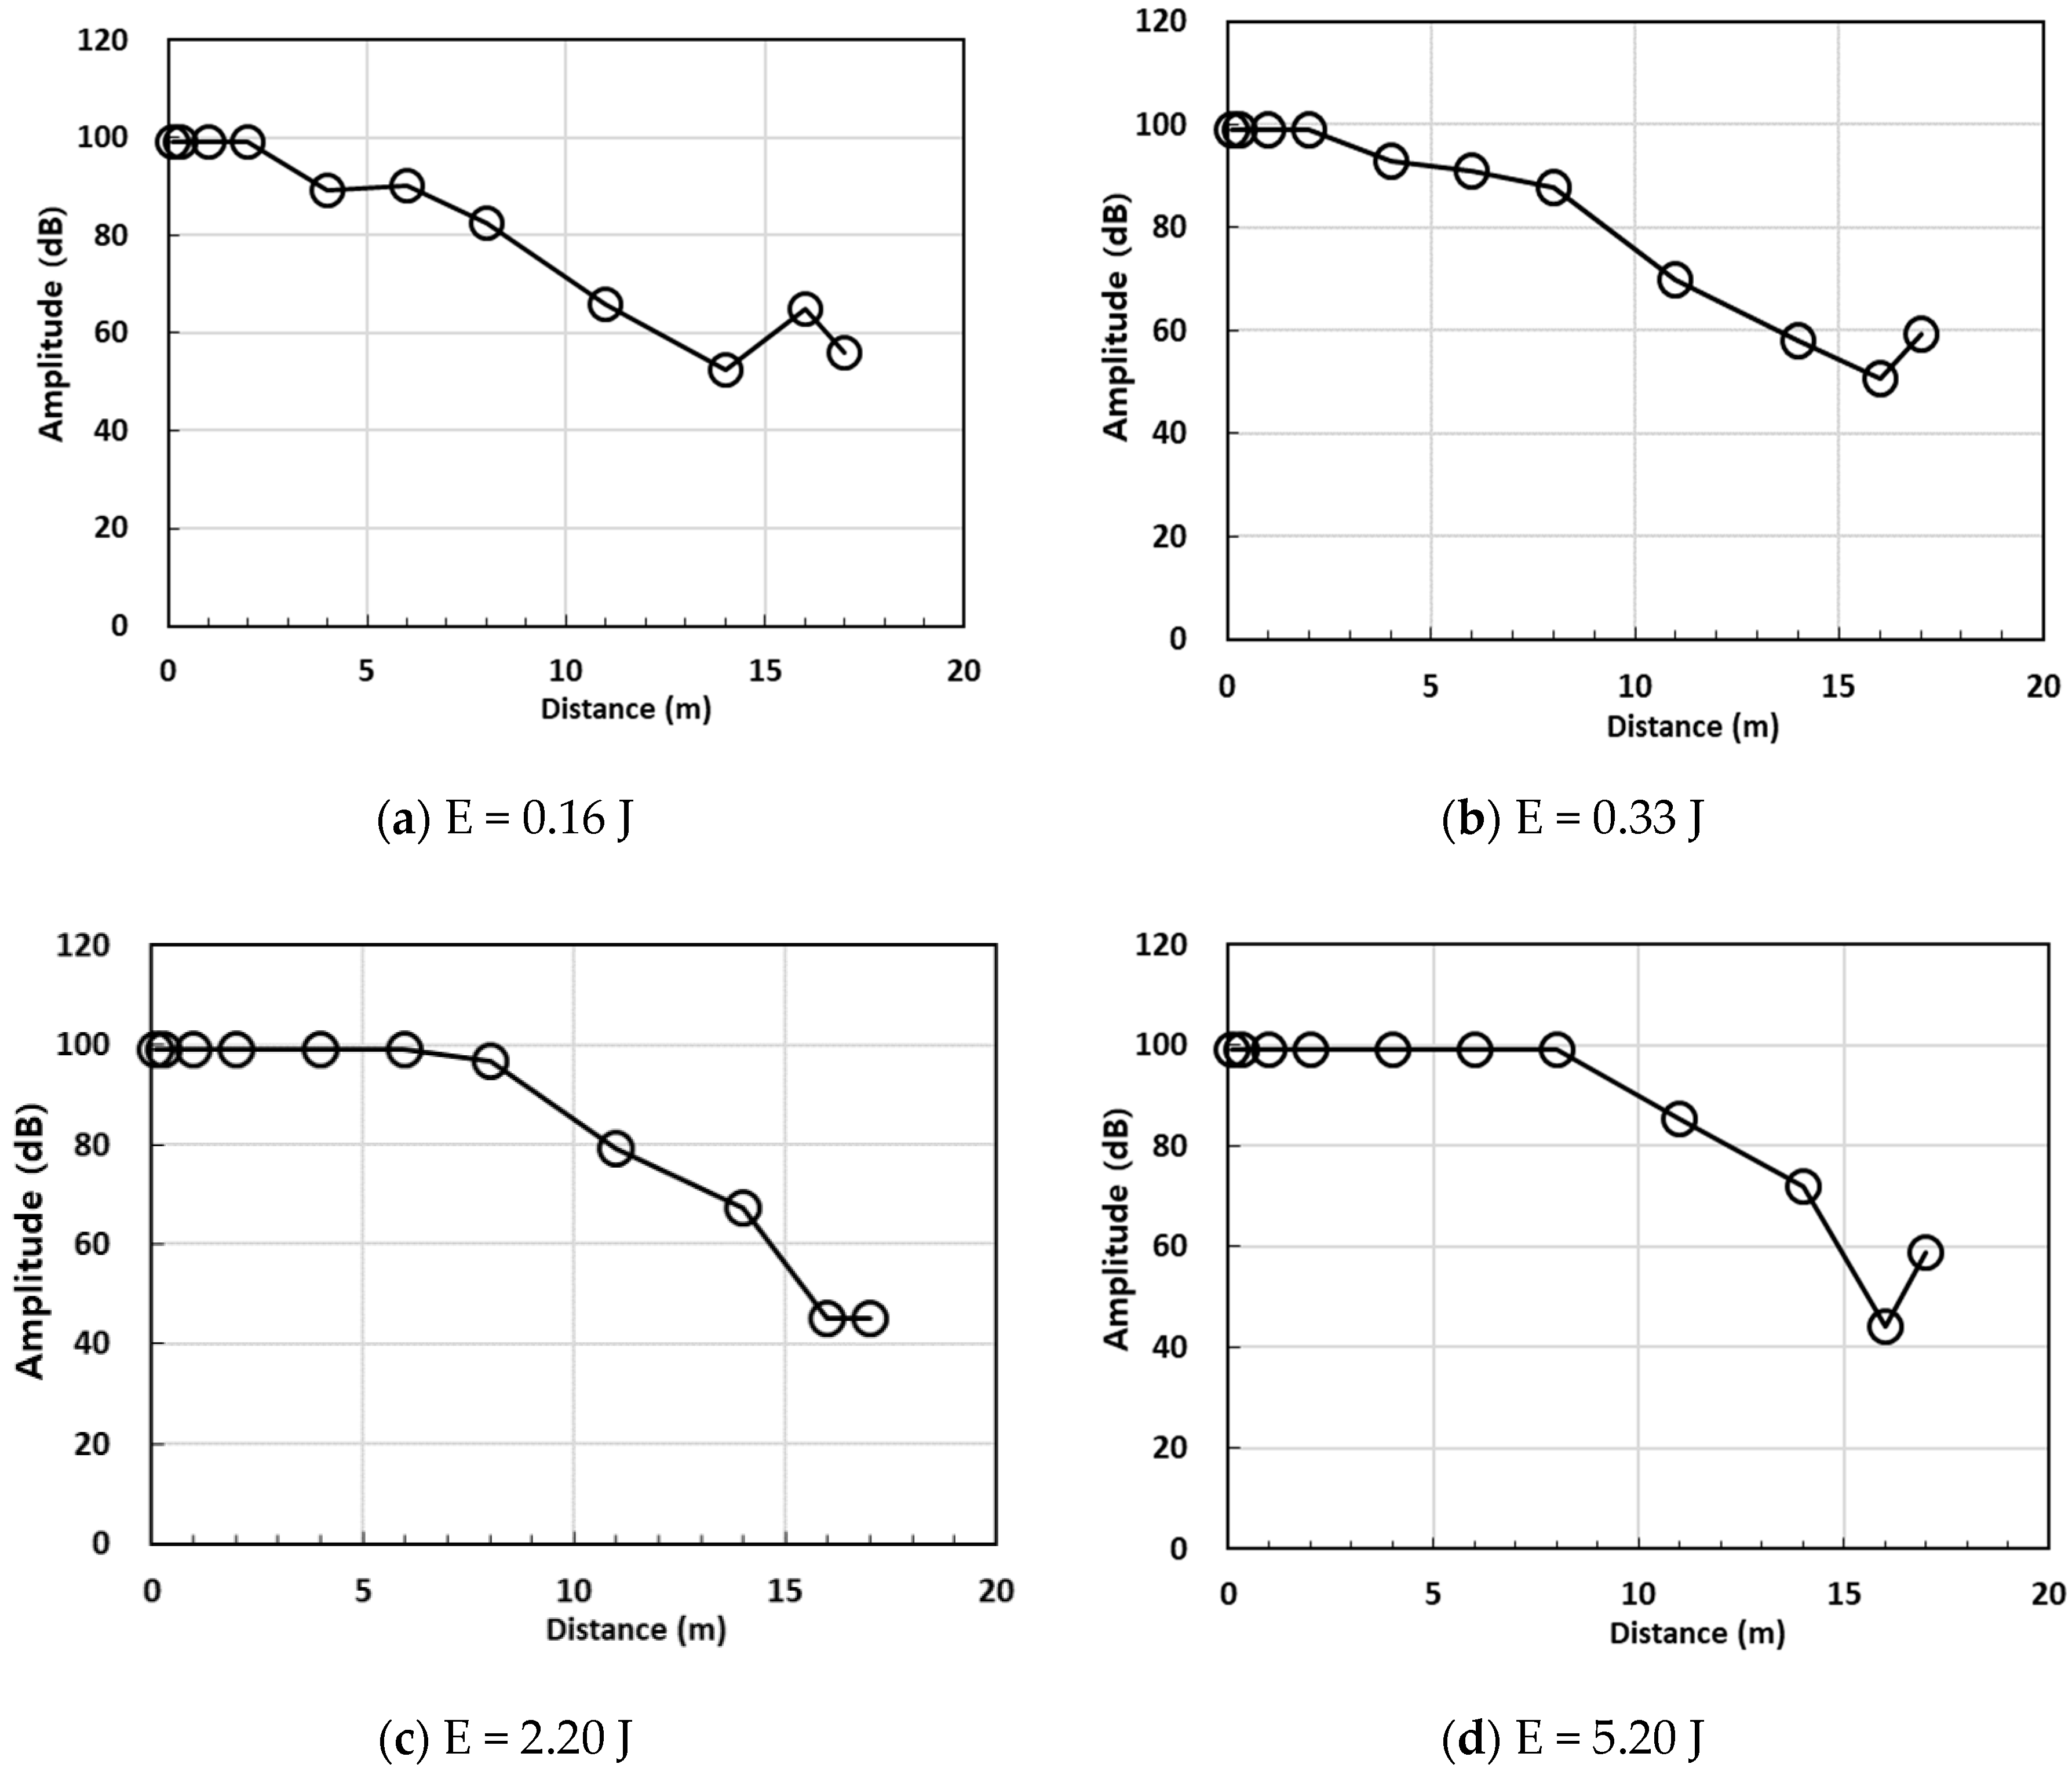
Among the AE parameters, amplitude was chosen as an indicator for suggesting the effective distance. The following amplitude variations according to the propagation distance were investigated for representative experimental cases: very small (E = 0.16 J), small (E = 0.33 J), large (E = 2.2 J), and very large (E = 5.1 J) impact energy (
Figure 14).
In small energy cases (E = 0.16 J, 0.33 J), the amplitude was 100 dB of the measurement limit until the propagation distance reached 2 m; then, it decreased according to the distance. However, when the impact energy was large (E = 2.2 J, 5.1 J), amplitude maintained a constant saturated value until the distance of 8 m was reached, and then it decreased. Contrary to general expectations, the amplitude increased as the propagation distance increased from 16 m to 17 m. This uncertain result is attributed to the noise and weak main signal caused by the attenuation effect with a long propagation distance. The experimental results also showed that the propagation distance at which the amplitude of AE begins to decrease from the maximum value varies depending on the impact energy. Thus, the AE signal can be propagated at long distances if the signal intensity is strong.
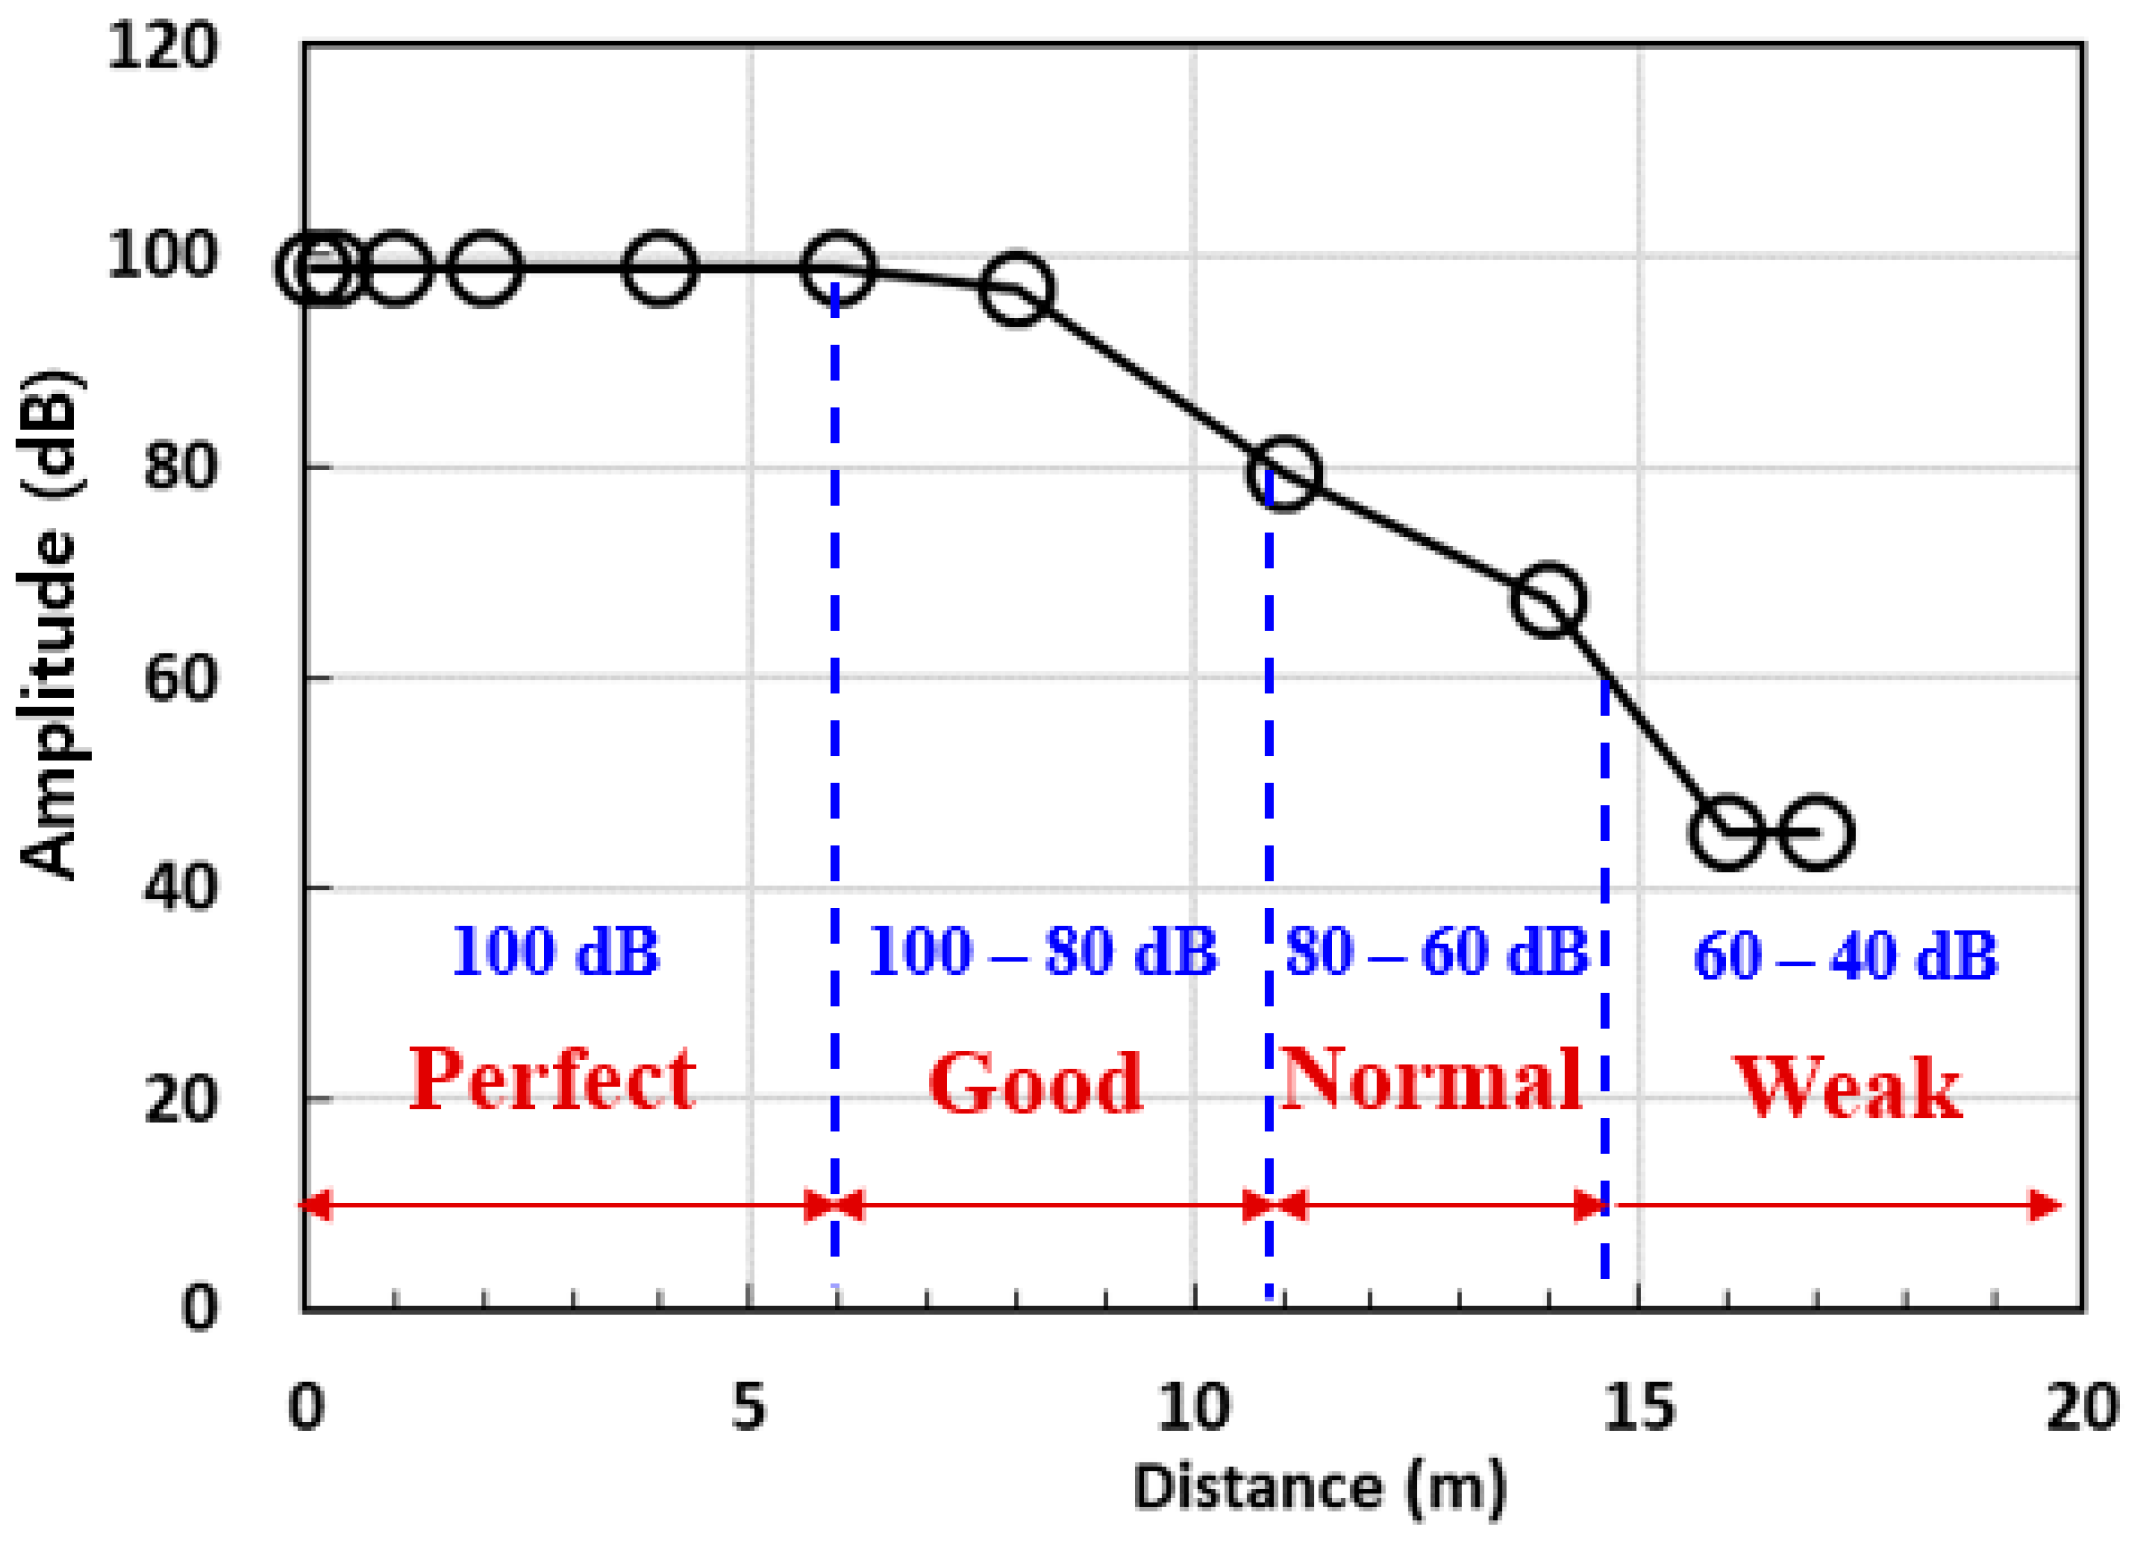
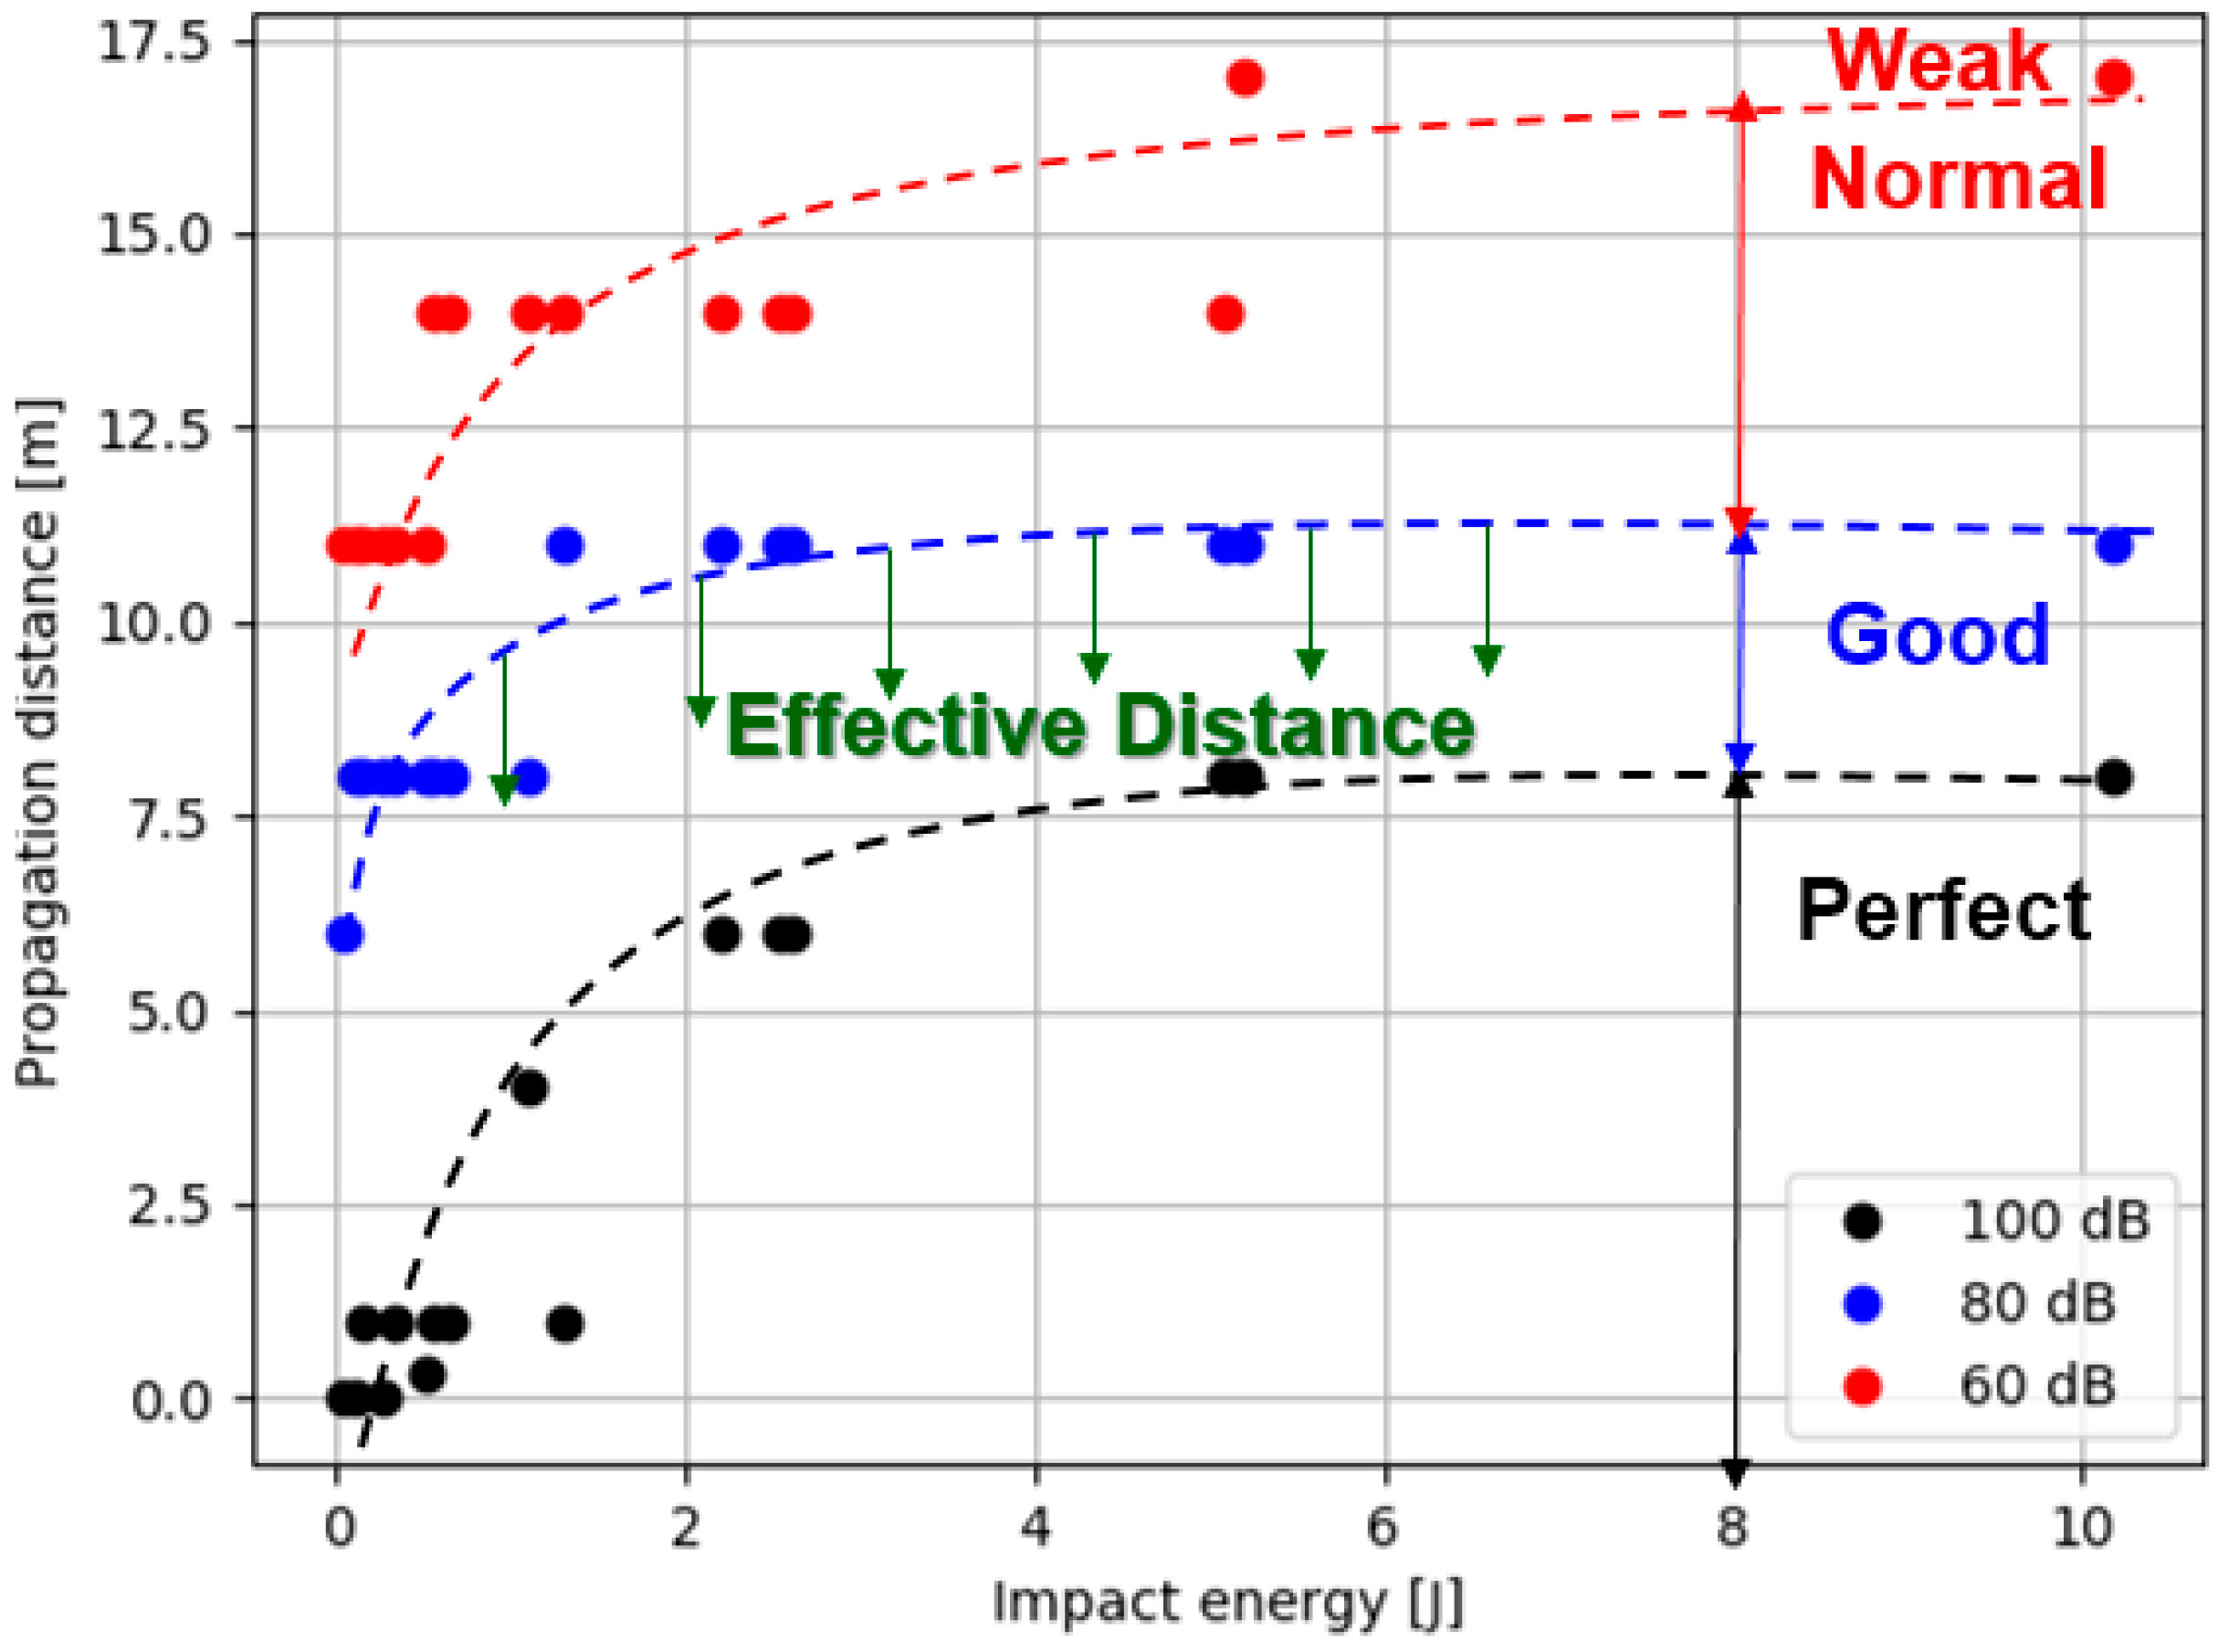
Here, the experimental results of the amplitude at impact energy of 2.2 J were used as a representative case for showing effective distance. The signal reception levels were divided into four steps according to the amplitude values: perfect (above 100 dB), good (80–100 dB), normal (60–80 dB), and weak (40–60 dB). The propagation distances matched with each level, as shown in
Figure 15.
With the propagation distance range at perfect and good levels, the measured AE signal can be regarded as the main AE signal from the material damage. However, those at the normal and weak levels are less reliable because the intensity of the signal is weakened by the attenuation effect. Thus, in the representative case, the effective distance was 11 m.
The effective distance differed depending on the impact energy.
Figure 16 plots the propagation distances at each level according to the impact energy, where the effective distance is a propagation distance below the good level line. The effective distance increased as the impact energy increased, which indicates that a greater impact to the structure results in longer propagation of the effective AE signal. However, although the signal intensity increased, the increase in the effective distance was limited because the damage signal is of high frequency, and the AE wave is finally attenuated at a particular distance regardless of its intensity.
In the field, AE signals are obtained by installing a suitable AE sensor, usually numerous sensors in an array, in locations to facilitate detection of any activity that might originate in the structure under study. In the monitoring system, the above result implies that if the installation distance between the AE sensors exceeds the effective distance, the collected AE signal cannot provide reliable damage information of the structure. That is, the installation distance of the sensor should be appropriately considered based on the effective distance in the monitoring system. The result of the experimental data is specifically based on the representative example and, as such, it should be applied according to the specific cases considering environments, individual parameters of the AE event, and materials of the structure.
Therefore, the suggested concept of effective distance is useful in determining the sensor spacing and array in a field monitoring system. For greater improvement in AE monitoring system applicability, further studies will be needed to develop filtering techniques of the AE signal noise. Furthermore, it is necessary to investigate the method for evaluating structure damage based on AE parameters.
5. Conclusions
The energy of acoustic waves has a significant effect on the wave propagation distance. Thus, the present study investigated the AE propagation characteristics in concrete structures according to the impact energy, and experiments were conducted to evaluate the AE parameters. According to the experimental results, the concept of effective distance for AE monitoring system was presented. This study contributes to improving the field applicability of AE monitoring systems by suggesting suitable spacing for AE sensors. The conclusions of this work are summarized in the following points:
1. The AE measurement experiments were conducted in actual-sized reinforced concrete structures by dropping a steel ball. The amplitude, count, duration, absolute energy, signal strength, and average frequency of the AE signal were investigated according to the impact energy of the ball. The AE parameters tended to increase with an increase in impact energy. Among the AE parameters, absolute energy was determined to be the most sensitive and is thus recommended as a significant factor in AE monitoring systems to evaluate the external impact on a structure. However, the count frequency did not differ significantly with an increase in impact energy.
2. The attenuation effects of the elastic wave were quantitatively evaluated with the AE parameters according to the propagation distance. The experimental results indicated that the signal strength and duration are the key factors for evaluating the attenuation effect of the AE signal. In addition, the signal reception levels were divided into four categories according to the amplitude: perfect, good, normal, and weak. At the propagation distance range at perfect and good levels, the measured AE signal can be regarded as a main AE signal generated from the damage of the material. The effective distance was suggested to be the maximum propagation distance of the main AE signal corresponding to the good level in the representative case. The effective distance increased as the impact energy increased, although the increased effective distance was limited because the damage signal is of high frequency and, therefore, it is effectively attenuated.
Author Contributions
Conceptualization, T.-M.O. and M.-J.K.; Data curation, T.-M.O. and M.-K.K.; Formal analysis, J.-W.L.; Funding acquisition, H.K.; Investigation, T.-M.O., M.-K.K. and J.-W.L.; Methodology, M.-K.K.; Project administration, H.K.; Resources, H.K.; Visualization, J.-W.L.; Writing—original draft, T.-M.O. and M.-J.K.; Writing—review & editing, M.-J.K. All authors have read and agreed to the published version of the manuscript.
Funding
This research received no external funding.
Acknowledgments
This work was supported by a National Research Council of Science and Technology (NST) grant by the Ministry of Science, Information and Communications Technology (ICT) and Future Planning (MSIP) of the Korean government (Nos. CRC-16-02-KICT and NP2016-055) and Basic Research Project of the Korea Institute of Geoscience and Mineral Resources (KIGAM) funded by the Ministry of Science and ICT of Korea (GP2018-009).
Conflicts of Interest
The authors declare no conflict of interest.
References
- Kim, J.T.; Sim, S.H.; Cho, S.; Yun, C.B.; Min, J. Recent R&D activities on structural health monitoring in Korea. Struct. Monit. Maint. 2016, 3, 91–114. [Google Scholar]
- Song, G.; Wang, C.; Wang, B. Structural Health Monitoring (SHM) of Civil Structures. Appl. Sci. 2017, 7, 789. [Google Scholar] [CrossRef]
- Mao, W.; Aoyama, S.; Yowhata, I. Feasibility study of using acoustic emission signals for investigation of pile spacing effect on group pile behaviour. Appl. Acoust. 2018, 139, 189–202. [Google Scholar] [CrossRef]
- Mao, W.; Yang, Y.; Lin, W. An acoustic emission characterization of the failure process of shallow foundation resting on sandy soils. Ultrasonics 2019, 93, 107–111. [Google Scholar] [CrossRef]
- Grosse, C.U.; Finck, F. Quantitative evaluation of fracture processes in concrete using signal-based acoustic emission techniques. Cem. Concr. Comp. 2006, 28, 330–336. [Google Scholar] [CrossRef]
- Kurz, J.H. New approaches for automatic three dimensional source localization of acoustic emissions—Applications to concrete specimens. Ultrasonics 2015, 63, 155–162. [Google Scholar] [CrossRef]
- Li, D.; Yang, W.; Zhang, W. Cluster analysis of stress corrosion mechanisms for steel wires used in bridge cables through acoustic emission particle swarm optimization. Ultrasonics 2017, 77, 22–31. [Google Scholar] [CrossRef]
- Guzman, C.; Torres, D.; Hucailuk, C.; Filipussi, D. Analysis of the Acoustic Emission in a Reinforced Concrete Beam using a Four Points Bending Test. Proc. Mat. Sci. 2015, 8, 148–154. [Google Scholar] [CrossRef]
- Goszczynska, B.; Swit, G.; Trampczynski, W.; Krampikowska, A.; Tworzewska, J.; Tworzewski, P. Experimental validation of concrete crack identification and location with acoustic emission method. Arch. Civ. Mech. Eng. 2012, 12, 23–28. [Google Scholar] [CrossRef]
- Grosse, C.; Ohtsu, M. Acoustic Emission Testing: Basics for Research-Applications in Civil Engineering; Springer: Berlin/Heidelberg, Germany, 2008. [Google Scholar]
- Dzaye, E.D.; Schutter, G.D.; Aggelis, D.G. Study on mechanical acoustic emission sources in fresh concrete. Arch. Civ. Mech. Eng. 2018, 18, 742–754. [Google Scholar] [CrossRef]
- Prem, P.R.; Murthy, A.R. Acoustic emission monitoring of reinforced concrete beams subjected to four-point-bending. Appl. Acoust. 2017, 117, 28–38. [Google Scholar] [CrossRef]
- Abouhussien, A.A.; Hassan, A.A.A. Classification of damage in self-consolidating rubberized concrete using acoustic emission intensity analysis. Ultrasonics 2020, 100, 105999. [Google Scholar] [CrossRef]
- Polyzos, D.; Papacharalampopoulos, A.; Shiotani, T.; Aggelis, D.G. Dependence of AE parameters on the propagation distance. J. Acoust. Emiss. 2011, 29, 57–67. [Google Scholar]
- Feng, X.T.; Young, R.P.; Reyes-Montes, J.M.; Aydan, O.; Ishida, T.; Liu, J.P.; Liu, H.J. ISRM Suggested Method for In Situ Acoustic Emission Monitoring of the Fracturing Process in Rock Masses. Rock Mech. Rock. Eng. 2019, 52, 1395–1414. [Google Scholar] [CrossRef]
- Yun, H.D.; Choi, W.C.; Seo, S.Y. Acoustic emission activities and damage evaluation of reinforced concrete beams strengthened with CFRP sheets. NDT E Int. 2010, 43, 615–628. [Google Scholar] [CrossRef]
- Aggelis, D.G.; Shiotani, T.; Papacharalampopoulos, A.; Polyzos, D. The influence of propagation path on elastic waves as measured by acoustic emission parameters. Struct. Health Monit. 2011, 11, 359–366. [Google Scholar] [CrossRef]
- Feng, H.; Yi, W. Propagation characteristics of acoustic emission wave in reinforced concrete. Results Phys. 2017, 7, 3815–3819. [Google Scholar] [CrossRef]
- Ongpeng, J.; Oreta, A.; Hirose, S. Monitoring Damage Using Acoustic Emission Source Location and Computational Geometry in Reinforced Concrete Beams. Appl. Sci. 2018, 9, 189. [Google Scholar] [CrossRef]
- Tam, N.T.; Ranaivomanana, N.; Balayssac, J.P. Characterization of damage in concrete beams under bending with Acoustic Emission Technique (AET). Constr. Build. Mater. 2018, 187, 487–500. [Google Scholar]
- Schechinger, B.; Vogel, T. Acoustic emission for monitoring a reinforced concrete beam subject to four-point-bending. Constr. Build. Mater. 2007, 21, 483–490. [Google Scholar] [CrossRef]
- Vidya Sagar, R.; Srivastava, J.; Sings, R.K. A probabilistic analysis of acoustic emission events and associated energy release during formation of shear and tensile cracks in cementitious materials under uniaxial compression. J. Build. Eng. 2018, 20, 647–662. [Google Scholar] [CrossRef]
- Aggelis, D.G.; EI Kadi, M.; Tysmans, T.; Blom, J. Effect of propagation distance on acoustic emission fracture mode classification in textile reinforced cement. Constr. Build. Mater. 2017, 152, 872–879. [Google Scholar] [CrossRef]
- Beattie, A.G. Acoustic Emission Non-Destructive Testing of Structures Using Source Location Techniques; Sandia National Laboratories: Albuquerque, NM/Livermore, CA, USA, 2013. [Google Scholar]
- Asamene, K.; Hudson, L.; Sundaresan, M. Influence of attenuation on acoustic emission signals in carbon fiber reinforced polymer panes. Ultrasonics 2015, 59, 86–93. [Google Scholar] [CrossRef]
- R.45I Sensor Manual; MISTRAS Group Inc.: Benicia, CA, USA, 2010.
- AEwin Software Users’ Manual; MISTRAS Group Inc.: Benicia, CA, USA, 2014.
- Ishida, T.; Labuz, J.F.; Manthei, G.; Meredith, P.G.; Nasseri, M.H.B.; Shin, K.; Yokoyama, T. ISRM Suggested Method for Laboratory Acoustic Emission Monitoring. Rock Mech. Rock. Eng. 2017, 50, 665–674. [Google Scholar] [CrossRef]
- Mpalaskas, A.C.; Matikas, T.E.; Van Hemelrijck, D.; Papakitsos, G.S.; Aggelis, D.G. Acoustic emission monitoring of granite under bending and shear loading. Arch. Civ. Mech. Eng. 2016, 16, 313–324. [Google Scholar] [CrossRef]
- Aggelis, D.G.; Tsangouri, E.; Van Hemelrijck, D. Influence of propagation distance on cracking and debonding acoustic emissions in externally reinforced concrete beams. Meccanica 2015, 50, 1167–1175. [Google Scholar] [CrossRef]
- Hardy, H.R. Applications of acoustic emission techniques to rock and rock structures: A state-of-the-art review. Acoustic emissions in geotechnical engineering practice. Am. Soc. Test. Mater. 1981, 4–92. [Google Scholar] [CrossRef]
- Carpinteri, A.; Xu, J.; Lacidogna, G.; Manuello, A. Reliable onset time determination and source location of acoustic emissions in concrete structures. Cem. Concrete Comp. 2012, 34, 529–537. [Google Scholar] [CrossRef]
© 2020 by the authors. Licensee MDPI, Basel, Switzerland. This article is an open access article distributed under the terms and conditions of the Creative Commons Attribution (CC BY) license (http://creativecommons.org/licenses/by/4.0/).


