Abstract
In this paper, a novel high-sensitivity temperature sensor with two sensing regions based on optical microfiber coupler interferometer (OMCI) for ocean application is proposed. The OMCI sensor is constructed by connecting Faraday mirrors to the two ports of the microfiber coupler respectively. Its sensing characteristics analysis and experimental test are conducted. Using a broad-spectrum light source as input light, temperature sensor demodulation can be implemented by tracking the drift of the characteristic wavelength (dip wavelength or peak wavelength) of the reflection spectrum. Experimental results show that the temperature sensitivity of the OMCI sensor can reach 1007.4 pm/°C and the detection dynamic range up to 17.6 °C. Besides, due to the two sensing regions in OMCI, self-calibration of seawater temperature sensing and optimization of multi-parameter cross-sensitive demodulation are performed by affecting the non-equal-arm interferometer through a specific package design of the external environment. The sensor has the advantages of high sensitivity, large dynamic range, small size, easy to manufacture, which will play an important role in the practical application of marine environment monitoring.
1. Introduction
Seawater temperature is an important basic parameter of the ocean physical state equation, and is directly related to ecosystem protection, global warming [1]. Therefore, it is significative to monitor the seawater temperature in real-time, online, and in large scale. As an important passive component of taper fiber, optical microfiber coupler (OMC) has the advantages of large evanescent field transmission characteristics, strong light confinement ability, low loss, small size, multi-port optical transmission, etc. It has been applied in research fields such as communication, sensing, and laser [2,3]. Especially in the field of physical parameter sensing and monitoring, it shows good application potential, and has been used for sensing of refractive index, pressure, current, magnetic field, microfluidic flowmeter, ultrasound, and alike [4,5,6,7,8,9,10,11,12,13]. In view of the advantages of optical fiber sensors such as high sensitivity, compact structure, easy for multiplexing and integration, and online monitoring of physical parameters, there is also a strong interest in the application of OMC in marine environmental monitoring. For example, in 2015, Wang et al proposed an temperature and salinity sensor based on microfibers directional coupler; by coating 1% concentration Ethyl cellulose ethoce (EC) solvent on the coupling area of dual microfiber, the temperature sensing sensitivity of 1.17 nm/°C was achieved, simultaneously the dual parameter sensing function of OMC temperature and salinity was verified [14,15]. In addition, our research group has carried out the research of OMC’s three-parameter sensing characteristics of seawater temperature, salinity, and depth. We used the fusing and tapering OMC without any sensitization measures, achieved sensor response capability of 1596 pm/‰, 2326 pm/°C, 169 pm/Mpa, and pointed out the idea of three-parameters synchronous sensing demodulation [16]. However, in order to satisfy the monitoring requirements of the practical marine environment, it is critical to encapsulate and protect the sensor. But OMC is a four-port optical device, the excess ports and optical path become the burden of the sensor package design. Given this, it is necessary to further simplify the optical path structure and effectively solve the problem of sensor cross-sensitivity [17].
In this paper, we propose a reflection optical path device based on optical microfiber coupler interferometer (OMCI), and theoretically analyzes its spectral transmission characteristics and seawater temperature sensing characteristics. Besides, the seawater temperature sensing experiment is validated. To the best of our knowledge, there have been few reports on related research work. Comparing other temperature sensor based on microfiber, The OMCI has a simpler structure which is convenient for packaging and multiplexing integration. More importantly, the temperature self-calibration function can be achieved because there are two sensing areas, which provided important potential for practical application in marine environment monitoring.
2. The Fabrication and Sensing Principle of OMCI
2.1. Structure and Fabrication
In this work, the OMC is fabricated by laterally fusing and tapering two twisted silica glass single-mode fibers (SMFs, the core diameter is 10 μm and the cladding diameter is 125 μm) [18,19]. As schematically shown in Figure 1a, OMC is mainly composed of three parts, including a uniform waist area, two tapered transition areas, and four input and output ports (P1, P2, P3, P4). The waist region can be regarded as the coupling between two microfibers (OMs). By connecting fiber mirrors to the two ports of the microfiber coupler respectively, the optical microfiber coupler interferometer structure is constructed, as shown in Figure 1b. Comparing with the conventional optical fiber interferometer, we used OMC as a coupling beam splitting device. Its transmission spectrum not only has interference phenomena which is similar to the conventional interferometer, but also is modulated by OMC’s spectral transmission characteristics. Figure 1c shows the microscope images of OMCI uniform waist region.
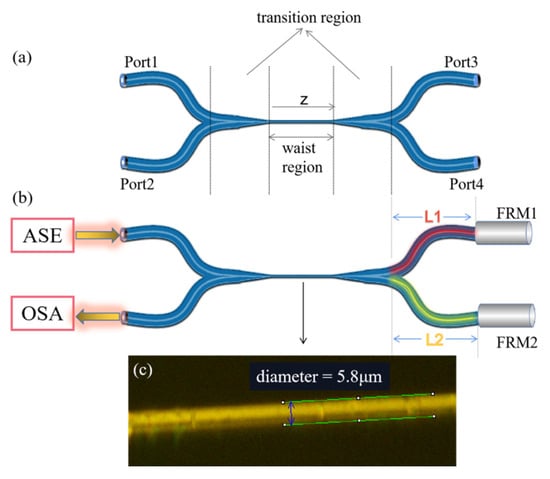
Figure 1.
(a) The schematic diagram of the optic microfiber coupler (OMC). (b) Optical microfiber coupler interferometer (OMCI) is composed by connecting Faraday rotator mirrors (FRM) at port3 and port4 of OMC, respectively, the amplified spontaneous emission (ASE) broadband light source inject to port1 and monitoring the signal from port 2 by using the optical spectrum analyze. (c) Microscopic image of the OMC waist region.
Due to the existence of birefringence effect and environmental disturbances in ordinary single-mode optical fibers, the construction of interferometers with ordinary fiber end mirrors will cause the problem of polarization fading, and then causing interference instability. Utilizing the Faraday rotator mirrors (FRMs) instead of fiber mirrors can play a role in suppressing polarization fading [20]. Therefore, it is better to choose FRM as the reflector of the interferometer in sensing applications.
2.2. Sensing Mechanism
OMCI proposed in this paper is a hybrid sensing device. There are two sensing units, one is the waist region with evanescent field transmission capability, and the other is the sensing arm of the interferometer. The OMC plays a leading role in the spectral transmission characteristics of hybrid devices, and is more sensitive to the external environment. Therefore, it is generally more effective to select OMC as the sensing unit of OMCI, and the interferometer sensing arm is only used as the light reflection and sensitizing unit.
OMC characteristic can be analyzed by local coupling mode theory, that is, the total coupling of OMC is the superposition of each local coupling [1]. When the P0 incident power is injected into the port1, the output light intensity of the port3 and port4 is expressed as [14,15,16,21]:
where l represents the coupling length, c(λ,n2,z) is the coupling coefficient in location z. For the fusing and tapering OMC, the thinner tapered transition region and uniform waist region plays a leading role in the coupling characteristics [2,19]. Under the condition of strong coupling, the coupling coefficient c is expressed as [7,17,18]:
where is normalized frequency, λ is incident light wavelength, r is the radius of the microfiber at the waist region, n2 (1.4682 at wavelength of 1550 nm) and n3 (determined by temperature, salinity, pressure and wavelength) are the refractive indexes (RIs) of fiber cladding (silica) and external environment (sea water) respectively.
For OMCI, the detection light is injected to the port1 of OMCI, after the first coupling, it will be output from the port3 and port4. The output light of the port3 and port4 will be reflected by the FRMs and reenter the OMC coupling region, and then occur coupling and superimpose interference. Assuming that the reflection efficiency of FRM is 100%, then the output light intensity at port2 can be expressed as:
where represents the phase difference indicating interference, la is the interferometer arm difference. According to Equations (1)–(3), when the environment temperature changes (n3 varies), or the OMC structural parameters (such as r, l, n3, etc.) are changed by the temperatures, the characteristic spectrum of OMCI will be modulated. The “interfered” detected light carrying environmental information will be output from the port 2 of OMC. Therefore, the ambient temperature can be monitored by monitoring the change of the OMCI reflective spectrum.
If the waist region of OMCI is placed in seawater (OMC is selected as the sensing unit, the interferometer sensing arm does not participate in the sensing response), with the seawater temperature changes, the thermo-optic effect and thermal expansion effect of the optical fiber will cause the cladding RI n2 change to Δn2, the coupling length l change to Δl, and the microfiber waist radius r change to Δr. In addition, change of seawater temperature will also cause their RI n3 change to Δn3. Thereby, it will cause the OMCI transmission spectrum to shift. When tracking a characteristic wavelength of the OMCI transmission spectrum, with the seawater temperature changes, the characteristic wavelength shift to Δλ. Thus, the sensitivity of OMCI’s seawater temperature sensing response can be expressed as [16,17]:
3. Sensing Characteristics and Demodulation
3.1. Analysis of Sensing Characteristics
According to Equation (4), different structural parameters of OMC will cause different sensing characteristics of OMCI. The mainly structural parameters of OMC are the length L of the uniform waist region and the radius r of the microfiber at waist region, and its transmission characteristics are mainly determined by the two parameters (the OMC used in this paper is drawn by a volume conservation model, the coupling length and uniform waist length satisfy a specific function relationship [19,22]). From an intuitive analysis of the evanescent transmission characteristics of OMC, the thinner radius r of the microfiber at waist region will cause the larger proportion of the evanescent field of the transmitted light field, so it is more sensitive to environmental changes. In view of this, this paper first analyzes the sensing characteristics of OMCI with different OMC waist radius. During the simulation, the seawater salinity was set to 30‰, and the arm difference is 0 mm (an equal arm interferometer is selected for sensor characteristic analysis), and we suppose input light intensity P0 = 1. Besides, The length of OMC uniform waist is set 3 mm, when the radius of the microfiber at waist region are selected as 1, 3, and 5 μm respectively, The calculation results of output spectra are shown in Figure 2a. It can be seen from the figure that the thinner of the waist region, the more the number of characteristic wavelengths (dip and peak).
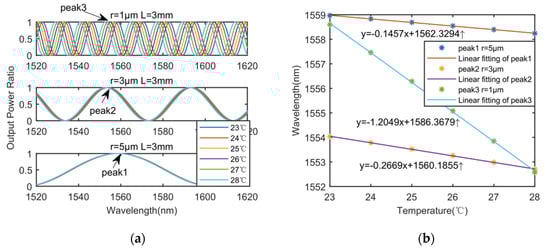
Figure 2.
(a) The numerical results of output spectra of OMCI with temperatures under different microfiber waist radius of 1, 3, and 5 μm. (b) Analysis results of temperature sensing response characteristics of OMCI under different microfiber waist radius r.
In addition, it can be seen from Figure 2a that the transmission spectra of OMCI blue-shift with the seawater temperature increasing. For the three OMCs with different waist diameters, the characteristic wavelengths (three peak points with similar wavelengths) were selected to calculate the respective temperature sensing response characteristics. The results are shown in Figure 2b, for the OMC with waist radius of 1, 3, and 5 μm, the temperature sensitivity of OMCI are 1204.9 pm/°C, 266.9 pm/°C, 145.7 pm/°C respectively. The calculation results show that the sensor got higher temperature sensitivity as the thinner OMC waist radius, which is consistent with the previous analysis. In practical applications, higher sensitivity can be obtained by reducing the waist radius of OMC. However, the thinner OMC waist radius will reduce the mechanical strength of the device and increase the insertion loss of the device. In addition, it is required higher manufacturing process, so it should be comprehensively considered.
In order to study the effect of the uniform waist length L on the OMCI sensing characteristics, we used OMCs with different L to simulate the temperature sensing characteristics. Fix the waist radius r = 2 μm, L = 1, 3, and 5 mm were set respectively. The other parameters are consistent with the previous simulation. The OMCI output spectra calculation results are shown in Figure 3a. From the results that the more the characteristic wavelengths (dip and peak) of the OMCI output spectrum with the longer uniform waist length L. For OMCIs with different uniform waist lengths, we also calculated the sensor response characteristics, and the results are shown in Figure 3b. From the simulation results, it can be seen that the waist length of OMC has less influence on the temperature sensitivity of OMCI.
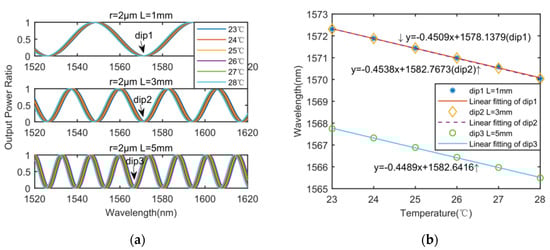
Figure 3.
(a) The numerical results of output spectra of OMCI with temperatures under OMC uniform waist length of 1, 3, and 5 mm. (b) Analysis results of temperature sensing response characteristics of OMCI under different uniform waist length L.
Because of the wavelength dependence of OMC, the sensing sensitivity is varied at different wavelengths [5]. Therefore, by properly selecting the L and r parameters of the device, multiple dip or peak characteristic wavelengths in the OMCI output spectrum can be achieved, and then multiple parameter sensing can be realized by tracking multiple characteristic wavelengths. The number of characteristic wavelengths determines the number of parameters that can be monitored. Besides, it also determines the dynamic range of the monitored parameters. Moreover, it is contradictory between the number of detectable parameters and the dynamic range of monitored parameters, which needs to be comprehensively considered in the design of the sensor [17]. From the aforementioned analysis, it can be seen that the OMC waist region diameter has a greater affect on the sensor sensitivity. Therefore, the number of characteristic wavelengths can be determined by adjusting the length L, and the sensing characteristics of the device can be adjusted by changing the waist region radius r.
The two arm difference of OMCI used in the above analysis is zero, so the OMC is mainly used as sensing unit to analyze the influence of OMC structure on the sensing characteristics of the combined device. In addition, the interferometer itself also has the sensing function. In view of this, this paper selects different interferometer arm differences to analyze the spectral transmission and temperature sensing characteristics of OMCI. First, select the structural parameters of OMC as r = 2 μm, L = 2 mm, When the interferometer arm lengths la are 1, 3, and 5 mm respectively, the output spectra under different temperatures are shown in Figure 4. The intensity envelope characteristics of the OMCI output spectra are mainly determined by the coupling filtering characteristics of the OMC, and the interference fringe characteristics within the envelope are determined by the interferometer arm difference. The temperature sensing function can be realized by tracking the wavelength corresponding to the extreme point of the envelope (the dip or peak characteristic wavelength that are mentioned above).
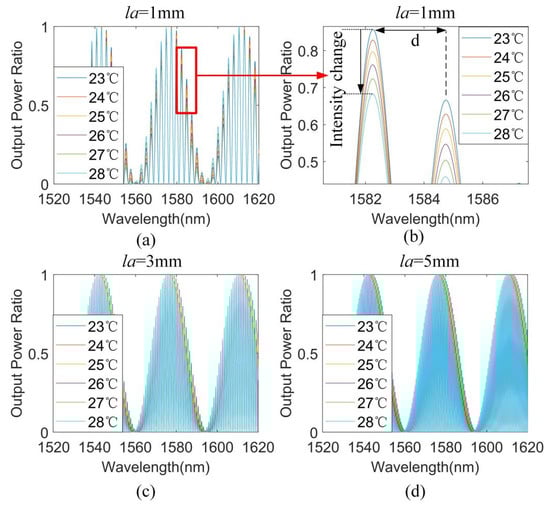
Figure 4.
(a) Output spectra with OMCI arm difference la = 1 mm. (b) The detail of output spectra in (a). (c) Output spectra at OMCI arm difference la = 3 mm. (d) Output spectra at OMCI arm difference la = 5 mm.
Moreover, it can be seen from Figure 4 that the larger the interferometer arm difference, the shorter the distance d of the typical interference peaks in the envelope. d is only related to the optical path difference between the two arms of the interferometer (d = λ1*λ2/2/n1/la, where n1 is the RI of the fiber core, and λ1, λ2 are the wavelength corresponding to the typical interference peak). When the ambient temperature changes, the two arms of the interferometer will also be affected by the thermo-optic effect and thermal expansion effect. Then the core RI n1 changes to Δn1, and the arm difference la changes to Δla, which change the phase of the interference signal, that is, the interference peak spacing d changes. Therefore, in theory, temperature sensing can also be achieved by tracking the interference peak spacing in the envelope. The temperature sensitivity corresponding to the change of the interferometric peak spacing can be expressed as:
where Ctec = 1.178 × 10⁻⁵/°C is the thermal expansion coefficient of the optical fiber, Ctoc = 5.5 × 10⁻⁷/°C is the thermo-optic coefficient of the optical fiber [23], and L1, L2 are the lengths of the two arms of the interferometer. Figure 4b shows a partial detail of the output interference with temperature increasing and the OMCI arm difference is 1 mm. It can be seen from the result that the interference peak spacing does not change significantly, but only the peak value changes when the ambient temperature changing. Under the small arm difference, the phase change of the interferometer caused by changing temperature is very limited. Therefore, waist region of OMC plays a leading role in the sensing function of OMCI. It should be noted that higher precision temperature sensing can be achieved by monitoring the intensity change of the interference peak. This can provide means and data analysis ideas for accurate self-calibration of temperature sensing. The temperature sensitivity of the intensity change in Figure 4b (at wavelength of 1582.3 nm) is about −0.45 db/°C.
Because of the little value of thermo-optic coefficient and thermal expansion coefficient on conventional SMF. While the OMCI with large initial arm difference can improve the temperature response capability of the interferometer. When the initial arm difference la = 20 mm, by monitoring the interference peak spacing d, the temperature response sensitivity of the sensor is about ST-Δd = 0.1 pm/°C.
It is worth noting that the interference peaks will be very dense when the initial arm difference la of OMCI is large. In practical applications, higher precision spectral demodulation equipment is required to ensure that the signal is not distorted. In addition, the large interferometer arm difference will also bring some problems such as the vibration noise, and increase the burden on the sensor package design. When the initial arm difference of OMCI is relatively small (less than 3 mm), the interference peaks in the envelope will become sparse (as shown in Figure 4a). In this case, tracking the envelope dip drift for temperature sensing will produce a large test error. Therefore, in the application of OMCI in temperature sensing, it is more appropriate to choose equal arm or control the arm difference within the range of 5–20 mm, which is easier to implement in the actual production of OMCI.
For using the interferometer unit in temperature sensing, a special optical fiber with a larger thermal-optical coefficient and a larger thermal expansion coefficient can be selected to manufacture the interferometer. For example, by improving the sensor structure, the arm of interferometer L2 was replaced with plastic optical fiber (Ctoc = 1.3 × 10⁻⁴/°C, Ctec = 8 × 10⁻⁵/°C [24]), then the temperature response of the interferometer can be greatly increased. When conventional SMF and plastic optical fiber are respectively applied to the two arms of OMCI, and set L1 = 20 m, L2 = 20.02 m, the temperature response sensitivity of the interferometer is about ST-Δd = 7 pm/°C, the simulation result is shown in Figure 5.
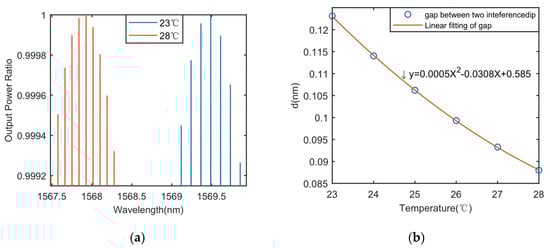
Figure 5.
(a) Detail of the improved sensor output spectra. (b) Relationship between interference peak distance and temperature after improved device.
In summary, if the OMCI interferometer is selected as the sensing unit, a certain temperature sensitization method needs to be adopted. For example, when the initial arm difference is appropriately increased, utilizing a special optical fiber with high thermal expansion coefficient and thermal optical coefficient. Furthermore, we can also refer to the structure of the interference type optical fiber hydrophone, an object with a high thermal expansion coefficient is wrapped by one arm of the interferometer to improve the temperature sensitivity.
3.2. Temperature Self-Calibration and Demodulation Optimization
It can be seen from the foregoing analysis that OMCI is a hybrid device. After the optimized design, both the OMC and the interferometer part can be used as a sensing unit to respond to change of ambient temperature. For the majority of fiber optic sensors, there is a cross-sensitive problem (the same sensor can be sensitive to different parameters). How to realize cross-sensitive demodulation becomes an urgent problem to be solved in the practical design of optical fiber sensors. It can be seen from the research results [15] that OMC can respond to changes in seawater temperature, salinity, and depth at the same time. To achieve the synchronous and accurate demodulation of these three parameters, the inversion operation of the sensitivity matrix is needed to be solved. That is, getting three or more characteristic wavelengths (peak and dip) in the output spectrum by optimizing the design of the OMC structure, then tracking the three characteristic wavelengths to calibrate the response sensitivity of salinity, temperature, and pressure, finally, the cross sensitivity matrix is obtained:
It can be seen from the above decoupling scheme of cross-sensitivity that the key to realizing high precision three-parameter demodulation lies in the construction of the sensitivity matrix database, and realization of three dimensional matrix high-precision operations. In practical applications, there are problems such as difficulty in calibration, and the large amount of calculation data.
The OMCI designed and manufactured in this article is provided with two temperature sensing response units: One is waist region, and the other is two arms of interferometer. If the two arms of OMCI are sealed in a thermally conductive metal cabin, and waist region is placed in a seawater compartment, the two arms of interferometer will only respond to changes of seawater temperature, while waist region can simultaneously respond to changes of seawater temperature, salinity, and depth. The foregoing analysis shows that the temperature effect of the OMCI interferometer can be achieved by tracking the interference peak distance d, and d is only controlled by the phase difference of the interferometer (only be adjusted to the optical path difference of the two arms of the interferometer). Therefore, by making full use of the temperature response capability of the two arms of interferometer, the temperature sensing sensitivity can be settled separately, that is, the ST can be calibrated by ST-Δd so as to achieve self-calibration. If the seawater temperature response is used as a known parameter, the three-parameter cross-sensitivity inversion operation reduced from three dimensional to two dimensional, as shown in Equation (7).
Therefore, by means of the above sensor design ideas and demodulation schemes, it will greatly simplify the calculation and data processing difficulty of OMCI salinity–temperature–depth three parameter sensing demodulation, and also reduce the aliasing error of wavelength drift in multi-parameter sensing.
4. Experiment Set up and Results
In order to fully verify the foregoing theoretical analysis results, this paper have accomplished an experimental test of the seawater temperature sensing performance of OMCI. The experiment measurement system is shown in Figure 6a, in concluding ASE broadband source (1528~1603nm), optical spectrum analyzer (OSA, 600–1700 nm, resolution 0.01 nm, Q8384, ADVANTEST, Tokyo, Japan), conductivity meter (HS-15 TW, Leici, Shanghai, China), temperature control water tank (KQ2200DE, Kunshan Ultrasonic Instruments, Kunshan, Jiangsu, China), and signal processing computer. The ASE light source is connected to the port1 of OMCI, and the spectrum analyzer is connected to the port2 of OMCI. In this work, the OMCI sample 1 was selected first, whose structural parameters are waist length L = 7 mm, the uniform waist radius r = 1.55 μm and the initial arm difference of interferometer la ≈ 6 mm. From the foregoing theoretical analysis, it can be known that the temperature response capability of the interferometer sensing unit is expected to be limited, because the interferometer is fabricated by conventional silica glass optical fiber. With this structural parameter, OMC will become the main sensing unit of OMCI.
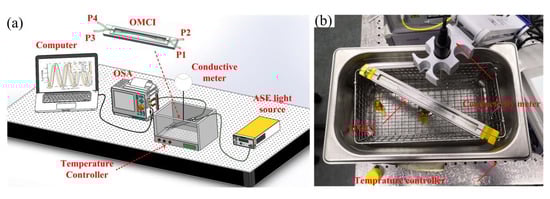
Figure 6.
(a) Schematic of the experiment setup for measurement of temperature in seawater. (b) The temperature measuring experimental setup.
The practical temperature measuring experimental setup is shown in Figure 6b. In the temperature experiment, seawater sample was made from pure water and NaCl, the initial salinity of the seawater sample was 12.2‰, and the water tank capacity was about 2L. In order to avoid the error caused by the uneven heating of seawater during the experiment, the temperature response experiment was carried out in the way of cooling. the seawater sample was heated to 35.3 °C, then cool it naturally to 22.3 °C. Meanwhile, the temperature and the salinity of the seawater sample is measured by a conductivity meter in real time. The effect of test errors caused by changes in seawater temperature that may cause the salinity vary has been eliminated. The output spectra at different temperatures are shown in Figure 7a. It can be clearly seen that the spectrum shift to short wavelength significantly with the increasing temperature and the insertion loss of simple1 is approximately 3db. The temperature response sensitivity of OMCI is obtained by tracking the characteristic wavelength dip at different temperatures. The calculation and fitting results are shown in Figure 7b, when the microfiber waist radius r = 1.55 μm, the temperature sensitivity response of the four characteristic wavelengths are ST-dip1 = −811.2 pm/°C, ST-dip2 = −860.5 pm/°C, ST-dip3 = −815.0 pm/°C, ST-dip4 = −678.0 pm/°C. The minimum dynamic range of dip3 wavelength is 14.3 nm, and the allowable temperature variation range is 17.6 °C.
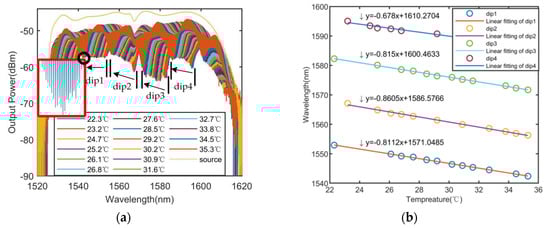
Figure 7.
(a) Output spectra of OMCI sample 1 with l = 7 mm, r = 1.55 μm, la = 6 mm at different temperatures. (b) Relationships between the dip wavelengths drift and the temperatures.
The previous simulation results show that the OMC is the main sensing unit, and the main parameter that affects the temperature sensitivity of OMCI is the radius of the microfiber at the waist region. In order to verify this characteristic, an OMCI sample (arm difference la ≈ 5 mm) was re-made to experiment the temperature sensing response. A new OMC sample with a relatively thinner waist radius was used, r = 1.45 μm, and keeping the waist length L = 7 mm unchanged, the output spectra at different temperatures are shown in Figure 8a. It can be found that the insertion loss of simple 2 is approximately 2 db and there are more dips than the previous sample in the output spectrum. The temperature response sensitivity of OMCI is obtained by tracking the characteristic wavelength dip at different temperatures. The calculation and fitting results are shown in Figure 8b. When the microfiber waist radius is r = 1.45 μm, the temperature sensitivity response of the five characteristic wavelengths are ST-dip1 = −993.3 pm/°C, ST-dip2 = −1007.4 pm/°C, ST-dip3 = −933.1 pm/°C, ST-dip4 = −963.2 pm/°C, and ST-dip5 = −950.4 pm/°C. The minimum dynamic range of dip 2 wavelength is 17.7 nm, and the allowable temperature variation range is 17.6 °C. Under the condition of the 0.01 nm resolution of the OSA, the temperature resolution of the this OMCI sample is less than 0.01 °C, reaching the performance of current mainstream commercial CTD [25].
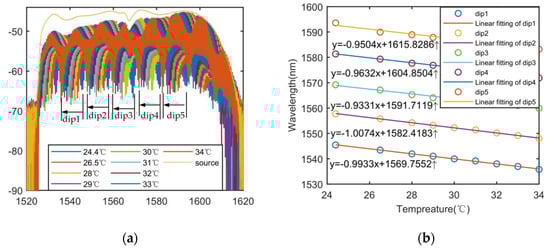
Figure 8.
(a) Output spectra of OMCI sample 2 at different temperatures with l = 7 mm, r = 1.45 μm, la = 6 mm. (b) Relationships between the dip wavelengths drift and the temperatures.
Experimental results verify that the sensitivity can be improved by reducing the radius r of the waist region. In addition, the above analysis shows that, the dynamic range is reduced with the increasing sensitivity, so there is a contradictory relationship between the sensitivity and the dynamic range. In practical applications, the sensor device parameters should be reasonably selected according to needs.
The sensing characteristics of OMC sensing unit conform to the aforementioned theoretical analysis. Due to the OMCI sample is made of ordinary single-mode optical fiber. From the foregoing analysis, it can be seen that the temperature sensitivity of the interferometer of this experimental sample is less than 0.1 pm/°C, and the highest resolution of the OSA used in the experiment is 10 pm, so the interference variation cannot be detected. In practical applications, we can use the higher precision OSA for demodulating signal, or optimize the structure (such as using special optical fibers) to increase the temperature response of the interferometer arm difference.
Compared with the structures of OMC and OMC-sagnac loop, the temperature sensing sensitivity of the OMCI structure designed in this paper is similar. However, this structure enriches the temperature sensing demodulation scheme. It is able to realize the temperature self-correction function, and reduce the difficulty of multi-parameter demodulation of the sensor in theoretically. In addition, the structure is more compact and easy to manufacture and package.
5. Conclusions
In summary, a novel seawater temperature sensor with two sensing regions based on the structure of optic microfiber coupler interferometer is proposed in this paper. The transmission characteristics of OMCI and the seawater temperature sensing characteristics are theoretically analyzed. Research results show that the device can perform temperature demodulation in 3 ways: Firstly, using a broad-spectrum light source as the input light, a large temperature dynamic range demodulation can be achieved by tracking the characteristic wavelength shift of the output spectra; secondly, the temperature demodulation can also be achieved by tracking the change of the interference peak spacing; lastly, using a narrow-line light source as the input light, a higher temperature resolution can be demodulated by monitoring the output intensity.
The sensing performance of OMCI can be flexibly adjusted by optimizing the structure of OMC. For example, the number of characteristic wavelengths (dip and peak) in the OMCI output spectrum can be adjusted be changing the OMC uniform waist length, thereby, the multi-parameter sensing demodulation is achieved. Moreover, sensor sensitivity can be improved by decreasing the OMC waist radius. Making use of the response of the interferometer sensor arm to temperature, the temperature self-calibration function in multi-parameter sensing can be realized by designing specific package, which reduces the difficulty of multi-parameter demodulation.
The seawater temperature sensing experiment is conducted to verify the sensing function and characteristics of OMCI. When the microfiber waist radius are 1.55 μm and 1.45 μm, the maximum temperature sensitivity reaches 860.5 pm/°C and 1007.4 pm/°C, respectively. The experimental results are in accordance with theoretical simulation. This study has laid the theoretical and technical foundation work for the development and practical development of marine environment monitoring sensors. It is foreseeable that marine environment parameter sensors based on OMCI will play an important application role in the fields of ocean environment monitoring and geophysical exploration.
Author Contributions
Conceptualization, L.Z. and Y.Y.; methodology, J.W.; validation, L.Z., Y.T. and L.C.; formal analysis, L.Z. and H.H.; investigation, Y.Y.; resources, J.W. and J.Y.; writing—original draft preparation, L.Z.; writing—review and editing, Y.Y. and H.H.; supervision, Z.Z. (Zhenrong Zhang); project administration, Z.Z. (Zhenfu Zhang); funding acquisition, Z.Z. (Zhenrong Zhang). All authors have read and agreed to the published version of the manuscript.
Funding
This work was supported by the National Key R&D Program of China (2017YFB0405503), the National Natural Science Foundation of China (No. 61805278, 61605249, 61661004), Guangxi Science Foundation (2017GXNSFAA198227), the Equipment Pre-Research Field Foundation (61404140304) and the China Postdoctoral Science Foundation (2018M633704).
Acknowledgments
The authors would like to thank the support of the laboratory and university.
Conflicts of Interest
The authors declare no conflict of interest.
References
- Sadekov, A.; Eggins, S.M.; De Deckker, P.; Ninnemann, U.; Kuhnt, W.; Bassinot, F. Surface and subsurface seawater temperature reconstruction using Mg/Ca microanalysis of planktonic foraminifera Globigerinoides ruber, Globigerinoides sacculifer, and Pulleniatina obliquiloculata. Paleoceanography 2009, 24, 1–17. [Google Scholar] [CrossRef]
- Ahmad, H.; Jasim, A.A. Fabrication and Characterization of 2 × 2 Microfiber Coupler for Generating Two Output Stable Multiwavelength Fiber Lasers. J. Light. Technol. 2017, 35, 4227–4233. [Google Scholar] [CrossRef]
- Jung, Y.; Brambilla, G.; Richardson, D.J. Optical microfiber coupler for broadband single-mode operation. Opt. Express 2009, 17, 5273. [Google Scholar] [CrossRef]
- Gafsi, R.; Lecoy, P.; Malki, A. Stress optical fiber sensor using light coupling between two laterally fused multimode optical fibers. Appl. Opt. 1998, 37, 3417. [Google Scholar] [CrossRef]
- Bo, L.; Wang, P.; Semenova, Y.; Farrell, G. High sensitivity fiber refractometer based on an optical microfiber coupler. IEEE Photonics Technol. Lett. 2013, 25, 228–230. [Google Scholar] [CrossRef]
- Zhang, Q.; Lei, J.; Cheng, B.; Song, Y.; Hua, L.; Xiao, H. A Microfiber Half Coupler for Refractive Index Sensing. IEEE Photonics Technol. Lett. 2017, 29, 1525–1528. [Google Scholar] [CrossRef]
- Pu, S.; Luo, L.; Tang, J.; Mao, L.; Zeng, X. Ultrasensitive Refractive-Index Sensors Based on Tapered Fiber Coupler with Sagnac Loop. IEEE Photonics Technol. Lett. 2016, 28, 1073–1076. [Google Scholar] [CrossRef]
- Li, K.; Zhang, N.; Zhang, N.M.Y.; Liu, G.; Zhang, T.; Wei, L. Ultrasensitive measurement of gas refractive index using an optical nanofiber coupler. Opt. Lett. 2018, 43, 679. [Google Scholar] [CrossRef]
- Wei, F.; Mallik, A.K.; Liu, D.; Wu, Q.; Peng, G.D.; Farrell, G.; Semenova, Y. Magnetic field sensor based on a combination of a microfiber coupler covered with magnetic fluid and a Sagnac loop. Sci. Rep. 2017, 7, 1–9. [Google Scholar] [CrossRef]
- Pu, S.; Mao, L.; Yao, T.; Gu, J.; Lahoubi, M.; Zeng, X. Microfiber Coupling Structures for Magnetic Field Sensing with Enhanced Sensitivity. IEEE Sens. J. 2017, 17, 5857–5861. [Google Scholar] [CrossRef]
- Yan, S.; Liu, Z.; Li, C.; Ge, S.; Xu, F.; Lu, Y. “Hot-wire” microfluidic flowmeter based on a microfiber coupler. Opt. Lett. 2016, 41, 5680. [Google Scholar] [CrossRef] [PubMed]
- Chen, R.; Bradshaw, T.; Badcock, R.; Cole, P.; Jarman, P.; Pedder, D.; Fernando, G.F. Linear location of acoustic emission using a pair of novel fibre optic sensors. J. Phys. Conf. Ser. 2005, 15, 232–236. [Google Scholar] [CrossRef]
- Wang, L.; Liu, Y.; Fu, W.; Li, F.; Zhao, Z.; Yu, K. Source location using an optimized microfiber coupler sensor based on modal acoustic emission method. Struct. Control Heal. Monit. 2017, 24, 1–10. [Google Scholar]
- Wang, S.; Liao, Y.; Yang, H.; Wang, X.; Wang, J. Modeling seawater salinity and temperature sensing based on directional coupler assembled by polyimide-coated micro/nanofibers. Appl. Opt. 2015, 54, 10283. [Google Scholar] [CrossRef] [PubMed]
- Wang, S.; Yang, H.; Liao, Y.; Wang, X.; Wang, J. High-Sensitivity Salinity and Temperature Sensing in Seawater Based on a Microfiber Directional Coupler. IEEE Photonics J. 2016, 8, 1–9. [Google Scholar] [CrossRef]
- Yu, Y.; Bian, Q.; Lu, Y.; Zhang, X.; Yang, J.; Liang, L. High Sensitivity All Optical Fiber Conductivity-Temperature-Depth (CTD) Sensing Based on an Optical Microfiber Coupler (OMC). J. Light. Technol. 2019, 37, 2739–2747. [Google Scholar] [CrossRef]
- Cao, L.; Yu, Y.; Xiao, M.; Yang, J. High sensitivity conductivity-temperature-depth sensing based on an optical microfiber coupler combined fiber loop. Chinese Opt. Lett. 2020, 2020. 18, 011202. [Google Scholar] [CrossRef]
- Yang Yu, Y.Y.; Qiang Bian, Q.B.; Nan Zhang, N.Z.; Yang Lu, Y.L.; Xueliang Zhang, X.Z.; Junbo Yang, J.Y. Investigation on an all-optical intensity modulator based on an optical microfiber coupler. Chinese Opt. Lett. 2018, 16, 040605. [Google Scholar] [CrossRef]
- Yu, Y.; Zhang, X.; Song, Z.; Wang, J.; Meng, Z. Precise control of the optical microfiber tapering process based on monitoring of intermodal interference. Appl. Opt. 2014, 53, 8222. [Google Scholar] [CrossRef]
- Kersey, A.D.; Marrone, M.J.; Davis, M.A. Polarisation-insensitive fibre optic michelson interferometer. Electron. Lett. 1991, 27, 518–520. [Google Scholar] [CrossRef]
- Zhao, L.; Zhang, Y.; Wang, J.; Chen, Y. Highly sensitive temperature sensor based on an isopropanol- sealed optical microfiber coupler. Appl. Phys. Lett. 2018, 113. [Google Scholar] [CrossRef]
- Birks, T.A.; Li, Y.W. The Shape of Fiber Tapers. J. Light. Technol. 1992, 10, 432–438. [Google Scholar] [CrossRef]
- Yang, N.; Qiu, Q.; Su, J.; Shi, S.J. Research on the temperature characteristics of optical fiber refractive index. Optik (Stuttg) 2014, 125, 5813–5815. [Google Scholar] [CrossRef]
- Zhang, Z.; Zhao, P.; Lin, P.; Sun, F. Thermo-optic coefficients of polymers for optical waveguide applications. Polymer (Guildf) 2006, 47, 4893–4896. [Google Scholar] [CrossRef]
- Teilmann, J.; Agersted, M.D.; Heide-Jørgensen, M.P. A comparison of CTD satellite-linked tags for large cetaceans-Bowhead whales as real-time autonomous sampling platforms. Deep Sea Res. Part I Oceanogr. Res. Pap. 2020, 157, 103213. [Google Scholar] [CrossRef]
© 2020 by the authors. Licensee MDPI, Basel, Switzerland. This article is an open access article distributed under the terms and conditions of the Creative Commons Attribution (CC BY) license (http://creativecommons.org/licenses/by/4.0/).