Article

An Auditory-Perceptual and Pupillometric Study of Vocal Strain and Listening Effort in Adductor Spasmodic Dysphonia

1
Faculty of Health Sciences, The University of Western Ontario, London, ON N6A 3K7, Canada
2
Department of Electrical & Computer Engineering, The University of Western Ontario, London, ON N6A 3K7, Canada
3
Department of Psychology & Brain and Mind Institute, The University of Western Ontario, London, ON N6A 3K7, Canada
4
Rotman Research Institute, Baycrest Health Sciences, Toronto, ON M6A 2E1, Canada
5
Department of Psychology, University of Toronto, Toronto, ON M5S 3G3, Canada
6
School of Biomedical Engineering, McMaster University, Hamilton, ON L8S 4L8, Canada
7
Department of Otolaryngology—Head and Neck Surgery, Stanford University School of Medicine, Stanford, CA 94305, USA
*
Authors to whom correspondence should be addressed.
Appl. Sci. 2020, 10(17), 5907; https://doi.org/10.3390/app10175907
Submission received: 13 July 2020 / Revised: 13 August 2020 / Accepted: 17 August 2020 / Published: 26 August 2020

Abstract

:
This study evaluated ratings of vocal strain and perceived listening effort by normal hearing participants while listening to speech samples produced by talkers with adductor spasmodic dysphonia (AdSD). In addition, objective listening effort was measured through concurrent pupillometry to determine whether listening to disordered voices changed arousal as a result of emotional state or cognitive load. Recordings of the second sentence of the “Rainbow Passage” produced by talkers with varying degrees of AdSD served as speech stimuli. Twenty naïve young adult listeners perceptually evaluated these stimuli on the dimensions of vocal strain and listening effort using two separate visual analogue scales. While making the auditory-perceptual judgments, listeners’ pupil characteristics were objectively measured in synchrony with the presentation of each voice stimulus. Data analyses revealed moderate-to-high inter- and intra-rater reliability. A significant positive correlation was found between the ratings of vocal strain and listening effort. In addition, listeners displayed greater peak pupil dilation (PPD) when listening to more strained and effortful voice samples. Findings from this study suggest that when combined with an auditory-perceptual task, non-volitional physiologic changes in pupil response may serve as an indicator of listening and cognitive effort or arousal.

1. Introduction

Dysphonia describes an impairment of the speaking voice [1] which may occur due to a variety of reasons including those secondary to neurological disorders of the central or peripheral nervous system. Spasmodic dysphonia is a neurogenic voice disorder characterized by sudden, involuntary spasms of laryngeal musculature, either adductory, abductory, or in combination. Adductor spasmodic dysphonia (AdSD) is the most common diagnostic subtype which involves abnormal adduction of the vocal folds during voicing that may result in intermittent phonatory breaks that negatively impact the perceived voice quality [2]. The speech produced by those with AdSD can be intelligible but may still be poorly rated by listeners due to distracting auditory-perceptual features [3]. As such, evaluating the severity of AdSD and its impact on listeners’ perception are of significant clinical and research interest [3,4,5,6].
The process of voice evaluation is complex, multidimensional, and frequently comprises the use of aerodynamic, acoustic, and auditory-perceptual assessments. Because of the typical characteristics of AdSD, auditory-perceptual evaluation often provides the most important means of monitoring the response to treatment. The vocal feature of “strain”, defined as the listener’s perception of excessive vocal fold closure, best characterizes AdSD [5]. Vocal strain is measured both clinically and experimentally to assess AdSD severity and to monitor the success of treatment such as Botox® injections [3,6,7]. However, multiple factors can impact auditory-perceptual evaluations of vocal strain including the training level and/or experience of raters (naïve vs. experienced); choice of the stimuli (sustained vowels, sentences, or running speech); and/or evaluation procedures such as equal appearing interval (EAI), visual analog (VA), or direct magnitude estimation (DME) methods [8]. In addition, vocal strain does not capture the additional attention or cognitive “effort” expended by the listener when communicating with an AdSD talker. For this reason, attempts to assess demands from the perspective of listeners may enhance our understanding of the nature of AdSD and its influence on the listener.

1.1. Listening Effort

The success of communication depends on both the talker and listener [5]. Receptive or expressive impairments will alter the balance of responsibilities in any communication dyad. According to Johnsrude and Rodd [9], processing demands in a listening situation depend on the interaction between the degradation or distortion in the utterance and listeners’ own cognitive resource capacity. Therefore, as speech or voice deviates from normal expectation, increasing demand is placed on the listener which may subsequently require additional levels of cognitive processing. Communication success with dysphonic talkers may, therefore, be hampered as listeners may not wish to carry the enhanced load of processing and responding to such disordered speech [10,11]. This increased processing load on the listener has been defined with a variety of terms such as cognitive effort or cognitive load, effortful listening, listening effort, resourceful listening, and/or listening difficulty [9,12,13,14], with the term listening effort used in this paper.
Listening effort can be evaluated subjectively through ratings and self-report questionnaires and objectively through physiological measures [13]. Substantial literature exists on behavioural assessment of listening effort with degraded speech samples, challenging listening environments, and/or listener-specific factors (e.g., hearing loss) [9,13,15]. However, only a few studies have investigated the behavioral assessment of the effort required when listening to dysphonic speech samples. For example, Nagle and Eadie [14] obtained ratings of acceptability and listening effort from naïve listeners for tracheoesophageal speech samples. They reported a high degree of inter-rater reliability in listener effort ratings, and a very strong correlation between acceptability and listening effort ratings. In a subsequent study, Nagle and Eadie [16] collected intelligibility, acceptability, and listening effort ratings from naïve listeners for electrolarynx speech samples. Similar to their earlier study, strong correlations were found between intelligibility and listening effort ratings, as well as between acceptability and listening effort ratings. More interestingly, there was greater variability in listening effort ratings for speech samples with 50% or more intelligibility rating, indicating that some speech samples demand greater listening effort even though they are intelligible. To the best our knowledge, no studies have investigated the subjective evaluation of listening effort with AdSD speech samples.
For physiological assessment of listening effort, Pichora-Fuller et al. [13] identify two main categories. The first involves measures of brain activity such as magnetoencephalography (MEG), evoked-response potentials (ERPs), alpha power in electroencephalography (EEG), and functional magnetic resonance imaging (fMRI). These types of measures provide information regarding the timing and precise localization of cortical activity in response to stimuli. The second category of physiological measures for assessing listening effort includes those that quantify responses of the autonomic nervous system which involves both sympathetic and parasympathetic responses. For example, changes in pupil size, hormonal changes, skin conductance, and cardiac responses can be used as indices of one’s autonomic response [13]. This paper focuses on pupil dilation when listening to speech samples produced by AdSD talkers.

1.2. Pupillometry

Pupillometry refers to the measurement of pupil size which has been used in experimental psychology to evaluate memory processes, task performance dynamics, fluctuations in autonomic arousal and alertness, and attention studies [12,17]. Kramer et al. [12] reported task-evoked pupillary response to be a reliable, albeit indirect measure of cognitive processing load and reported it to be reflective of task demands and stimulus features in language processing tasks. Similarly, evidence exists that pupil size is sensitive to a variety of auditory stimuli, including elements such as syntactic complexity, speech intelligibility, type of background noise, and demands for divided attention [17]. In studies measuring listening effort, pupil size is recorded simultaneously with the presentation of auditory stimuli, such as speech, typically using infrared eye tracking technology [12].
With the potential obstacles in communication success and the increased load of processing disordered speech or perceptually evaluating abnormal voice qualities, pupillometry may serve as an additional tool for assessing the amount of effort normal hearing/speaking listeners expend during communication with dysphonic individuals [12,13,17,18]. Accordingly, it is of interest to measure listeners’ pupil dilation while listening to and perceptually rating dysphonic voices, so the link between objective and subjective measures can be examined. Therefore, this study was designed to evaluate the perception of the vocal feature of strain, as well as the perceived and objective listening effort (through pupil responses) associated with AdSD speech samples. More specifically, the following research questions were addressed in this study:
  • Do normal hearing adult listeners expend effort while listening to intelligible speech samples from talkers with different degrees of AdSD severity?
  • Is there a relationship between the auditory-perceptual ratings of vocal strain and listening effort for these AdSD talker samples?
  • What is the relationship between the pupillometric measures of listening effort and perceived vocal strain and listening effort ratings, when listeners are presented with AdSD speech samples?

2. Materials and Methods

2.1. Participants

Twenty neurologically and vocally typical adults (11 males, 9 females; age range = 18–29 years; mean: 22.75 years) participated in the current study. The number of recruited participants was based on a power analysis calculated using G*Power (Version 3.1, Heinrich-Heine-Universitat, Düsseldorf. Germany, 2007) with an effect size of 0.4. Each listener participated in a single listening session which required approximately 45 min (10–15 min for task instruction, instrumentation adjustment, and calibration, 7–10 min for the experimental protocol, 10-min break, and 7–10 min for the retest procedure). All participants were native English speakers with self-reported normal hearing. In addition, participants did not have professional background in speech-language pathology, were not formally exposed to or had education related to voice disorders and had not previously judged disordered speech or voice samples. We also excluded potential participants if they indicated use of medications which are pharmaceutically reported to influence pupil reactions (e.g., Levodopa). This was done by providing a list of medications to participants who could then exclude themselves accordingly if use occurred. This list was provided to potential participants along with the letter of information. Additionally, potential participants were also excluded if they reported an upper respiratory infection during the week prior to the date of the experiment.

2.2. Auditory Stimuli

Speech samples from 23 talkers (6 males, 17 females) with AdSD from an archive of the Voice Production and Perception Laboratory at the University of Western Ontario were used as stimuli for the current study. All talkers had been diagnosed with AdSD by a board-certified laryngologist. Speech samples were recorded using a professional quality cardioid condenser microphone (SHURE PG81) while they read the Rainbow Passage [19] in their typical voice. Once the passage was collected, the second sentence (“The rainbow is a division of white light into many beautiful colors.”) was extracted for use in the current study.
The experimental structure for each trial was as follows. Each trial began with the spoken cue “Please listen to the following stimulus”, and this preparatory stimulus was spoken by a normal speaking male adult. This cue lasted three seconds and indicated the impending onset of the stimulus to be judged. Upon cue presentation, one of the 23 sentences from the set of AdSD talkers was presented. One second after the sentence offset, the spoken sentence “Please indicate your ratings after the beep” instructed participants to begin rating strain and listening effort.

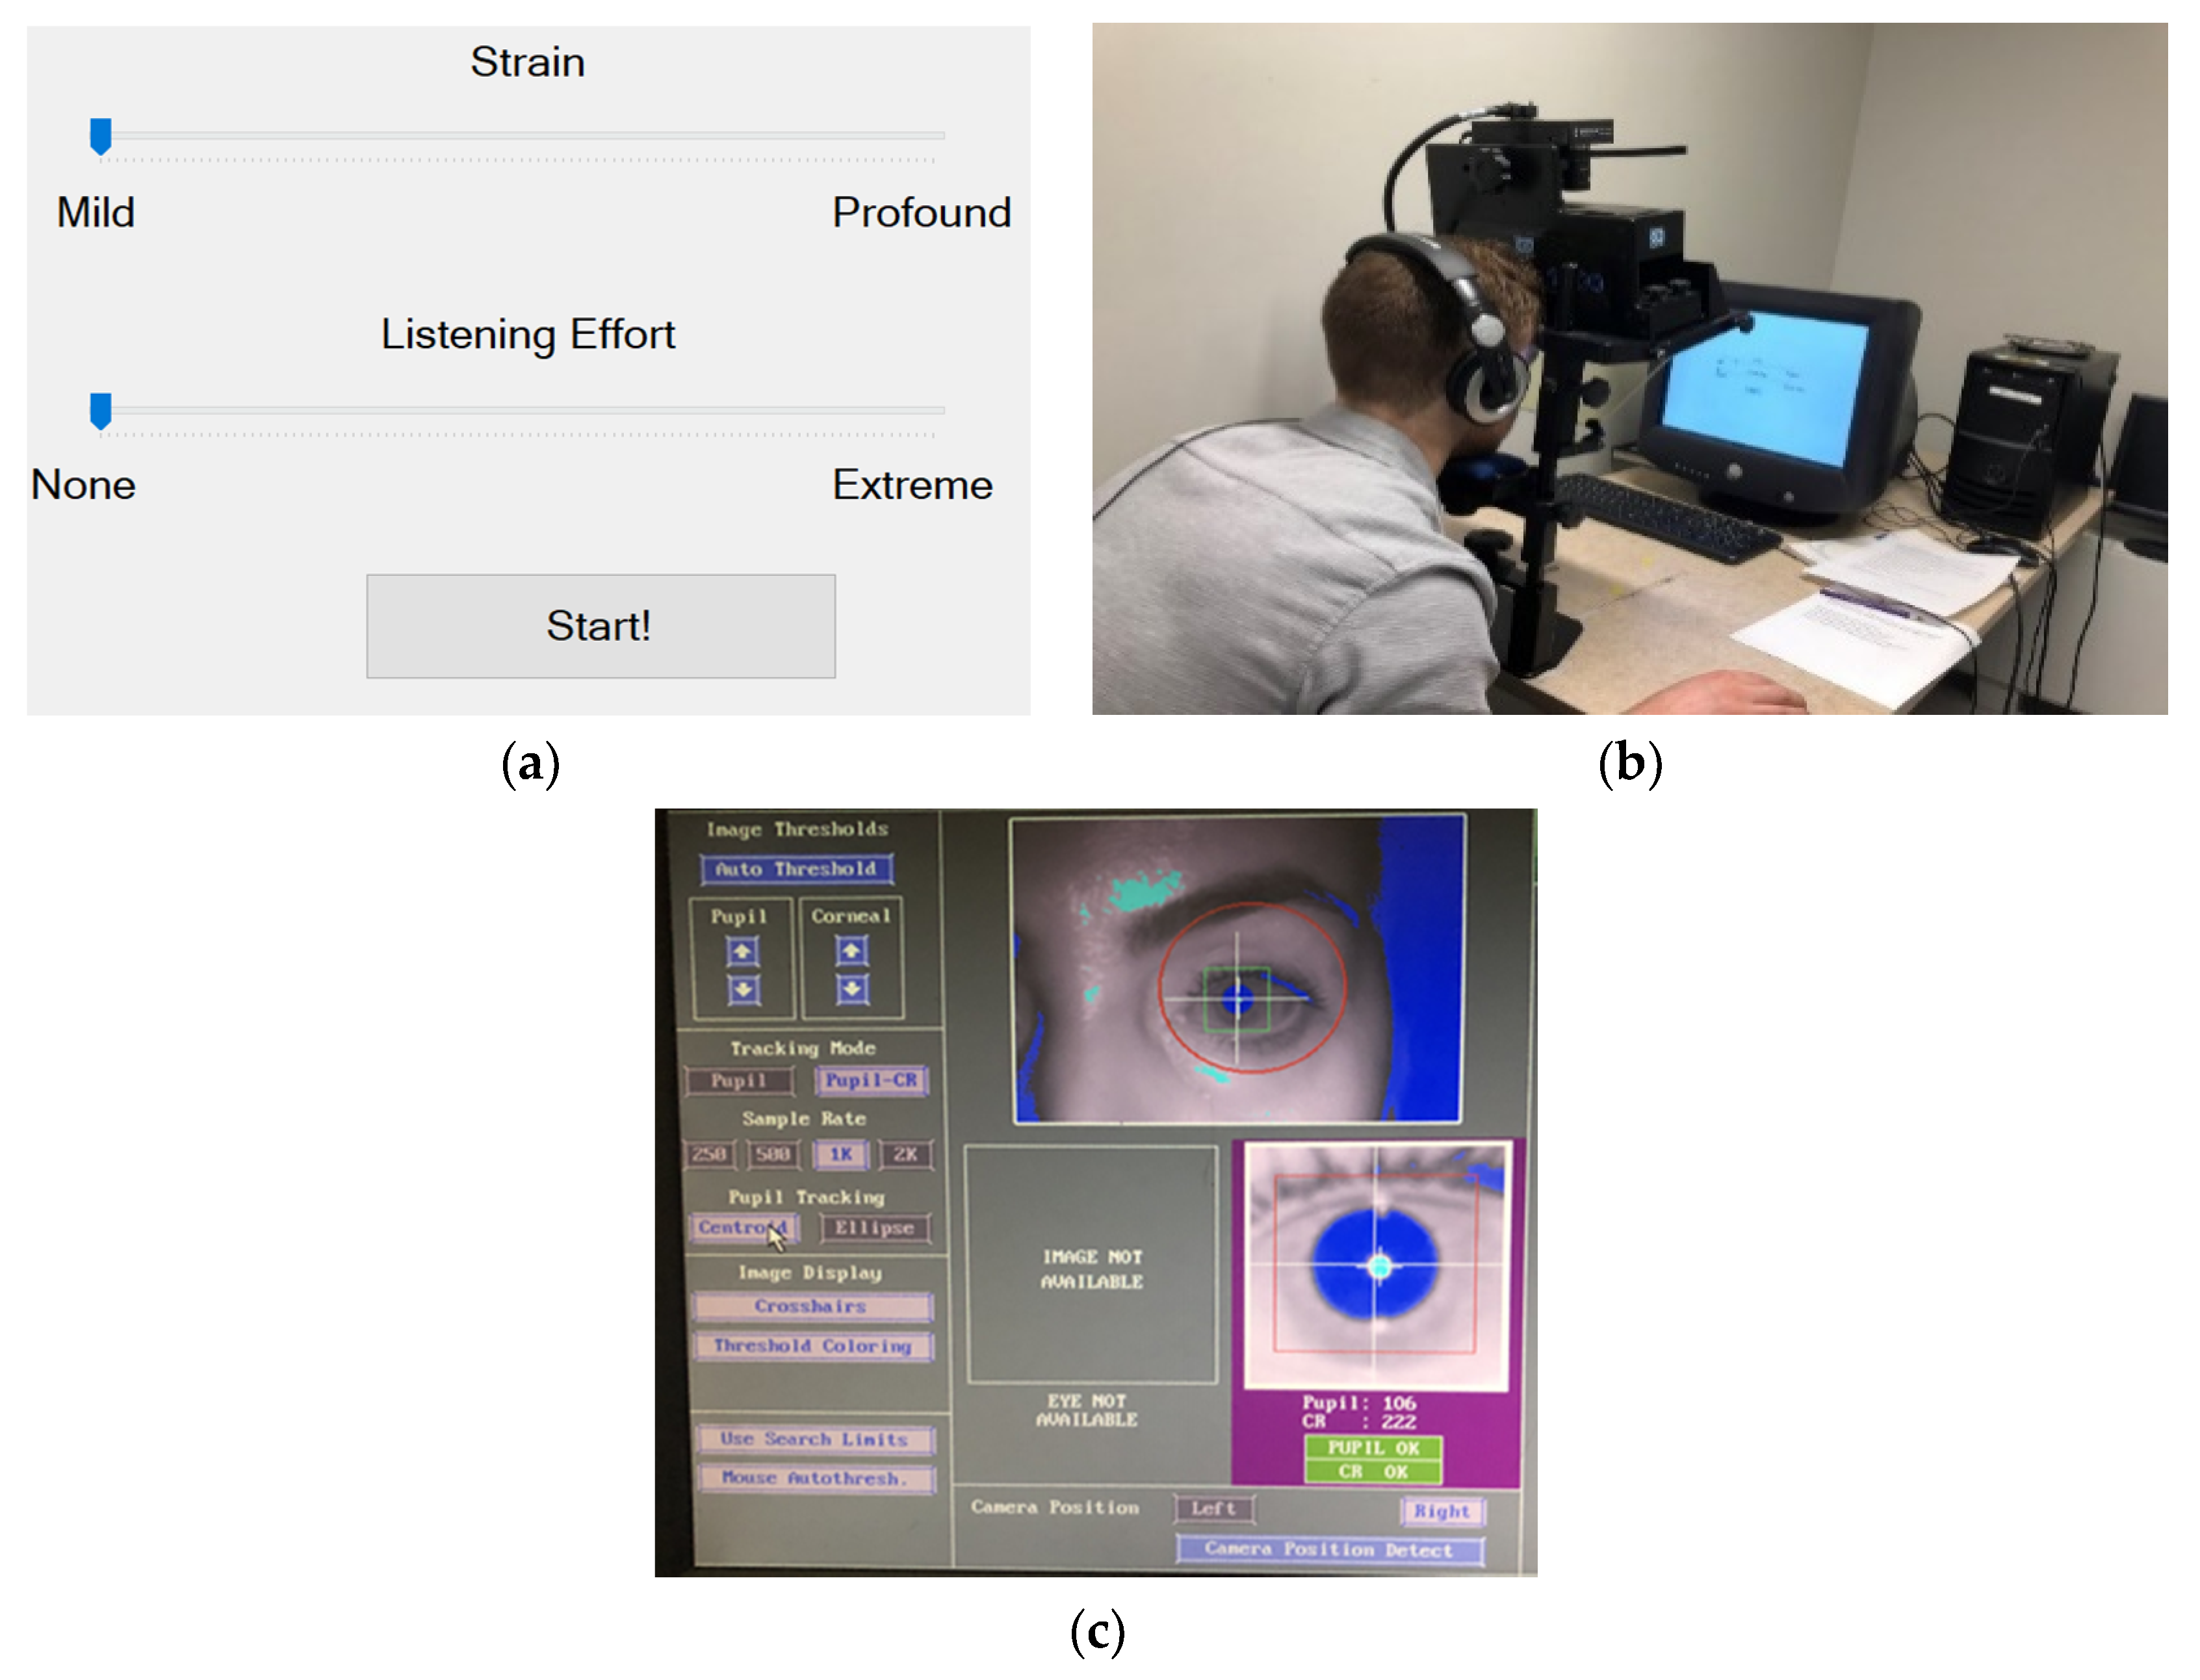
2.3. Assessment of Strain and Listening Effort

After the presentation of each sentence, listeners used two separate 100 mm long electronic sliders representing visual analog scales (Figure 1a) to rate first, how much strain they thought the talker exhibited and, second, how much effort they had to invest to comprehend the sentence. The end points of the slider for the feature of ‘strain’ was marked “mild” (value of 1) toward the left side of the scale and “profound” (value of 100) toward the right side. The end points of the slider for ‘listening effort’ indicated “none” (1) on the left and “extreme” (100) on the right. Listeners could move the slider handle and mark the scale at any point along the continuum where they thought it best indicated the degree of both strain and listening effort that represented the stimulus.

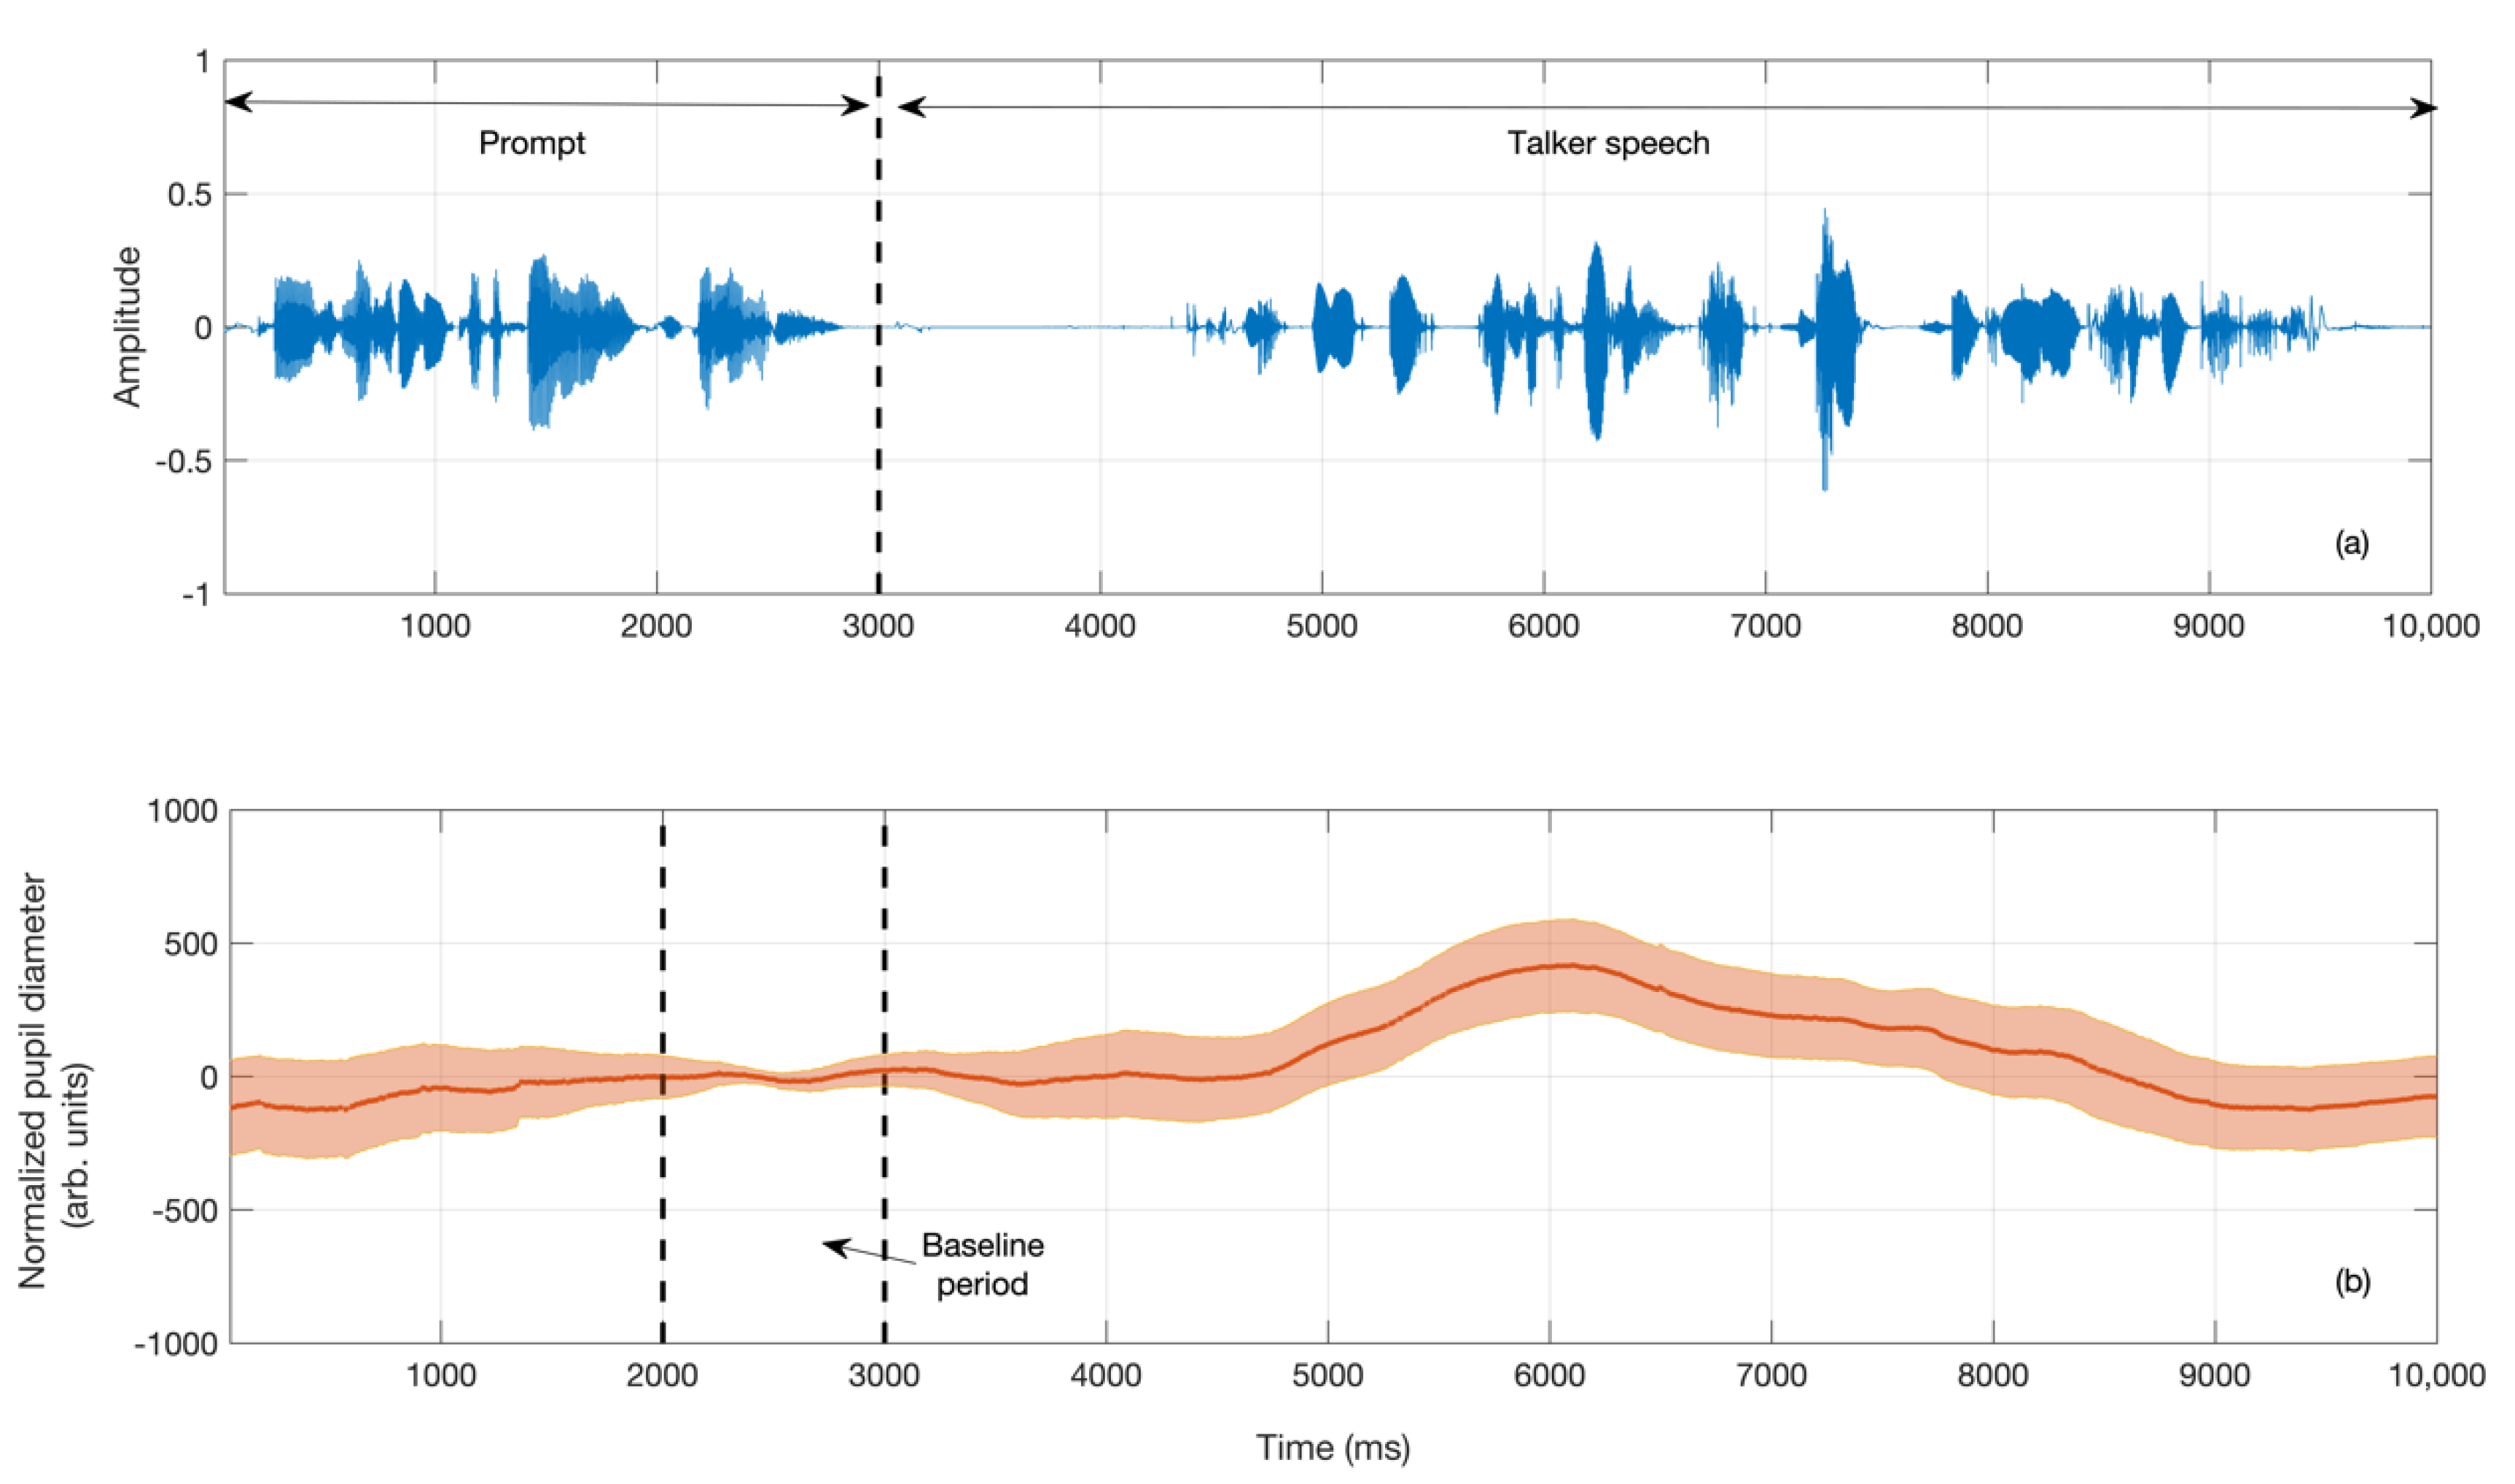
2.4. Pupillometry Data Recording

Pupil dilation for each participant was recorded continuously using an EyeLink 1000 (SR Research, Ottawa, ON, Canada) eye tracker (Figure 1b,c) in Western’s Brain and Mind Institute. Participants were seated comfortably on a stationary chair at the instrumental tower mount. The participant’s chin was positioned on a chin rest and their forehead placed against a forehead rest while they faced the monitor in front of them. The device collected the pupil responses of the right eye at a sampling rate of 1000 Hz.

2.5. Procedure

On the day of the experiment, participants sat in a softly lighted room. The light was consistent throughout the room to prevent reflexive dilation in reaction to changing luminance on the retina [20]. Each listener was individually familiarized with the tasks they would perform. Listeners were briefly trained about the voice dimensions of “strain” and “listening effort” and all were provided written definitions. Strain was explicitly defined to indicate the listener’s the perception of excessive vocal effort; listeners were asked if they understood the concept of strain relative to the laryngeal force that was exhibited in each talker’s sample. Listening effort was defined as the amount of cognitive work that was required while listening to the talker samples. The height and general positioning for each listener were adjusted to provide the best and most direct view of the pupils. Listeners were instructed not to move their head or body or to look down or away from the monitor at any point during the experiment. During the task, they were asked to maintain focus at the center of the monitor and were requested to avoid blinks as much as possible or at least try not to blink excessively when listening to the stimulus. Listeners were asked to wear headphones (Sennheiser HD 205, Wedemark, Germany) and self-adjust the volume to a comfortable listening level before beginning the experiment. Unless listeners are hearing-impaired or a given experimental task that seeks to address varied signal-to-noise ratios, the process of allowing normal-hearing listeners to adjust their own loudness level during auditory-perceptual experiments is common e.g., [16]. Thus, control of listening level was unnecessary in this study.
Once the optimum position was reached and the listeners were ready to proceed, calibration of the visual gaze and its validation was performed. During this task, listeners were asked to maintain visual focus on a fixation circle on the screen and to follow it when requested in order to calibrate the eye tracker. Upon obtaining satisfactory calibration and subsequent validation, the auditory-perceptual rating procedure was initiated by the experimenter. The talker stimuli were presented to listeners in randomized order. After listening to each stimulus until the beep, the listeners used the first computer slider to indicate their ratings of talker’s vocal strain and the second slider to indicate their own listening effort. Once the listener completed both ratings for a given stimulus, they clicked the “next” button to hear the next stimulus. Once all stimuli were rated, a message appeared on the screen indicating the end of the test. After the first rating procedure, each listener was given a 10-min break to rest and then the re-test phase of the experiment was undertaken in order to provide test and re-test measures for intra-rater reliability. To synchronize the pupil recordings with the presentation stimulus, markers were embedded into the pupil data stream at the start and end of the stimulus presentation (which included the preparatory and rating auditory prompts at the beginning and end, respectively).

3. Results

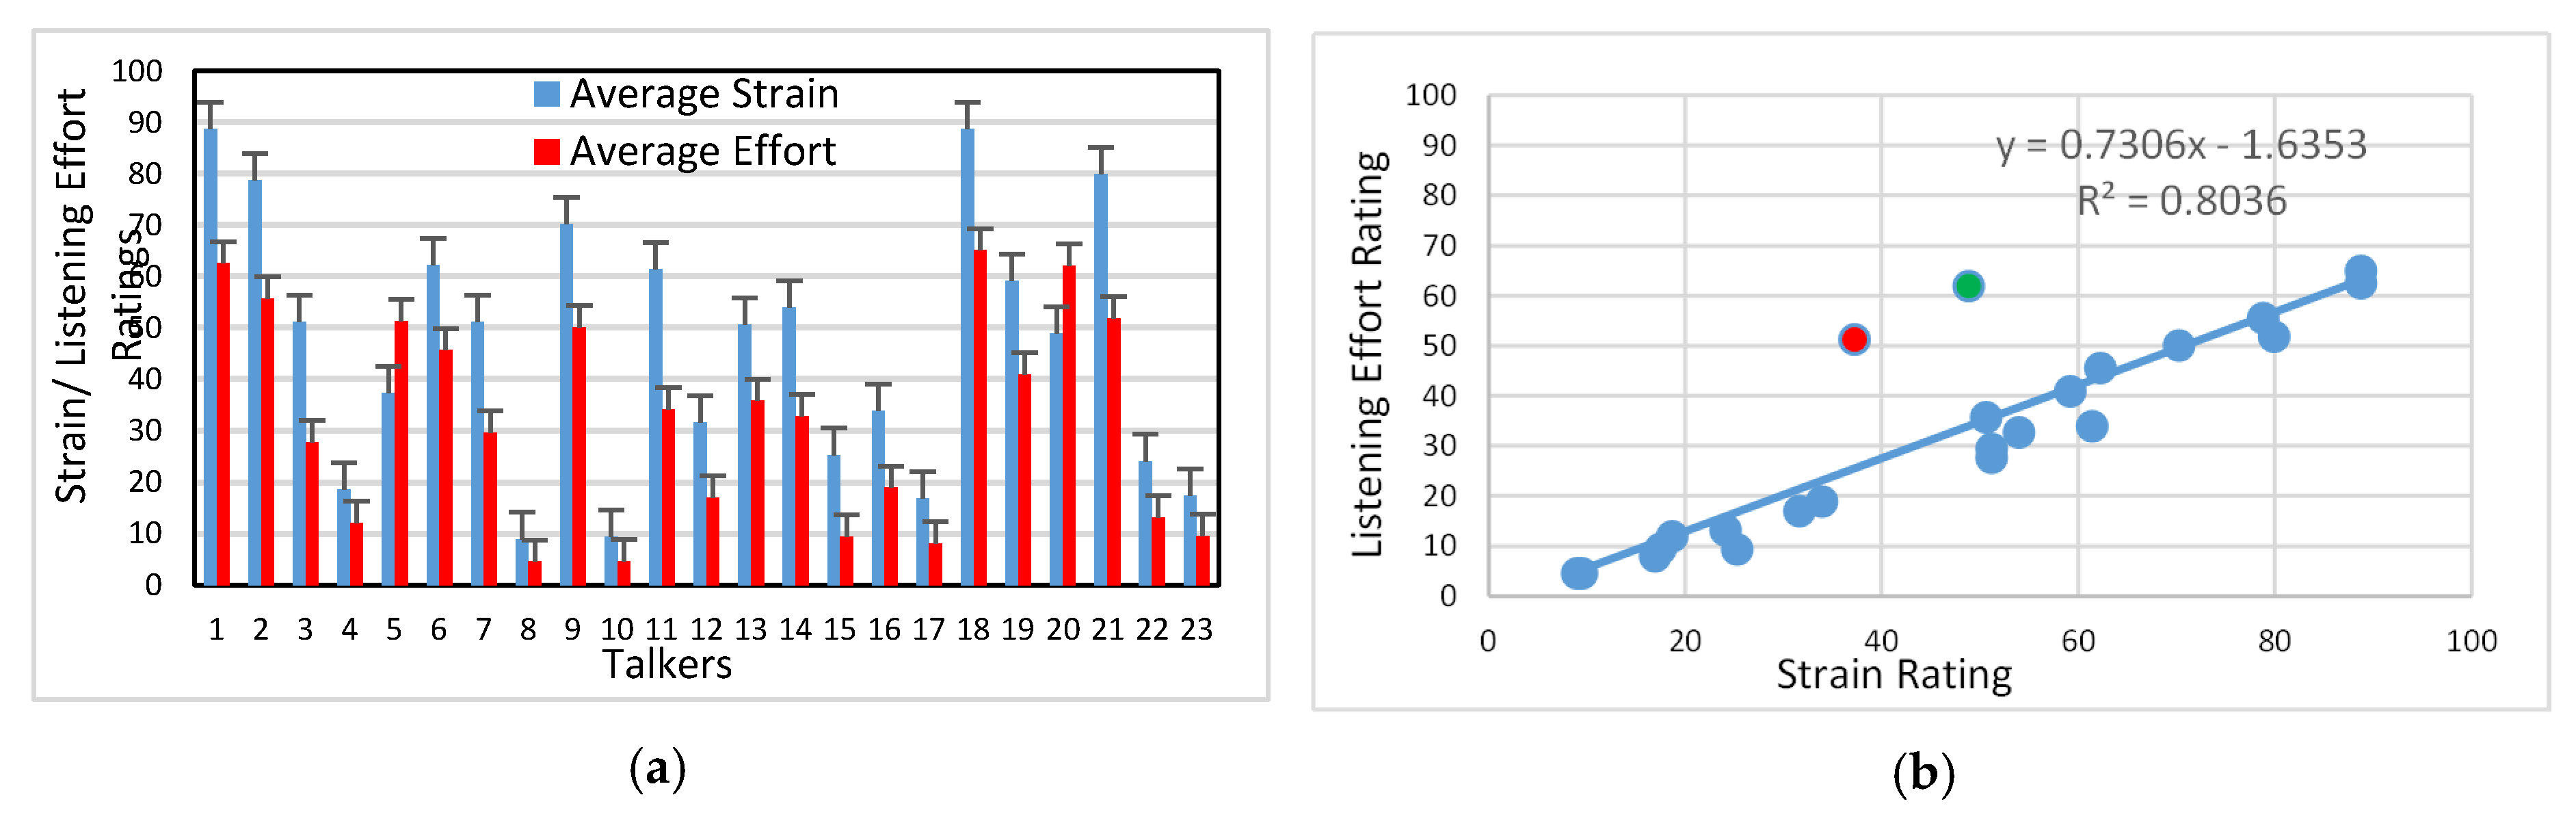
3.1. Auditory-Perceptual Data

Once all listeners had completed the experimental task, their ratings of strain and listening effort were first analyzed for reliability. Two sets (i.e., test and retest) of strain and listening effort ratings that could range between 1 and 100 were generated for each talker sample and listener. Intra-rater reliability for both strain and listening effort was obtained for each listener by computing the Pearson correlation coefficient between the test and retest session ratings across all talkers. These correlation values ranged from 0.56 to 0.96 for strain and from 0.58 and 0.90 for listening effort, indicating moderate-to-high intra-rater reliability. Interrater reliability was calculated separately with Cronbach’s α in SPSS (Version 24, IBM, Armonk, NY, USA, 2020) for each of the two rated features. The Cronbach’s α was 0.98 for strain and 0.97 for listening effort, indicating very high reliability among listeners for the rating tasks.
The strain and listening effort ratings for each AdSD talker were subsequently averaged across all listeners and the test-retest sessions. These averaged ratings along with their standard errors are displayed in Figure 2a. It can be seen from Figure 2a that Talkers 8 and 10 were rated to have the least and Talkers 1 and 18 were rated to exhibit the highest degrees of both perceived strain and effort. In addition, the strain and listening effort ratings appeared to vary in a similar pattern across talkers. This association is confirmed through the scatter plot shown in Figure 2b, where a linear regression fit to the strain–listening effort data accounted for 80% of the variance. In addition, linear mixed-effects models (LMMs) were developed to further probe the relationship between strain and listening effort. The LMMs were implemented using the R statistical software (v4.0.2, R Foundation for Statistical Computing, Vienna, Austria, 2020) using the nlme package. The basic LMM model included listening effort as the dependent variable, strain as the fixed effect, and the talker and listener variables as random effects. Results showed that strain was a significant predictor of listening effort (F (1, 298.71) = 184.04, p < 0.001), with a correlation of 0.53 (t (298.7087) = 13.566, p < 0.001). A more complex LMM model, which allowed different slope coefficients for each talker, revealed statistically similar results (x2 (1) = 0.244, p = 0.622). Thus, these results indicate a consistent relationship between the vocal strain and listening effort ratings.
A repeated measures ANOVA was conducted to statistically assess the effects of the auditory-perceptual features (i.e., vocal strain and listening effort), talkers, and any potential interaction between the features and talkers. The a priori significance level was set to 0.05 for all statistical tests, and the Greenhouse–Geisser correction was applied when sphericity condition was violated. Significant effects were found for the auditory-perceptual features (F (1, 19) = 37.13, p < 0.001, η p 2 = 0.662), and talkers (F (6.41, 121.73) = 72.08, p < 0.001, η p 2 = 0.791). In addition, a significant interaction between auditory-perceptual features and talkers was found (F (4.04, 76.66) = 12.88, p < 0.001, η p 2 = 0.404). Post-hoc comparisons using the Bonferroni correction revealed that Talkers 5 and 20 were rated differently on the auditory-perceptual features than the others. Unlike the rest of talkers, Talkers 5 (red data point, Figure 2b) and 20 (green data point, Figure 2b) had higher listening effort ratings relative to their corresponding strain ratings.

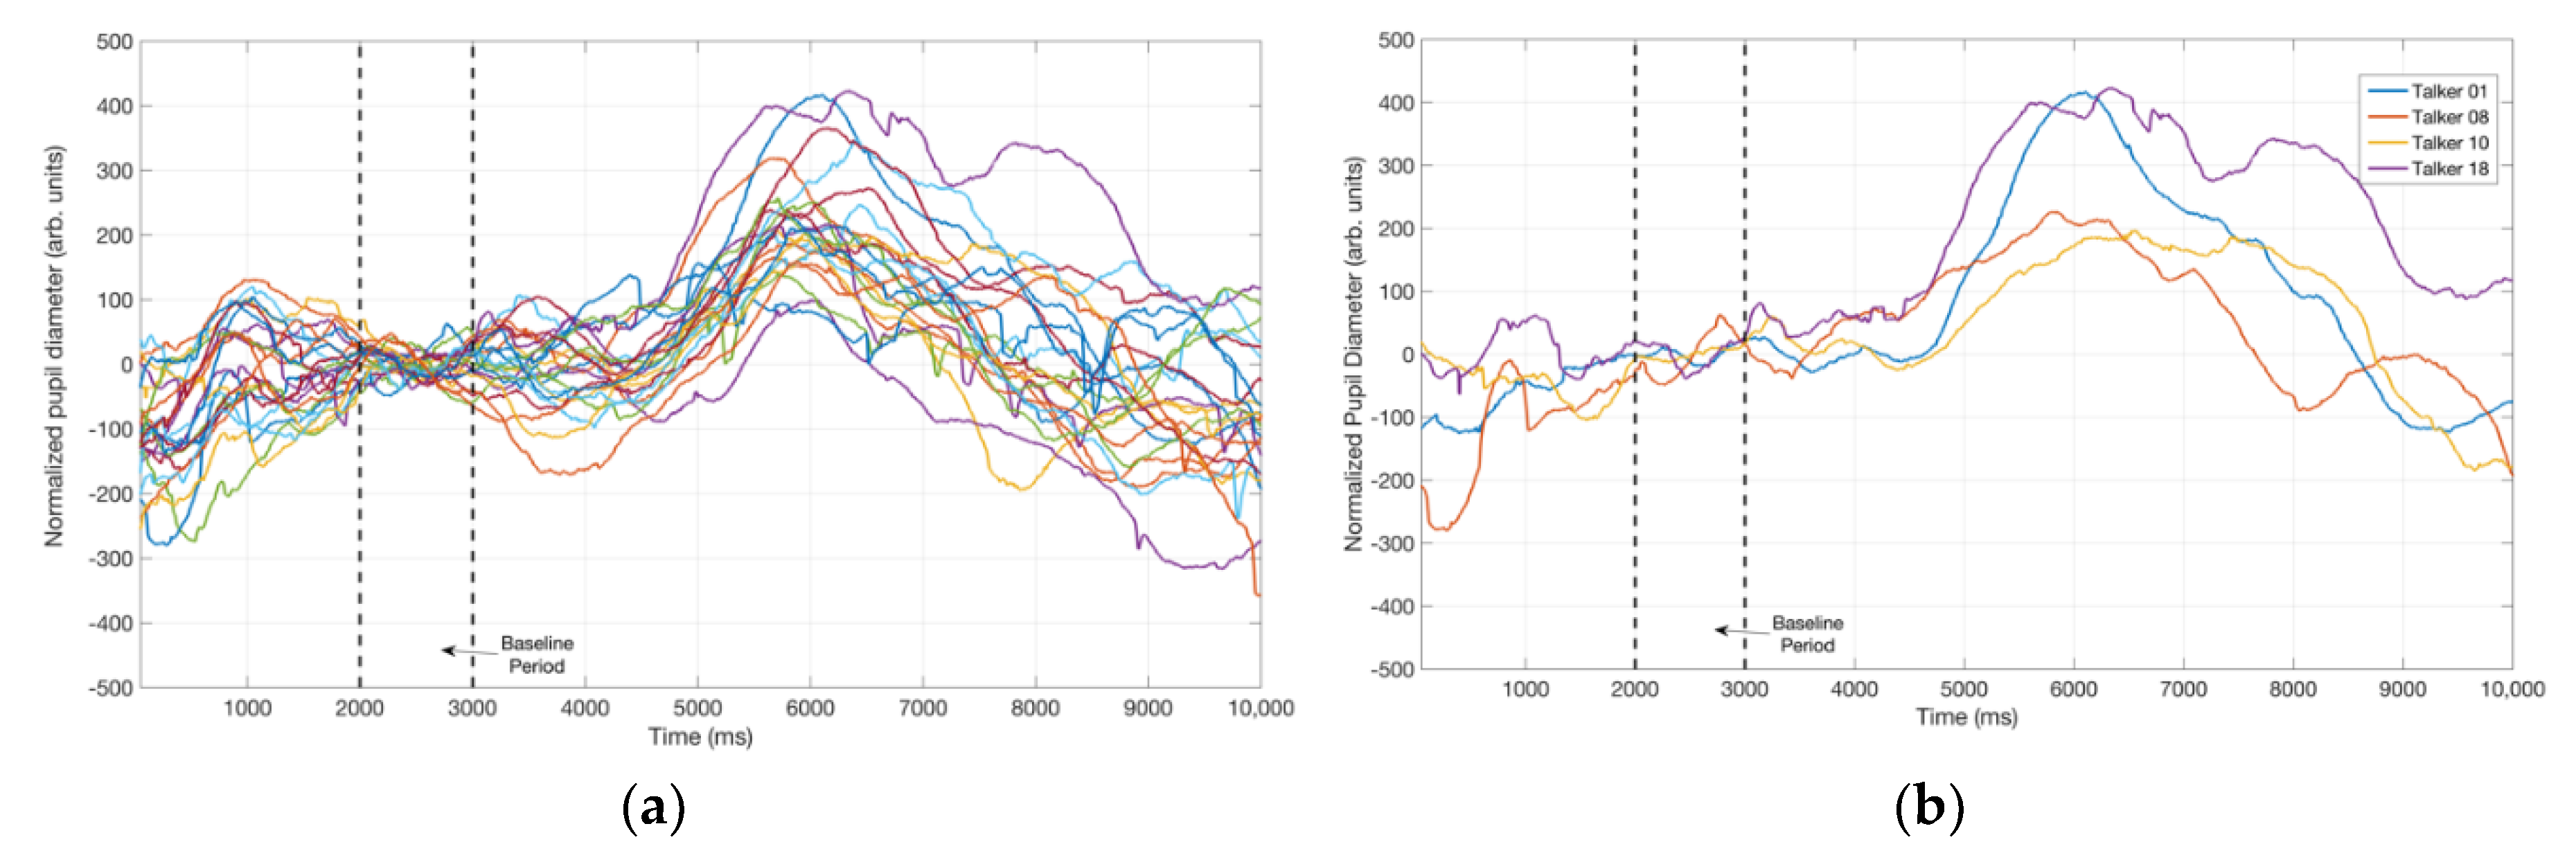
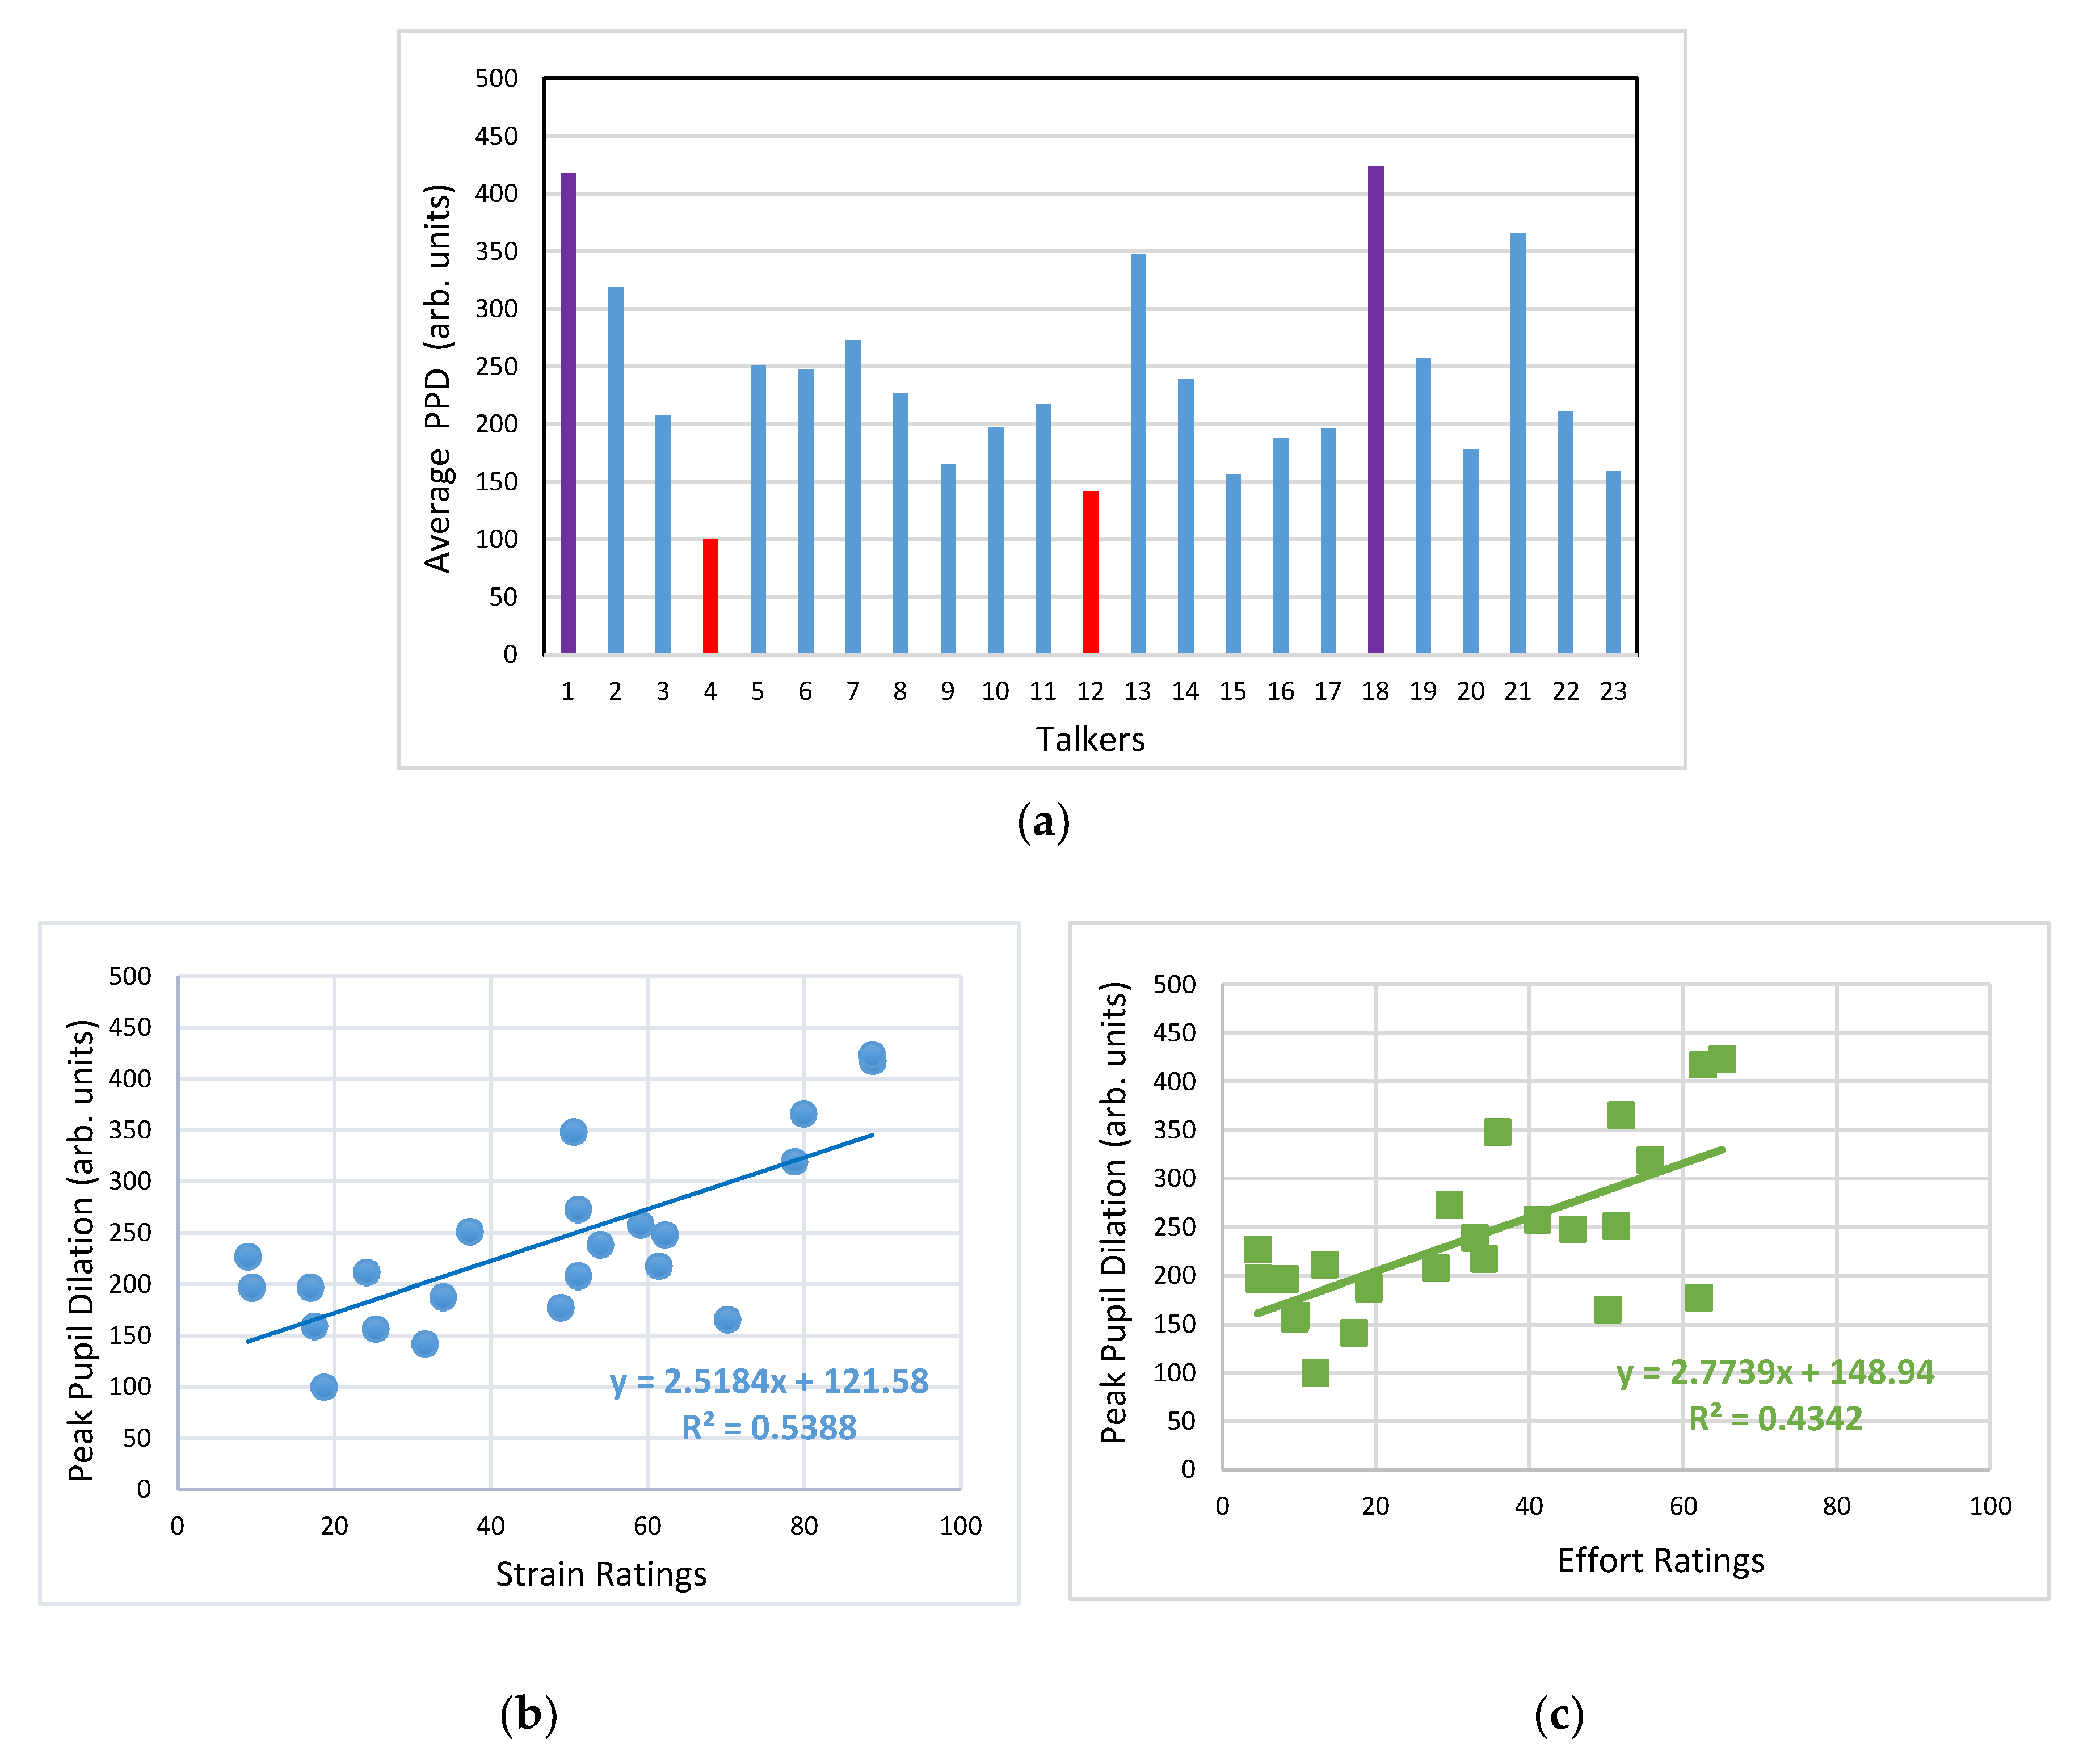
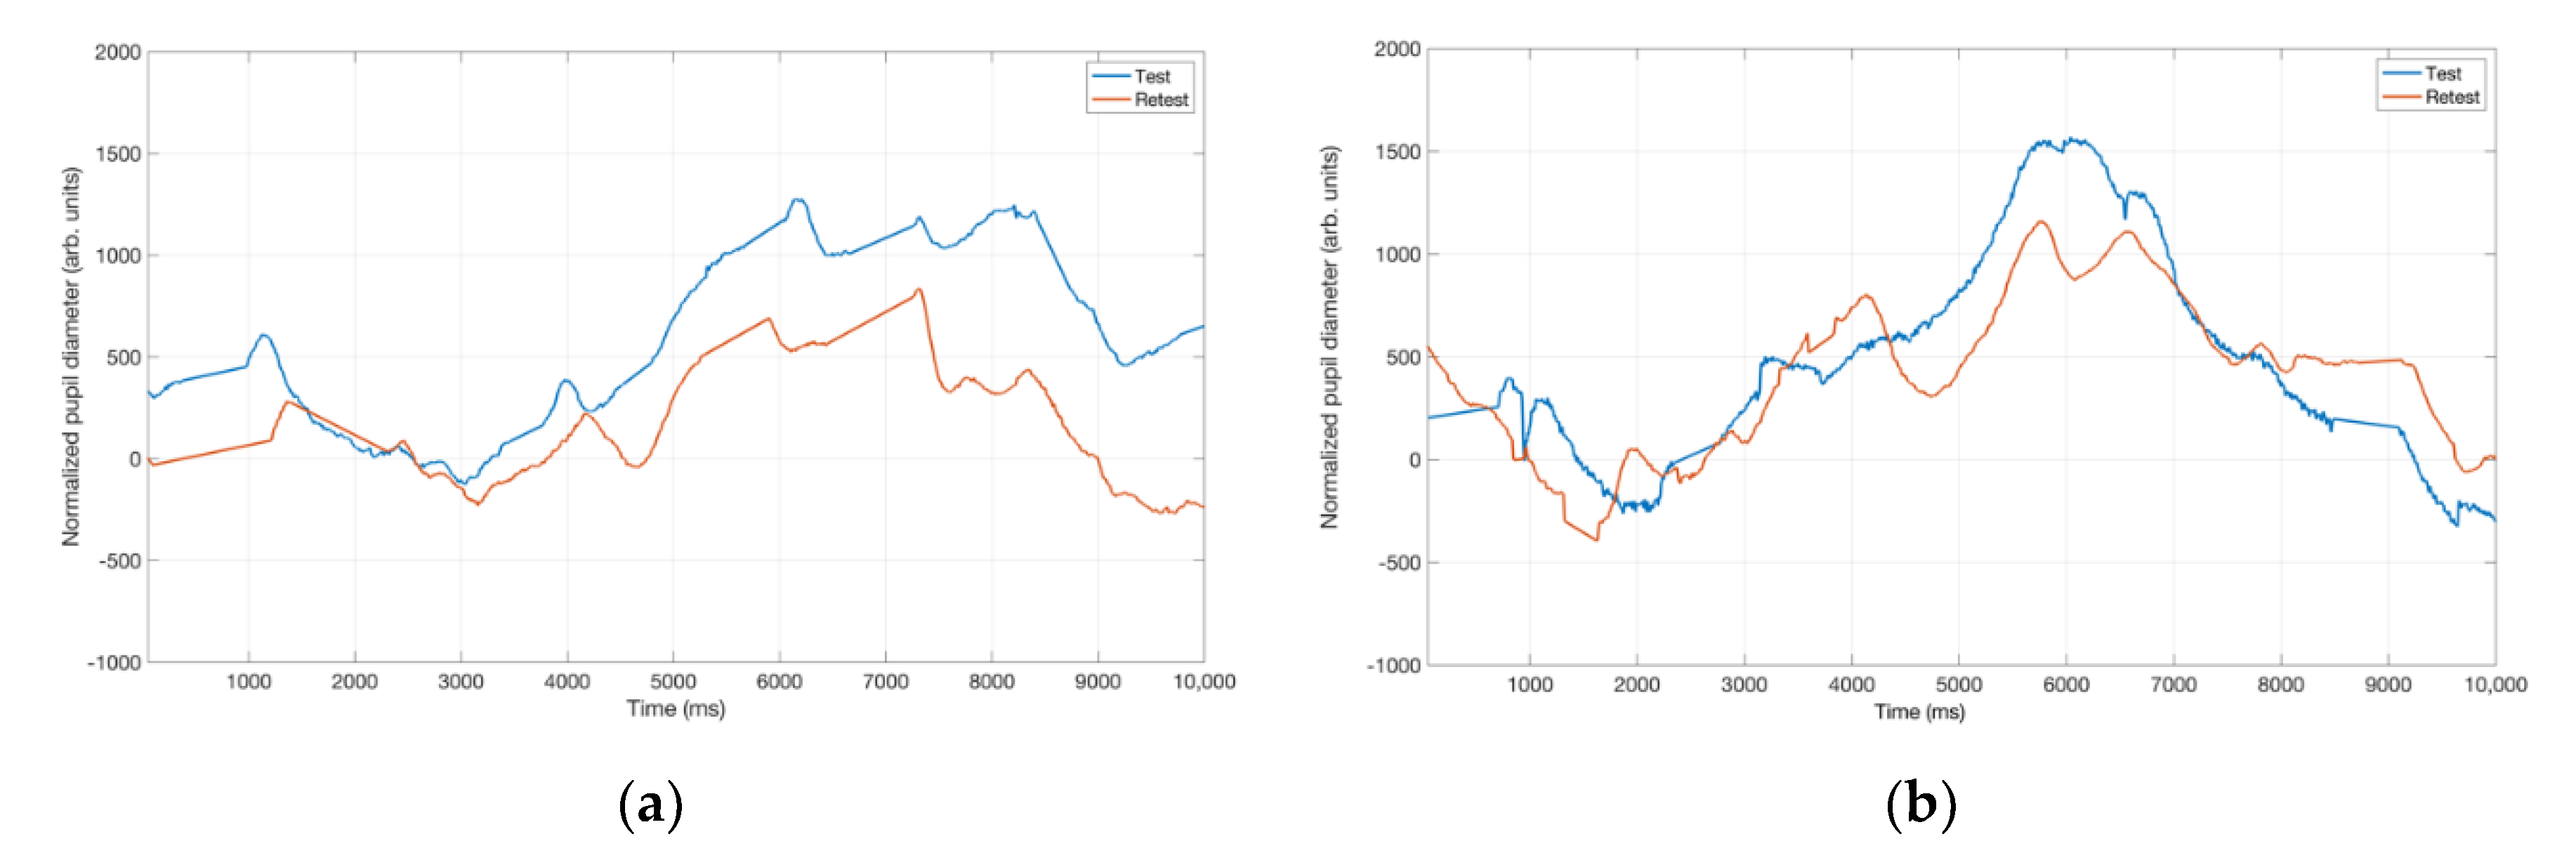
3.2. Pupillometry Data

In this study, pupil size was parameterized by the pupil diameter estimates returned by the eye tracker. Raw pupil diameter data were recorded throughout the experiment and had to be processed in several steps before final visualization and analysis. The recorded time stamps for all stimuli were normalized first so that the starting point of each sentence was at 0 s. Given the nature of the experiment, eye blinks, or changes due to factors other than the listening task, were potential confounds that needed to be identified. Pupil tracks with shorter duration than the playback stimulus were discarded, as they signify loss of synchronous pupil data. Quick blinks (<125 milliseconds) were identified, removed, and interpolated (linear interpolation began roughly 50 ms before the blink and end at least 150 ms after the blink) without changing the overall pattern of the tracking sequence. Finally, the tracks were smoothed by a 11-point moving average filter. This pre-processing of pupil tracks resulted in the exclusion of approximately 13% of the tracks due to dropouts, too many variations, or long blinks. This process was required to eliminate the risk of data distortion.
The validated and pre-processed pupil diameter tracks associated with each talker stimulus were averaged across all listeners and the test–retest sessions. These averaged pupil responses are plotted in Figure 3 and Figure 4 to provide a visual representation of the time course of pupil dilation during the presentation of the talker stimuli. Figure 3a depicts the speech waveform of the Talker 1 stimulus presented to all listeners, while 3b displays the averaged pupil track elicited while listening to this stimulus. The shaded region in Figure 3b represents the 95% confidence interval in the pupil track. As described earlier, the first three seconds of the waveform included the auditory prompt, and the last second of this prompt was designated as the baseline period. Prior to averaging, all listeners’ individual pupil tracks were normalized by subtracting the track mean during the baseline period from pupil values at each time point.
In the current study, we focused on the peak pupil dilation (PPD) as a dependent measure. From each baseline-normalized average pupil track, the PPD was determined as the maximum pupil diamter during the presentation time of the talker speech sample following the baseline period. It can be observed from Figure 3b that the PPD for Talker 1 speech sample is located at a latency of approximately 3000 ms from the end of the baseline period (i.e., the playback of the Talker 1 stimulus).
Figure 4a displays the averaged pupil tracks for all talkers’ post-baseline normalization. Salient features from Figure 4a include the differences in the temporal pattern of the pupil tracks and the PPD value for different talker stimuli, and the location of PPD between 2000 and 3500 ms after the initiation of the talker stimulus. To further illustrate how talkers who induced high and low PPD results appear relative to each other, the pupil tracks of 4 talkers were isolated and plotted separately in Figure 4b. Two of the tracks in Figure 4b were elicited while listening to talker stimuli that were judged to exhibit the highest vocal strain and required the most listening effort (Talkers 1 and 18). The other two tracks belonged to talkers who were rated as least strained and required least listening effort (Talkers 8 and 10). It is evident that talker speech samples that resulted in highest strain/effort ratings also resulted in the highest PPD values.
Figure 5a displays the PPD values extracted from each of the averaged pupil tracks shown in Figure 4a, which once again highlights the talker-dependent distribution of PPD values. To understand the relationship between the auditory-perceptual rating data and the PPD values, the scatter plots between the PPD and the strain and listening effort ratings are depicted in Figure 5b,c, respectively. A trend for greater pupil dilation when listening to talker samples with higher perceived levels of strain and listening effort is evident in these scatter plots. Statistically significant positive Pearson correlation coefficients of 0.73 and 0.66 (both p < 0.001) were found between the strain ratings and PPD values, and between the listening effort ratings and PPD values, respectively. Linear regression fits explained 54% and 43% of the variability in the averaged strain ratings vs. averaged PPD values, and the averaged listening effort ratings vs. averaged PPD data, respectively.
However, regression analyses between the auditory-perceptual ratings and PPD data at the individual listener level did not reveal similar results. The slopes of the regression lines fit to the individaul strain vs. PPD and listening effort vs. PPD data were not statistically different from zero for all listeners. Plausible reasons for this lack of significance include: (a) greater variability in the PPD data than the auditory-perceptual data for each individual listener and (b) missing PPD data associated with some talkers (due to discarding of invalid pupil tracks) for some listeners, further contributing to the PPD data variability. Therefore, the relationship between auditory-perceptual ratings and the pupil dilation was only evident at a group level, and not at the individual listener level.

4. Discussion

This study investigated auditory-perceptual and pupillometric evaluation of speech samples produced by talkers with AdSD. This involved ratings of the perceived degree of vocal strain exhibited by AdSD talkers and the perceived listening effort by naïve, normal hearing listeners. In addition, listeners’ pupillary responses while listening to the AdSD speech samples were collected and analyzed. The AdSD speech samples utilized in this study varied widely in severity in order to capture potentially differential responses to the stimuli by listeners. Salient results from this study are discussed below.

4.1. Listener Ratings of Strain and Effort

Twenty normal hearing listeners rated speech samples from 23 AdSD talkers on a scale of 1–100 for two auditory-percetual dimensions: vocal strain and listening effort. Reliability analyses of the rating data revealed: (a) moderate to strong intra-rater reliability, with test-retest ratings correlations ranging from 0.56 to 0.96 for strain and 0.58 to 0.97 for listening effort and (b) excellent interrater reliability, with Cronbach’s α of 0.98 and 0.97 for strain and listening effort, respectively. These reliability results are consistent with previous studies by Nagle and Eadie [14,16] investigating the relationship between voice quality attributes and listening effort, albeit with a different voice disorder population (i.e., tracheoesophageal and electrolarynx voices, respectively).
Data from auditory-perceptual evaluation of samples revealed that the talkers exhibited various degrees of vocal strain. For example, some of the speech stimuli were rated as less strained (e.g., Talkers 4, 8, 10, and 15) compared to others who were consistently judged as exhibiting increased levels of strain (e.g., Talkers 1, 2, 9, 18, and 21). More importantly, the auditory-perceptual data demonstrated that the higher the ratings for strain, the more listening effort was expended. For instance, Talkers 8 and 10 were rated the lowest in terms of strain and were also judged to require the lowest degree of listening effort; in contrast, Talkers 1 and 18 were judged as the most strained and were evaluated as requiring the most listening effort. Across the 23 speech stimuli, the averaged vocal strain and listening effort ratings exhibited a significantly high positive correlation (r = 0.90). To the best of our knowledge, no study to date has evaluated perceived listening effort in the context of talkers with AdSD and our results confirm increased listening effort is required as AdSD severity increases. Furthermore, given that the speech stimuli used in this study were highly intelligible, these results are consistent with previous findings suggesting that the challenges faced by listeners are beyond those related to audibility [13] or intelligibility [21]. Such perceptual challenges increase when more cognitive effort is expended to channel attention and concentration in order to achieve a listening goal. This is particularly important when the quality of an auditory signal is distanced from optimal [13], as is the case with speech samples from talkers with greater AdSD severity.
As shown in Figure 2a, out of the 23 AdSD talkers evaluated, 21 were judged to have a higher strain rating relative to the listening effort, a finding that was not unexpected. Interestingly, results revealed that listeners rated stimuli from Talkers 5 and 20 to have higher ratings for listening effort relative to the strain ratings (see Figure 2b). Investigations into the speech samples from these talkers divulged that their voices are more characterized by increased breathiness, rather than strain. Thus, the auditory-perceptual ratings for these two Talkers (5 and 20) confirm that listeners were in fact attending to the rating task, and rated the listening effort dimension holistically. These stimuli were not perceived to be highly strained but they still deviated from normal, which subsequently required increased listening effort.

4.2. Pupil Dialation in Response to Vocal Samples

The other aim of this study was to examine the relationship between the pupil dilation in response to listening to AdSD speech samples and the perceived listening effort. To our knowledge, this is the first study to empirically evaluate pupil responses and the amount of effort expended while listening to disordered speech samples in general, and AdSD speech samples in particular. The goal herein was to explore the variability in processing effort as indicated by the peak pupil dilation (PPD). Pupil size is reported to be impacted by cognitive load and more specifically, language processing tasks such as hearing and reading words [12,17,22] or sentences [17,23]. The present aim was to determine whether a sample with increased strain would be associated with an increased PPD with respect to baseline, which would be consistent with increases in the amount of cognitive resources utilized by a listener in a speech reception task [24]. Processing demand is reported to be imposed by either stimulus factors such as linguistic complexity or noise, or as addressed in our study, the quality of the voice sample being assessed. Additionally, it is possible that listener factors such as the capacity of working memory or hearing impairment will influence both perceptual ratings and PPD. Thus, consideration of both speaker and listener factors is essential as they are reported to influence processing demands [25,26].
The averaged pupil track profiles shown in Figure 3 and Figure 4 are consistent with previous studies investigating the relationship between pupillometry and speech perception in noisy environments [27]. A closer assessment of the pupillary data revealed that stimuli from two talkers (1 and 18), that received the highest perceptual ratings for strain and listening effort, also elicited the highest averaged PPDs. Stimuli from talkers rated lower on strain and effort elicited smaller PPDs. Our results revealed a strong, positive correlation between strain and PPD (0.73), and between effort and PPD (0.66) when averaged across all listeners. Given this positive correlation and the dependence of vocal strain on the presence of AdSD spasms and/or momentary aphonic breaks, the averaged pupillary responses can be deemed to have been evoked in response to the unique quality of the AdSD speech stimuli. The present findings are consistent with those reported by Kramer et al. [12,16,28] and Zekveld et al. [12,17,29] who examined listening effort through pupillometry and reported larger mean PPD for their normal hearing listeners in low intelligibility than high intelligibility conditions, ascribing larger mental effort to such challenging listening conditions.
All participants were tested with all voices in random order, and then tested with all voices again, in a different order. Both subjective and pupillometric responses compared across test and retest. The test-retest correlation coefficients were generally high for the auditory-perceptual ratings. For the test-retest pupil dilation comparision, data from Talker 1 (who was one of the talkers with the highest level of strain and for whom listeners exhibited a high PPD value) was examined more closely in various test-retest presentation orders for a few listeners. These presentation orders included position order seventh (in the test) and position order 22nd (in the re-test) (Figure 6a) and presentation order 21st (test) and 11th (re-test) (Figure 6b). In all these instances, the first presentation elicited greater PPD than did the second presentation of the same stimulus.
The decrease in PPD values may be due to the fact that listeners have already habituated to the stimulus or it may be the consequence of fatigue/boredom. It is known that pupil dilation is influenced by the emotional valence, which represents the attractiveness (positive affect) or aversiveness (negative affect) to an auditory stimulus [30]. Evidence exists for increased pupil dilation when listening to auditory stimuli with negative affective connotations [30,31]. As such, emotional valence may be a contributing factor to our pupil data, especially for our naïve listeners who are exposed to abnormal voice samples for the first time and perceived them to be aversive. The fact that the PPD, albeit pronounced, is reduced in magnitude on the second presentation of the Talker #1 stimulus, perhaps suggests that repeated exposure may reduce the negative emotional valence. We acknowledge that this explanation is speculative, but it is in line with previous studies that report habituation secondary to repetition and exposure [32,33]. Furthermore, this explanation is consistent with findings from Raman et al. [34] who reported that listening effort ratings from listeners who are familiar and exposed to abnormal voice samples (in their case, that of esophageal voices) are significantly lower when compared to similar ratings from naïve listeners. Given the speculative nature, further research is warranted to understand the relative contribution of cognitive load and emotional valence to pupillary responses when listening to disordered voice and speech samples.
To summarize, our data on AdSD samples support the notion that when confronted with stimuli characterized by an abnormal vocal quality, listeners, on average, demonstrate a physiologic response that corresponds to their auditory-perceptual assessments. These findings provide valuable insights into the demands of effective verbal communication in general, and the challenges that may occur in the presence of disordered speech or an abnormal vocal quality specifically.
While the present data offer valuable insights on various aspects of auditory-perceptual evaluation of voice quality, there are some limitations which deserve mention. It is pertinent to note that none of the talker samples used in the present study were characterized by reduced intelligibility, rather, the speech samples were different in the consistency and flow of speech production. Therefore, future research might seek to investigate the relationship between auditory-perceptual features and pupil dilation when listeners are asked to make auditory-perceptual judgments of unique sentence stimuli that simultaneously requires comprehension (i.e., intelligibility) of such sentences which are characterized by different degrees of AdSD severity. Furthermore, our study only assessed ratings of strain and listening effort in relation to pupillary responses from naïve normal hearing listeners. Having experienced listeners and gathering their physiological responses along with subjective auditory-perceptual ratings can be complementary. In fact, it would be interesting to observe what the PPDs of experienced listeners who have ample exposure to disordered voices through their profession. Our listeners also rated talker stimuli based on their individual internal standards. While excellent reliability was documented in our study, it would be valuable to determine if adding perceptual anchors might influence the ratings and concurrent PPD values. In addition, no acoustic measures were performed on our AdSD audio samples. Future studies which are designed to evaluate potential correlations between acoustic measures of dysphonic speech, auditory-perceptual ratings and pupillometry would be a valuable area for future study. Finally, the temporal gap between test-retest was relatively short (10–15 min). Future studies might seek to assess longer gaps between test-retest to identify whether the exposure to the stimuli would fade away and PPD would be altered within the context of an increased break.

5. Conclusions

This study addressed auditory-perceptual evaluation of features of voice quality in relation to pupil dilation. The present data offer important observations and provide valuable insights into how naïve listeners rate voice quality (more specifically vocal strain) along with their simultaneous evaluation of listening effort. First, listeners consistently assigned greater listening effort to voice samples that were judged to exhibit more strain. Second, because listening effort may include multiple perceptual factors, i.e., a disordered voice might be rated relatively lower on strain but higher on listening effort due to the overall, composite quality of the voice. Given the nature of voice quality deviation in those diagnosed with AdSD, this finding was not unwarranted. Third, like previous studies, intelligible voices were rated as demanding variously increased degrees of listening effort which confirms the fact that listening effort goes beyond simply understanding what is being said. Fourth, the stimuli which were subjectively rated by listeners as being more strained, were also generally observed to provoke an increase in PPD. This finding suggests a potential relationship of the listening task to aspects of cognitive load and listening effort. It is, however, important to acknowledge that this load was observed at a group level and was also found to decrease with exposure and habituation over the course of the experiment.

Author Contributions

Conceptualization, M.F., V.P., and P.C.D.; methodology, M.F., V.P., and P.C.D.; software, V.P., B.H., and M.K.; validation, M.F. and V.P.; formal analysis, M.F and V.P.; resources, V.P., P.C.D., and I.J.; data curation, M.F. and V.P.; writing—original draft preparation, M.F.; writing—review and editing, V.P., B.H., M.K., P.C.D., and I.J.; supervision, V.P., P.C.D., and I.J.; project administration, M.F. and V.P. All authors have read and agreed to the published version of the manuscript.

Funding

This study was supported by the graduate scholarship to M. Farahani from the Faculty of Health Sciences at Western University. B.H. was supported by a BrainsCAN Tier I postdoctoral fellowship (Canada First Research Excellence Fund; CFREF) and by the Canada Research Chair program.

Acknowledgments

We thank Andrew Johnson from the Faculty of Health Sciences at the University of Western Ontario for his help on the linear mixed-effects modeling. The authors would like to express gratitude to all the participants who took part in this study.

Conflicts of Interest

The authors declare no conflict of interest.

References

  1. The Use of Voice Therapy in the Treatment of Dysphonia. Available online: https://www.asha.org/policy/tr2005-00158/ (accessed on 17 January 2020).
  2. Yeung, J.C.; Fung, K.; Davis, E.; Rai, S.K.; Day, A.M.; Dzioba, A.; Bornbaum, C.; Doyle, P.C. Longitudinal variations of laryngeal overpressure and voice-related quality of life in spasmodic dysphonia. Laryngoscope 2015, 125, 661–666. [Google Scholar] [CrossRef] [PubMed]
  3. Cannito, M.P.; Doiuchi, M.; Murry, T.; Woodson, G.E. Perceptual structure of adductor spasmodic dysphonia and its acoustic correlates. J. Voice 2012, 26, 818.e5–818.e13. [Google Scholar] [CrossRef]
  4. Cannito, M.P.; Burch, A.R.; Watts, C.; Rappold, P.W.; Hood, S.B.; Sherrard, K. Disfluency in spasmodic dysphonia: A multivariate analysis. J. Speech Lang. Hear. Res. 1997, 40, 627–641. [Google Scholar] [CrossRef]
  5. Eadie, T.L.; Nicolici, C.; Baylor, C.; Almand, K.; Waugh, P.; Maronian, N. Effect of experience on judgments of adductor spasmodic dysphonia. Ann. Otol. Rhinol. Laryngol. 2007, 116, 695–701. [Google Scholar] [CrossRef] [PubMed]
  6. Isetti, D.; Xuereb, L.; Eadie, T.L. Inferring speaker attributes in adductor spasmodic dysphonia: Ratings from unfamiliar listeners. Am. J. Speech Lang. Pathol. 2014, 23, 134–145. [Google Scholar] [CrossRef] [PubMed]
  7. Ludlow, C.L.; Naunton, R.F.; Terada, S.; Anderson, B.J. Successful treatment of selected cases of abductor spasmodic dysphonia using botulinum toxin injection. Otolaryngol. Head Neck Surg. 1991, 104, 849–855. [Google Scholar] [CrossRef]
  8. Kreiman, J.; Gerratt, B.R.; Kempster, G.B.; Erman, A.; Berke, G.S. Perceptual evaluation of voice quality: Review, tutorial, and a framework for future research. J. Speech Lang. Hear. Res. 1993, 36, 21–40. [Google Scholar] [CrossRef]
  9. Johnsrude, I.S.; Rodd, J.M. Factors that increase processing demands when listening to speech. In Neurobiology of Language; Academic Press: Cambridge, MA, USA, 2016; pp. 491–502. [Google Scholar]
  10. Doyle, P.C. Documenting voice and speech outcomes in alaryngeal speakers. In Clinical Care and Rehabilitation in Head and Neck Cancer; Doyle, P.C., Ed.; Springer: New York, NY, USA, 2019; pp. 281–297. [Google Scholar]
  11. Lindblom, B. On the communication process: Speaker-listener interaction and the development of speech. Augment. Altern. Commun. 1990, 6, 220–230. [Google Scholar] [CrossRef]
  12. Kramer, S.E.; Lorens, A.; Coninx, F.; Zekveld, A.A.; Piotrowska, A.; Skarzynski, H. Processing load during listening: The influence of task characteristics on the pupil response. Lang. Cogn. Proc. 2013, 28, 426–442. [Google Scholar] [CrossRef]
  13. Pichora-Fuller, M.K.; Kramer, S.E.; Eckert, M.A.; Edwards, B.; Hornsby, B.W.; Humes, L.E.; Lemke, U.; Lunner, T.; Matthen, M.; Mackersie, C.L.; et al. Hearing impairment and cognitive energy: The framework for understanding effortful listening (FUEL). Ear Hear. 2016, 37, 5S–27S. [Google Scholar] [CrossRef]
  14. Nagle, K.F.; Eadie, T.L. Listener effort for highly intelligible tracheoesophageal speech. J. Commun. Disord. 2012, 45, 235–245. [Google Scholar] [CrossRef] [PubMed] [Green Version]
  15. Imhof, M.; Välikoski, T.R.; Laukkanen, A.M.; Orlob, K. Cognition and interpersonal communication: The effect of voice quality on information processing and person perception. Stud. Commun. Sci. 2014, 14, 37–44. [Google Scholar] [CrossRef]
  16. Nagle, K.F.; Eadie, T.L. Perceived listener effort as an outcome measure for disordered speech. J. Commun. Disord. 2018, 73, 34–49. [Google Scholar] [CrossRef] [PubMed]
  17. Zekveld, A.A.; Koelewijn, T.; Kramer, S.E. The pupil dilation response to auditory stimuli: Current state of knowledge. Trends Hear. 2018, 22. [Google Scholar] [CrossRef]
  18. Kahneman, D. Attention and Effort; Prentice-Hall: Englewood Cliffs, NJ, USA, 1973. [Google Scholar]
  19. Fairbanks, G. The rainbow passage. In Voice and Articulation Drillbook, 2nd ed.; Harper & Row: New York, NY, USA, 1960. [Google Scholar]
  20. Winn, M.B.; Wendt, D.; Koelewijn, T.; Kuchinsky, S.E. Best practices and advice for using pupillometry to measure listening effort: An introduction for those who want to get started. Trends Hear. 2018, 22. [Google Scholar] [CrossRef]
  21. Whitehill, T.L.; Wong, C.C. Contributing factors to listening effort for dysarthric speech. J. Med. Speech Lang. Pathol. 2006, 14, 335–342. [Google Scholar]
  22. Brown, G.G.; Kindermann, S.S.; Siegle, G.J.; Granholm, E.; Wong, E.C.; Buxton, R.B. Brain activation and pupil response during covert performance of the Stroop Color Word task. J. Int. Neuropsychol. Soc. 1999, 5, 308–319. [Google Scholar] [CrossRef]
  23. Hyönä, J.; Tommola, J.; Alaja, A.M. Pupil dilation as a measure of processing load in simultaneous interpretation and other language tasks. Q. J. Exp. Psychol. 1995, 48, 598–612. [Google Scholar] [CrossRef]
  24. Wendt, D.; Dau, T.; Hjortkjær, J. Impact of background noise and sentence complexity on processing demands during sentence comprehension. Front. Psychol. 2016, 7, 345. [Google Scholar] [CrossRef] [Green Version]
  25. Pichora-Fuller, M.K.; Singh, G. Effects of age on auditory and cognitive processing: Implications for hearing aid fitting and audiologic rehabilitation. Trends Amplif. 2006, 10, 29–59. [Google Scholar] [CrossRef]
  26. Rabbitt, P.M. Channel-capacity, intelligibility and immediate memory. Q. J. Exp. Psychol. 1968, 20, 241–248. [Google Scholar] [CrossRef] [PubMed]
  27. Zekveld, A.A.; Kramer, S.E.; Festen, J.M. Pupil response as an indication of effortful listening: The influence of sentence intelligibility. Ear Hear. 2010, 31, 480–490. [Google Scholar] [CrossRef] [PubMed]
  28. Kramer, S.E.; Kapteyn, T.S.; Festen, J.M.; Kuik, D.J. Assessing aspects of auditory handicap by means of pupil dilation. Audiology 1997, 36, 155–164. [Google Scholar] [CrossRef]
  29. Antonenko, P.; Paas, F.; Grabner, R.; Van Gog, T. Using electroencephalography to measure cognitive load. Educ. Psychol. Rev. 2010, 22, 425–438. [Google Scholar] [CrossRef]
  30. Francis, A.L.; Love, J. Listening effort: Are we measuring cognition or affect, or both? Wires Cogn. Sci. 2020, 11, e1514. [Google Scholar] [CrossRef] [PubMed]
  31. Damsma, A.; van Rijn, H. Pupillary response indexes the metrical hierarchy of unattended rhythmic violations. Brain Cogn. 2017, 111, 95–103. [Google Scholar] [CrossRef]
  32. Marois, A.; Labonté, K.; Parent, M.; Vachon, F. Eyes have ears: Indexing the orienting response to sound using pupillometry. Int. J. Psychophysiol. 2018, 123, 152–162. [Google Scholar] [CrossRef]
  33. Dahlman, J.; Sjörs, A.; Lindström, J.; Ledin, T.; Falkmer, T. Performance and autonomic responses during motion sickness. Hum. Factors 2009, 51, 56–66. [Google Scholar] [CrossRef]
  34. Raman, S.; Serrano, L.; Winneke, A.; Navas, E.; Hernaez, I. Intelligibility and listening effort of Spanish oesophageal speech. Appl. Sci. 2019, 9, 3233. [Google Scholar] [CrossRef] [Green Version]
Figure 1. (a) Screenshot of the user interface for assessing the “strain” and “listening effort” using visual analog sliders. The label of the “Start!” button was changed to “Next” once the first stimulus was played back. (b) Participant positioned on the EyeLink 1000 tower in front of the monitor displaying the ratings screen set-up. (c) A secondary display showing the EyeLink 1000 tracker parameters and pupil image, which was monitored by the experimenter to ensure proper data collection during the experiment.
Applsci 10 05907 g001
Figure 2. (a) Strain and listening effort ratings for each talker, averaged across all listeners and the test-retest sessions. Error bars indicate the standard error of the mean. (b) Scatter plot of the strain and listening effort rating data (averaged across listeners), along with the linear regression fit. The red and green color dots highlight data from talkers where the listening effort ratings were greater than the strain ratings.
Applsci 10 05907 g002
Figure 3. (a) Waveform associated with the Talker #1 stimulus. The first three seconds comprise the auditory prompt “please listen to the following stimulus”, while the following segment is the sentence “the rainbow is a division of white light into many beautiful colors” spoken by Talker #1. (b) The time course of the pupil diameter in response to the above stimulus, averaged across listeners and test sessions after baseline normalization. The shaded region represents the 95% confidence interval around the averaged pupil track. Note that the pupil diameter is in arbitrary units set by the EyeLink 1000 system.
Applsci 10 05907 g003
Figure 4. (a) Baseline-normalized and averaged pupil tracks associated with all 23 adductor spasmodic dysphonia (AdSD) talker samples. (b) Baseline-normalized and averaged pupil tracks associated with the two highest (1 and 18) and two lowest (8 and 10) rated talkers on the vocal dimension of strain. The difference in peak pupil dilation (PPD) between the highest and lowest rated talkers is noteworthy in this plot.
Applsci 10 05907 g004
Figure 5. (a) Peak pupil dilation (PPD) values extracted from averaged pupil tracks associated with each talker stimulus. Talker samples that resulted in the two highest and lowest PPD values associated are highlighted in purple and red colours, respectively. (b) Scatter plot between the averaged perceptual ratings of strain and the PPD values extracted from averaged pupil tracks, along with the linear regression fit to the data. (c) Scatter plot of PPD values extracted from average pupil tracks with the averaged perceptual ratings of listening effort, along with the linear regression fit to the data.
Applsci 10 05907 g005
Figure 6. (a) Pupil tracks from a participant when listening to Talker 1 stimulus during the test and retest sessions. The Talker 1 stimulus was the 7th during the test session and 22nd during the retest session in terms of the presentation order. (b) Pupil tracks from a different participant when listening to the same Talker 1 stimulus. For this listener, the presentation order for Talker 1 stimulus was 21st and 11th during the test and retest sessions, respectively.
Applsci 10 05907 g006

